The Photorhabdus asymbiotica virulence cassettes deliver protein effectors directly into target eukaryotic cells
- University Hospital of Wales, United Kingdom
- Warwick University, United Kingdom
- Beijing Friendship Hospital, Capital Medical University, China
Figures
Figure 1 with 4 supplements
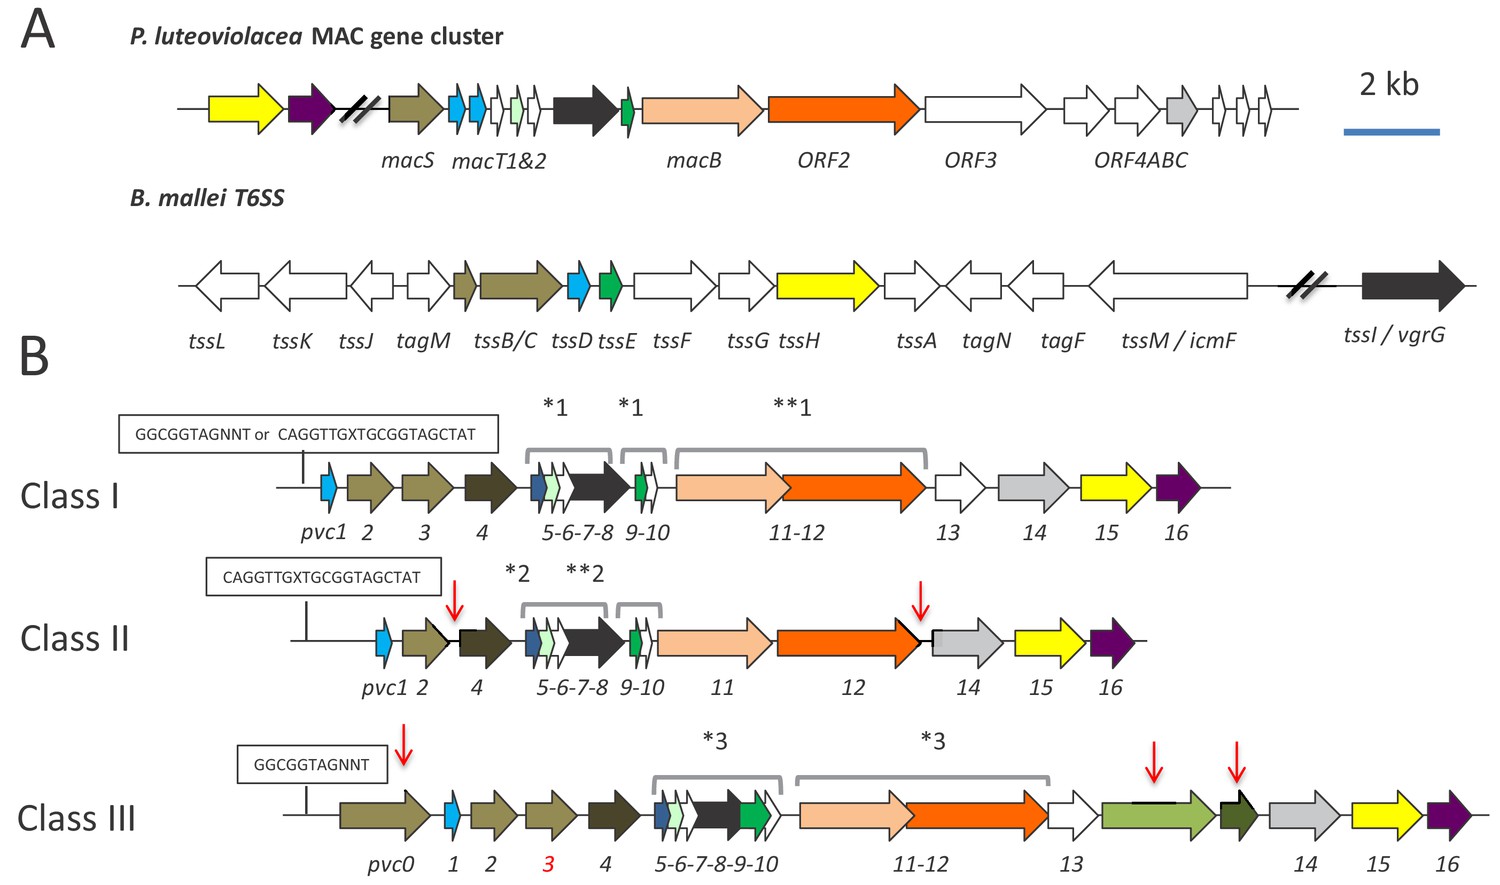
Genetic organisation of PVC operons.
(A) Similarity between PVCs and two diverse protein secretion systems, (i) the P. luteoviolacea mac gene cluster and (ii) The type-VI secretion system (T6SS) from Burkholderia mallei. Homologous protein sequences are coloured coded. (B) Three classes of PVC structural operons observed in the genomes of Photorhabdus and members of other genera. Classes 1–3 are exemplified by PVCpnf, PVClopT and PVCPaTox respectively. Homologous genes are colour coded. Red vertical arrows represent variations relative to the representative class I PVCpnf operon of P. asymbiotica ATCC43949 (genes pvc1-PAU_03353 to pvc16-PAU_03338). Predicted functions of individual Pvc proteins based on homology to known proteins can be seen in Figure 1—figure supplement 1. The boxed ‘GGCGGTAGNNT’ or ‘CAGGTTGXTGCGGTAGCTAT’ sequences represent positions of the conserved RfaH anti-termination protein and cryptic operator sequences respectively. Square brackets above certain genes indicate apparent translational coupling. More specifically; *one indicates coupling in PVCpnf and PVCcif of PlTT01, PaATCC43949, PaPB68 and PaKingscliff and in the Serratia entomophila afp operon in addition to an uncharacterised PVC in Yersinia ruckeri ATCC 29473. **one indicates these genes are not coupled in PaKingscliff. *two indicates coupling in PVClopT of PlTT01, PaATCC43949, PaPB68 and PaKingscliff. **two indicates these genes are not coupled in PaKingscliff. *three indicates coupling in PVCPatox of PaATCC43949and PaKingscliff (although pvc11 possibly contains a frame-shift in PaKingscliff). The pvc3 is also deleted in PaKingscliff.
Figure 1—figure supplement 1
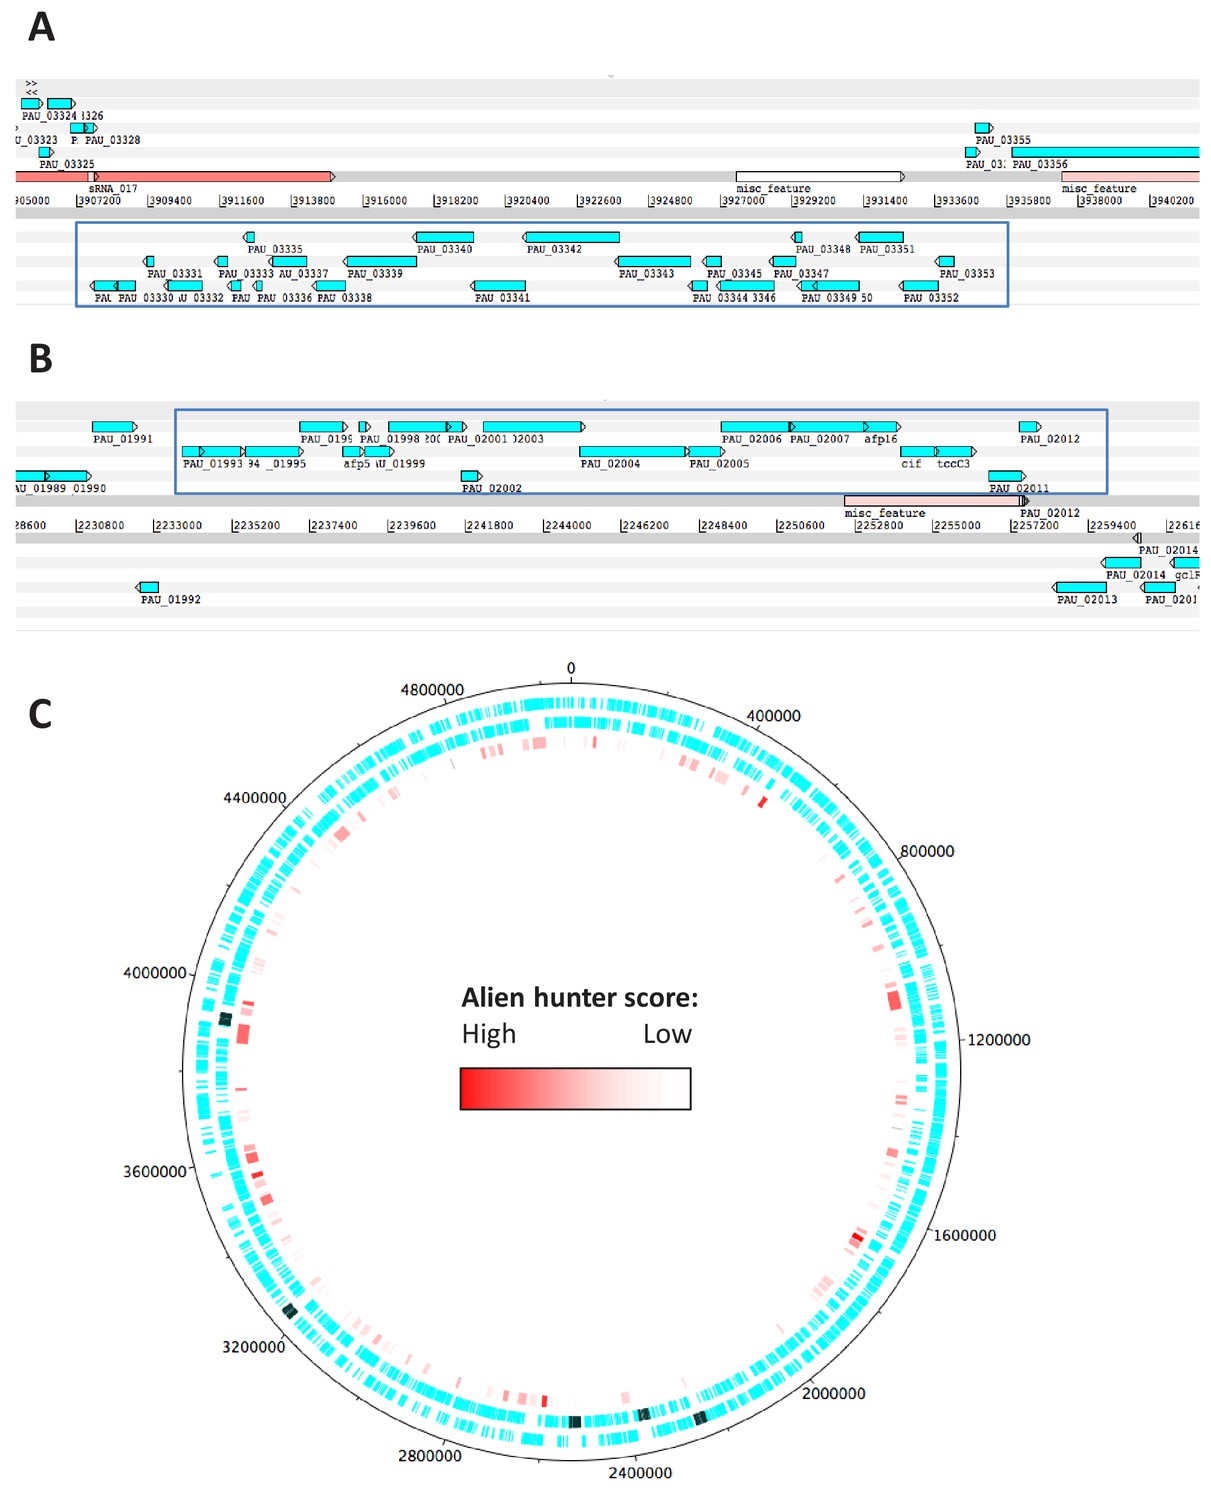
PVC operons in relation to putative regions of horizontal gene transfer as identified by Alien Hunter.
(A) The PVCpnf and (B) the PVCcif operons are highlighted by the blue rectangle. Alien Hunter regions of HGT are designated by the features in tones of red. In red are the regions with the highest score and thus probability for HGT whilst in white are the regions with the lowest scores. (C) The P. asymbiotica ATCC43949 chromosome. The first concentric circle denotes genes on the forward strand while the second circle denotes genes in the reverse strand. Black boxes represent the PVC operons. The third circle shows regions of HGT as identified by Alien Hunter.
Figure 1—figure supplement 2
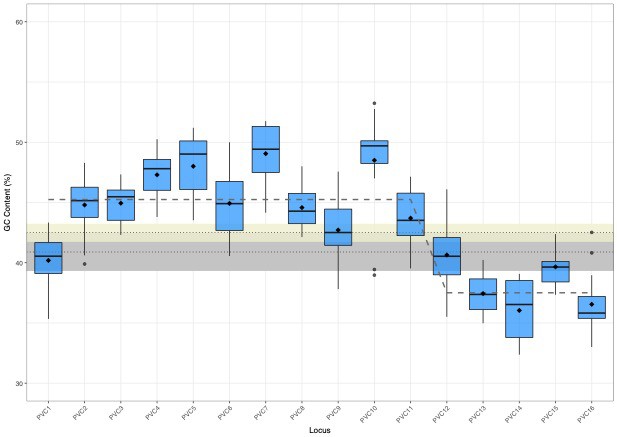
Boxplots of the mean GC content across 16 different pvc operons of Photorhabdus.
The GC was calculated for each of the 16 structural loci (clustered by annotated/predicted function and syntenic position in operon consistent with the nomenclature devised in this paper). GC content itself was calculated via a bespoke script, outputting data to be visualised in RStudio. Data were plotted and the step-function fit (grey dashed line) was calculated using the mean GC value for each locus via the cumSeg package for breakpoint estimation in genomic sequences. Diamonds represent mean locus GC. Beige box shows the source genome mean (dotted line) GC content and standard deviation (upper and lower box bounds). Grey box shows the operon GC mean (dotted line) and standard deviation (upper and lower box bounds).
Figure 1—figure supplement 3
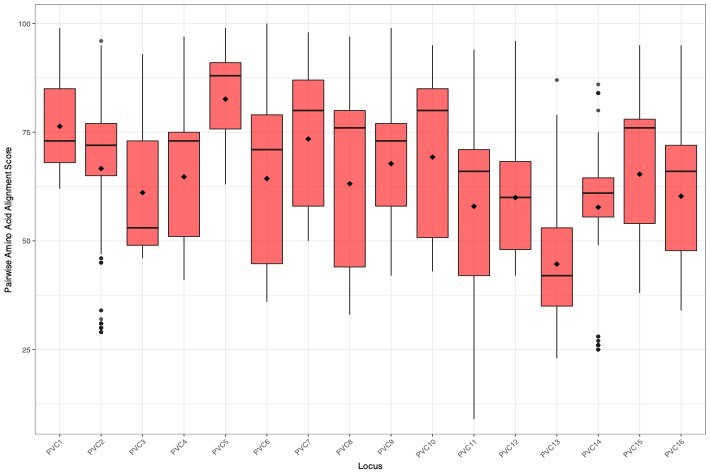
Box plots of amino acid similarity across homologous protein sequences for these same 16 operons.
Amino acid sequences were clustered together as in (A), by annotation and syntenic position. Global Multiple Sequence Alignments were created with CLUSTAL Omega, using the default parameters (Gonnet transition matrix, gap open penalty six bits, gap extend one bit). Pairwise amino acid alignment scores were extracted from the CLUSTALO output and plotted in RStudio via bespoke scripts. Diamonds indicate mean pairwise alignment scores. Dots indicate pairwise values that are outliers, beyond 1.5 X the interquartile range (as automatically calculated by the ggplot2 package).
Figure 1—figure supplement 4
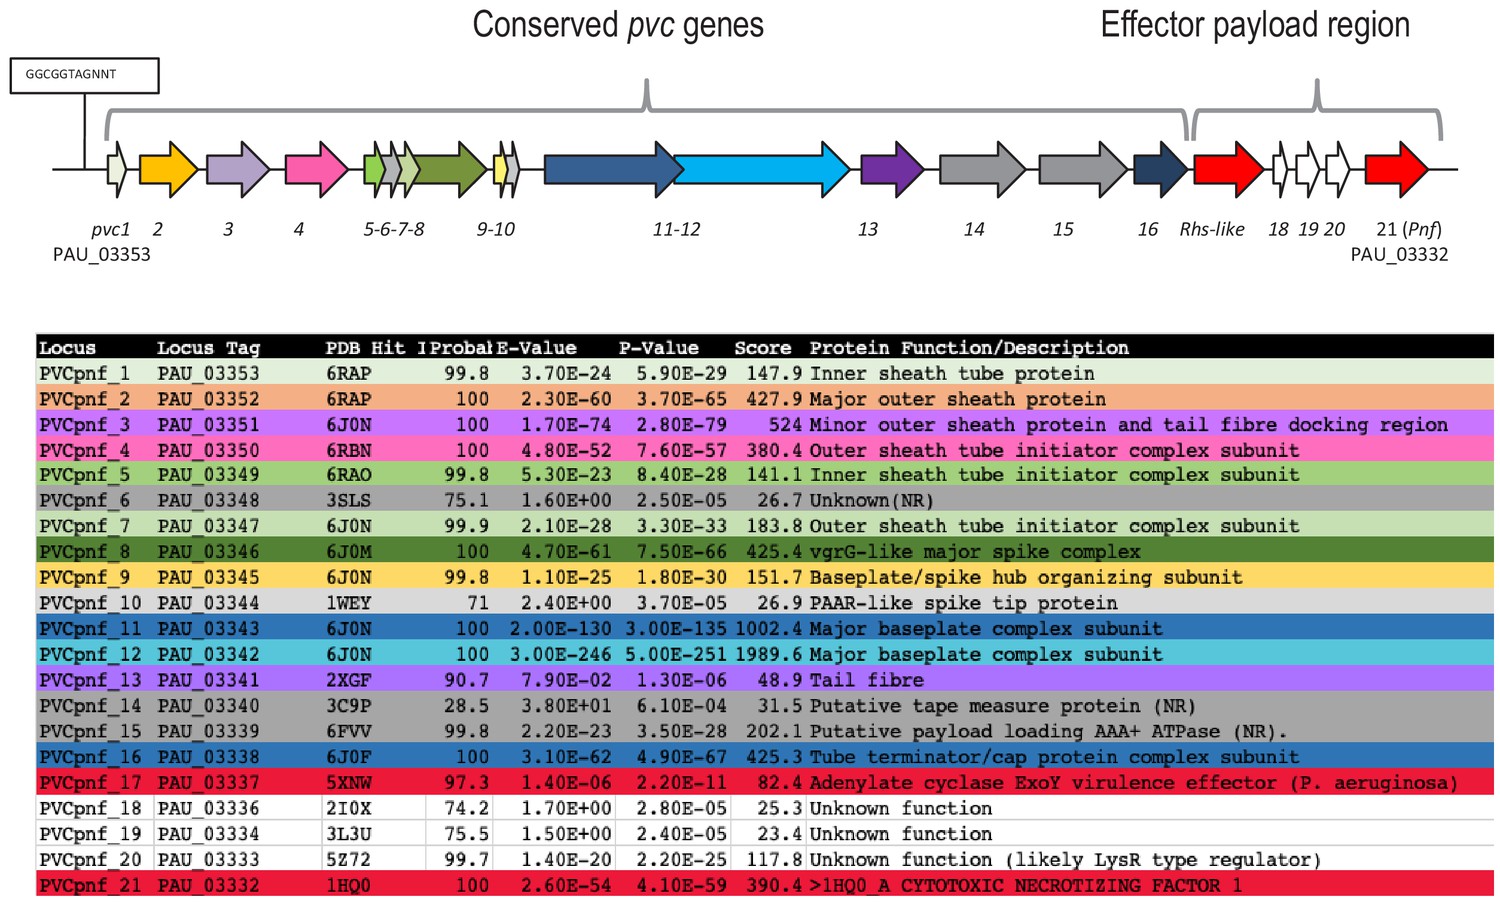
A map of the model class I PaATCC43949 PVCpnf operon showing two effector genes in the payload region in red and a table, both colour matched to the description of subunit-structure relationship described in the recent CryoEM structure paper (Jiang et al., 2019).
Payload effectors are in red and ‘NR’ means subunit not resolved in the structure.
Figure 2 with 4 supplements
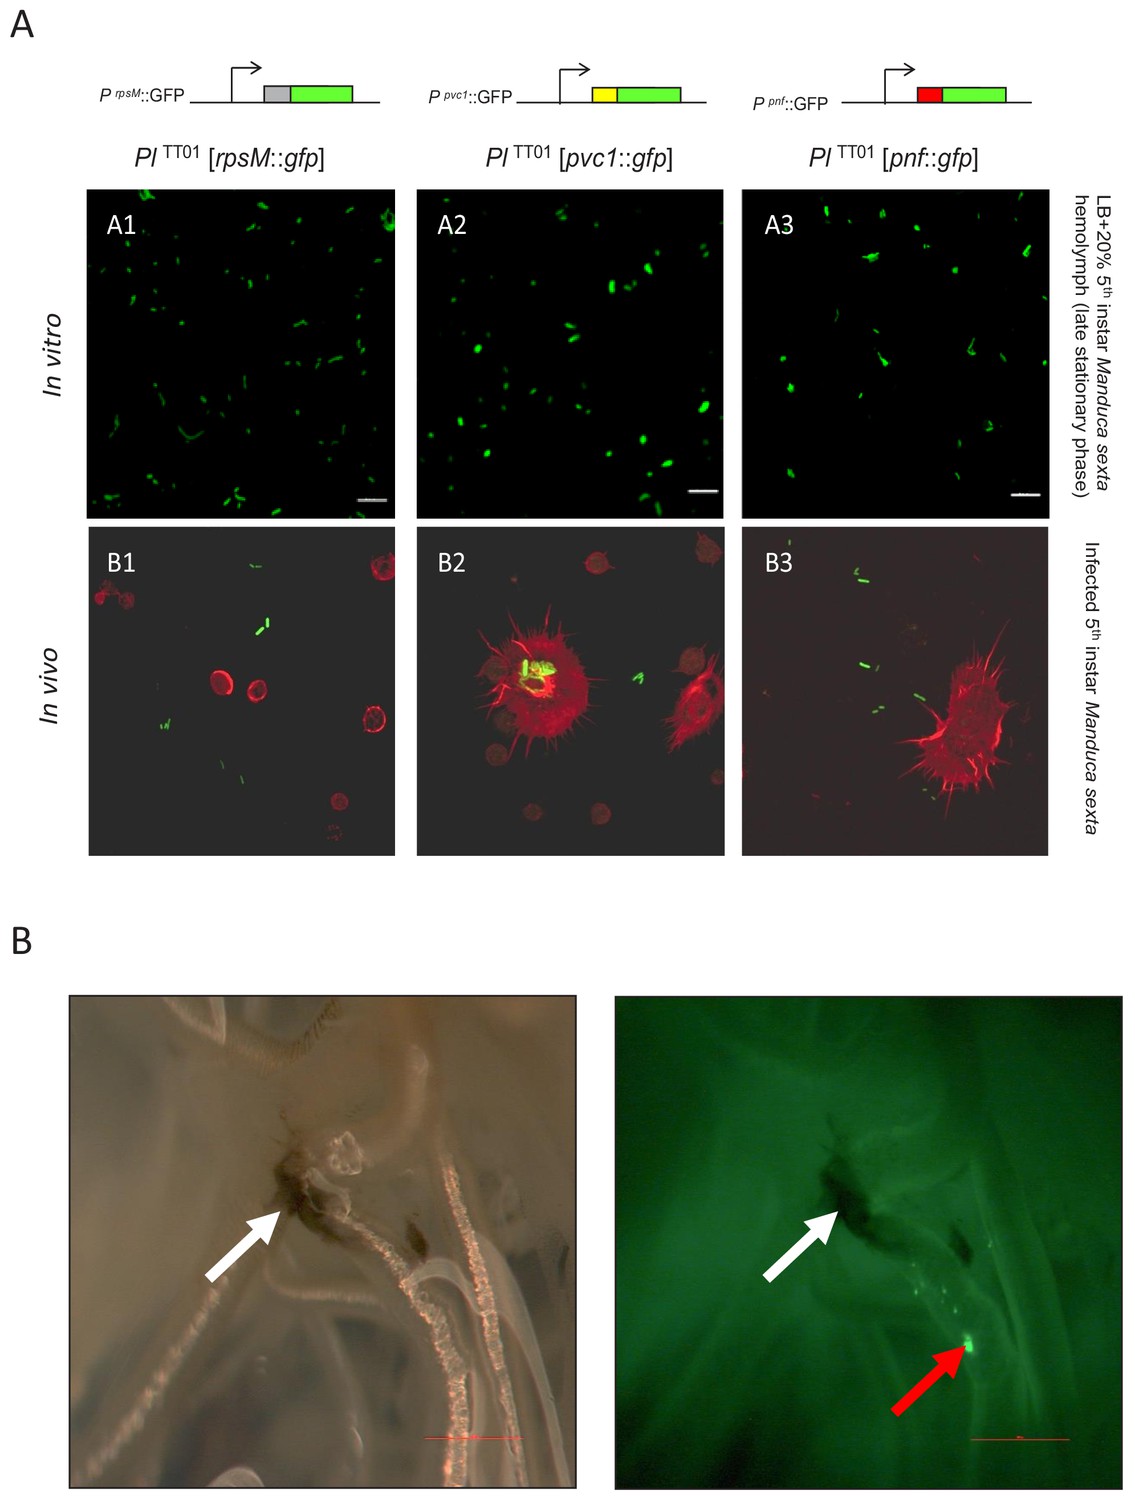
Examination of PVC operon expression using gfp reporter constructs in Photorhabdus.
(A) Confocal micrographs of showing in vitro (A1–A3) and in vivo (B1–B3) expression in PlTT01 of gfp transcription-translation reporter constructs of PaATCC43949 PVCpnf operon gene promoters. These plasmid-based reporters were constructed by fusing the transcription promoter regions and the first 37 codons of the target gene in frame with the second codon of gfp. Target gene promoters shown are (A1 and B1) the constitutively expressed rpsM gene, (A2 and B2) the PaATCC43949 PVCpnf pvc1 structural gene and (A3 and B3) PaATCC43949 PVCpnf pnf payload toxin gene. The in vitro panels (A1-3) show reporter expression after growth in LB supplemented with 20% (v/v) 5th instar M. sexta hemolymph at late stationary phase. The in vivo panels show ex vivo hemolymph from 5th instar M. sexta infected with PlTT01 harbouring the three different reporter constructs. The hemocyte cytoskeletons are stained red with TRITC-Phalloidin conjugate. (B) White light (left) and fluorescence illumination (right) of the trachea of a dissected 5th instar M. sexta previously infected with PlTT01 harbouring the PaATCC43949 PVCpnfpnf::gfp reporter construct. Brightly fluorescent green bacteria were detected in association with the trachea (red arrow) in close proximity to melanotic nodules (white arrows) at 12 hr post infection, demonstrating the induction of the pnf promoter and the production of the Pnf::GFP fusion in situ. Bars show 0.1 mm.
Figure 2—figure supplement 1
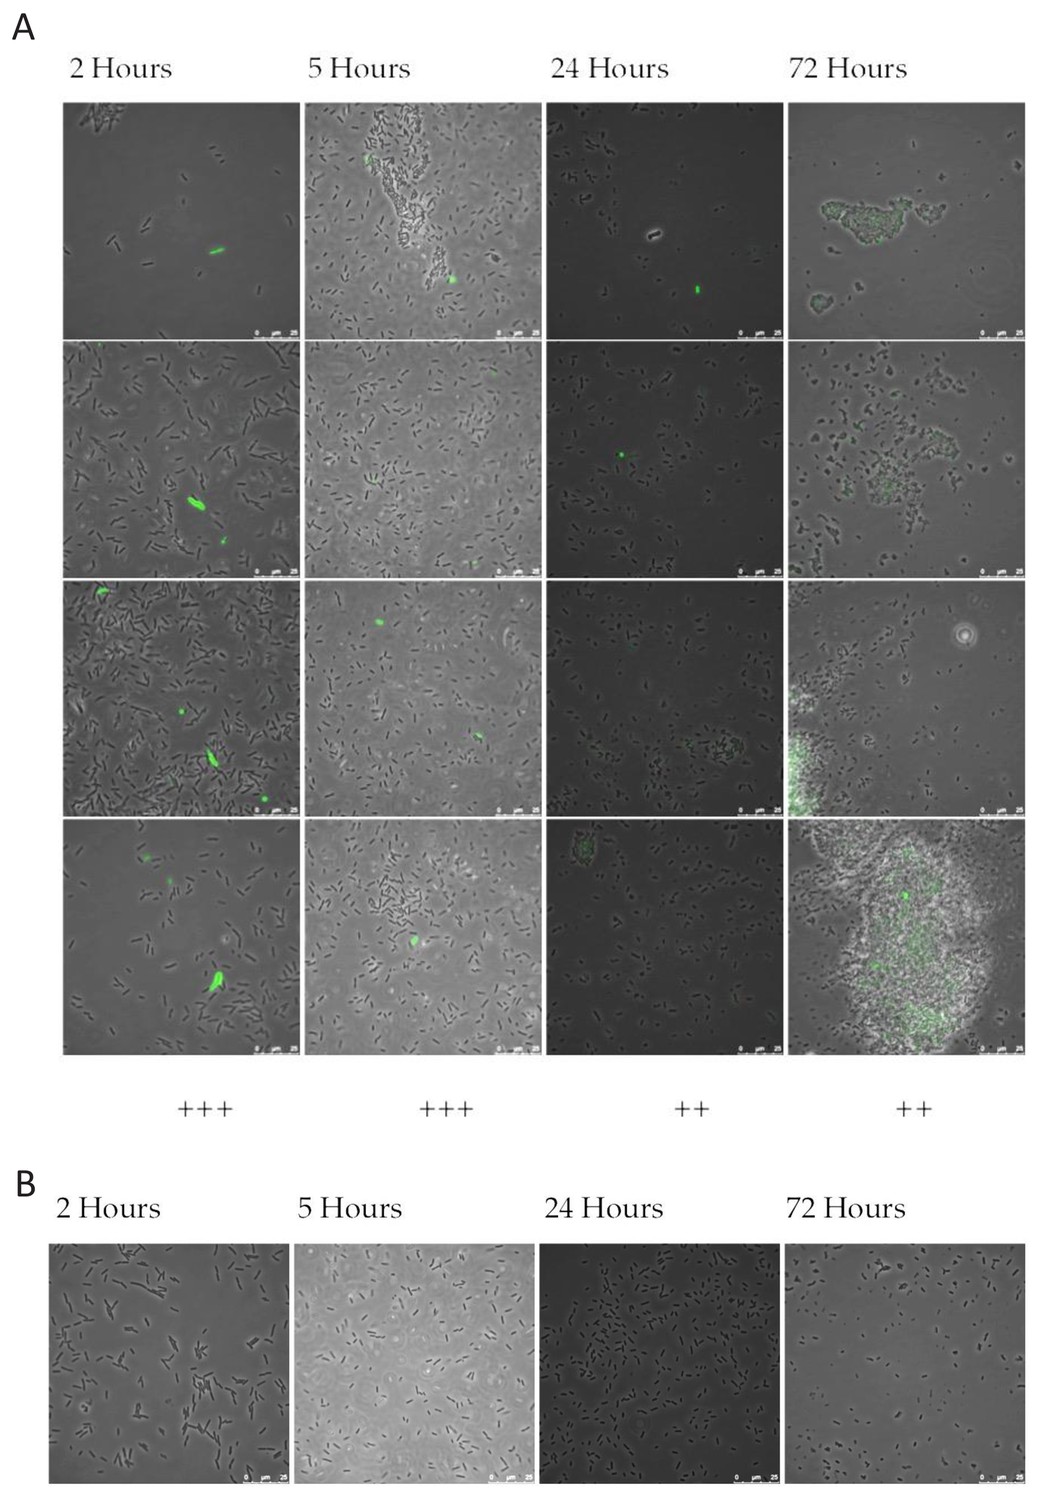
A representative selection of images for four time points, for P. asymbiotica PB68.1 (PaPB68) harbouring.
(A) the PaPB68 PVCpnf pvc1 promoter fusion construct or (B) pAGAG negative control reporter plasmid with no promoter. For (A) quadruplicate images are displayed vertically as representative of the whole slide sample. Key to qualitative fluorescence indication: ‘-” is no fluorescence, ‘++” is low level fluorescence in many cells or a few brighter cells, ‘+++” is intermediate to high fluorescence in almost all cells, or some very bright isolated cells.
Figure 2—figure supplement 2
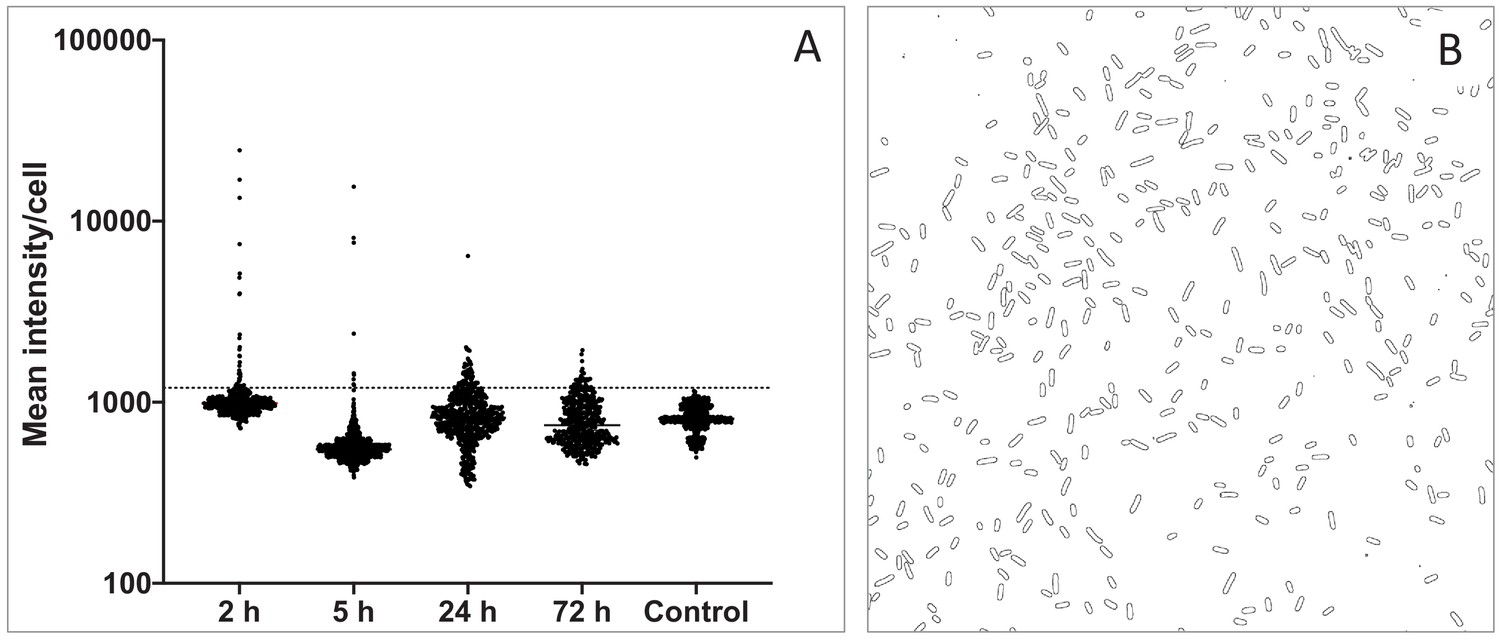
Quantification of population heterogeneity of PVC expression using image analysis of gfp expression.
(A) Time dependant swarm-plots of GFP intensity of individual cells in the population of P. asymbiotica. PB68.1 harbouring the PaPB68 PVCpnf pvc1 promoter fusion construct compared to the pAGAG negative control reporter plasmid with no promoter (see Figure 2—figure supplement 1). The dotted line represents the threshold of 1200, above which there were no control cells with this mean intensity value. Dots above this line represent individual GFP expressing cells. Note even though highly heterogeneous, the numbers of expressing cells fall with culture time. (B) an example of the ‘edge detection’ method used on a single field of view to define individual cells for this image analysis approach (see Materials and methods).
-
Figure 2—figure supplement 2—source data 1
Cell intensity counts used in image analysis quantification shown in Figure 2—figure supplement 2.
- https://doi.org/10.7554/eLife.46259.011
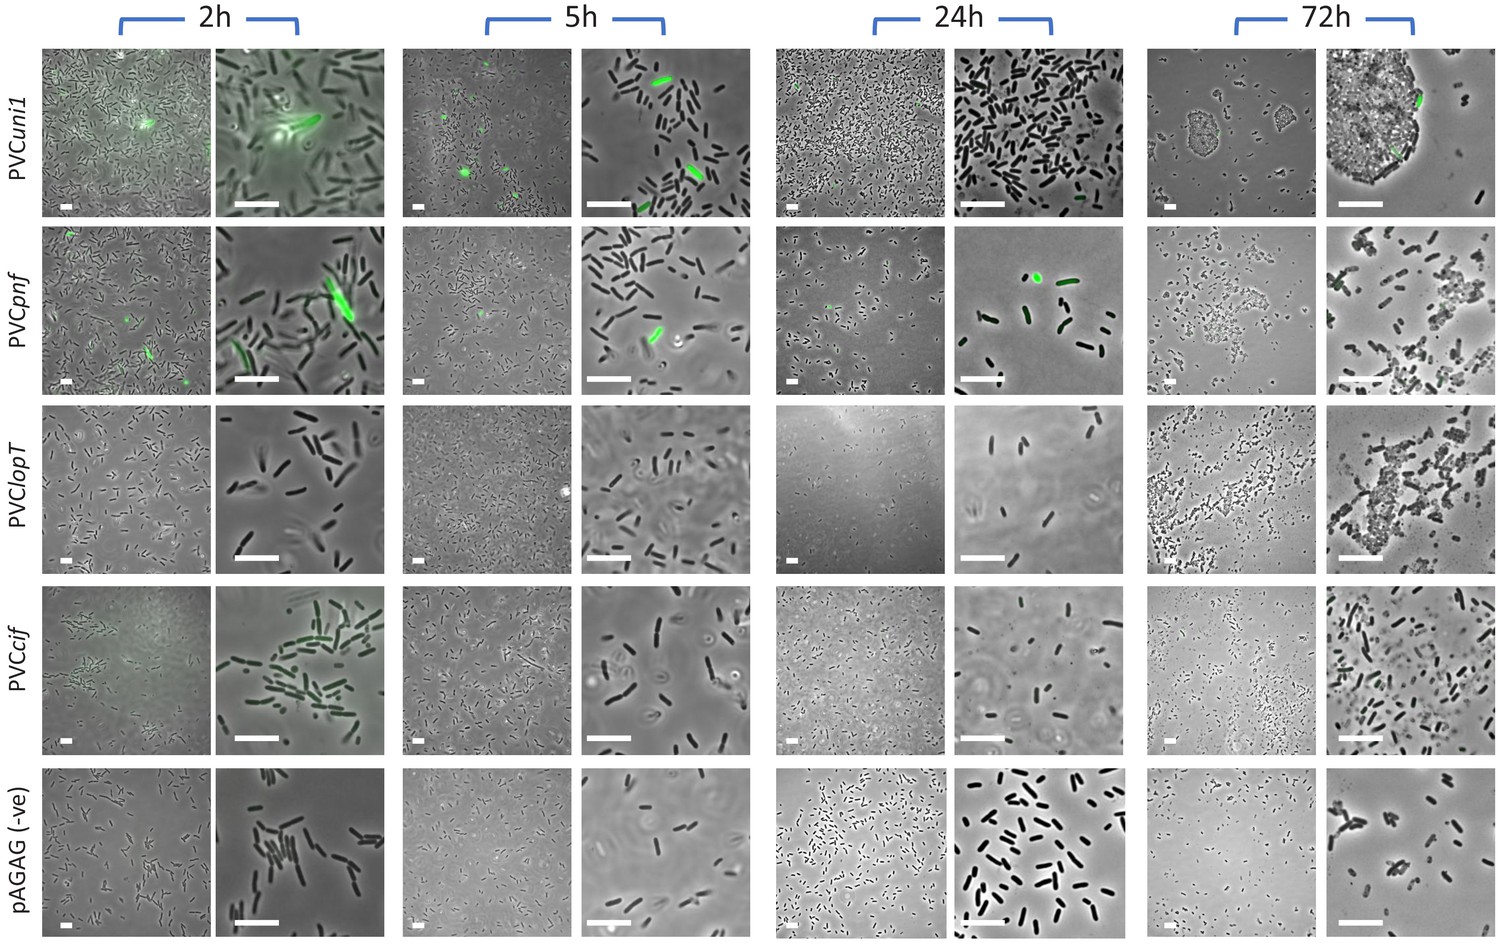
Figure 2—figure supplement 3
A representative selection of images for four growth time points, for P. asymbiotica.
PB68.1 harbouring four different pvc-operon reporter constructs and the pAGAG negative control reporter plasmid containing no promoter. Wide field (left) and a magnified subsection (right) panels are shown for each timepoint.
Figure 2—figure supplement 4
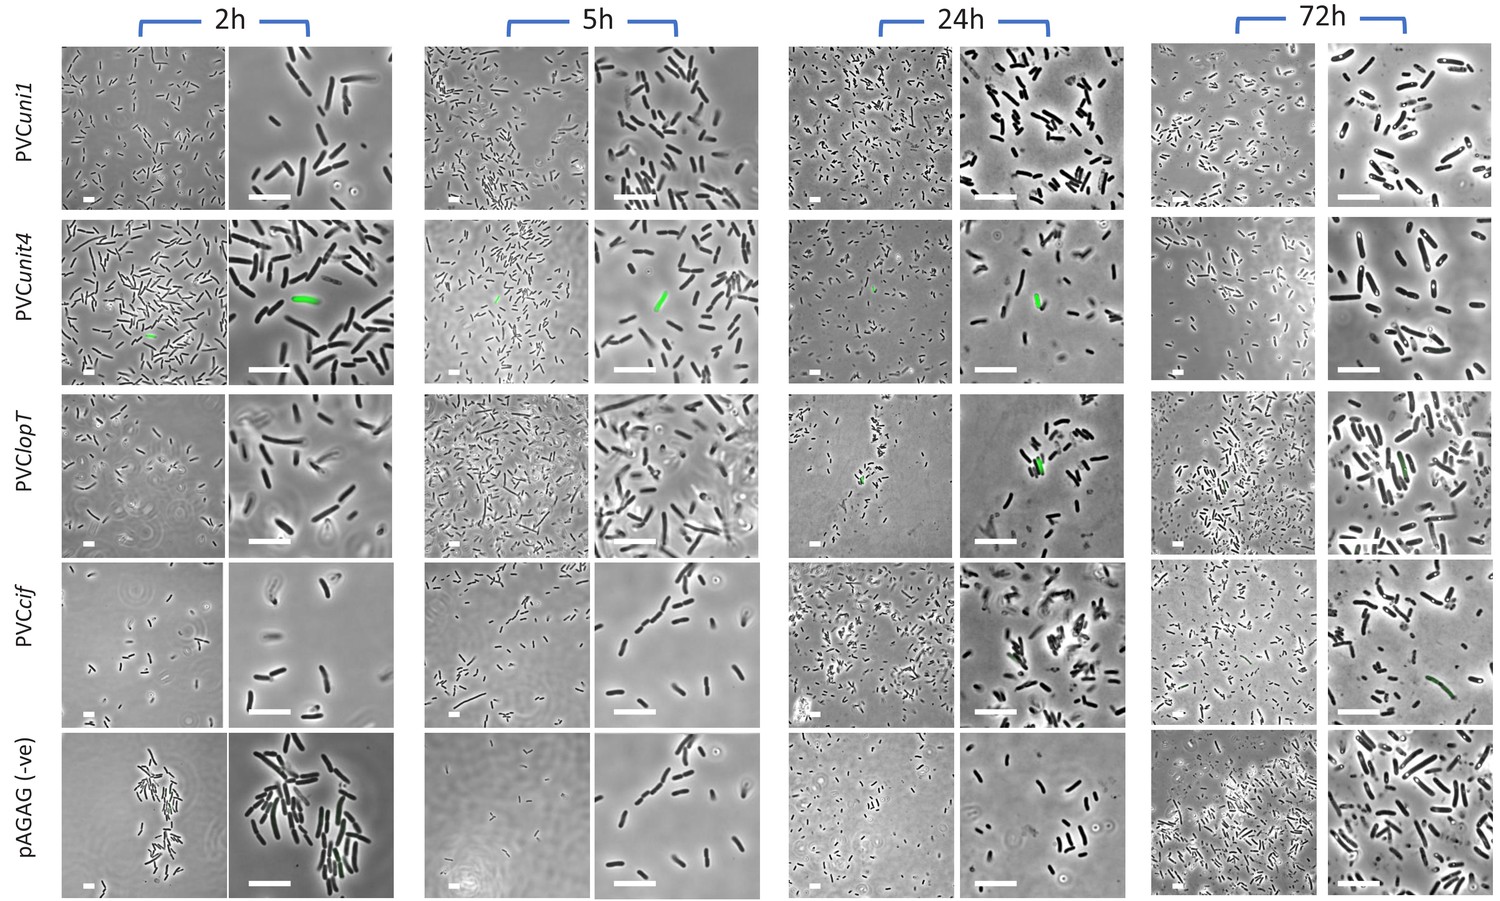
A representative selection of images for four growth time points, for P. luminescens.
TT01 harbouring four different pvc-operon reporter constructs and the pAGAG negative control reporter plasmid containing no promoter. Wide field (left) and a magnified subsection (right) panels are shown for each timepoint.
Figure 3
Confirmation of the PVCpnf-operon transcription in vitro and in vivo using RT-PCR.
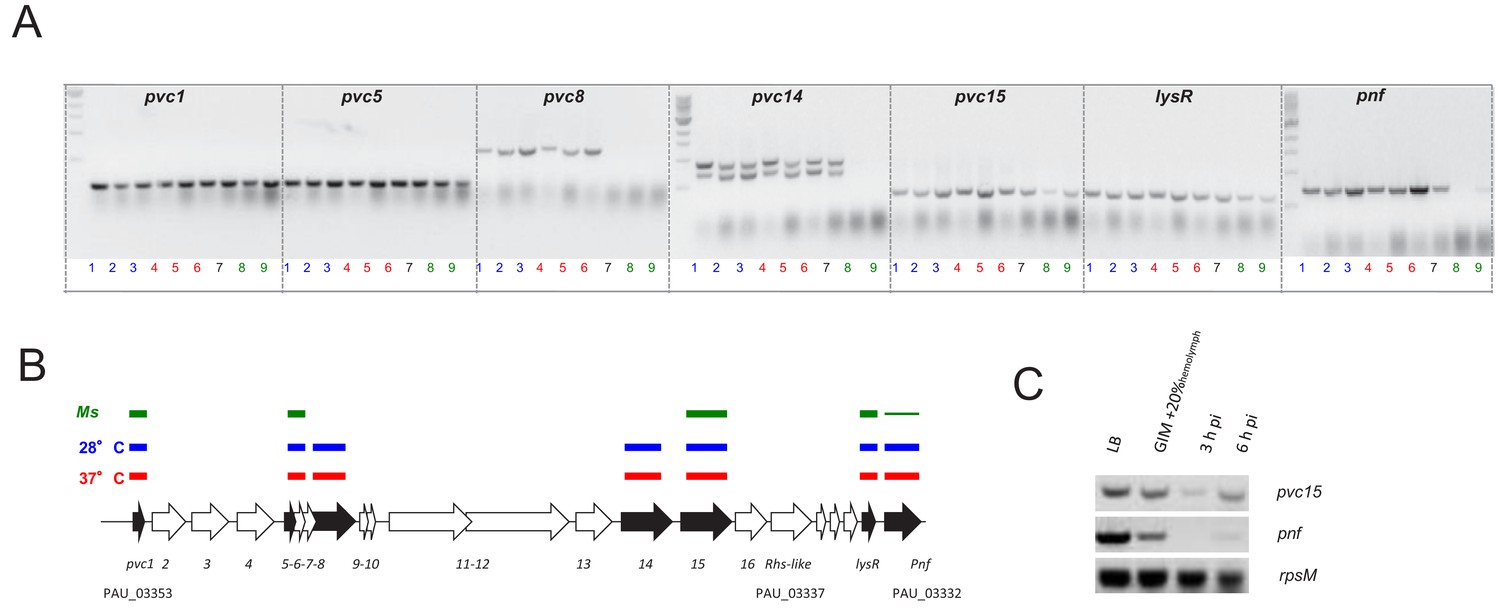
(A) RT-PCR analysis of gene transcription of various genes of the PaATCC43949 PVCpnf operon over time in vitro at insect (28°C) and human (37°C) relevant temperatures and in vivo during Manduca sexta (Ms) infection. Lane key; lanes 1, 2 and 3 (blue) represent in vitro growth in aerated LB at 28°C for 4, 8 and 24 hr respectively; lanes 4, 5 and 6 (red) are growth in aerated LB at 37°C for 4, 8 and 24 hr; lane 7 (black) is growth in LB at 28°C for 16 hr; lanes 8 and 9 (green) are from 3 hr and 6 hr post infection blood of Ms infected with P. asymbiotica at 28°C. (B) Map of the operon showing RT-PCR target genes in black. The lane-colour coded bars above the ORFs summarise in which conditions gene transcription could be detected. Note pvc8 and pvc14 mRNA could not be detected from infected Ms and the pnf mRNA was only detected after 6 hr of infection. (C) RT-PCR signals for pvc15 and pnf from infected insects with the rpsM (ribosomal subunit protein S13) loading control. Lanes represent (in order); 4 hr growth in LB at 28°C; 4 hr growth in Grace’s insect medium supplemented with 20% (v/v) Ms hemolymph; 3 hr and 6 hr post infection ex vivo blood of Ms infected with P. asymbiotica at 28°C.
Figure 4
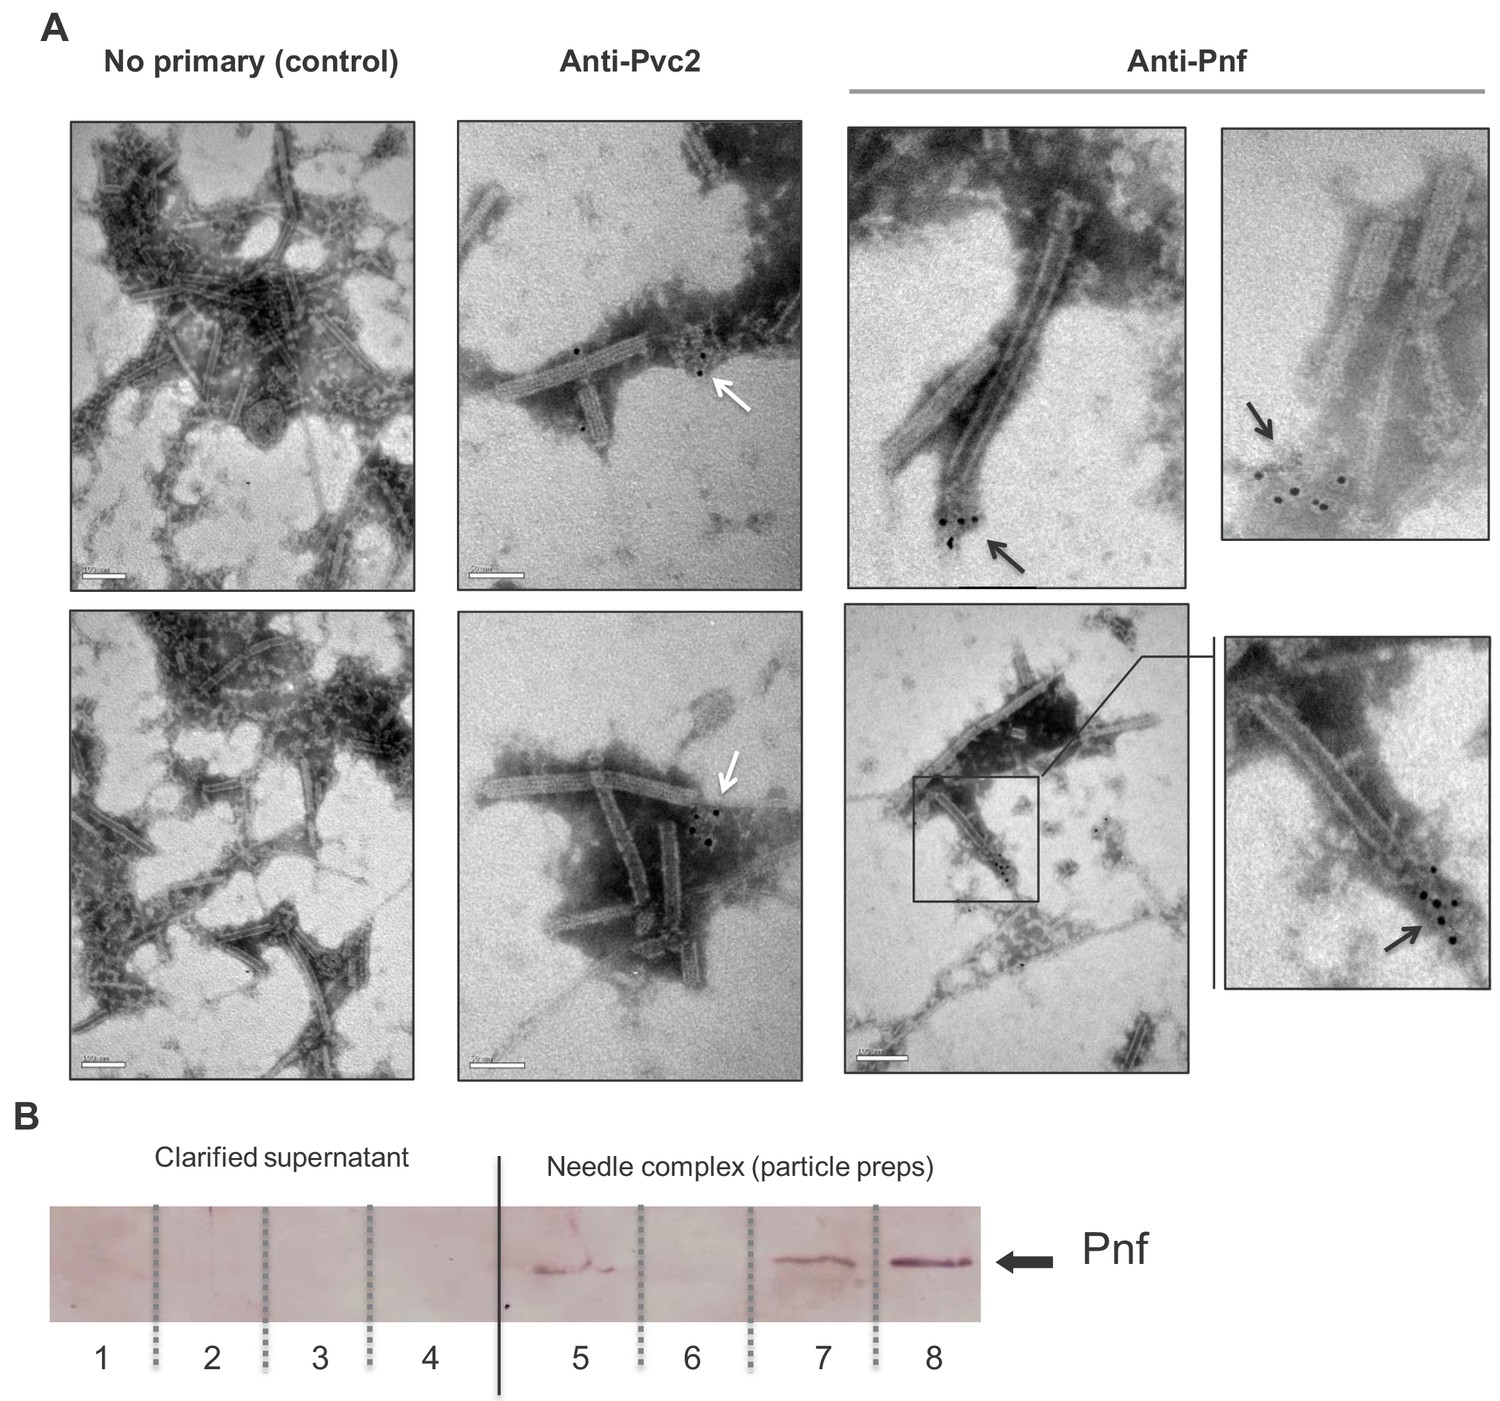
Pnf protein can only be detected in discharged or disrupted needle complexes using antibody based analysis.
(A) Representative images of immuno-gold stained transmission electron microscopy grids confirming the Pnf-payload toxin is associated with the needle complex. PVCpnf needle complexes (PVC-NC) were prepared from supernatants of the E. coli 4df10 cosmid clone, which encodes the PVCpnf operon. We used anti-peptide antibodies against Pvc2 (DGPETELTINGAEE) and Pnf (TGQKPGNNEWKTGR) epitopes to localise these protein subunits. The Pvc2 epitope appeared to only become accessible to the antibody when subunits were ‘broken off’ the ends (white arrows). The Pnf toxin could also only be detected at the ends of broken or contracted suggesting they are contained within the complex (black arrows). (B) Western blot analysis confirms that the Pnf protein can only be detected using the anti-peptide antibody if the needle complex is either chemically or physically disrupted. These preparations were taken from PaATCC43949 supernatants. The inability to detect Pnf in clarified supernatants confirms all the protein is associated with the PVC-NC enrichment preparation. Lanes 1 + 5; sonicated samples, 2 + 6; 1M NaCl treatments, 3 + 7; 1% SDS treatments 4 + 8; 1M Urea treatments. Note the PVC-NC appears stable in 1M NaCl.
Figure 5
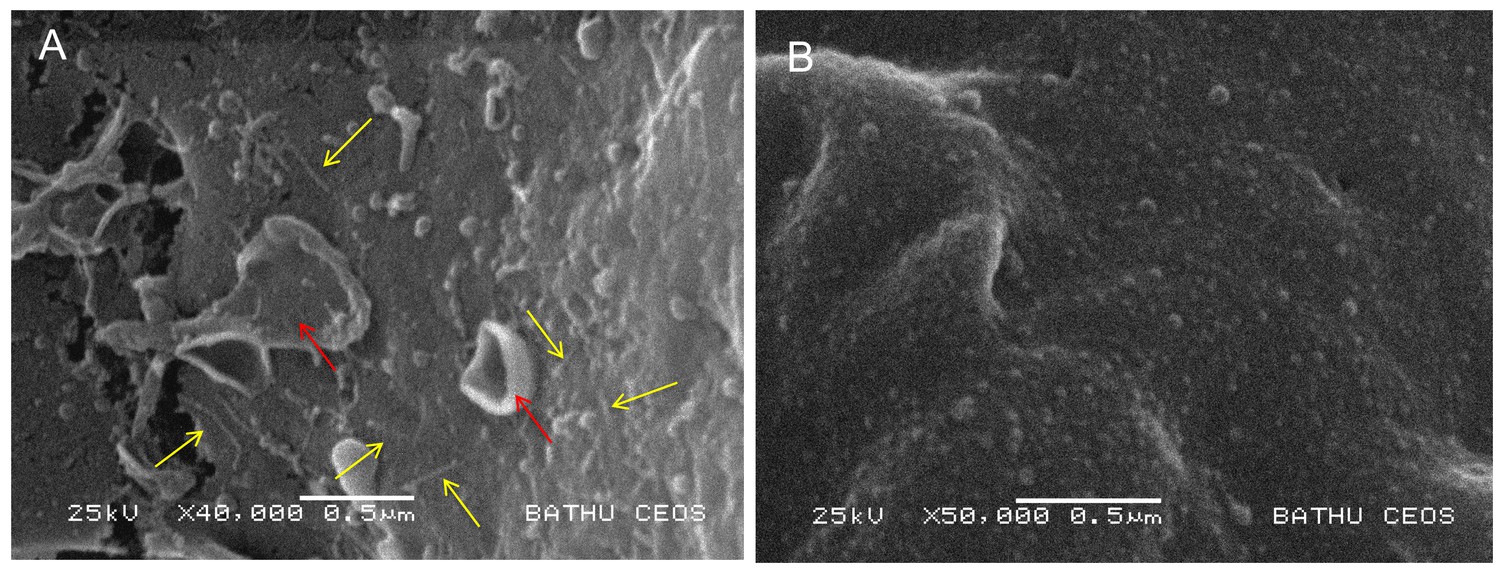
Visualisation of PVC needle complexes on the cell surface.
Cryo-SEM analysis of ex vivo hemocytes from 5th instar Manduca sexta that had been injected with (A) native or (B) heat inactivated enriched preparations of PaATCC43949 PVCpnf needle complexes heterologously produced by the E. coli cosmid clone. Note the abundant linear structures believed to be the PVC needle complex (yellow arrows) and membrane ruffling effect (red arrows) absent from the control treatment.
Figure 6 with 1 supplement

Pnf needs to gain access to the host cell cytoplasm to induce F-actin formation and multi-nucleation in cultured HeLa cells.
Wild-type and inactive toxoid mutant Pnf protein was delivered topically using BioPORTER. Cell cytoskeleton is stained with TRITC-Phalloidin and the cell nuclei with DAPI. This gave rise to phenotypes consistent with the molecular targets and that of the Yersinia CNF2 protein homologue. Note we see the F-actin formation by 24 hr (white arrows) preceding extensive multi-nucleation of the host cell by 48 hr (yellow arrows). Note neither application of the Pnf toxoid in a BioPORTER formulation or the purified wild-type Pnf protein without BioPORTER had any observable effect on the cells.
Figure 6—figure supplement 1
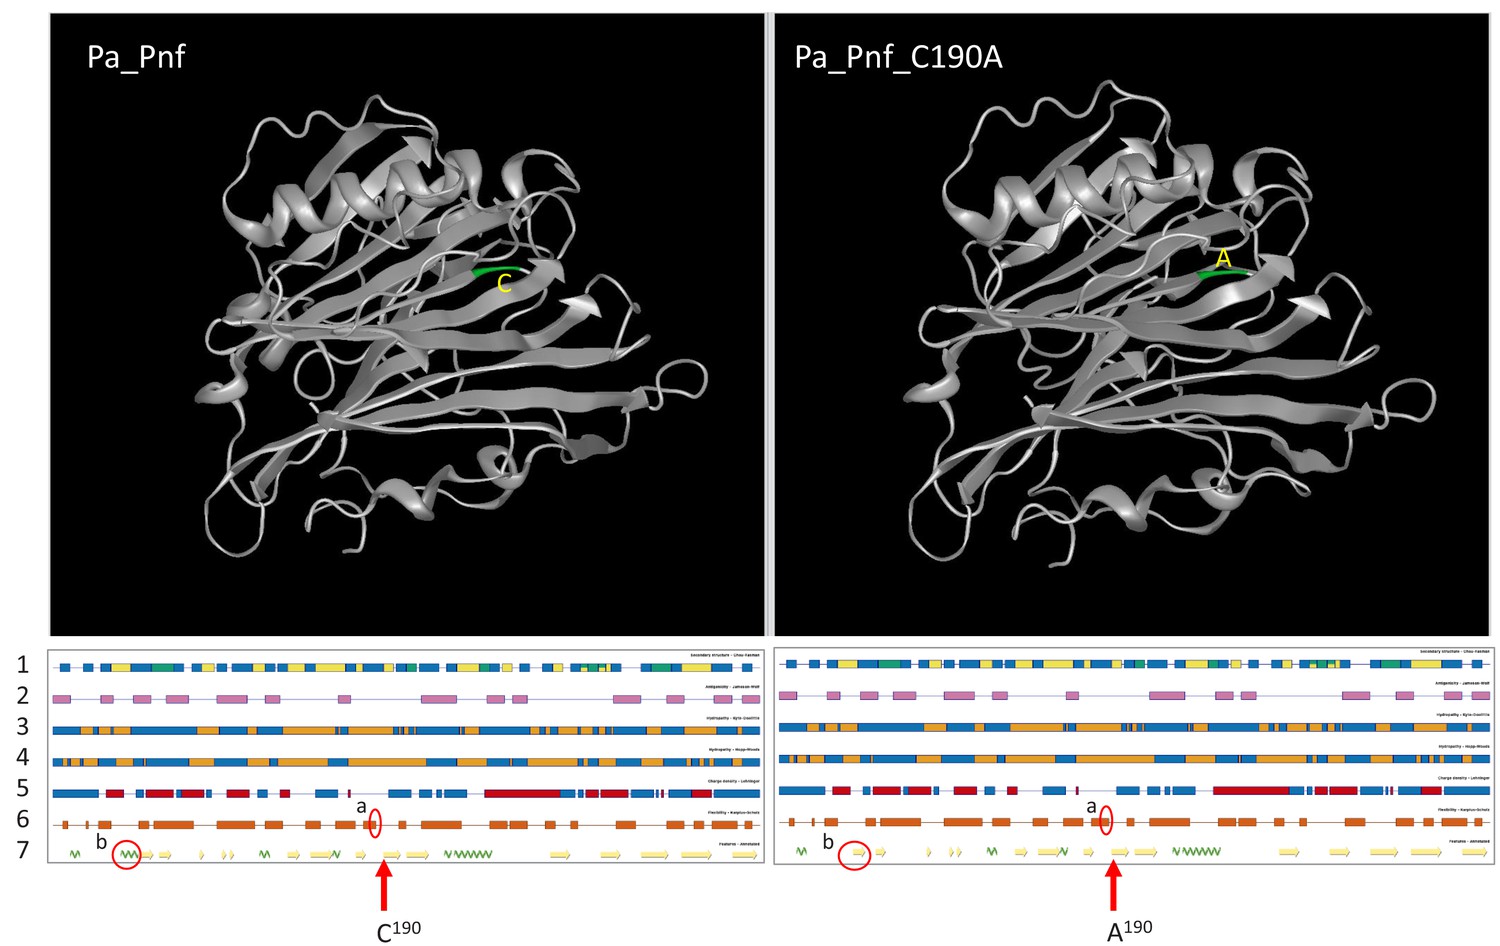
Ab initio structural prediction of the Pnf toxin and toxoid derivative.
Top. Predicted structural models of Pnf wild-type protein (Pa_Pnf) and the toxoid (Pa_Pnd_C190A) produced using Phyre2 with a 100% confidence score by comparison to an E. coli CNF1/2 family toxin active site domain (PDB Entry: 1hq0). Visualised using the DNAstar Protean 3D. Location of the active site mutation C190A is shown in green. Bottom. Predicted structural properties of the two proteins. Minor differences between the two models are circled in red (labelled ‘a’ and ‘b’). The numbered tracks are as follows; (1) Chou-Fasman Secondary Structure, (2) Jameson-Wolf Antigenicity, (3) Kyte-Doolittle Hydropathy, (4) Hopp-Woods Hydropathy, (5) Lehninger Charge Density, (6) Karplus-Schutz Fexability, (7) Feature Annotation.
Figure 7
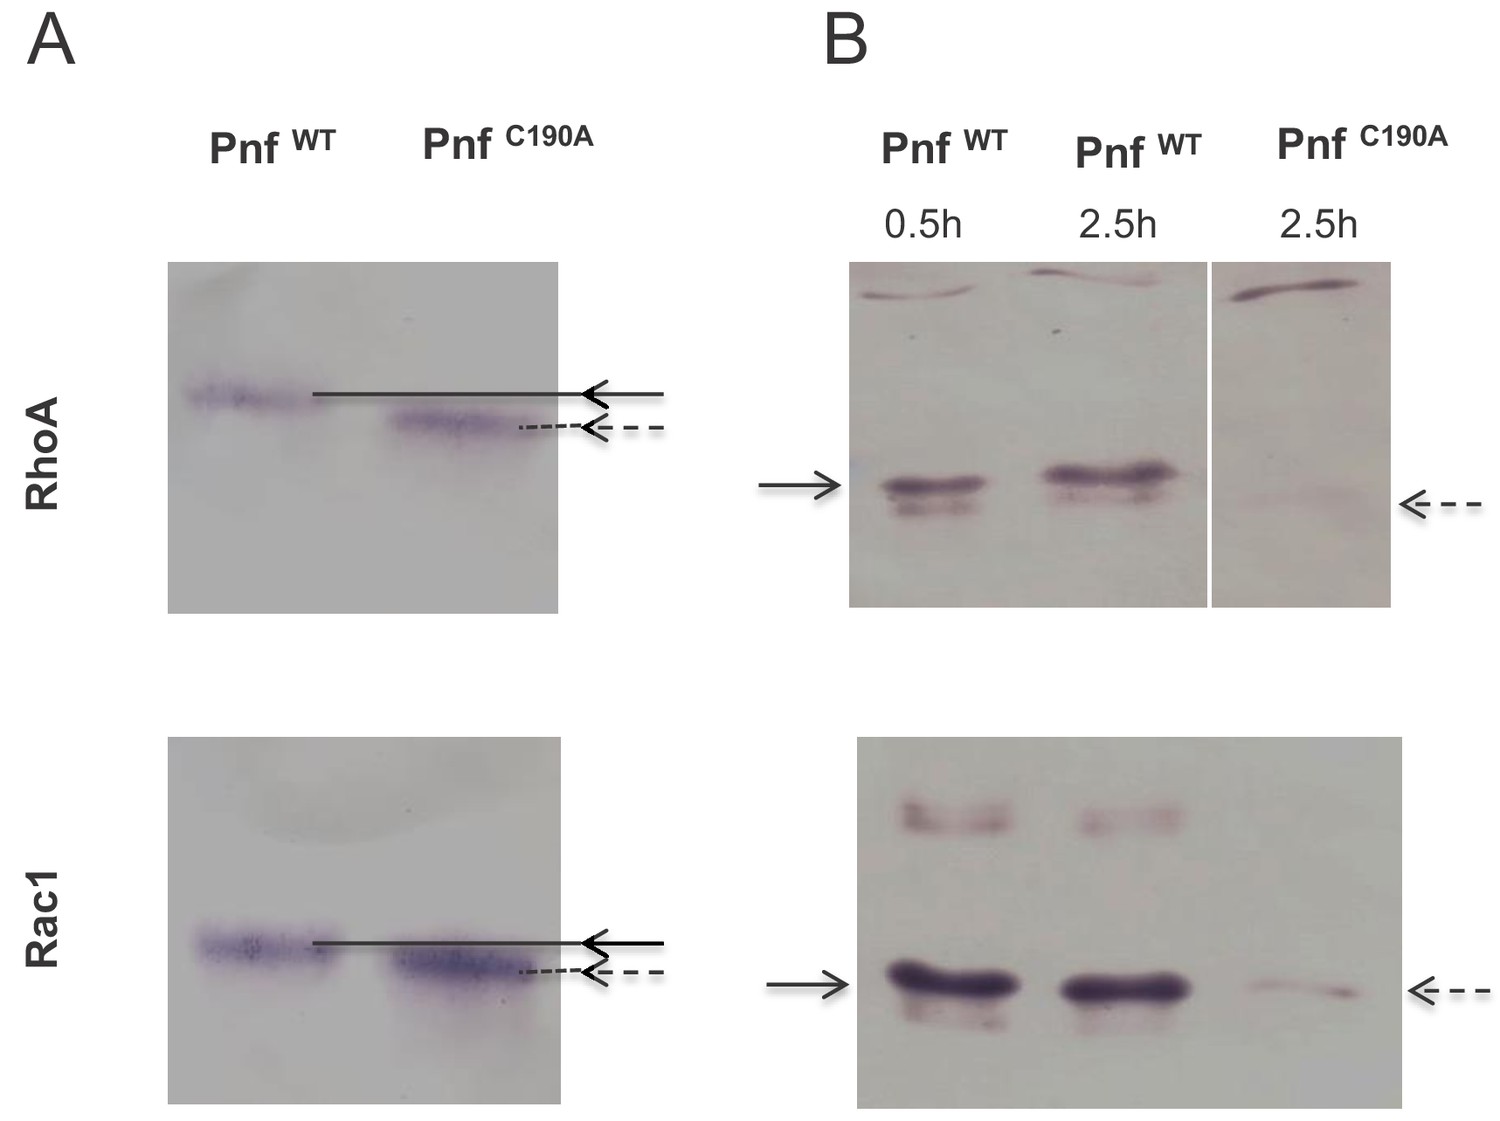
Pnf transglutaminates and deamidates purified mammalian RhoGTPAses at Gln63 (RhoA) and Gln 61 (Rac1).
(A) For transglutamination assays a 2:1 molar ratio of small Rho GTPase to purified Pnf was incubated in transglutamination buffer in the presence of ethylediamine for 1 hr at 37°C. Note transglutaminated GTPase runs slightly slower on the gel as visualised using anti RhoA and Rac1 antibodies. (B) For deamidation assays a 20:1 molar ratio of Rho GTPases; RhoA and Rac1, to purified Pnf toxin was incubated in deamidation buffer for either 30 min or 2.5 hr at 37°C. Note deamidation is detected using an antibody specific towards deamidated Rho GTPase antigens. In both cases, the wild-type Pnf protein was active (solid arrows) while a site directed amino acid C190A toxoid mutant (in the predicted Pnf active site) showed no activity (dotted arrows).
Additional files
-
Supplementary file 1
Table of PCR primers.
Oligonuclotides used for the construction of pAGAG based reporter plasmids used in Figure 2—figure supplement 2, 3 and 4.
- https://doi.org/10.7554/eLife.46259.020
-
Transparent reporting form
- https://doi.org/10.7554/eLife.46259.021
Download links
A two-part list of links to download the article, or parts of the article, in various formats.
Downloads (link to download the article as PDF)
Open citations (links to open the citations from this article in various online reference manager services)
Cite this article (links to download the citations from this article in formats compatible with various reference manager tools)
The Photorhabdus asymbiotica virulence cassettes deliver protein effectors directly into target eukaryotic cells
eLife 8:e46259.
https://doi.org/10.7554/eLife.46259


