Imaging neuropeptide release at synapses with a genetically engineered reporter
- California Institute of Technology, United States
- University of Southern California, United States
- Oak Crest Institute of Science, United States
- Howard Hughes Medical Institute, California Institute of Technology, United States
- Tianqiao and Chrissy Chen Institute for Neuroscience, California Institute of Technology, United States
Figures
Figure 1 with 4 supplements
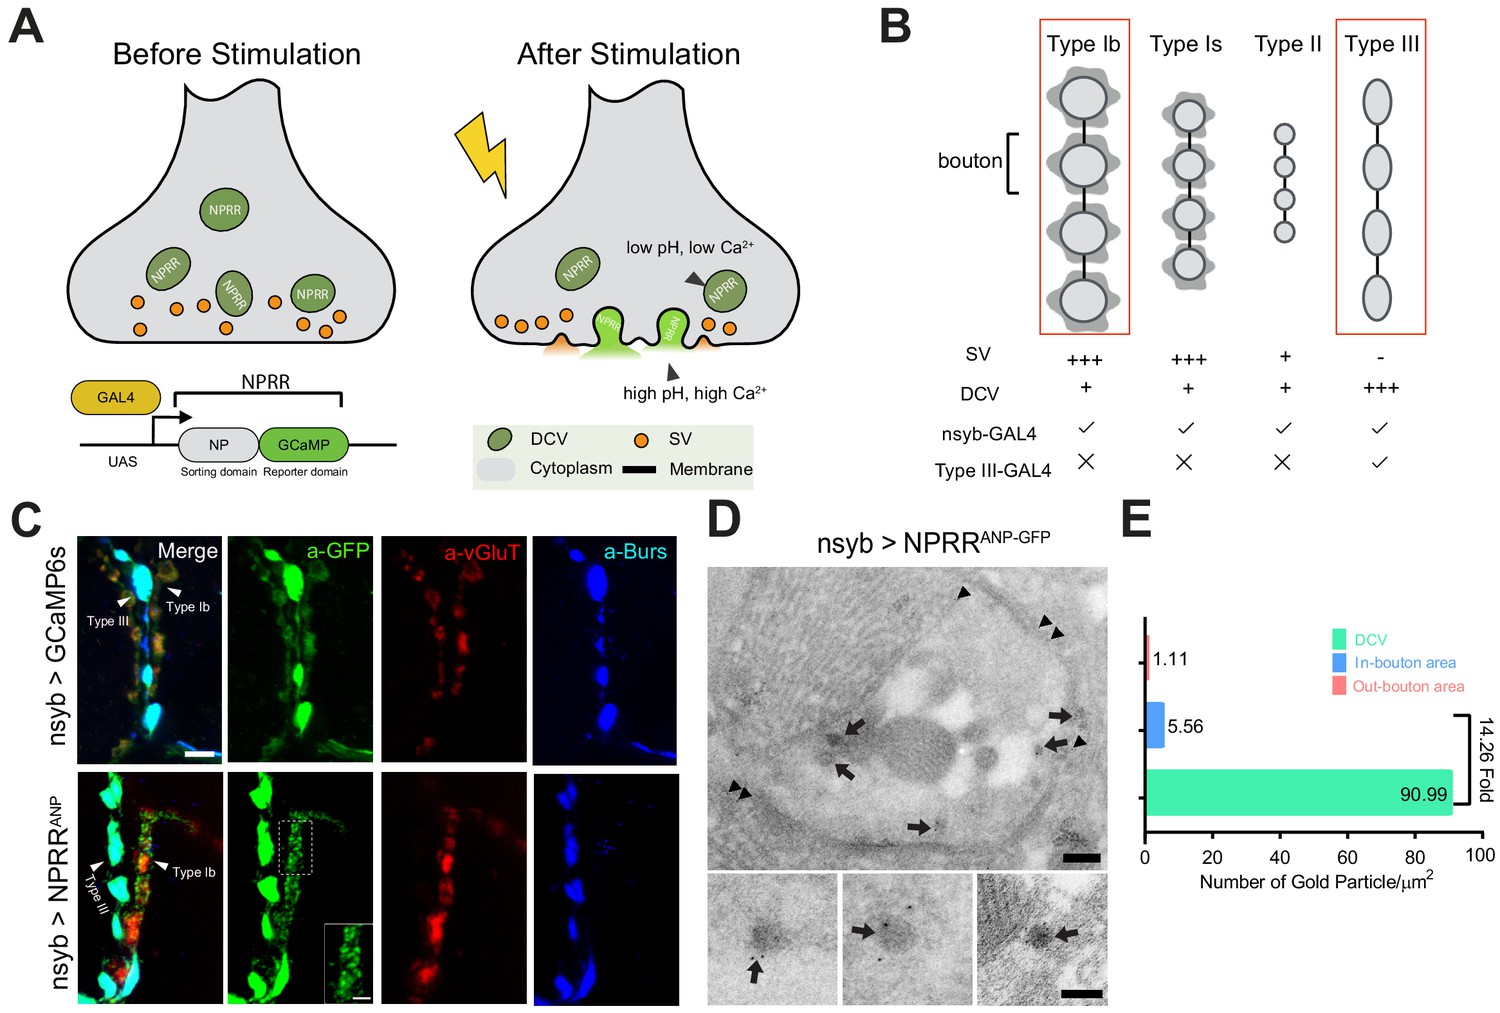
Design and Synaptic Localization of an NPRR.
(A) Schematic illustrating the principle of NPRRs (Neuropeptide Release Reporters). NPRR molecules in the DCV lumen (low pH/low calcium, left) exhibit increased fluorescence when released by fusion into the extracellular space (neutral pH/high calcium, right). NPRR fluorescent signal is expected to decay following diffusion into the synaptic cleft. New NPRR-containing DCVs are produced by synthesis and transport from the soma, not by recycling. NP: Neuropeptide. DCV: Dense Core Vesicle. SV: Synaptic Vesicle. (B) Distinct motor neuron subtypes at the Drosophila NMJ (muscle 12/13) have different proportions of DCVs vs. SVs. The GAL4 driver R57C10-Gal4 (nsyb-GAL4) labels all subtypes, while R20C11-GAL4 selectively labels only Type III neurons, which lack SVs (‘Type III-GAL4’). Light gray circles, black lines and dark gray shading represent boutons, inter-bouton intervals and subsynaptic reticulum respectively. The studies in this paper focus on Type Ib neurons and Type III neurons (in red rectangles). (C) Triple immunolabeling for GFP (green), Bursicon (blue) and vGluT (red), in flies containing nsyb-GAL4 driving UAS-GCaMP6s (upper), or NPRRANP (lower). Type Ib and Type III boutons are indicated. Scale bar, 5 µm. Inset image (NPRRANP, a-GFP channel) shows details of puncta distribution of NPRRANP in Type Ib neuron. Scale bar, 2 µm. (D) TEM images of boutons immunolabeled with anti-GFP (5 nm gold particle-conjugated) to detect nsyb>NPRRANP-GFP, which has an identical structure to NPRRANP, but is a GFP rather than GCaMP6s fusion to improve antigenicity (see Figure 1—figure supplement 4). Note strong labeling in DCVs (arrows) and the neuronal plasma membrane (arrowheads). Scale bar, 200 nm. Lower panel shows representative images of labeled DCVs. Scale bar,100 nm. (E) Quantification for TEM images in (D).
-
Figure 1—source data 1
Raw data for Immuno-EM experiments (ANP).
- https://doi.org/10.7554/eLife.46421.007
-
Figure 1—source data 1
Raw data for Immunno-EM experiments (control group).
- https://doi.org/10.7554/eLife.46421.008
Figure 1—figure supplement 1

NPRR screening pipeline.
A series of reporter-neuropeptide precursor fusions were designed, codon-optimized for Drosophila, cloned into expression vectors under the control of the GAL4 upstream activator sequence (UAS), and used to generate transgenic flies. (A) Candidate reporters interrogated included (constitutive) fluorescent reporters, genetically encoded calcium indicators (GECI) and pH indicators (pHluorins). (B) Sorting domain candidates included different truncated versions of rat Atrial Natriuretic Peptide (ANP; single-precursor-single-peptide) and Drosophila tachykinin (dTK; single-precursor-multiple-peptide) precursors. 52 constructs were built and injected. 44 of 54 were successfully integrated as transgenic lines, while eight were excluded due to lethality or unstable expression. (C–D) Candidate UAS-NPRR lines were crossed with an NPF-Gal4 driver line and selected based on their expression in NPF terminals in the adult fly brain. The raw fluorescence intensity of each NPRR candidate was measured using the same microscope parameters (laser power, HV, offset value). 14 candidates passed this screening. (C) We screened the performance of difference NPRRs (signal-to-noise contrast) by measuring fluorescence before and immediately after 70 mM high-potassium challenge in an ex vivo explant preparation of adult fly brains. The post/pre KCl fluorescence ratio is defined as ΔF/F. We arbitrarily set the threshold as 100%. 2 NPRRs with highest ΔF/F passed the final round of screening. Red asterisks indicate the candidates selected for the studies in Figure 2 and Figure 3. Blue asterisk indicates original ANP-GFP fusion) (Burke et al., 1997; Rao et al., 2001).
Figure 1—figure supplement 2
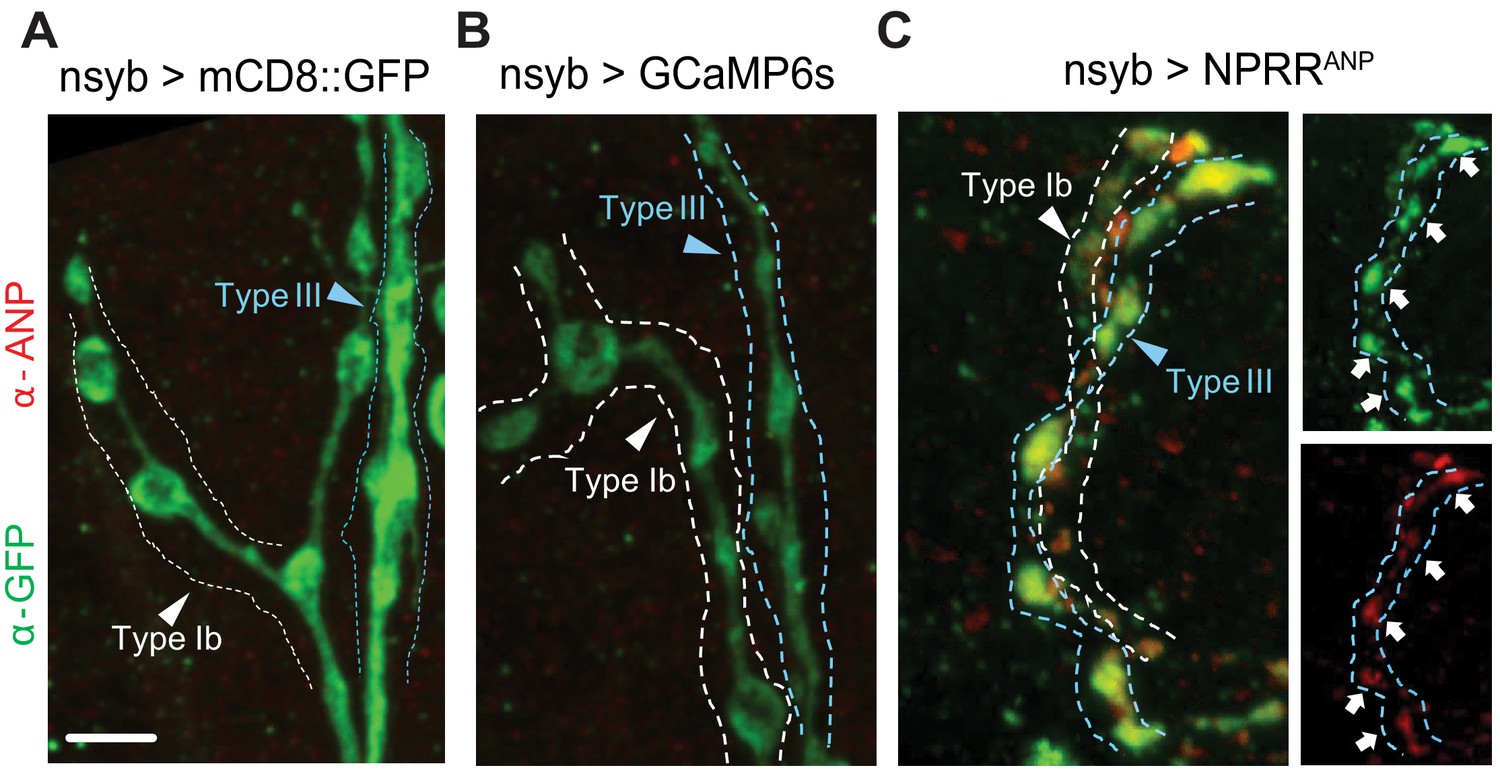
Exogeneous neuropeptide ANP dictates the expression pattern of NPRRANP.
Membrane-bound mCD8::GFP fusion (A), cytosolic GCaMP6s (B) and NPRRANP (C) were expressed pan-neuronally in the larval NMJ and stained for both ANP (red) and NPRR (green, anti-GFP). (C) Note co-localization of ANP and GFP. Scale bar, 5 µm.
Figure 1—figure supplement 3
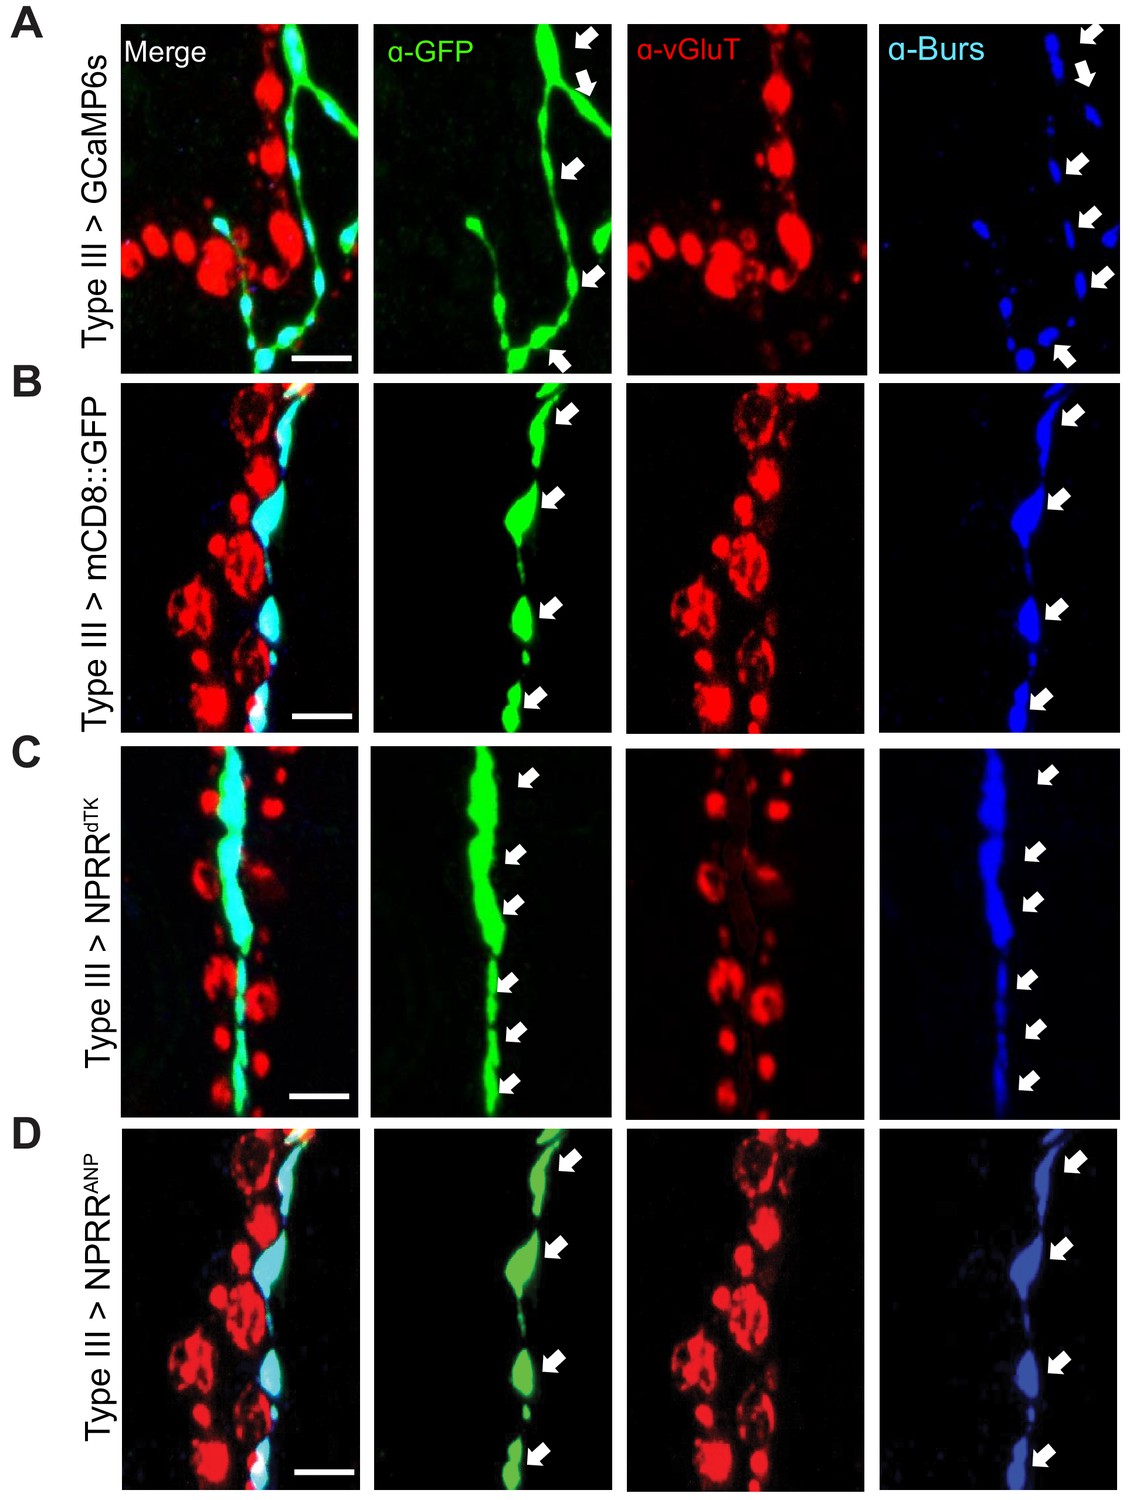
Expression of different reporters in Type III neurons in the larval NMJ.
A GAL4 line (R20C11-GAL4, named Type III-GAL4 in this report) allows specific expression in Type III neurons. Expression patterns of (A) conventional GCaMP, (B) membrane-bound GFP, (C) NPRRdTK and (D) NPRRANP using Type III-GAL4. Arrows indicate boutons in Type III neurons, which contain the neuropeptide Bursicon. Note that anti-vGluT stains other types of motor neurons, which are not labeled by the Type III-specific driver used in this experiment. Scale bar, 5 µm.
Figure 1—figure supplement 4
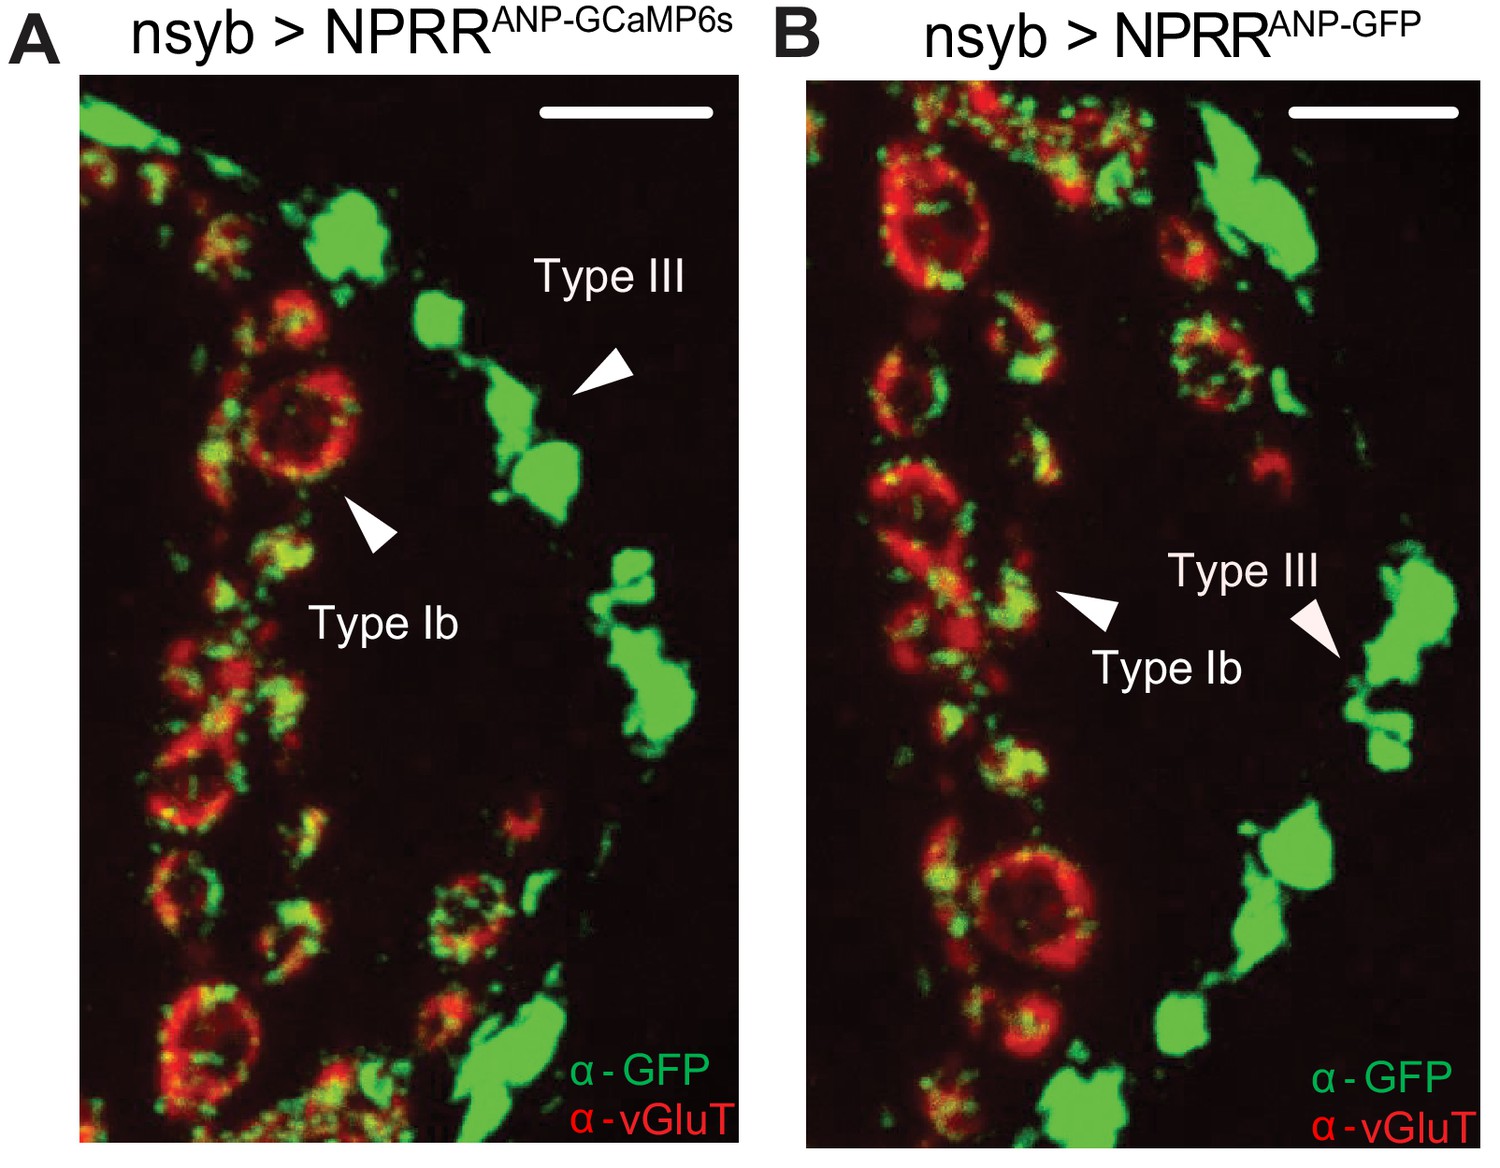
Subcellular distribution of NPRRANP and NPRRANP-GFP.
NPRRANP (labeled as NPRRANP-GCaMP6s) (A) and NPRRANP-GFP (B) were expressed pan-neuronally in the larval NMJ and double immune-labeled with antibodies to vGluT (red) and GFP (green). Note that the distribution of GFP signal is similar whether the reporter fusion is GCaMP6s (A) or GFP (B). Scale bar, 5 µm.
Figure 2 with 3 supplements
NPRR specifically reports neuropeptide release.
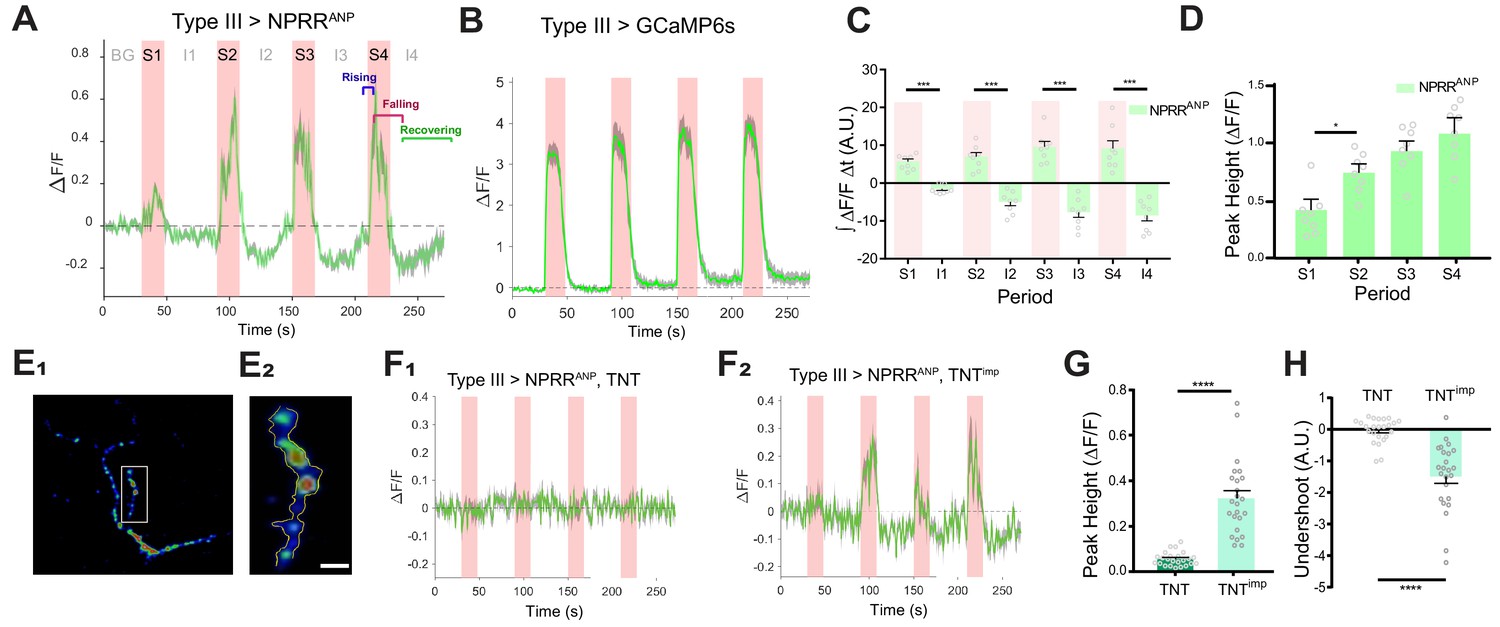
(A) Trace from a representative experiment showing changes in NPRRANP fluorescence intensity (∆F/F) in Type III motor neurons at the larval NMJ evoked by electrical stimulation. BG: background. S1-S4: Stimulation trials 1–4. I1-I4: Inter-stimulation Intervals (ISIs) 1–4. Green line: ∆F/F averaged across all boutons in the field of view. Gray shading: s.e.m envelope. Red bar: electrical stimulation trials (70 Hz). The three typical phases of the response are indicated in S4. The peak height of the response on the first trial is characteristically lower (see also (D)), and may reflect competition with unlabeled DCVs in the readily releasable pool. (B) ΔF/F traces in control flies expressing cytoplasmic GCaMP6s in Type III neurons. (C) Integrated NPRRANP ΔF/F values during trials S1-4 and intervals I1-4. A.U.: arbitrary units. n = 8. ***, p<0.001. (D) Average NPRRANP ΔF/F peak heights for trials S1-4. n = 8. *, p<0.05. Plotted values in (C–D) are mean ± s.e.m. (E1–E2) Representative selection of ROIs (yellow). Details see Materials and methods. Scale bar, 5 µm. (F) NPRRANP ΔF/F response are abolished in Type III GAL4>UAS NPRRANP flies bearing UAS-TNT (F1) but not UAS-TNTimp (F2). (G) Average peak heights of NPRRANP ΔF/F in combined stimulation trials (S1-4) from (F). ****, p<0.0001. (H) Average ‘undershoot’, defined as the integrated ΔF/F during ISIs I1-4 (see (C)). In (C–D) and (G–H).
Figure 2—figure supplement 1
Activation of NPRRANPin situ.
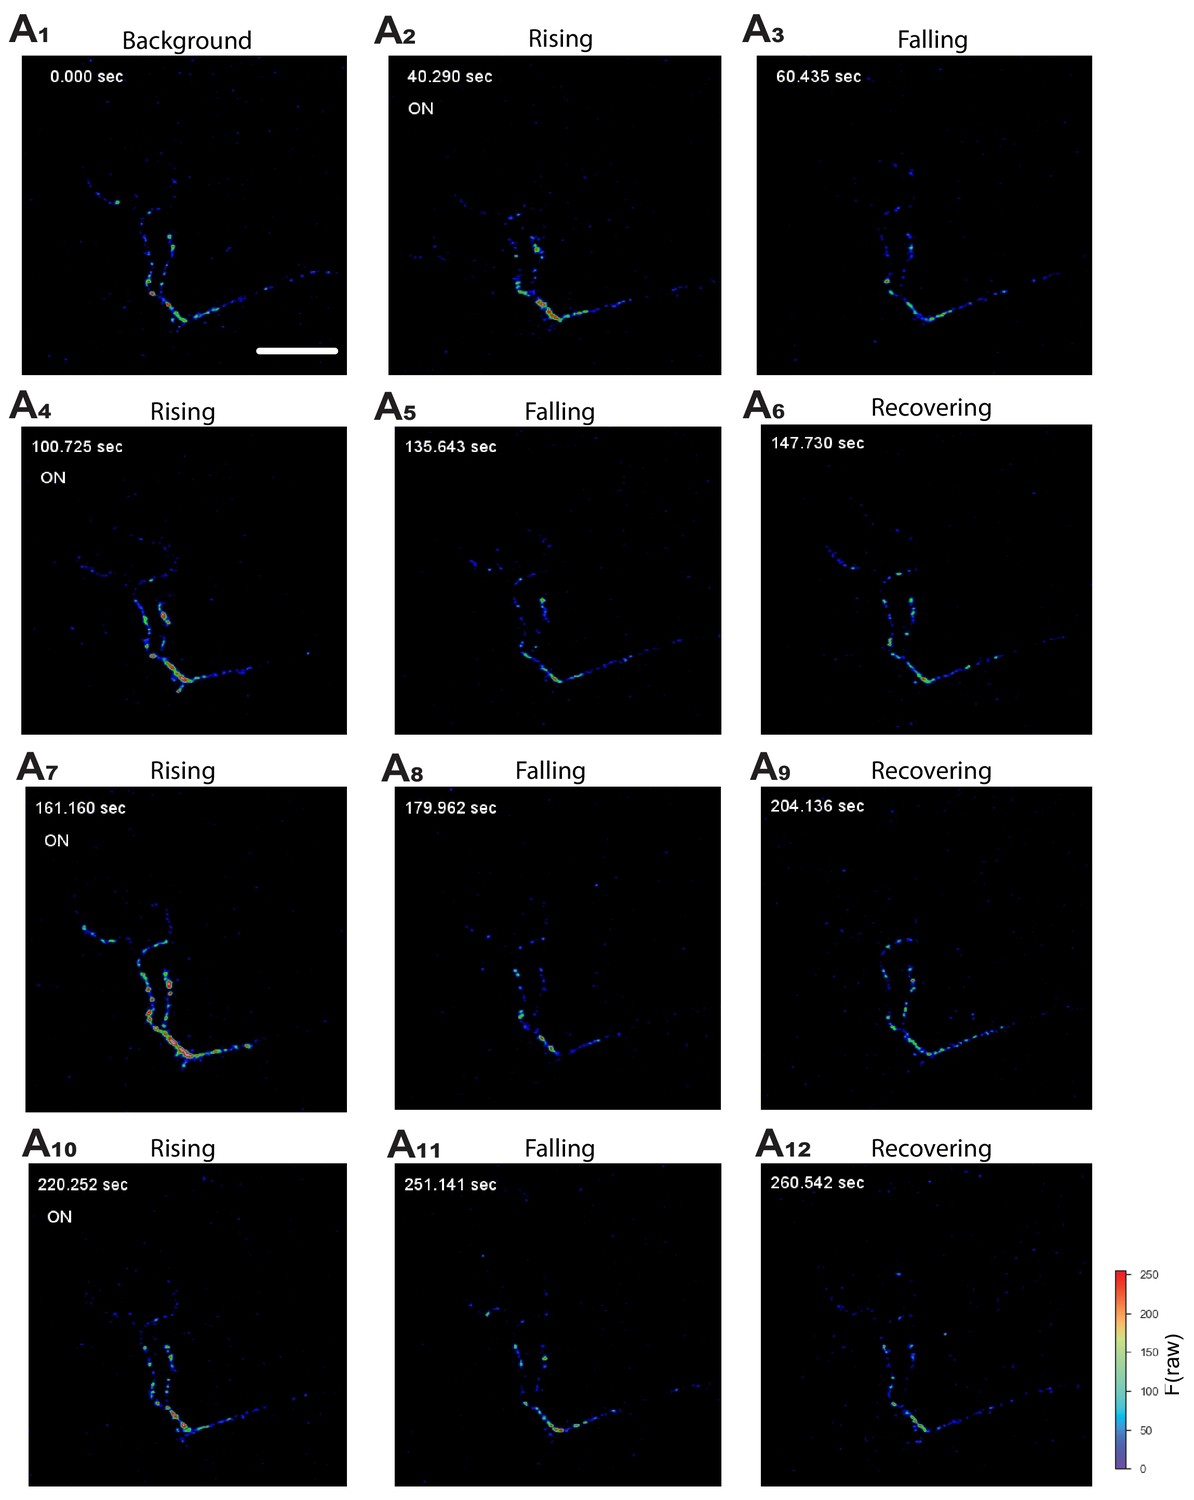
Representative still frames (A1–A12) from video recordings of NPRRANP-expressing Type III neurons at the larval NMJ. ‘On’ (A2,4,7,10) represents the onset of electrical pulses. Color bar: Raw fluorescence intensity. Scale bar, 50 µm.
Figure 2—figure supplement 2
NPRR specifically reports neuropeptide release.
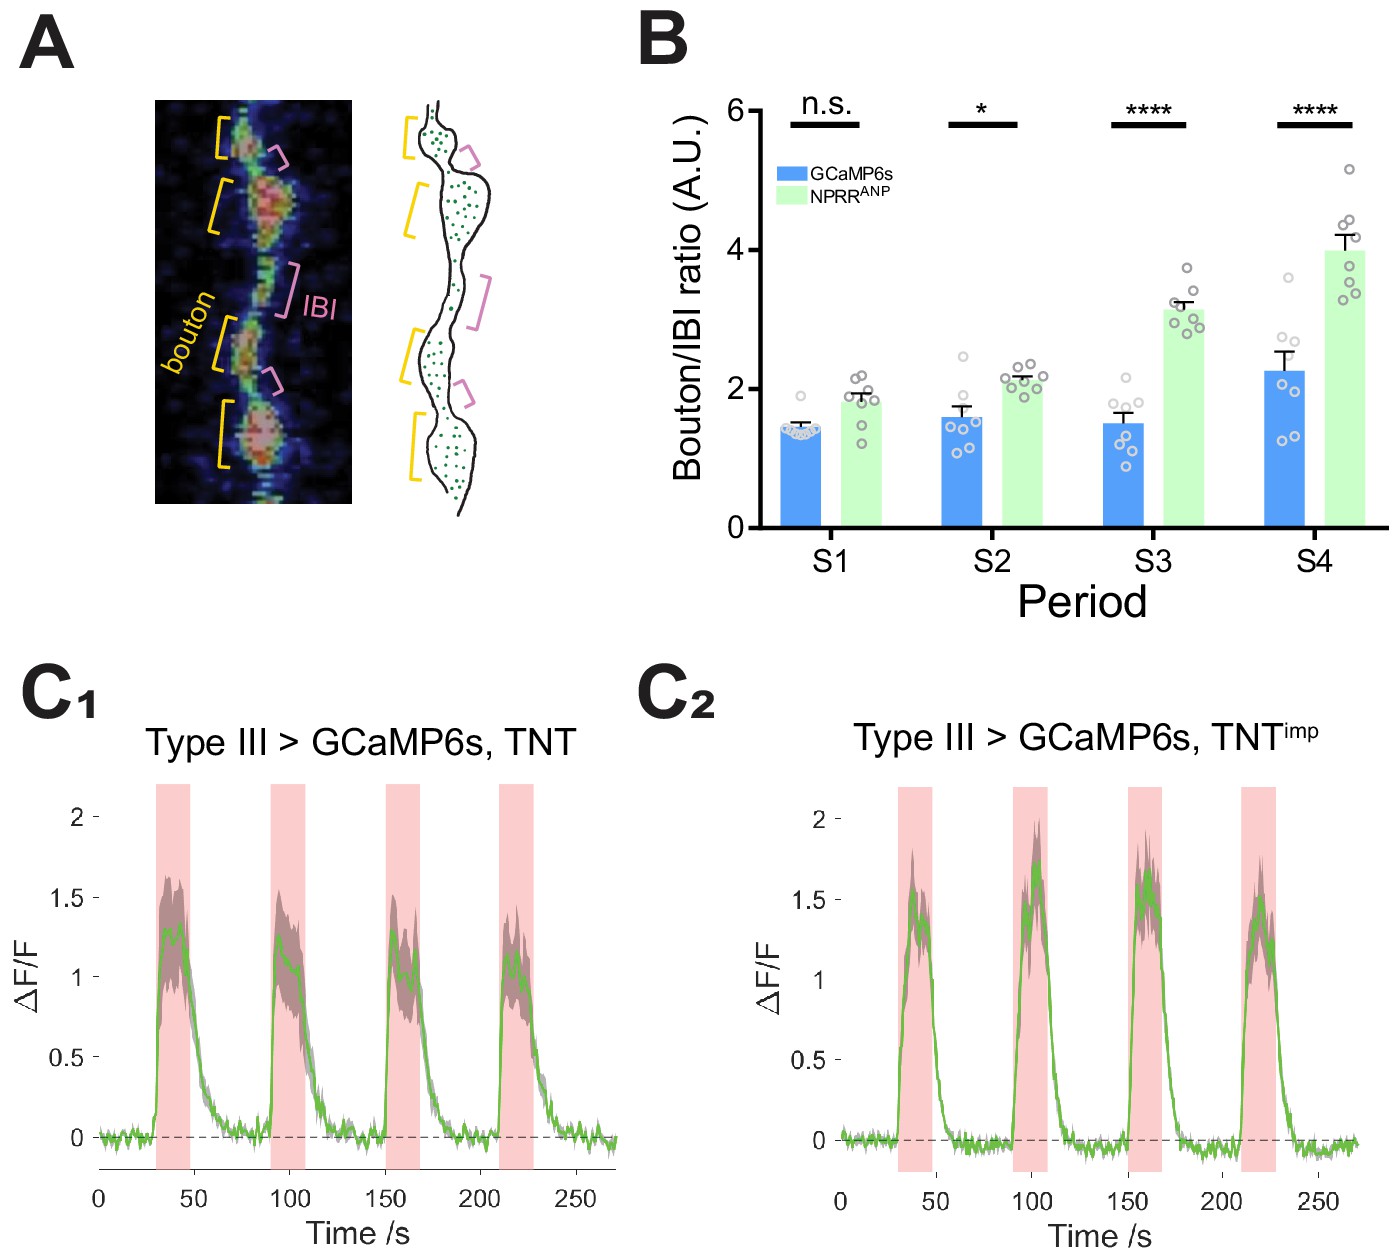
(A) Left: Segmentation of Type III neurons into boutons (orange) and inter-bouton intervals (IBIs, red). Right: Schematic illustrating DCV distribution in Type III neurons, based on photomicrograph to the left. Green dots, DCVs. (B) Average time-integrated ratio of ΔF/F in boutons/IBIs (Materials and Methods), within each stimulation periods. n.s., not significant. *, p<0.05. ***, p<0.001. ****, p<0.0001.(C) TNT does not affect GCaMP6s ΔF/F kinetics. n = 6–7. GCaMP6s peak magnitudes were reduced slightly in TNT (C1) in comparison to TNTimp (C2) preparations, perhaps reflecting partial vulnerability of the cytosolic GCaMP6s reporter to TNT-mediated cleavage and degradation. NPRRs are expected to be protected from TNT by the DCV membrane.
Figure 2—figure supplement 3
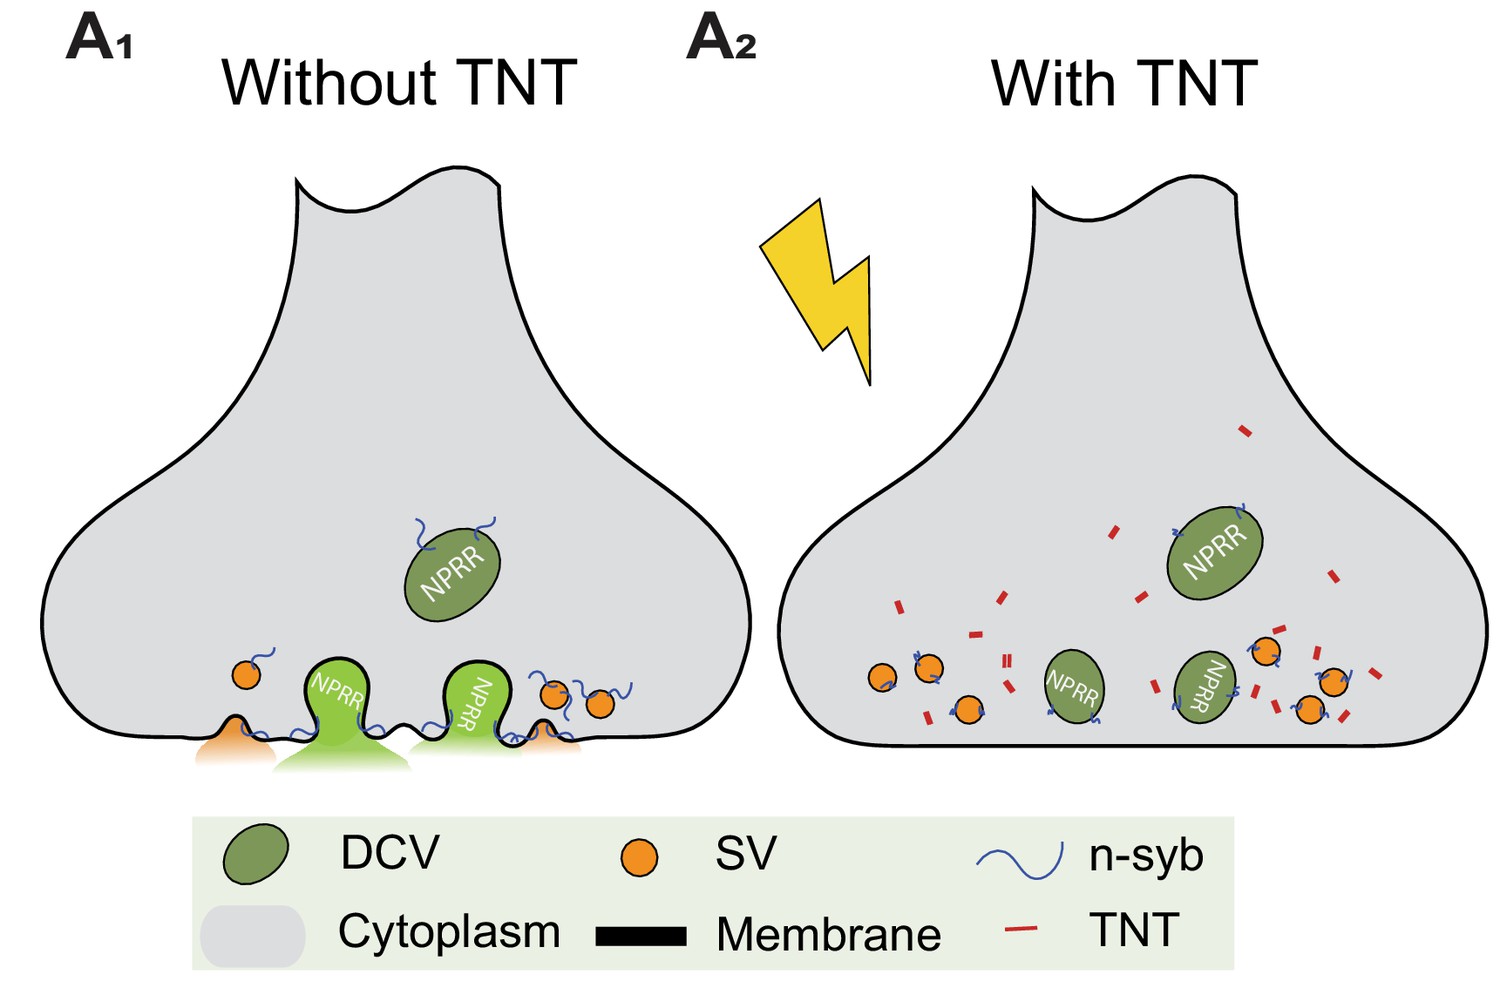
Blocking DCV fusion using Tetanus Toxin.
(A1, A2) Tetanus toxin (TNT) blocks vesicle fusion by cleavage of n-synaptobrevin (n-syb).
Figure 3
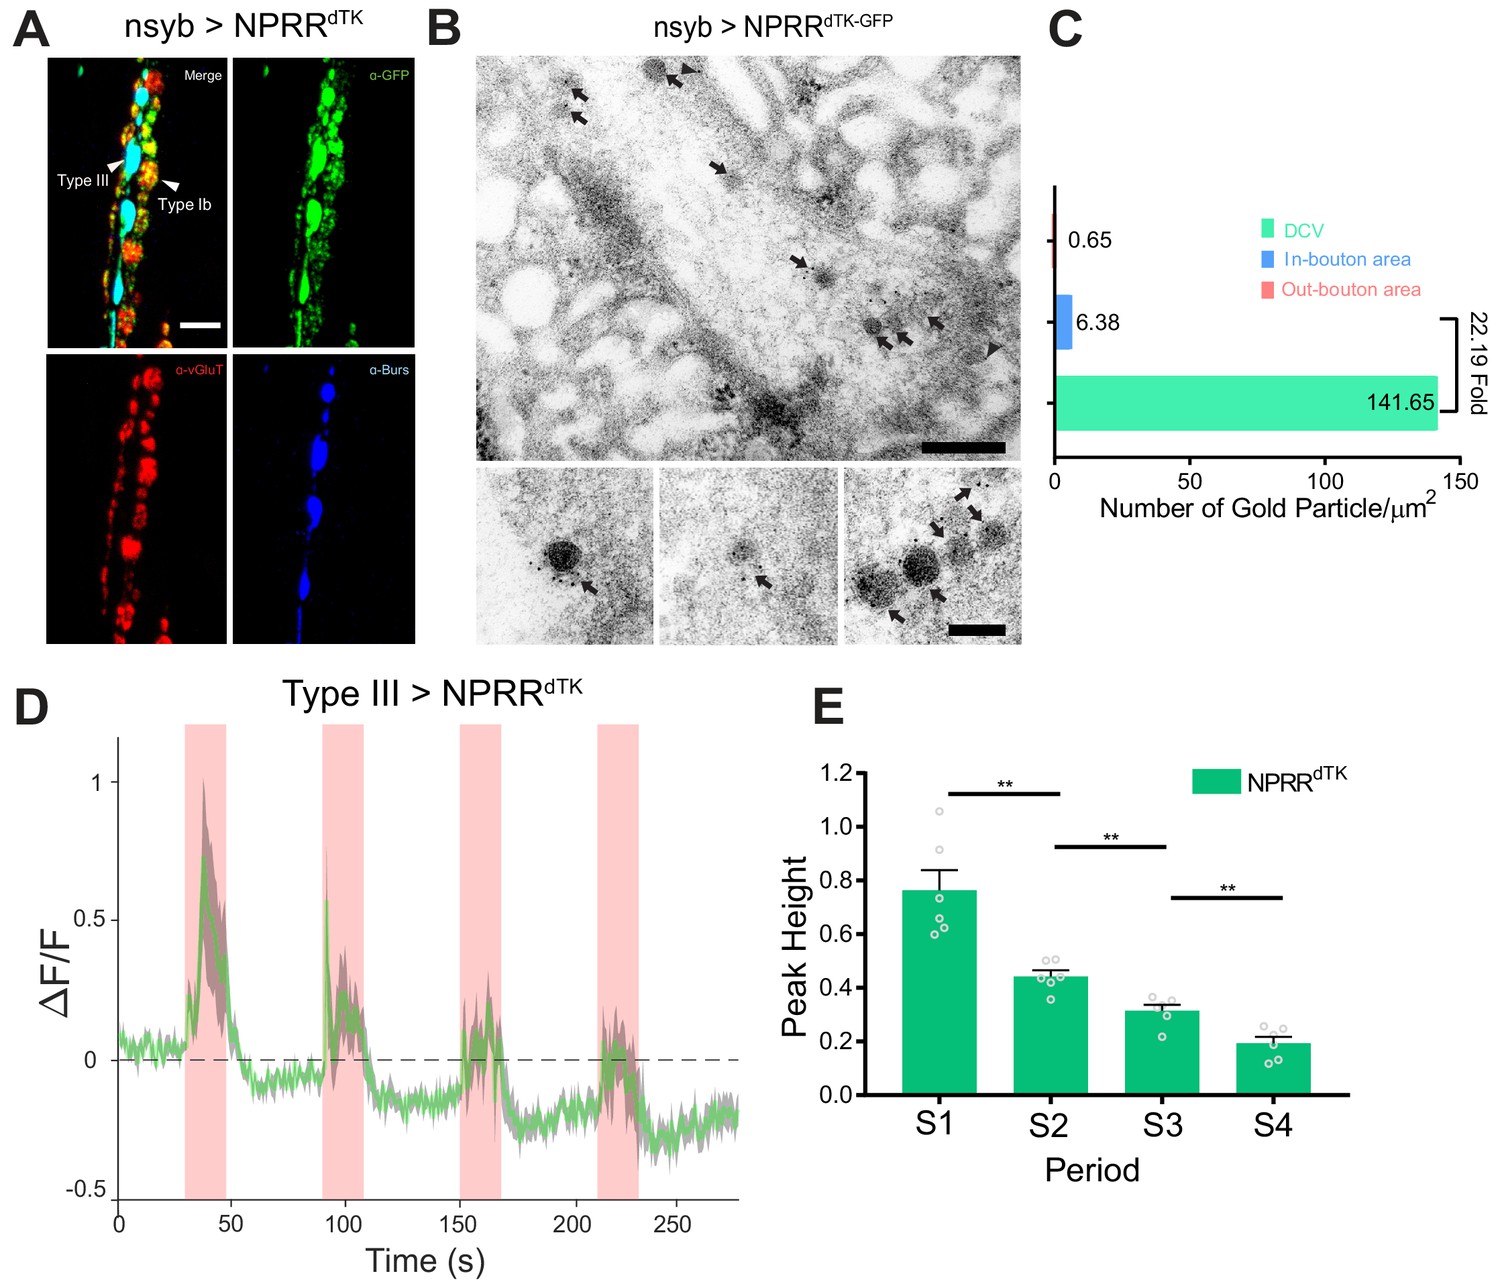
Application of the NPRR approach to a Drosophila neuropeptide.
(A) Triple immunolabeling for GFP (green), Bursicon (blue) and vGluT (red) in Type III-GAL4> UAS NPRRdTK flies. Scale bar, 5 µm. (B) TEM images of boutons immunolabeled against GFP (5 nm gold) in nsyb-GAL4>UAS NPRRdTK-GFP flies. Note strong labeling in DCVs (arrows) and bouton plasma membrane (arrowheads). Scale bar, 200 nm. Lower panel shows representative images of labeled DCVs. Scale bar,100 nm. (C) Quantification of TEM images in (B). (D) NPRRdTK ΔF/F curve; stimulation conditions as in Figure 2A. (E) Average NPRRdTK ΔF/F peak height above pre-stimulation baseline (corrected; see Materials and methods) for stimulation trials S1-4. n = 6. **, p<0.01.
-
Figure 3—source data 1
Raw data for Immuno-EM experiments (dTK).
- https://doi.org/10.7554/eLife.46421.014
Figure 4 with 1 supplement
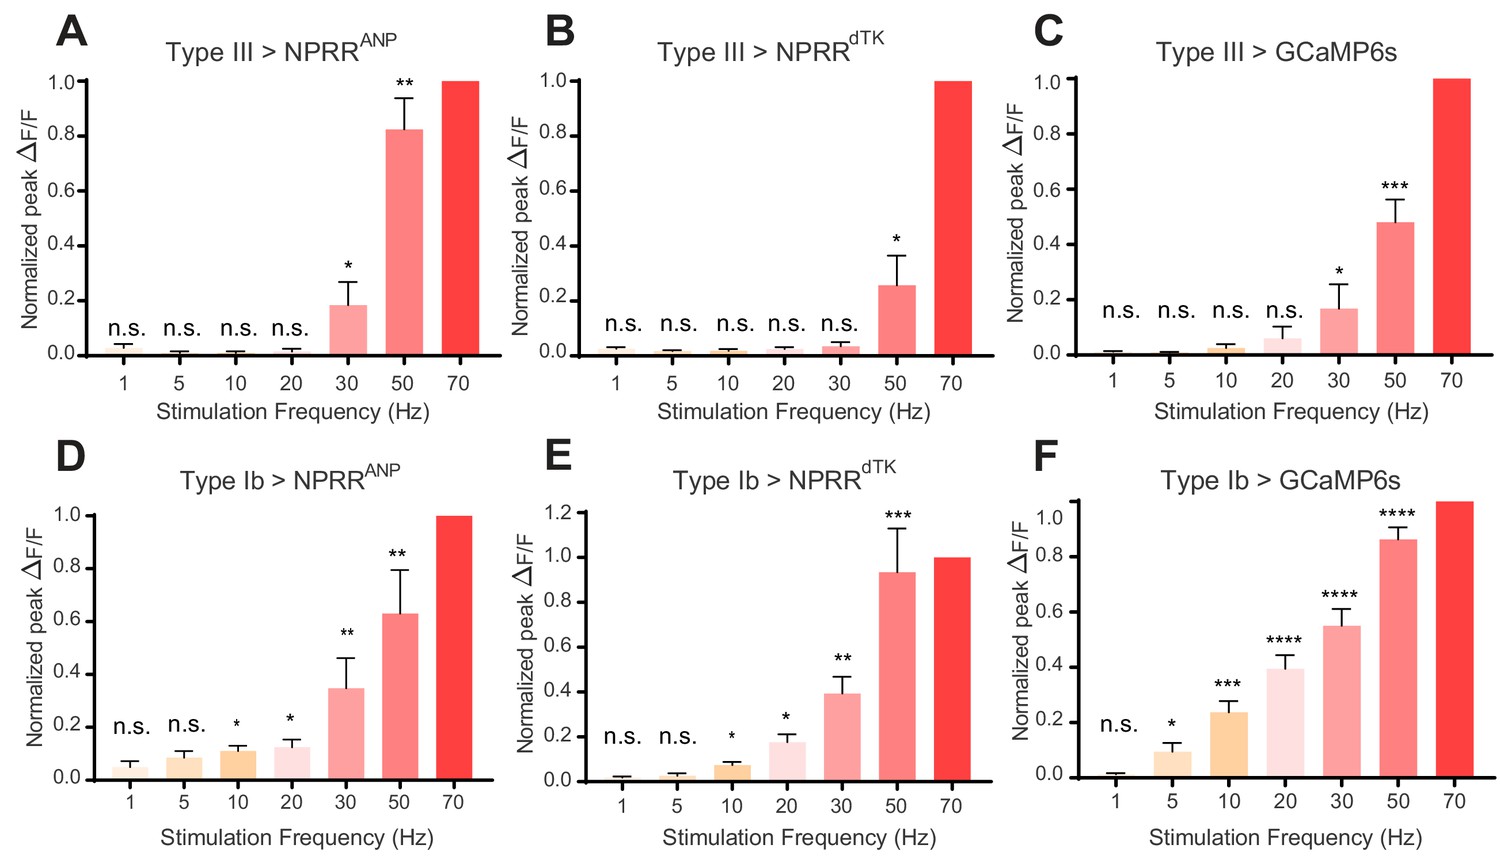
NPRR reveals distinct cell-type specific peptide release properties.
For each preparation, a series of stimulation trials were delivered at frequencies from 1 Hz to 70 Hz, as indicated. In-stimulation response peaks were normalized to 70 Hz. The normalized peaks of NPRRs or calcium responses (measured with cytosolic GCaMP6s) were pooled and plotted for both Type III (A-C) and Type Ib (D-F) neurons. Responses were compared to zero. n = 6–12. n.s., not significant. *, p<0.05. **, p<0.01. ***, p<0.001. ****, p<0.0001.
Figure 4—figure supplement 1

Comparison of NPRR response at 30 and 50 Hz.
Normalized ΔF/F peaks in at 30 Hz (A) and 50 Hz (B) electrical stimulation in Figure 4A,B,D,E are replotted and compared. n = 6–7. *, p<0.05. **, p<0.01. n.s., not significant.
Author response image 1
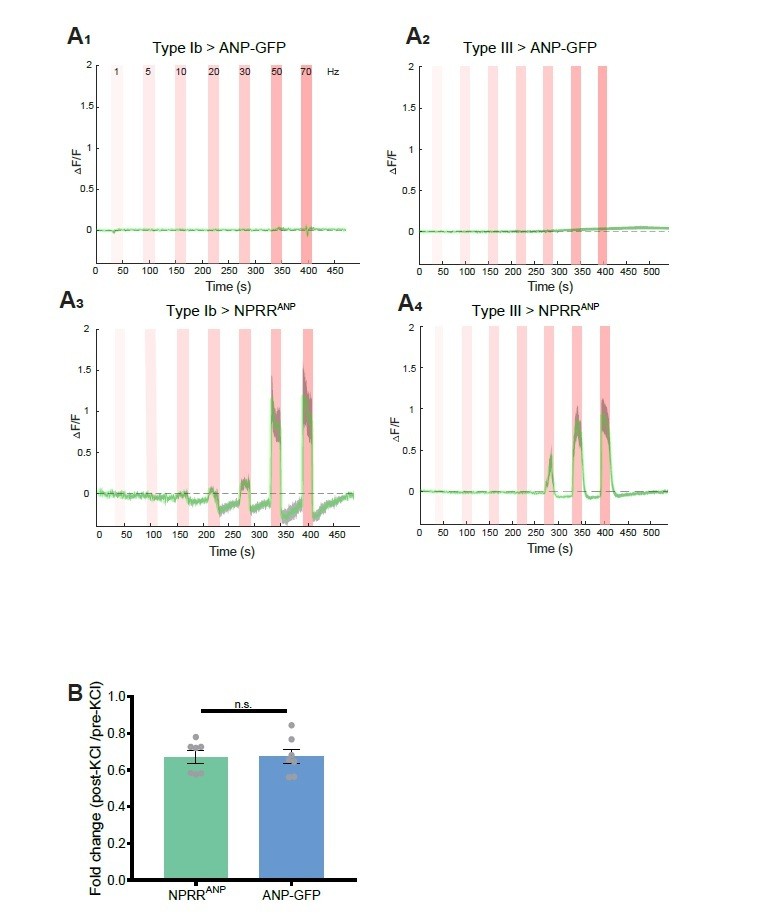
Benchmarking NPRR with ANP-GFP.
Trace from a representative experiment showing changes in fluorescence intensity (∆F/F) of ANP-GFP and NPRRANP evoked by electrical stimulation (Red bar, frequency shown in A1). No significant ANP-GFP fluorescent change was observed within stimulations, in both Type Ib (A1) and Type III neurons (A2), while NPRRANP displays distinct characteristics in Type Ib (A3) and Type III(A4). Green line: mean ∆F/F; Grey shading: s.e.m envelope.
Videos
Video 1
Activation of NPRRANPin situ.
Representative video recording of NPRRANP-expressing Type III neurons at the larval NMJ. In the preparation, the Type III neuron was stimulated as described in Figure 2A.
Tables
Key resources table
| Reagent type (species) or resource | Designation | Source or reference | Identifiers | Additional information |
|---|---|---|---|---|
| Genetic reagent (D. melanogaster) | UAS-NPRRANP (attp2) | this paper | See Materials and methods, subsection Construction of transgenic animals. | |
| Genetic reagent (D. melanogaster) | UAS-NPRRdTK (attp2) | this paper | Same as above. | |
| Genetic reagent (D. melanogaster) | UAS-TNTimp | Bloomington Drosophila Stock Center | BDSC:28840; FLYB:FBti0038575; RRID:BDSC_28840 | Flybase symbol: w[*]; P{w[+mC]=UAS TeTxLC.(-)V}A2 |
| Genetic reagent (D. melanogaster) | UAS-TNT | Bloomington Drosophila Stock Center | BDSC:28838; FLYB:FBti0038527; RRID:BDSC_28838 | Flybase symbol: w[*]; P{w[+mC]=UAS TeTxLC.tnt}G2 |
| Genetic reagent (D. melanogaster) | w; +; UAS-GCaMP6s (su(Hw)attp1) | Hoopfer et al., 2015 | ||
| Antibody | anti-GFP (chicken polyclonal) | Aveslab | Aveslab: GFP-1020; RRID:AB_2307313 | (1:250:Immuno-EM, 1:1000: IHC) |
| Antibody | anti-ANP (rabbit polyclonal) | abcam | abcam #14348 | (1:500) |
Additional files
-
Source code 1
Code for data analysis.
- https://doi.org/10.7554/eLife.46421.018
-
Supplementary file 1
Current techniques for neuropeptide release measurement.
Summary of current techniques used for neuropeptide release, including microdialysis, antibody-coated microprobes, GFP-tagged propeptide imaging and NPRR. NA, ‘not applicable’
- https://doi.org/10.7554/eLife.46421.019
-
Supplementary file 2
Stereological labeling estimates.
Stereological labeling estimations of NPRRANP-GFP and NPRRdTK-GFP, respectively, in Type Ib neurons, or in Type Ib and Type III neurons. Biological controls and internal controls are described in Materials and methods. SNR: Signal-to-Noise Ratio.
- https://doi.org/10.7554/eLife.46421.020
-
Supplementary file 3
Complete genotypes of transgenic flies used in this study.
Summary of complete genotypes of transgenic flies used in this study.
- https://doi.org/10.7554/eLife.46421.021
-
Transparent reporting form
- https://doi.org/10.7554/eLife.46421.022
Download links
A two-part list of links to download the article, or parts of the article, in various formats.
Downloads (link to download the article as PDF)
Open citations (links to open the citations from this article in various online reference manager services)
Cite this article (links to download the citations from this article in formats compatible with various reference manager tools)
Imaging neuropeptide release at synapses with a genetically engineered reporter
eLife 8:e46421.
https://doi.org/10.7554/eLife.46421


