Cystic fibrosis drug ivacaftor stimulates CFTR channels at picomolar concentrations
- Semmelweis University, Hungary
Figures
Figure 1
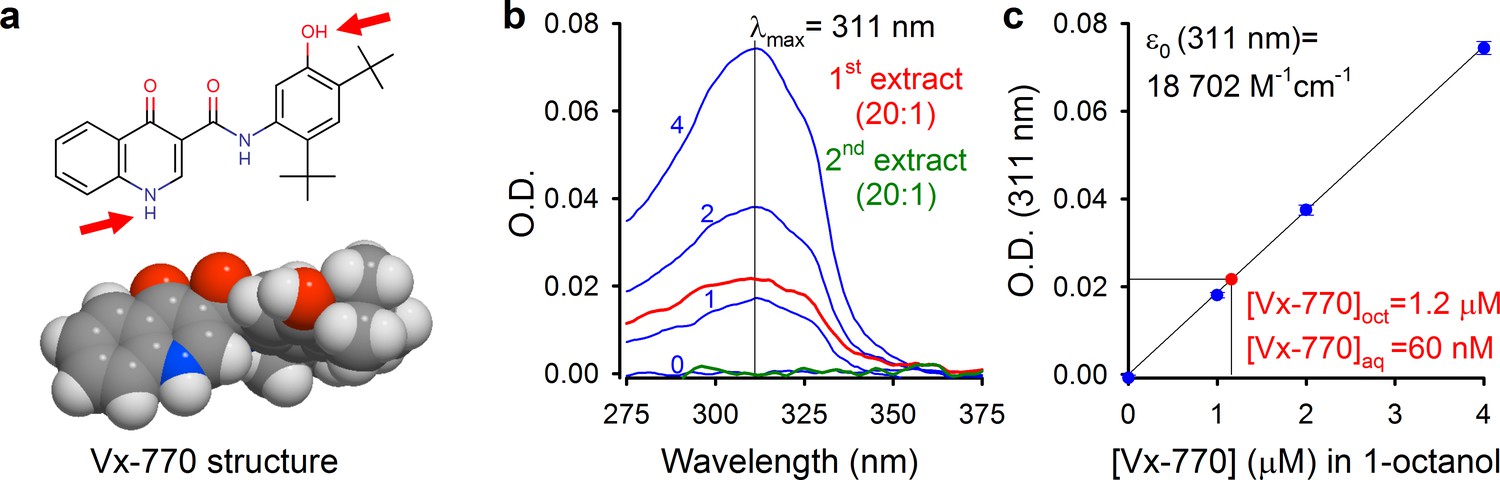
Determination of aqueous solubility for Vx-770.
(a) Structural formula of Vx-770 and 3D surface rendering by Molinspiration (https://www.molinspiration.com/cgi-bin/properties). Red arrows identify potentially deprotonatable groups. (b) Absorption (O.D.) spectra for 0, 1, 2, and 4 μM Vx-770 dissolved in 1-octanol (blue spectra), and for two sequential 1-octanol extracts (20:1 volume ratio) of an aqueous saline saturated with Vx-770 (red and green spectra). (c) Calibration curve of O.D. at 311 nm for Vx-770 in 1-octanol (blue dots (mean ± S.E.M. from 3 measurements) and linear regression line), and quantification of [Vx-770] in the first 1-octanol extract (red dot).
Figure 2
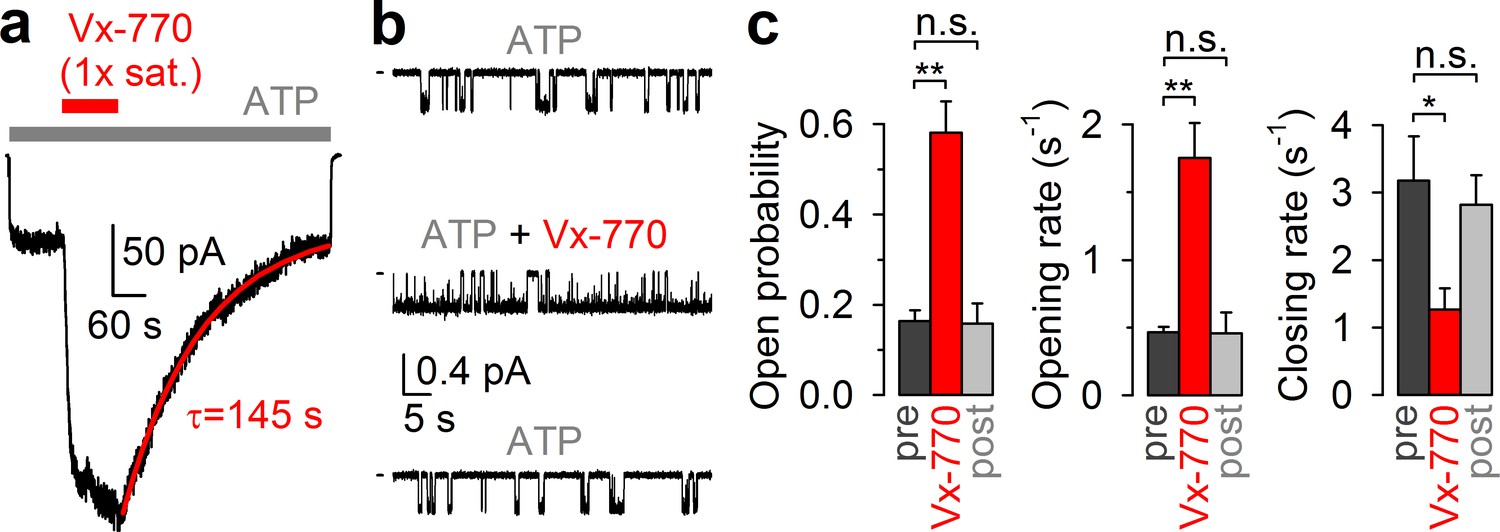
CFTR current stimulation by Vx-770 is fully reversible.
(a) Macroscopic WT CFTR channel current, elicited in an inside-out patch by exposure to 2 mM ATP (gray bar), is enhanced ~4-fold by application of a 1x saturated (~62 nM) Vx-770 solution (red bar), and relaxes back to its pre-drug level following drug removal. Red line is a fitted exponential with time constant (τ) indicated. Channels had been pre-phosphorylated by an ~1-min exposure to 300 nM PKA catalytic subunit, membrane potential is -40 mV. (b) 1-min segments of recording from a single pre-phosphorylated WT CFTR channel gating in 2 mM ATP before drug exposure (top), in the presence of 0.05x saturated (~3 nM) Vx-770 (center; segment starts ~4 min after drug addition), and long after Vx-770 removal (bottom, segment starts ~9 min after drug removal). (c) Open probabilities (left), opening rates (center), and closing rates (right) of single pre-phosphorylated WT CFTR channels gating in 2 mM ATP, before (dark gray bars), during (red bars), and after (light gray bars) exposure to 0.05x saturated (~3 nM) Vx-770. Bars show mean ± S.E.M. from 9 experiments.
Figure 3
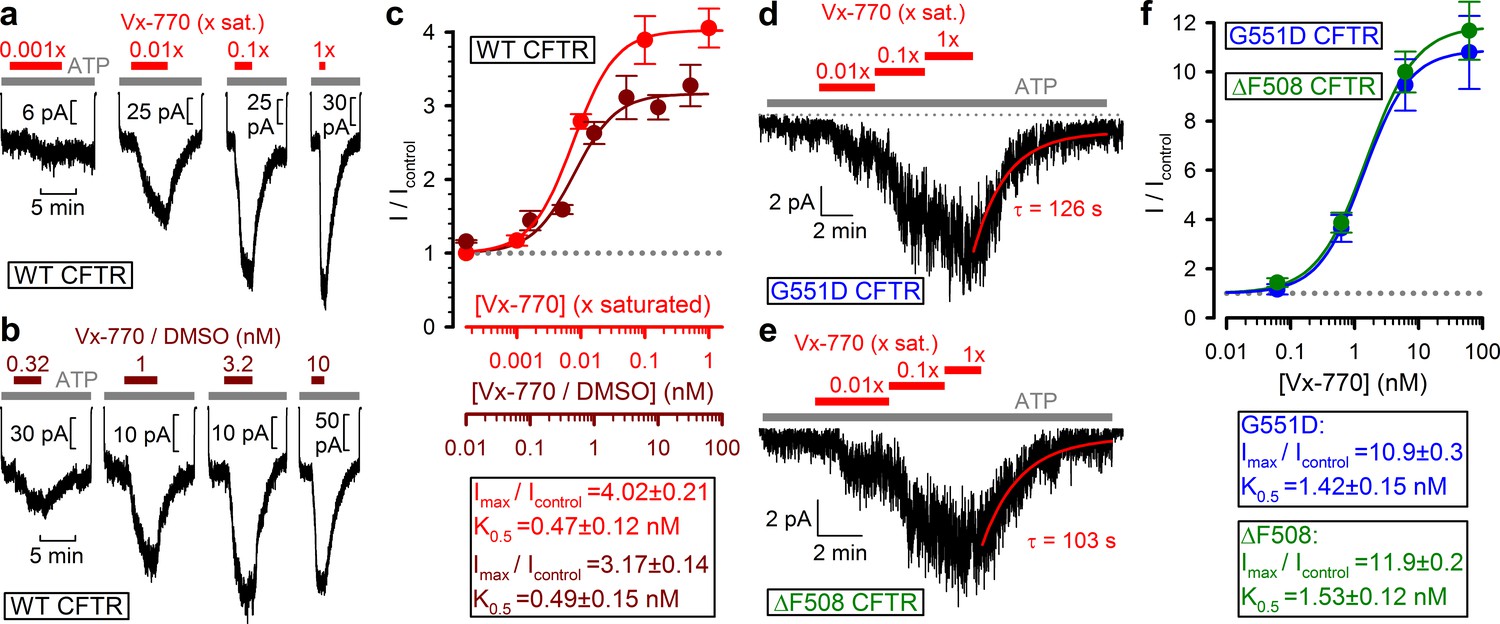
Vx-770 stimulates CFTR currents already at subnanomolar concentrations.
(a-b) Macroscopic WT CFTR currents elicited by 2 mM ATP are reversibly stimulated by exposure (red and brown bars) to indicated concentrations of Vx-770, diluted either from a 1x saturated aqueous stock (a) or from a 10-mM stock dissolved in DMSO (b). (c) Fractional stimulation of WT CFTR currents by Vx-770 diluted from a 1x saturated aqueous (red symbols and abscissa), or a DMSO-based (brown symbols and abscissa), stock. Abscissae are aligned based on the aqueous solubility of Vx-770 (~62 nM). (d–e) Quasi-macroscopic currents of prephosphorylated G551D (d) and ΔF508 (e) CFTR channels in 2 mM ATP are reversibly stimulated by exposure (red bars) to indicated concentrations of Vx-770, diluted from a 1x saturated aqueous stock. Deactivation time courses following drug removal are fitted with single exponentials (red lines). (f) Fractional stimulation of G551D (blue symbols) and ΔF508 (green symbols) CFTR currents by Vx-770 diluted from a 1x saturated aqueous stock; abscissa has been calibrated. Symbols in (c) and (f) show mean ± S.E.M. from 3-13 experiments, solid curves are fits to an adapted Hill equation (Materials and methods) with parameters plotted. Hill coefficients were 1.31±0.65 and 1.32±0.47 for WT in Vx-770 or Vx-770/DMSO, 1.12±0.07 for ΔF508, and 1.22±0.10 for G551D CFTR.
Figure 4
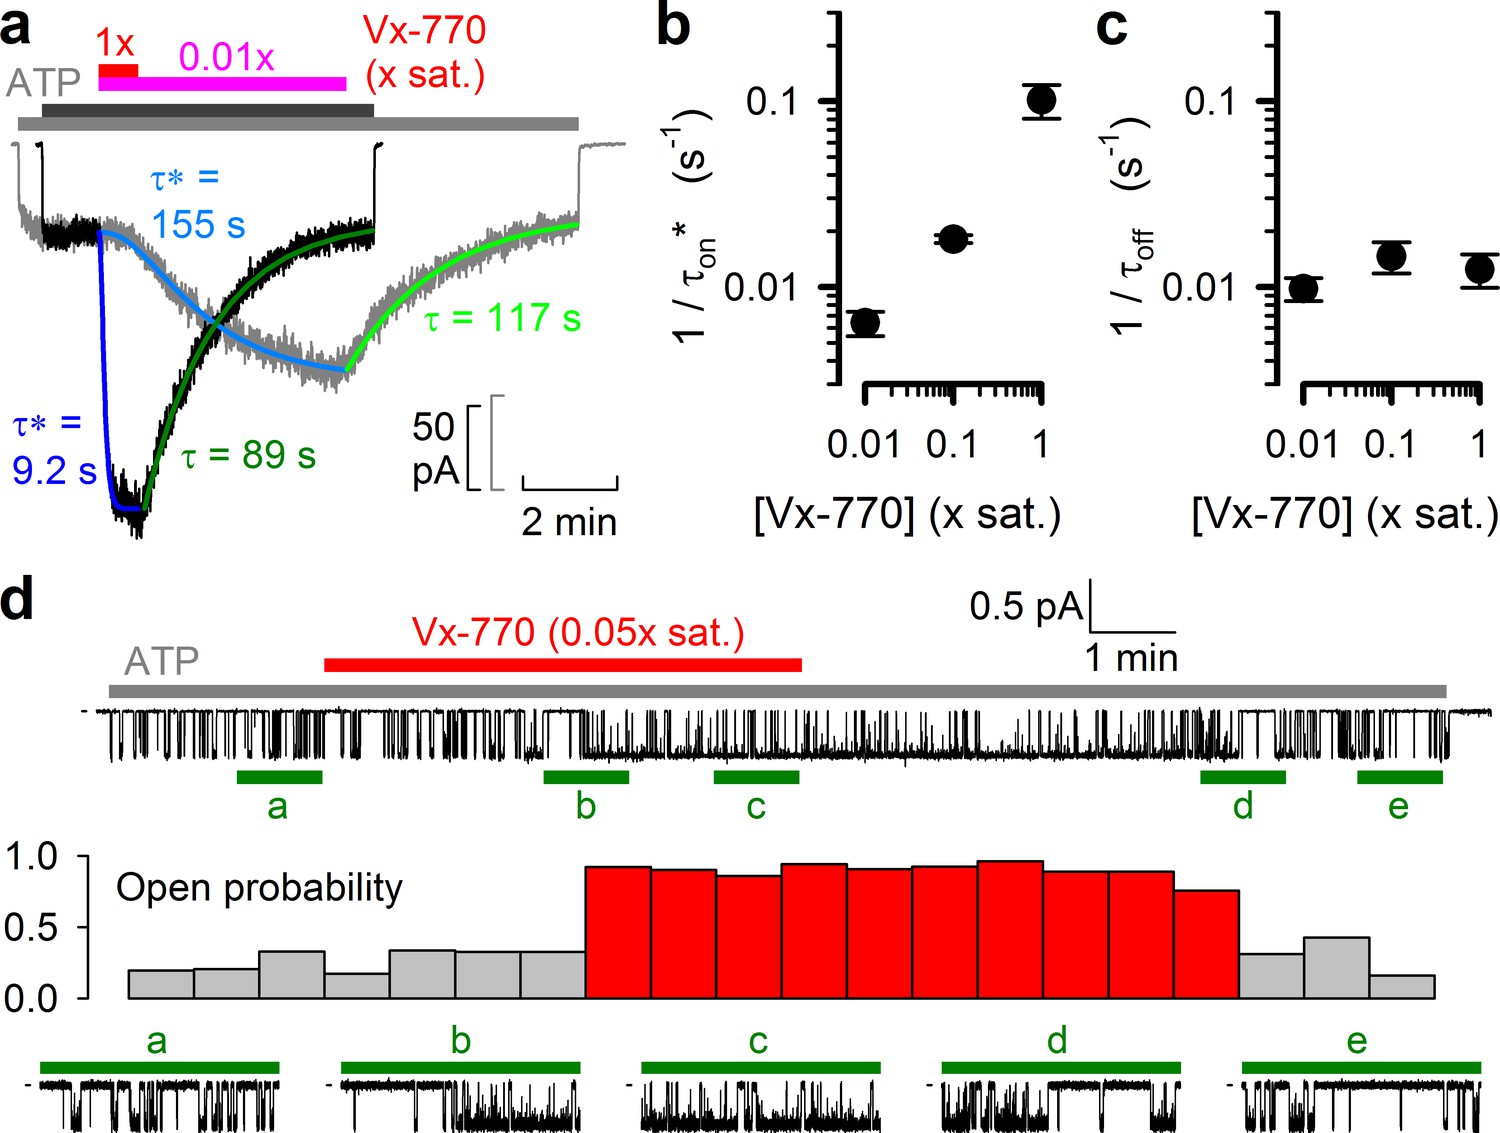
Delayed activation by low nanomolar Vx-770 suggests multiple sequential slow steps in activation process.
(a) Stimulation of macroscopic WT CFTR currents in 2 mM ATP by exposure to a 1x (black trace; dark gray and red bar) or an 0.01x (gray trace; light gray and purple bar) saturated aqueous solution of Vx-770. Current amplitudes have been rescaled by their pre-drug values, and superimposed traces are shown synchronized to the time point of drug addition. Sigmoidal activation time courses are fitted (blue lines) by a sequential three-step mechanism, and apparent activation time constants (τ*, see Materials and methods) are plotted. Deactivation time courses are fitted (green lines) by single exponentials with time constants (τ) indicated. (b–c) Overall rates of current stimulation (1/τon*; b) and rates of deactivation (1/τoff; c) in response to addition and removal, respectively, of indicated concentrations of Vx-770. Mean ± S.E.M. from 5-7 experiments. (d) (Top) Continuous ~16-min recording from a single prephosphorylated WT CFTR channel gating in 2 mM ATP (gray bar) and exposed for ~6 min to 0.05x saturated (~3 nM) Vx-770 (red bar). (Center) Open probability calculated over sequential 46-s intervals for the recording shown on top. Note sudden switch from low- (gray bars) to high-activity gating (red bars) ~3 min after initiation of drug exposure, and a similarly sudden switch back to low-activity gating ~5 min after drug removal. (Bottom) 1-min segments marked by green bars in the recording on top are shown at an expanded time scale.
Figure 5 with 1 supplement
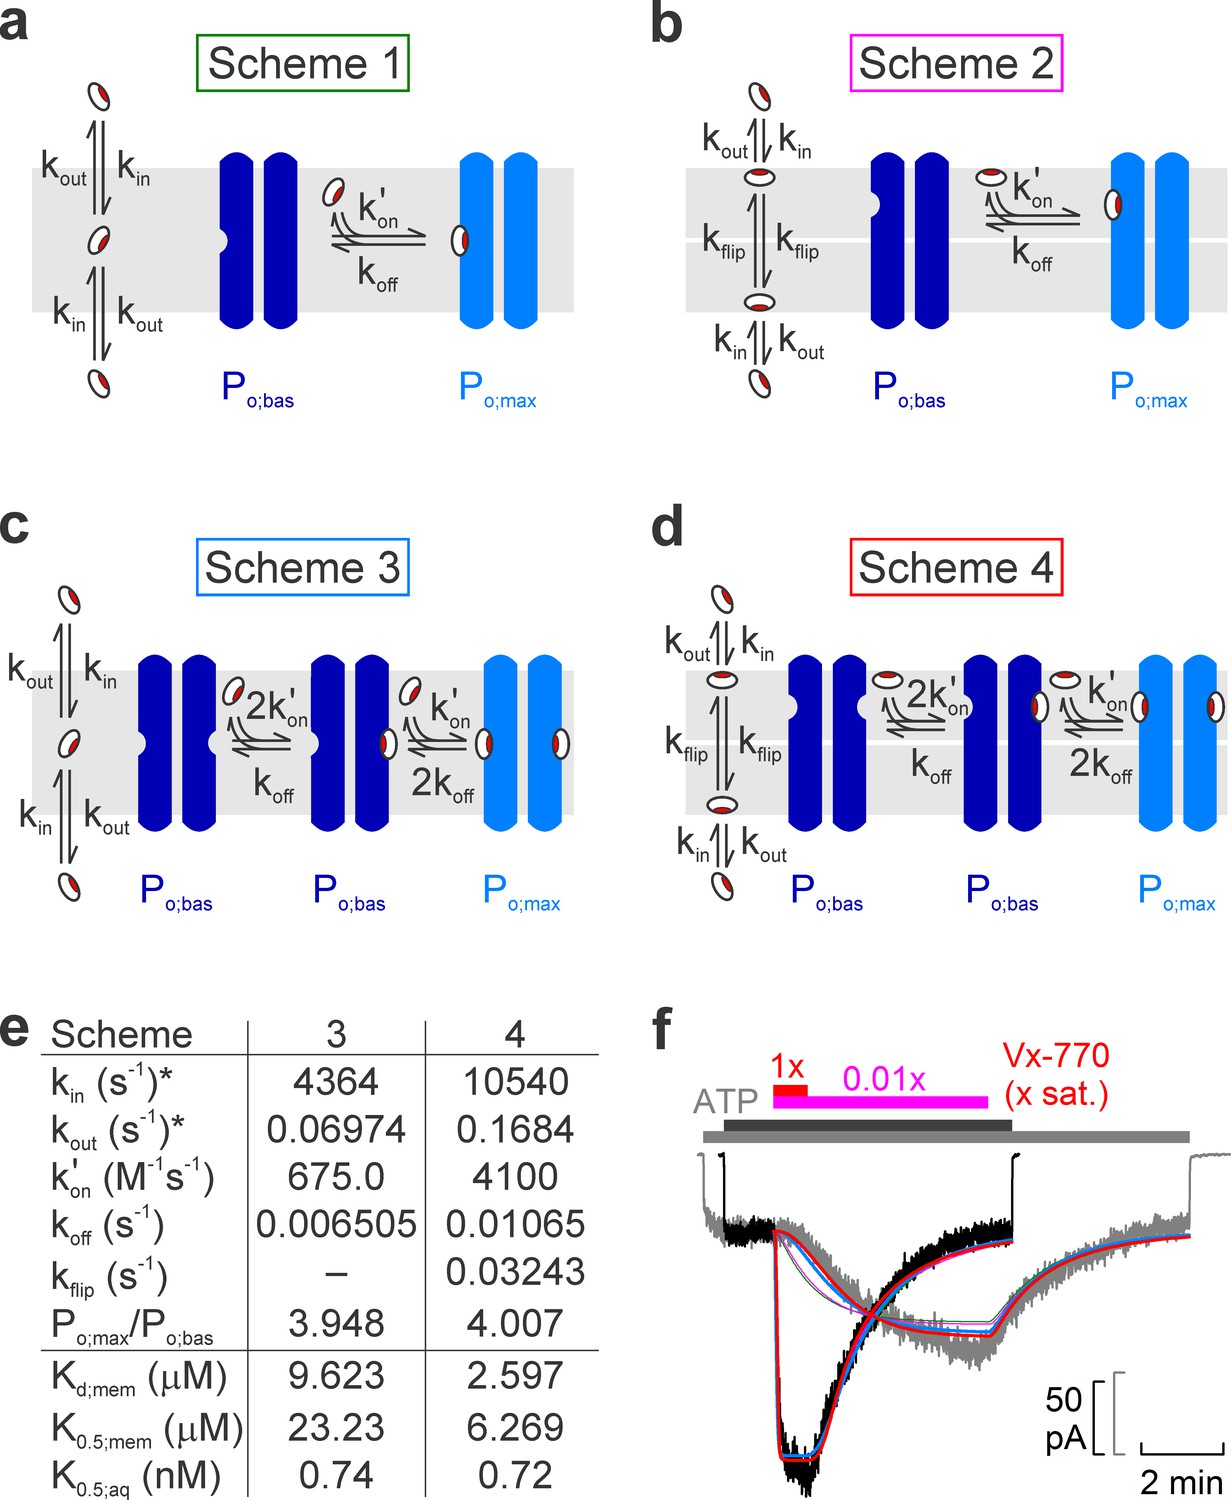
Model fitting of activation/deactivation time courses in response to cytosolic addition/removal of Vx-770.
(a-d) Cartoon representation of schemes with one (a, b) or two (c, d) drug binding sites, and one (a, c) or two (b, d) membrane compartments (cytoplasmic, bottom; extracellular, top). (e) Fit parameters obtained from global fits of Schemes 3 (left column) and 4 (right column) to the data set shown in f. *Parameters kin and kout were constrained through kin/kout = Doct/wat(pH=7.1) = 62580. Parameters Kd;mem, K0.5;mem, and K0.5;aq were calculated from the fit parameters as described in Materials and methods. (f) Pair of normalized macroscopic WT CFTR current activation/deactivation time courses recorded in response to cytosolic addition/removal of 0.01x saturated (gray trace) and 1x saturated (black trace) concentrations of Vx-770 (replotted from Figure 4a), and ensemble fits by the models in a–d (colored lines; green, Scheme 1, pink, Scheme 2, blue, Scheme 3, red, Scheme 4). See also Figure 5—figure supplement 1.
Figure 5—figure supplement 1
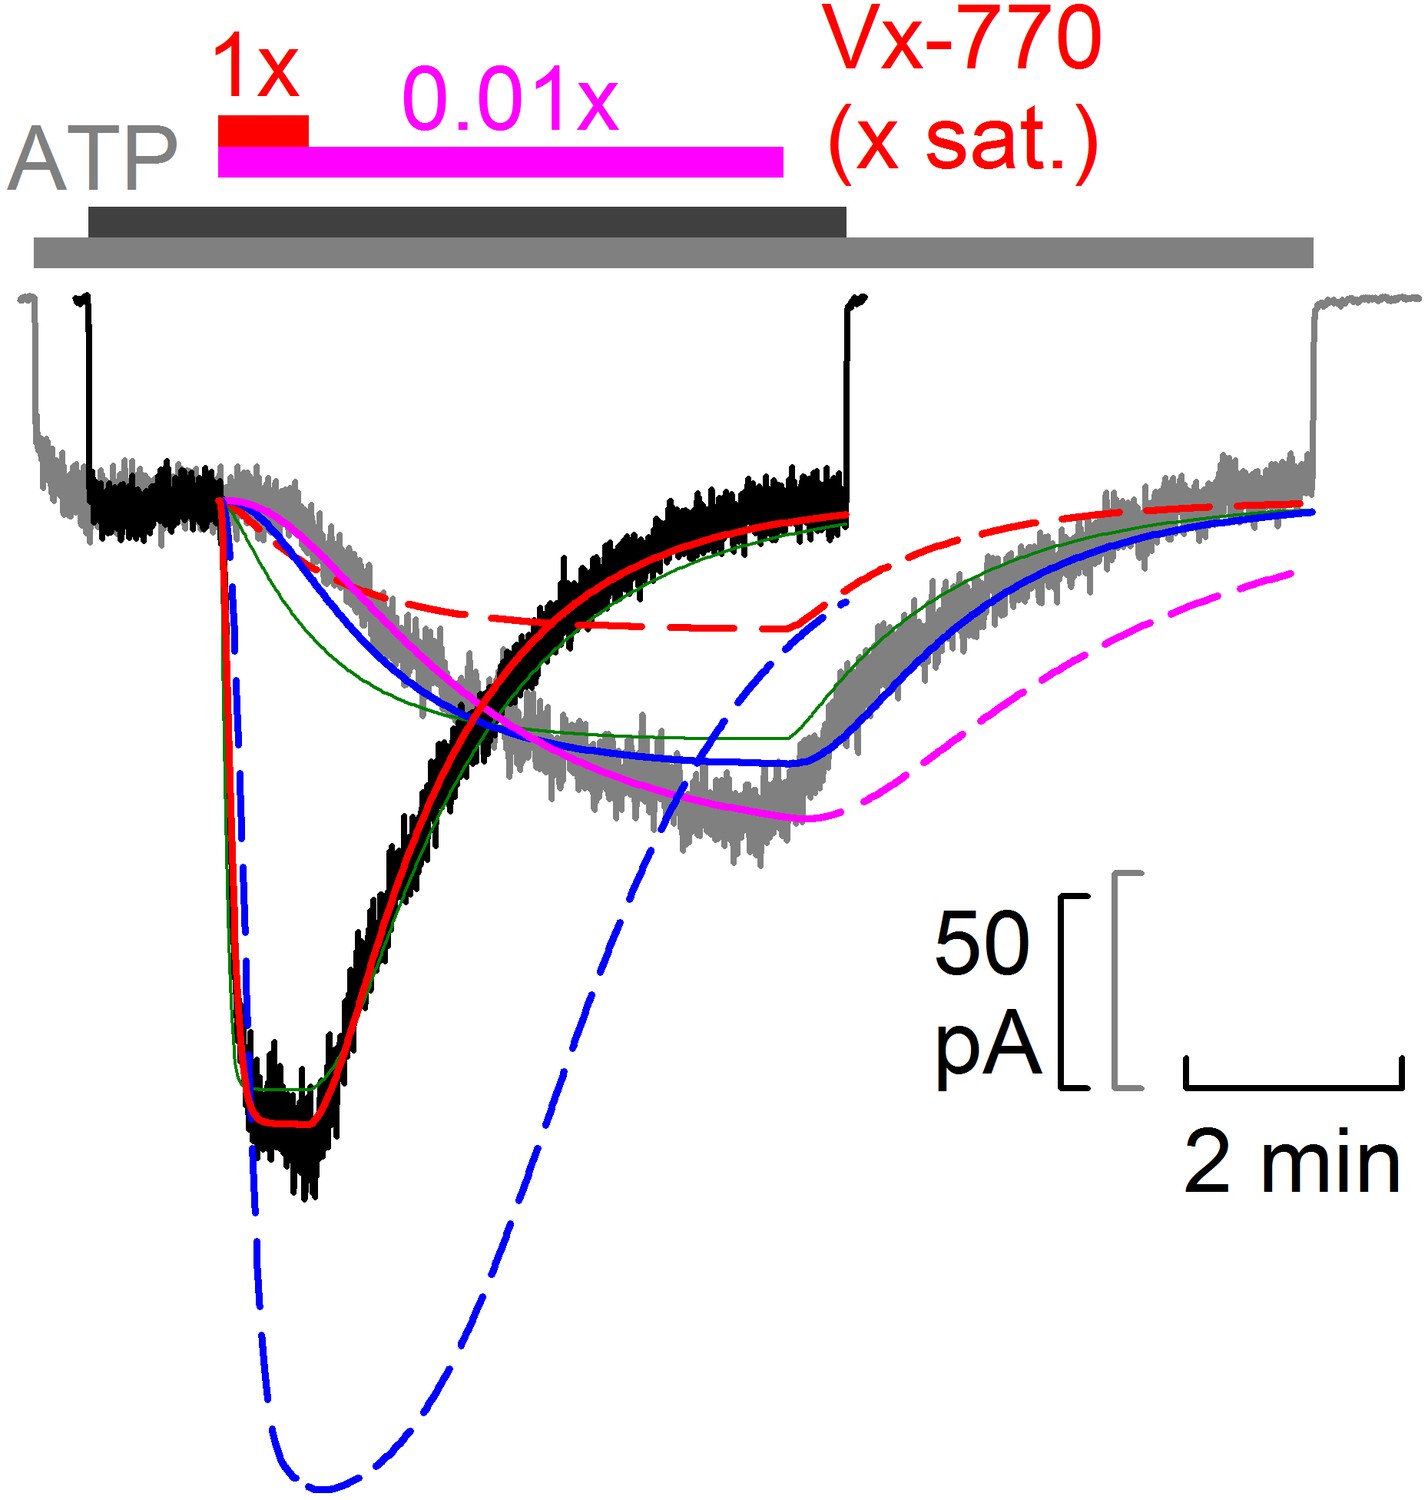
Scheme 2 adequately fits individual on- and off- time courses but not the global data set.
Pair of normalized macroscopic WT CFTR current activation/deactivation time courses recorded in response to cytosolic addition/removal of 0.01x saturated (gray trace) and 1x saturated (black trace) concentrations of Vx-770 (replotted from Fig. 5f), and fits by Scheme 2 (colored lines). Pink: fit of Scheme 2 to on- time course of the gray current trace (solid pink line), and off- time course predicted for the same trace by the obtained fit parameters (dashed pink line). Blue: fit of Scheme 2 to the entire gray current trace (solid blue line), and time course predicted for the black current trace using the same parameters (dashed blue line). Red: fit of Scheme 2 to the entire black current trace (solid red line), and time course predicted for the gray current trace using the same parameters (dashed red line). Green lines replot, as a comparison, the global fit of the entire data set by Scheme 1 (from Figure 5).
Tables
Table 1
Solubilities of Vx-770 in various solvents at 25°C.
Solubilities were determined as described in detail in Materials and methods. *Aqueous saline with composition described in Materials and methods.
| Solvent | S (mol/L) |
|---|---|
| water (pH=7.1)* | 6.2·10-8 |
| pentane | 1.8·10-5 |
| octane | 2.6·10-3 |
| ethanol | 3.1·10-3 |
| 1-octanol | 3.9·10-3 |
| DMSO | 7.7·10-1 |
Table 2
Model fit parameters for Schemes 3 and 4.
Average fit parameters (mean ± S.E.M.) obtained from global fits of Schemes 3 (left column) and 4 (right column) to three pairs of macroscopic WT CFTR current activation/deactivation time courses recorded in response to addition/removal of 0.01x saturated and 1x saturated concentrations of Vx-770 to the cytosolic (bath) solution. * Parameters kin and kout were constrained through kin/kout = Doct/wat(pH=7.1) = 62580. ** Parameters Kd;mem, K0.5;mem, and K0.5;aq were calculated from the fit parameters as described in Materials and methods.
| Scheme | 3 | 4 |
|---|---|---|
| kin (s-1)* | 4034 ± 464 | 9794 ± 531 |
| kout (s-1)* | 0.06446 ± 0.00742 | 0.1565 ± 0.0085 |
| kon' (M-1s-1) | 870.3 ± 104.0 | 3703 ± 627 |
| koff (s-1) | 0.007451 ± 0.000871 | 0.01075 ± 0.00009 |
| kflip (s-1) | - | 0.04408 ± 0.00583 |
| Po;max/Po;bas | 3.935 ± 0.001 | 3.996 ± 0.007 |
| Kd;mem (µM)** | 8.751 ± 1.160 | 3.106 ± 0.605 |
| K0.5;mem (µM)** | 21.13 ± 2.80 | 7.498 ± 1.460 |
| K0.5;aq (nM)** | 0.6752 ± 0.0895 | 0.6690 ± 0.0955 |
Key resources table
| Reagent type (species) or resource | Designation | Source or reference | Identifiers | Additional information |
|---|---|---|---|---|
| Biological sample (Xenopus laevis) | Xenopus laevis oocytes | African Reptile Park | RRID: NXR_0.0080 | mandyvorster@xsinet.co.za |
| Commercial assay or kit | HiSpeed Plasmid Midi Kit | Qiagen | 12643 | |
| Commercial assay or kit | QuickChange II Mutagenesis Kit | Agilent Technologies | 200524–5 | |
| Commercial assay or kit | mMESSAGE mMACHINE T7 Transcription Kit | ThermoFisher | AM1344 | |
| Chemical compound, drug | Collagenase type II | Gibco | 17107–0125 | |
| Chemical compound, drug | Adenosine 5′-triphosphoribose magnesium (ATP) | Sigma-Aldrich | A9187 | |
| Chemical compound, drug | Protein kinase A catalytic subunit, bovine | Sigma-Aldrich | P2645 | |
| Chemical compound, drug | Vx-770 (solid) | Selleck Chemicals | S1144 | |
| Chemical compound, drug | Vx-770 (10 mM in DMSO) | Selleck Chemicals | S1144 | |
| Software, algorithm | Pclamp9 | Molecular Devices | RRID: SCR_011323 |
Additional files
-
Transparent reporting form
- https://doi.org/10.7554/eLife.46450.010
Download links
A two-part list of links to download the article, or parts of the article, in various formats.
Downloads (link to download the article as PDF)
Open citations (links to open the citations from this article in various online reference manager services)
Cite this article (links to download the citations from this article in formats compatible with various reference manager tools)
Cystic fibrosis drug ivacaftor stimulates CFTR channels at picomolar concentrations
eLife 8:e46450.
https://doi.org/10.7554/eLife.46450


