Lack of activity of recombinant HIF prolyl hydroxylases (PHDs) on reported non-HIF substrates
- The Francis Crick Institute, United Kingdom
- University of Oxford, United Kingdom
- University of Oulu, Finland
Figures
Figure 1 with 1 supplement

Assays of peptide hydroxylation.
LC-MS spectra of peptides derived from HIF-1α (left) and selected non-HIF peptidyl substrates (see Figure 1—figure supplement 1 for complete dataset) reacted with the indicated PHD isoform, or no PHD enzyme (control). In control reactions the doubly-charged (M+2H+) peptides showed the calculated mass. Following incubation with PHDs, only the doubly-charged HIF-1α peptide mass is shifted by an m/z increment of 7.997 Da (M+O+2H+) indicative of prolyl hydroxylation. No PHD-dependent mass shift was observed on any of the non-HIF substrates.
Figure 1—figure supplement 1
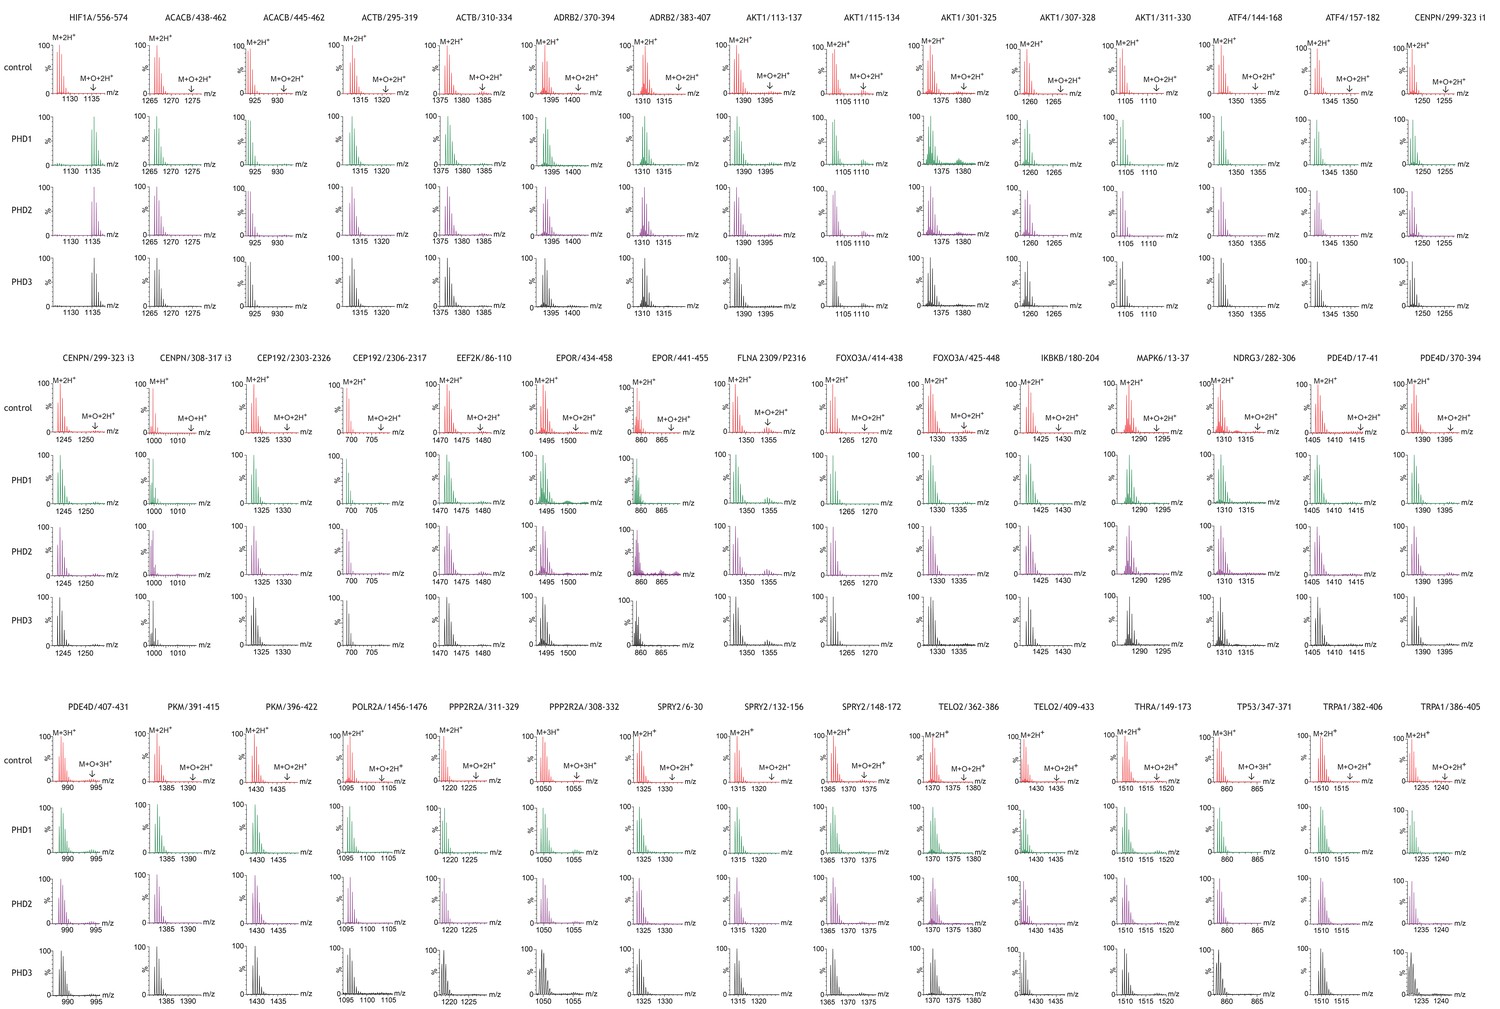
Assays of peptide hydroxylation.
LC-MS spectra of peptides derived from HIF-1α (left) and non-HIF peptidyl substrates reacted with the indicated PHD isoform or no PHD enzyme (control). In control reactions the charged peptides (single: M+H+; double: M+2H+; triple: M+3H+) showed the calculated mass. Following incubation with PHDs, the doubly-charged HIF-1α peptide mass is shifted by an m/z increment of 7.997 Da (M+O+2H+) indicative of prolyl hydroxylation. No PHD-dependent mass shift was observed on any of the non-HIF substrates.
Figure 2 with 5 supplements
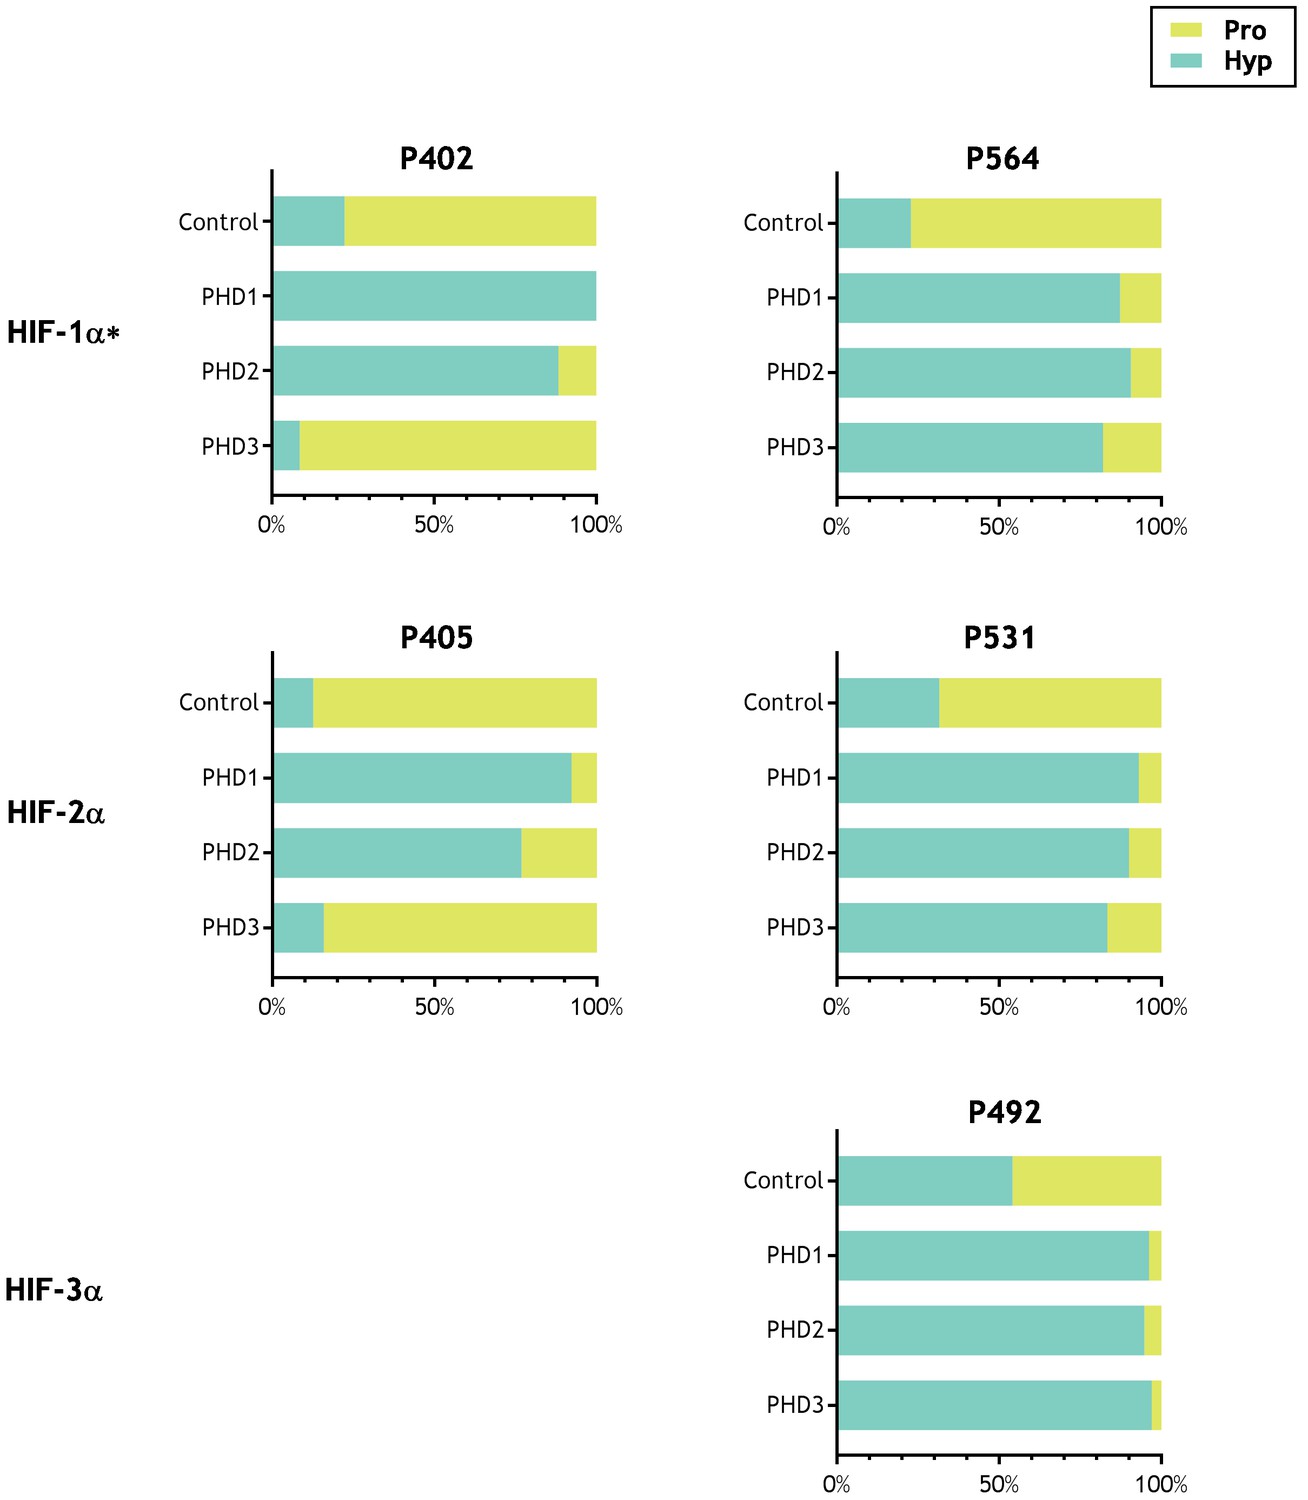
Activity of PHD enzymes on full-length HIF substrates produced by IVTT.
HIF substrates (HIF-1α, HIF-2α and HIF-3α) were produced by IVTT and reacted in the absence (Control) or presence of the indicated recombinant PHD enzyme. Endogenous PHD activity in IVTT lysate gave rise to a basal (Control) level of hydroxylation that markedly increased upon addition of recombinant PHD. Data are summarised as stacked bar charts that are grouped by target site and report the (%) level of prolyl hydroxylation determined by LC-MSMS. Key: Pro (unoxidised prolyl, yellow), Hyp (hydroxyprolyl, turquoise). Extracted ion chromatograms corresponding to each hydroxylation reaction are provided as the following supplements to Figure 2—figure supplement 1, HIF-1α P402; Figure 2—figure supplement 2, HIF-1α P564; Figure 2—figure supplement 3, HIF-2α P405; Figure 2—figure supplement 4, HIF-2α P531; Figure 2—figure supplement 5, HIF-3α P492. *Modified HIF-1α sequence (M561A, M568A) assayed.
Figure 2—figure supplement 1
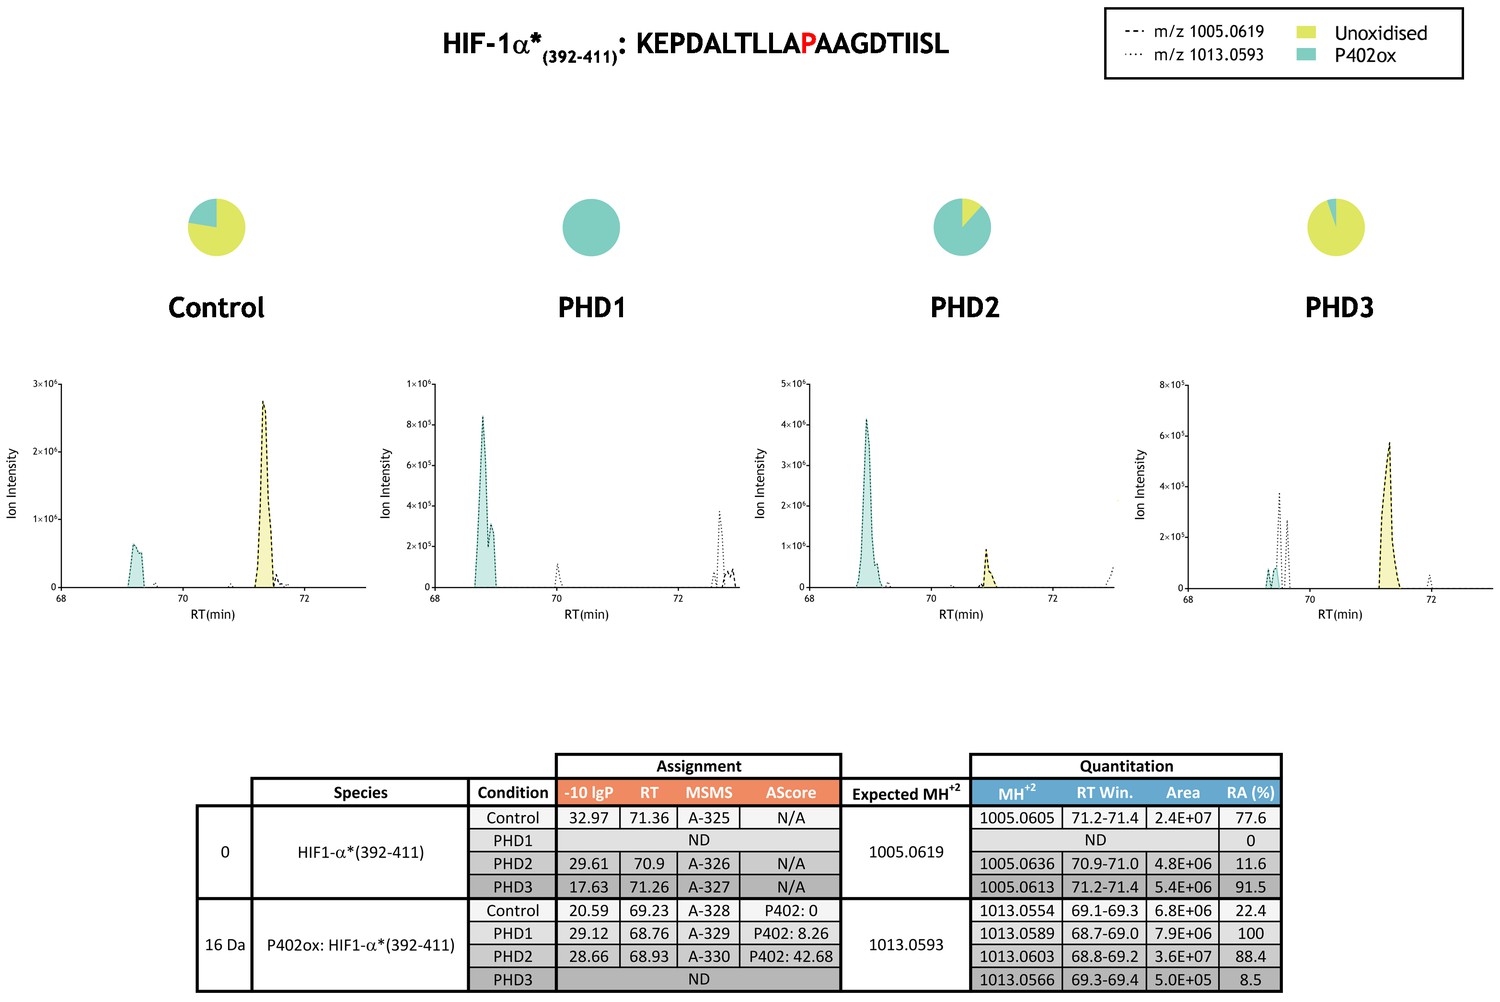
Quantitation of PHD-catalysed hydroxylation at the P402 site in hypoxia-inducible factor 1α.
Full-length HIF-1α protein produced by IVTT was incubated in the absence (Control) or presence of the indicated (PHD) enzyme and digested with trypsin. A semi-specific HIF-1α* peptide product of trypsin proteolysis (i.e., a peptide cleaved at the C-terminal side of Lys or Arg at one end but not the other) was used for quantitation of P402 hydroxylation as the specific 51 mer peptide was not efficiently detected by MS. Data are presented as extracted ion chromatograms of m/z 1005.0619 and m/z 1013.0593 corresponding to unoxidised (yellow) and P402ox (turquoise) forms of the semi-specific HIF-1α*(392-411) tryptic peptide under control or PHD-reacted conditions. Quantitative data for observed species are presented as pie charts above chromatograms. Species lacking supportive MSMS were assigned by exact mass and retention time similarity. For PHD1, the unoxidised ion (m/z 1005.0619; RT ~71 min) was not detected giving a nominal hydroxylation level 100%. For PHD3, chromatographic elution of the P402ox species partially overlapped with an unrelated doubly-charged ion (m/z 1012.5482; RT 69.54; assigned as keratin by MSMS, scan 23441) whose isotopic envelope (i.e., M+1 peak) was indistinguishable from the m/z of the monoisotopic P402ox species. P402ox area integrations (turquoise) exclude this contaminant but likely underrepresent the peak area. Assignment and quantitation data are tabulated below with the following headers: (−10lgP) significance score of leading assignment at given retention time (RT) with ambiguity score (AScore) for PTM localisation and reference to primary MSMS data in Supplementary file 1. Quantitative data reports ion counts (Area) of observed masses (MH+2) integrated over time (RT Win.), expressed as relative abundance (RA). *Modified HIF-1α sequence (M561A, M568A) assayed.
Figure 2—figure supplement 2
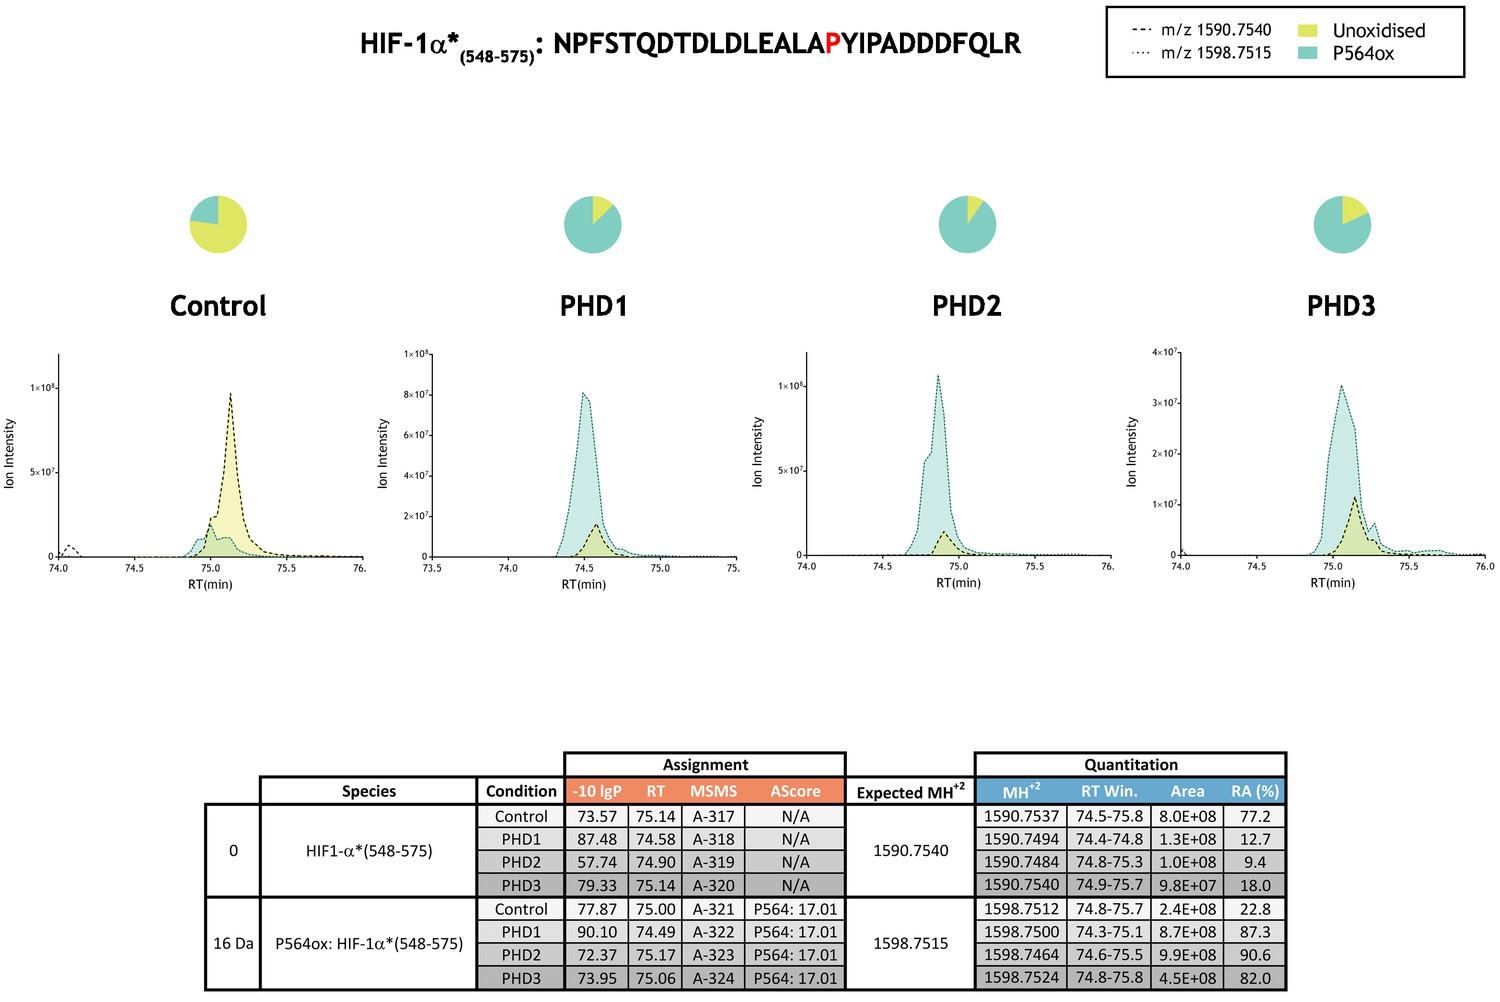
Quantitation of PHD-catalysed hydroxylation at the P564 site in hypoxia-inducible factor 1α.
Full-length HIF-1α protein produced by IVTT was incubated in the absence (Control) or presence of the indicated (PHD) enzyme and digested with trypsin. To facilitate quantitation of P564ox a variant of HIF-1α was used in which two methionine residues that are close to the site of prolyl hydroxylation and which are prone to non-enzyme catalysed oxidation were substituted to alanine (HIF-1α*: M561A, M568A). This modified form of HIF-1α is more amenable to LC-MS based quantitation (peak intensities are not reduced as a consequence of methionine oxidation) and has no appreciable effect on the rate of PHD-dependent catalysis (Tian et al., 2011). Relative quantitation of P564ox is presented as XIC of m/z 1590.7540 and 1598.7515 corresponding to unoxidised (yellow) and P564ox (turquoise) forms of HIF-1α*(548-575). Quantitative data for observed species are presented as pie charts above chromatograms. Assignment and quantitation data are tabulated below with the following headers: (−10lgP) significance score of leading assignment at given (RT) with ambiguity score (AScore) for PTM localisation and reference to primary MSMS data in Supplementary file 1. Quantitative data reports ion counts (Area) of observed masses (MH+2) integrated over time (RT Win.), expressed as relative abundance (RA).
Figure 2—figure supplement 3

Quantitation of PHD-catalysed hydroxylation at the P405 site in hypoxia-inducible factor 2α.
Full-length HIF-2α protein produced by IVTT was incubated in the absence (Control) or presence of the indicated (PHD) enzyme and digested with trypsin. Relative quantitation of P405ox is presented as XIC of m/z 1336.6514 and 1341.9830 corresponding to unoxidised (yellow) and P405ox (turquoise) forms of HIF-2α(393-429). Quantitative data for observed species are presented as pie charts above chromatograms. Assignment and quantitation data are tabulated below with the following headers: (−10lgP) significance score of leading assignment at given (RT) with ambiguity score (AScore) for PTM localisation and reference to primary MSMS data in Supplementary file 1. Quantitative data reports ion counts (Area) of observed masses (MH+3) integrated over time (RT Win.), expressed as relative abundance (RA).
Figure 2—figure supplement 4

Quantitation of PHD-catalysed hydroxylation at the P531 site in hypoxia-inducible factor 2α.
Full-length HIF-2α protein produced by IVTT was incubated in the absence (Control) or presence of the indicated (PHD) enzyme and digested with trypsin. Relative quantitation of P531ox is presented as XIC of m/z 1491.9943, 1497.3259 and 1502.6576 corresponding to unoxidised (yellow), singly-oxidised [P531ox (turquoise), M535ox (orange)] and doubly-oxidised P531ox; M535ox (purple) forms of HIF-2α(513-550). Tandem MS assigned species were securely assigned at the peptide level (−10lgP) but fragment ion coverage of the oxidation sites was low preventing confident assignment of the modification sites (AScore: 0 or NL, not localised). However, diagnostic fragment ions were observed in representative MSMS spectra that implied oxidation at P531 (P531:+16)† or M535 (M535:+16)‡, and which corresponded to discrete peaks eluting at ~77.8 min and ~77.5 min, respectively (see supporting MSMS in Supplementary file 1). The peak corresponding to P531ox but not M535ox increased upon incubation with PHD enzyme. Species lacking supportive MSMS were assigned by exact mass and retention time similarity. Quantitative data for observed species are presented as pie charts above chromatograms. Assignment and quantitation data are tabulated below with the following headers: (−10lgP) significance score of leading assignment at given (RT) with ambiguity score (AScore) for PTM localisation and reference to primary MSMS data in Supplementary file 1. Quantitative data reports ion counts (Area) of observed masses (MH+3) integrated over time (RT Win.), expressed as relative abundance (RA). Total P531ox is an aggregated ratio of prolyl to hydroxyprolyl containing ions.
Figure 2—figure supplement 5
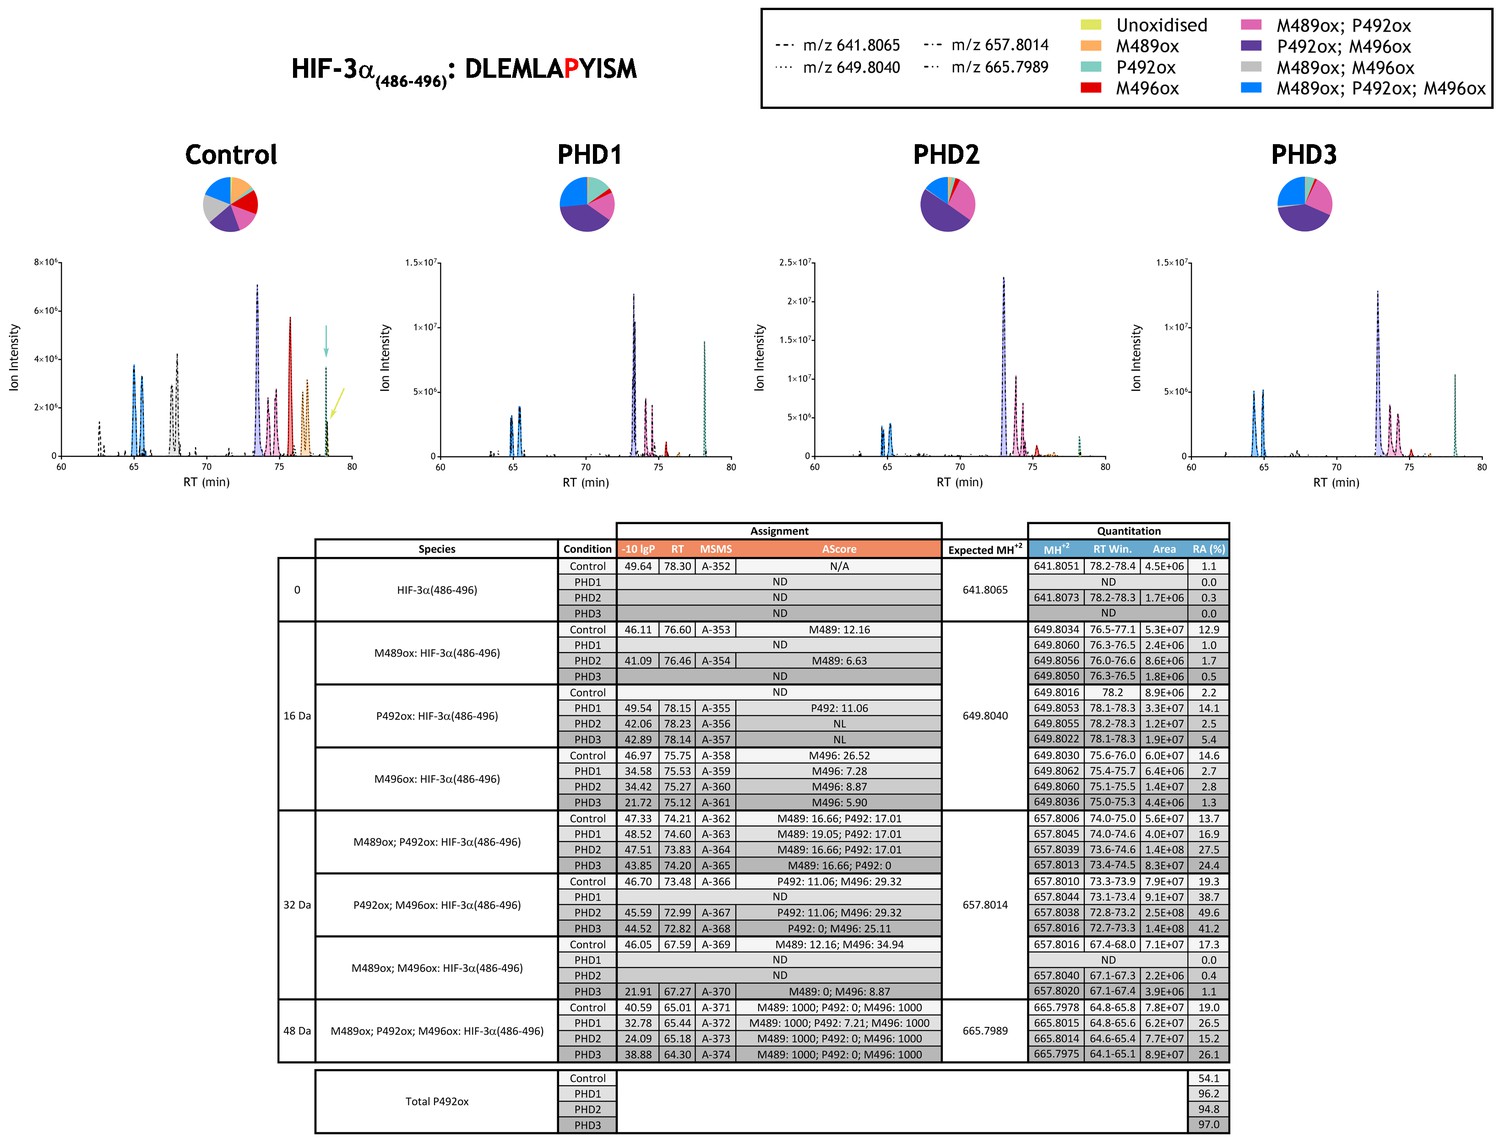
Quantitation of PHD-catalysed hydroxylation at the P492 site in hypoxia-inducible factor 3α.
Full-length HIF-3α protein produced by IVTT was incubated in the absence (Control) or presence of the indicated (PHD) enzyme and digested with Asp-N. Relative quantitation of P492ox is presented as XIC of m/z 641.8065, 649.8040, 657.8014 and 665.7989 corresponding to unoxidised and multiply oxidised forms of the HIF-3α(486-496) peptide bearing two readily oxidised Met residues (M489 and M496). Species lacking supportive MSMS were assigned by exact mass and retention time similarity. MSMS assigned species are coloured (see inset). Note, the relative increase in P492ox containing species [(P492ox, turquoise), (M489ox; P492ox, pink), (P492ox; M496ox, purple), (M489ox; P492ox; M496ox, blue)] upon incubation with recombinant PHD enzyme. Quantitative data for observed species are presented as pie charts above chromatograms. Assignment and quantitation data are tabulated below with the following headers: (−10lgP) significance score of leading assignment at given (RT) with ambiguity score (AScore) for PTM localisation and reference to primary MSMS data in Supplementary file 1. Quantitative data reports ion counts (Area) of observed masses (MH+2) integrated over time (RT Win.), expressed as relative abundance (RA). Total P492ox is an aggregated ratio of prolyl to hydroxyprolyl containing ions.
Figure 3 with 33 supplements
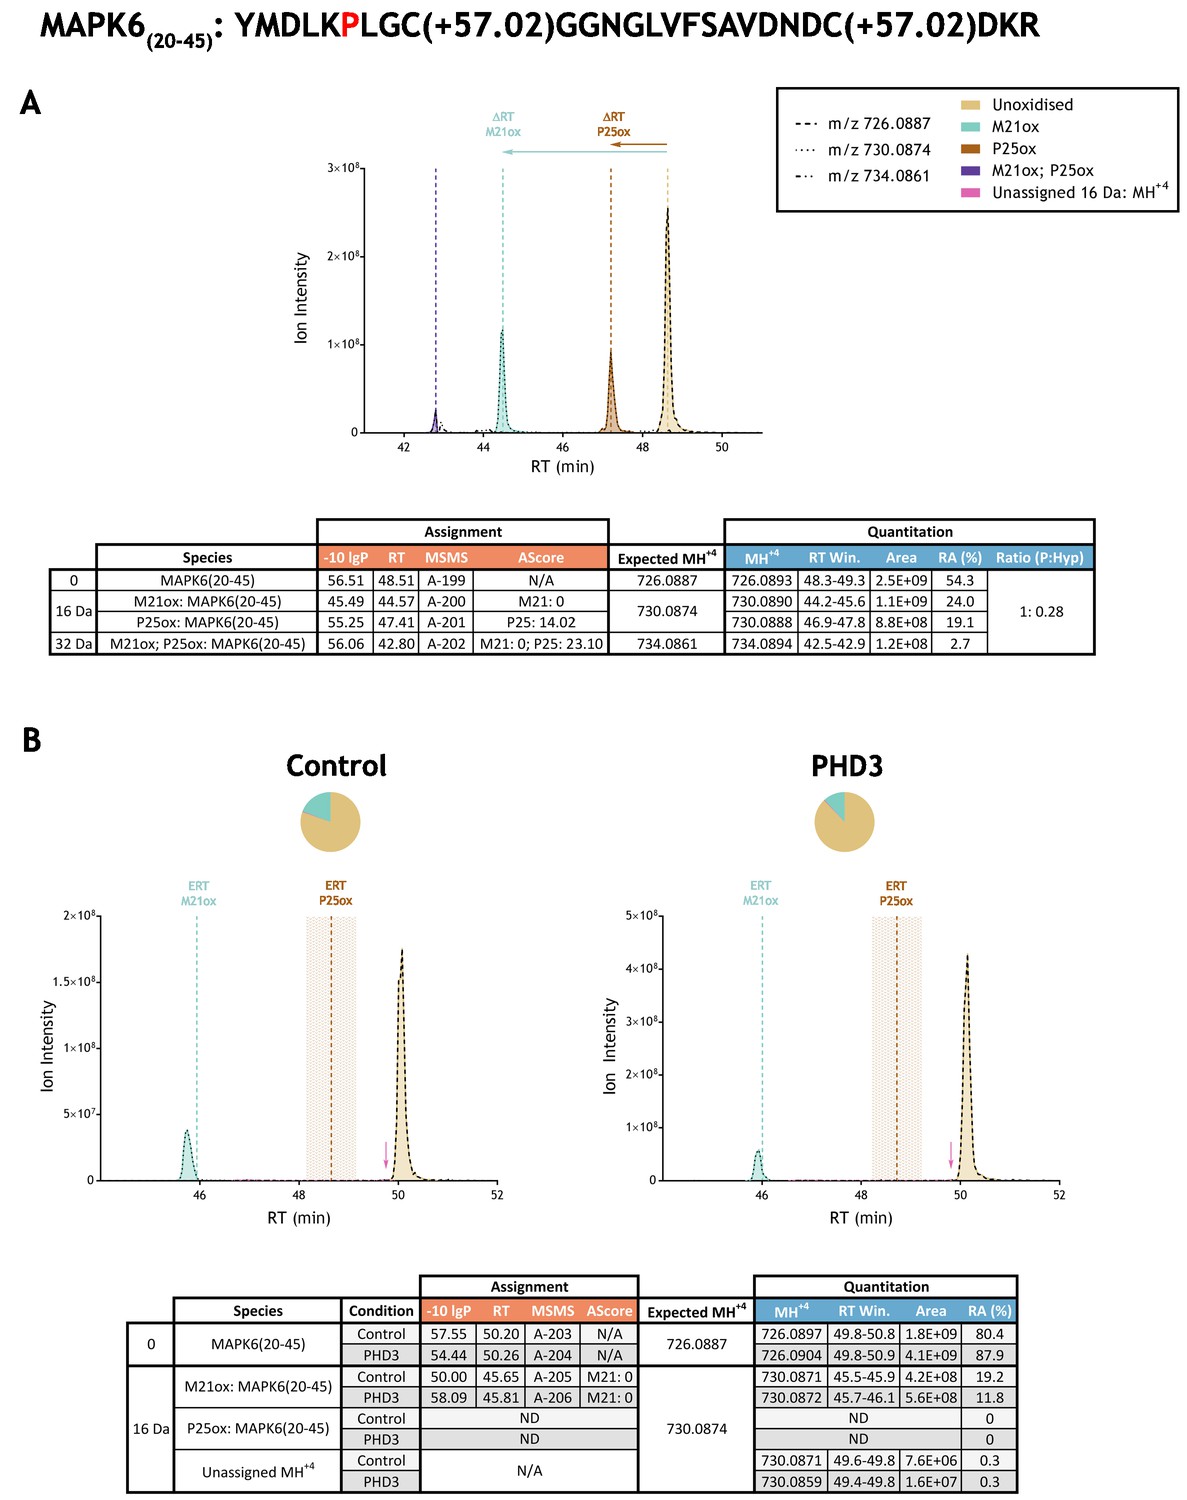
Example of quantitation of peptide oxidation on IVTT substrates reacted with PHD enzyme by extracted ion chromatogram (XIC).
(A) Shows ion intensity and retention time (RT) characteristics of equimolar synthetic peptide standards for unoxidised and P25ox forms of the tryptic MAPK6(20–45) peptide. MSMS assigned species including non-enzymatic oxidations are coloured (see inset); vertical dashed lines define peak maxima used to derive ΔRT values for key oxidised ions. (B) Shows comparable XIC data for protease-digested IVTT substrates under control (left) or PHD3-reacted (right) conditions. Peaks corresponding to unoxidised and M21ox forms of MAPK6(20–45) were assigned by MSMS (see inset for colour code); P25ox was not detected. Estimated RT (ERT) values for oxidised peptides, derived from (A), are indicated by dashed vertical lines, shading applied to ERT P25ox corresponds to a 1 min RT window. Peptide ions of low abundance that were compatible with oxidation but not assigned by MSMS are also indicated (pink arrow). Quantitative data for observed species are presented as pie charts with XIC data. Assignment and quantitative data is provided below each panel as follows: (−10lgP) significance score of leading assignment at given (RT) with ambiguity score (AScore) for PTM localisation and reference to primary MSMS data in Supplementary file 1. Quantitative data reports ion counts (Area) of observed masses (MH+4) integrated over time (RT Win.), expressed as relative abundance (RA). Data on detection efficiency for synthetic peptides (Panel A, P: Hyp) is an aggregated ratio of prolyl (P) to hydroxyprolyl (Hyp) species.
Figure 3—figure supplement 1
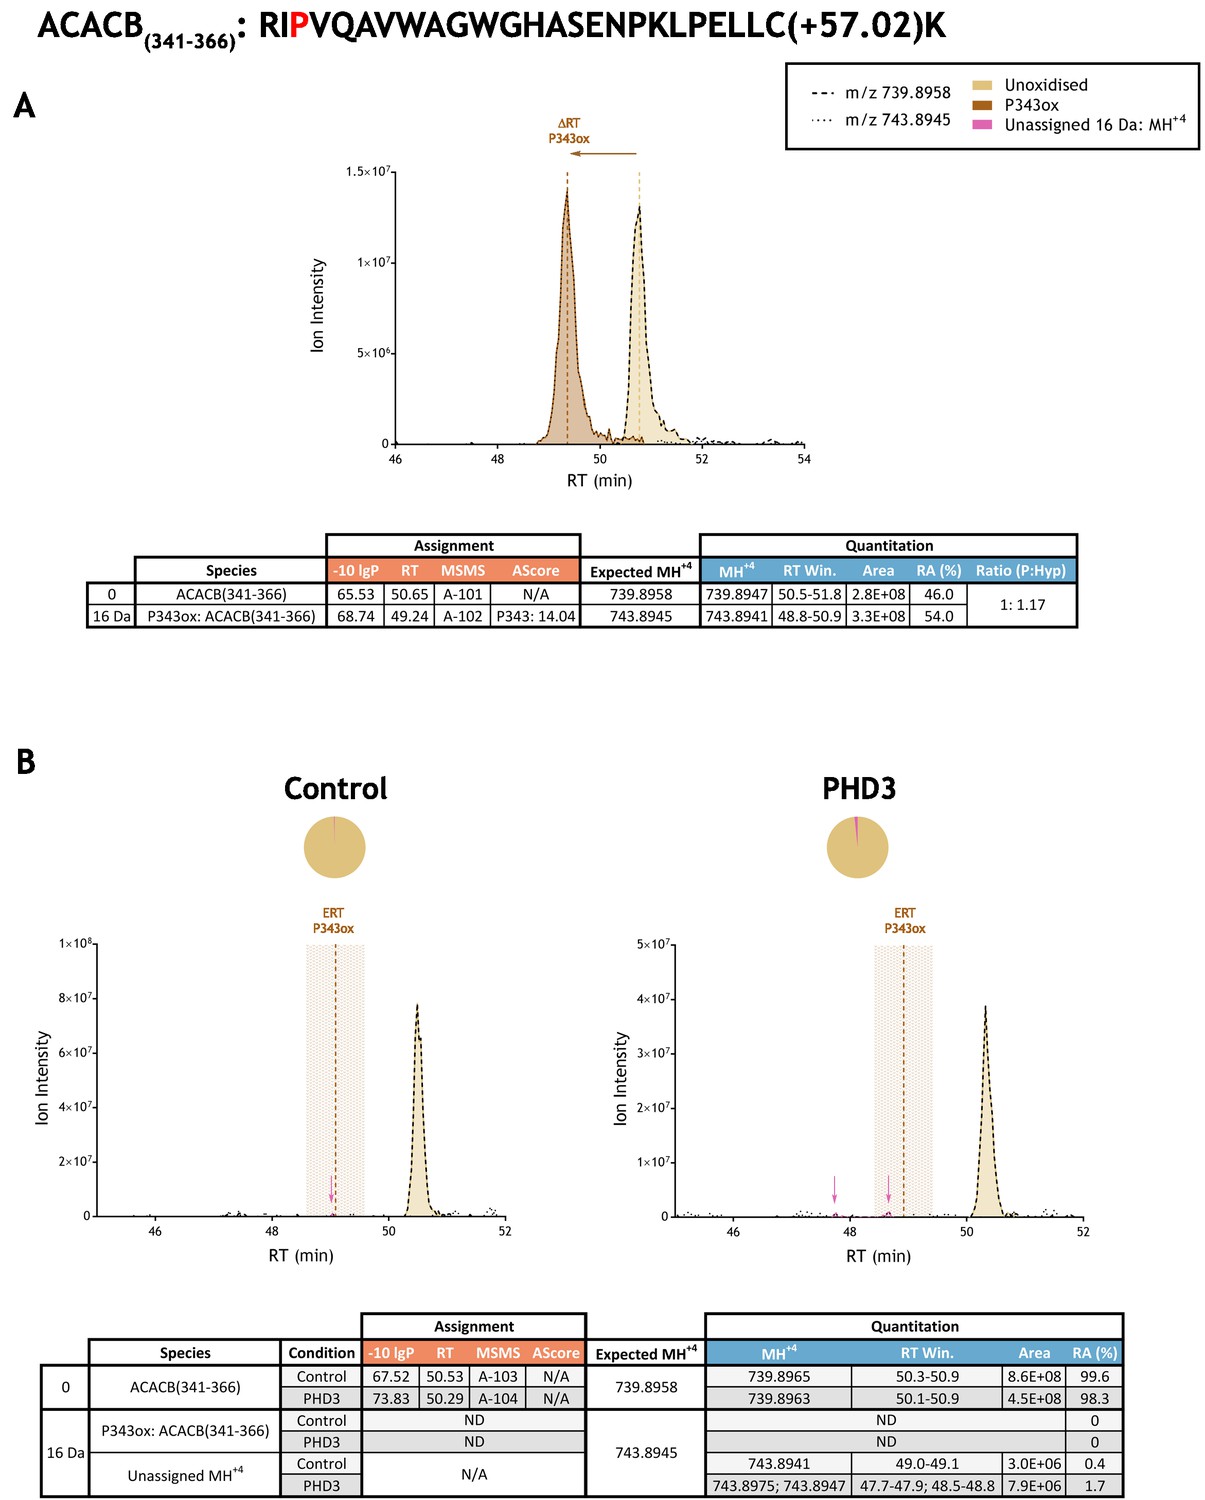
Quantitation of peptide oxidation on ACACB(341-366) following reaction of full-length acetyl-CoA carboxylase 2 with recombinant PHD3.
XIC data presented in (A) shows ion intensity and retention time (RT) characteristics of equimolar synthetic peptide standards for unoxidised and P343ox forms of the ACACB(341-366) peptide. MSMS assigned species are coloured (see inset); vertical dashed lines define peak maxima used to derive ΔRT values for P343ox. Panel (B) shows comparable XIC data for protease-digested IVTT substrate under control (left) or PHD3-reacted (right) conditions. Peaks corresponding to unoxidised ACACB(341-366) were assigned by MSMS (see inset for colour code); P343ox was not detected. The estimated RT (ERT) for P343ox, derived from (A), is indicated by dashed vertical line, shading corresponds to a 1 min RT window. Peptide ions of low abundance that were compatible with oxidation but not assigned by MSMS are also indicated (pink arrow). Quantitative data for observed species are presented as pie charts with XIC data. Assignment and quantitation data are tabulated below each panel, table headers are as follows: (−10lgP) significance score of leading assignment at given (RT) with ambiguity score (AScore) for PTM localisation and reference to primary MSMS data in Supplementary file 1. Quantitative data reports ion counts (Area) of observed masses (MH+4) integrated over time (RT Win.), expressed as relative abundance (RA). Data on detection efficiency for synthetic peptides (Panel A, P: Hyp) is an aggregated ratio of prolyl (P) to hydroxyprolyl (Hyp) species.
Figure 3—figure supplement 2
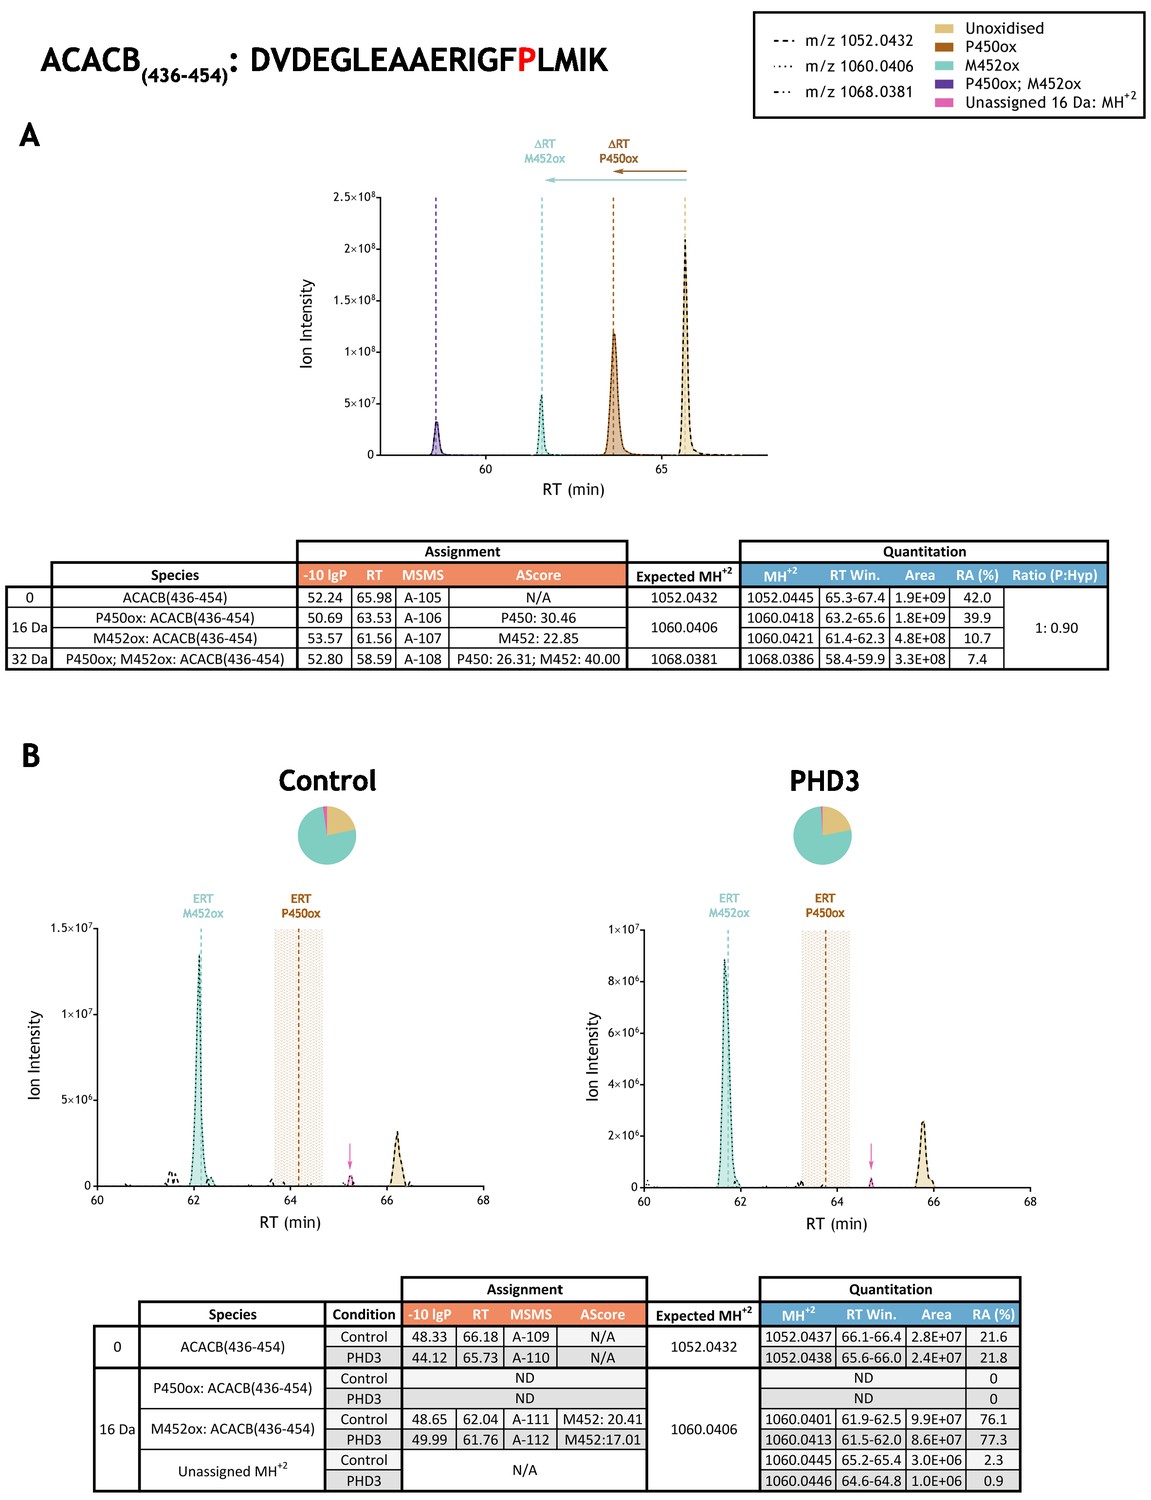
Quantitation of peptide oxidation on ACACB(436-454) following reaction of full-length acetyl-CoA carboxylase 2 with recombinant PHD3.
XIC data presented in (A) shows ion intensity and retention time (RT) characteristics of equimolar synthetic peptide standards for unoxidised and P450ox forms of the ACACB(436-454) peptide. MSMS assigned species are coloured (see inset) and include de novo methionine oxidation (M452ox; turquoise); vertical dashed lines define peak maxima used to derive ΔRT values for P450ox and M452ox. Panel (B) shows comparable XIC data for protease-digested IVTT substrate under control (left) or PHD3-reacted (right) conditions. Peaks corresponding to unoxidised and abundant M452ox forms of ACACB(436-454) were assigned by MSMS; P450ox was not detected. Estimated RT (ERT) values for oxidised peptides, derived from (A), are indicated by dashed vertical lines and show IVTT-derived M452ox eluting at the ERT; shading applied to ERT P450ox corresponds to a 1 min RT window. Peptide ions of low abundance that were compatible with oxidation but not assigned by MSMS are also indicated (pink arrow). Quantitative data for observed species are presented as pie charts with XIC data. Assignment and quantitation data are tabulated below each panel, table headers are as follows: (−10lgP) significance score of leading assignment at given (RT) with ambiguity score (AScore) for PTM localisation and reference to primary MSMS data in Supplementary file 1. Quantitative data reports ion counts (Area) of observed masses (MH+2) integrated over time (RT Win.), expressed as relative abundance (RA). Data on detection efficiency for synthetic peptides (Panel A, P: Hyp) is an aggregated ratio of prolyl (P) to hydroxyprolyl (Hyp) species.
Figure 3—figure supplement 3
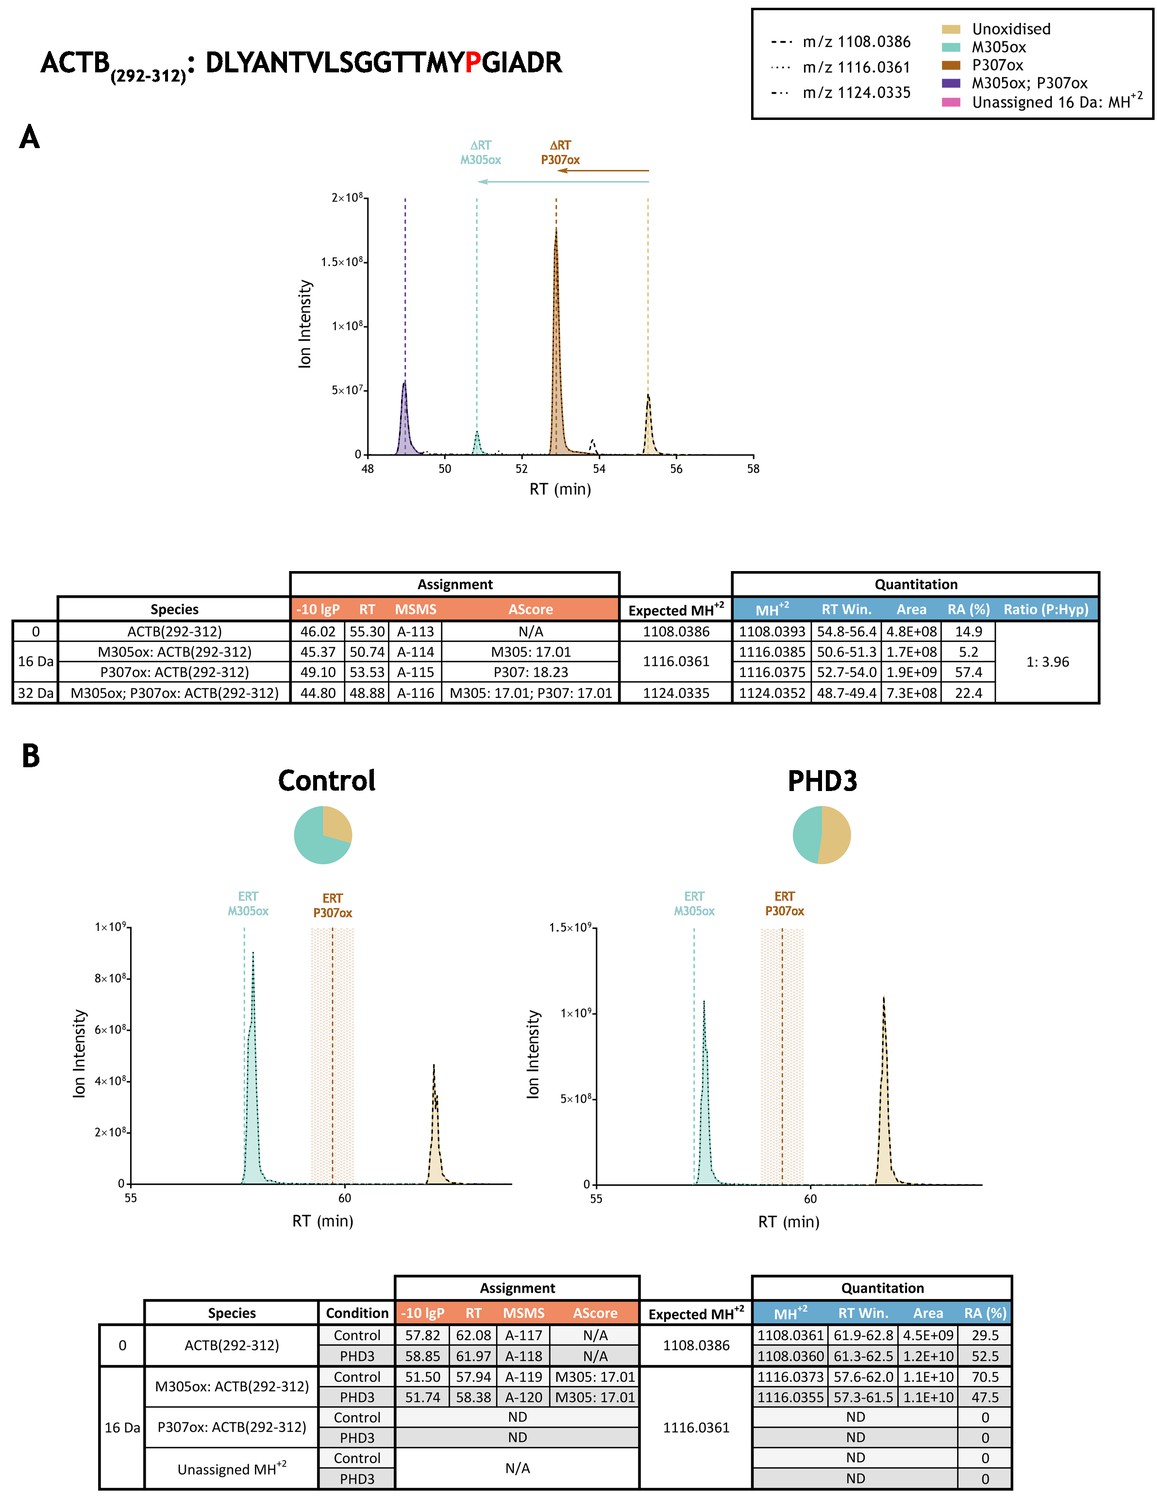
Quantitation of peptide oxidation on ACTB(292-312) following reaction of full-length beta-actin with recombinant PHD3.
XIC data presented in (A) shows ion intensity and retention time (RT) characteristics of equimolar synthetic peptide standards for unoxidised and P307ox forms of the ACTB(292-312) peptide. MSMS assigned species are coloured (see inset) and include non-enzymatic methionine oxidation (M305ox; turquoise); vertical dashed lines define peak maxima used to derive ΔRT values for M305ox and P307ox. Note, comparative ion counts were 4-fold higher for P307ox (brown) relative to the unoxidised peptide (light brown). Panel (B) shows comparable XIC data for protease-digested IVTT substrate under control (left) or PHD3-reacted (right) conditions. Peaks corresponding to unoxidised and M305ox forms of ACTB(292-312) were assigned by MSMS (see inset for colour code); P307ox was not detected. Estimated RT (ERT) values for oxidised peptides, derived from (A), are indicated by dashed vertical lines, shading applied to ERT P307ox corresponds to a 1 min RT window. Unassigned ions of compatible mass over charge for hydroxylation were not observed across the elution window. Quantitative data for observed species are presented as pie charts with XIC data. Assignment and quantitation data are tabulated below each panel, table headers are as follows: (−10lgP) significance score of leading assignment at given (RT) with ambiguity score (AScore) for PTM localisation and reference to primary MSMS data in Supplementary file 1. Quantitative data reports ion counts (Area) of observed masses (MH+2) integrated over time (RT Win.), expressed as relative abundance (RA). Data on detection efficiency for synthetic peptides (Panel A, P: Hyp) is an aggregated ratio of prolyl (P) to hydroxyprolyl (Hyp) containing species.
Figure 3—figure supplement 4
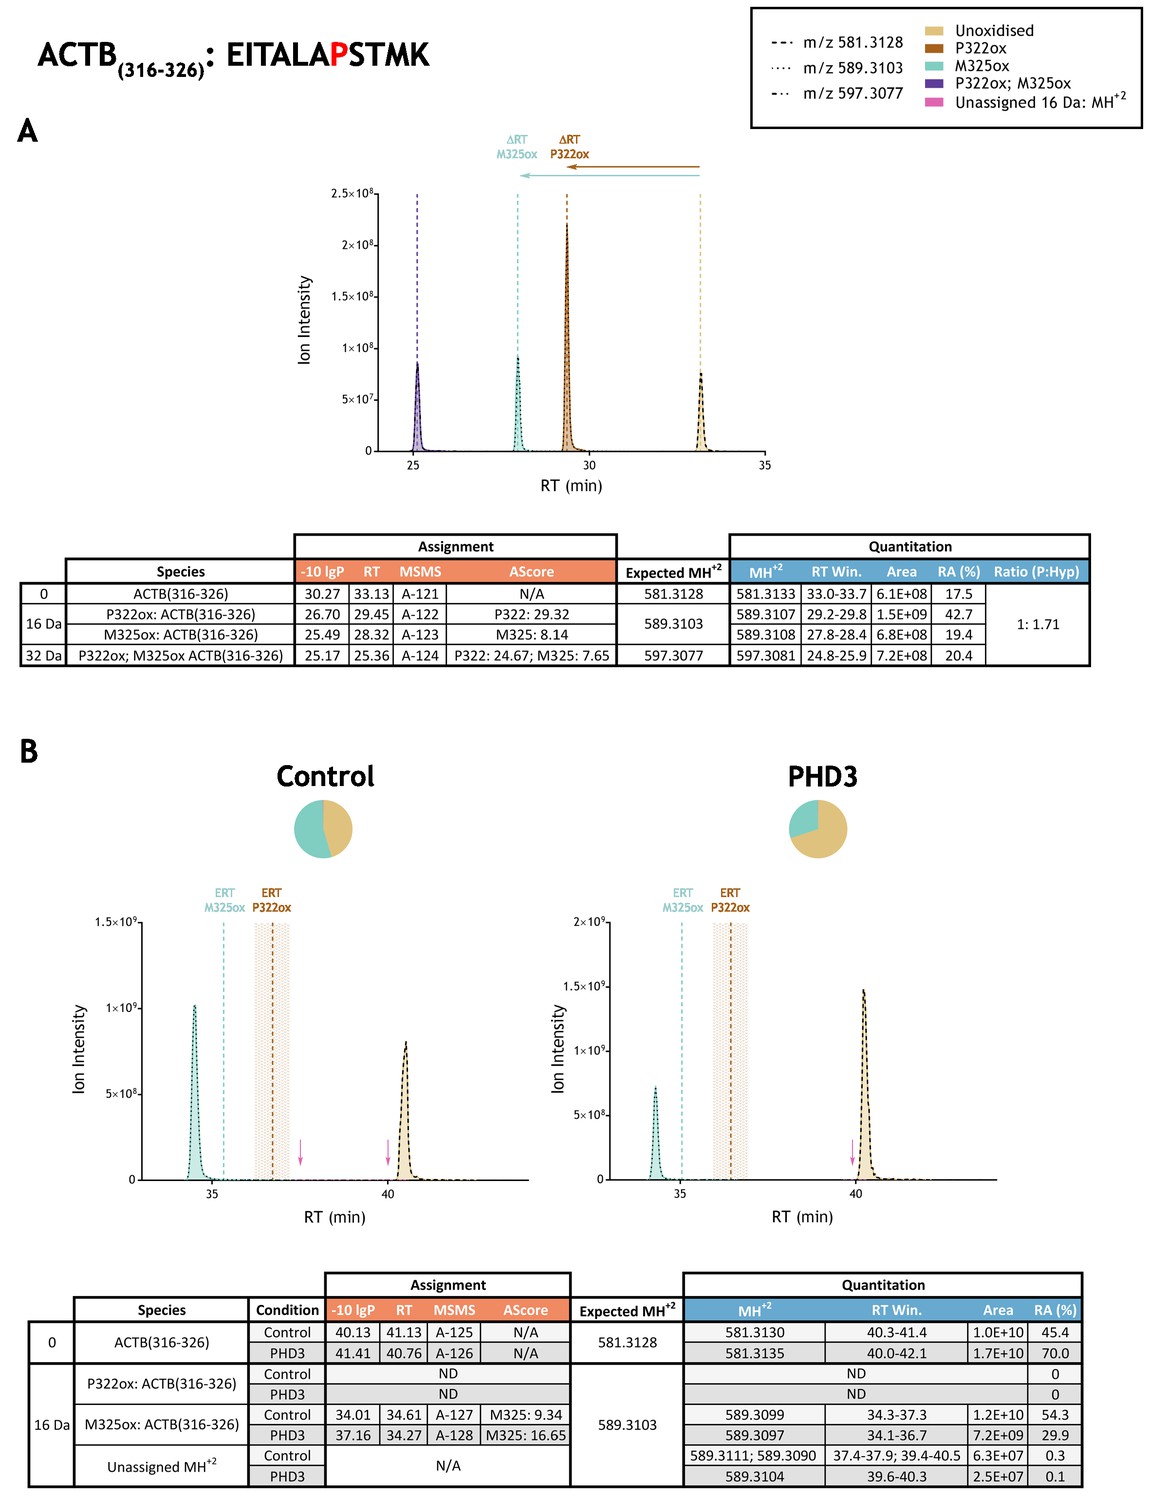
Quantitation of peptide oxidation on ACTB(316-326) following reaction of full-length beta-actin with recombinant PHD3.
XIC data presented in (A) shows ion intensity and retention time (RT) characteristics of equimolar synthetic peptide standards for unoxidised and P322ox forms of the ACTB(316-326) peptide. MSMS assigned species are coloured (see inset) and include non-enzymatic methionine oxidation (M325ox; turquoise); vertical dashed lines define peak maxima used to derive ΔRT values for P322ox and M325ox. Panel (B) shows comparable XIC data for protease-digested IVTT substrate under control (left) or PHD3-reacted (right) conditions. Peaks corresponding to unoxidised and M325ox forms of ACTB(316-326) were assigned by MSMS (see inset for colour code); P322ox was not detected. Estimated RT (ERT) values for oxidised peptides, derived from (A), are indicated by dashed vertical lines and show IVTT-derived M325ox eluting close to the ERT; shading applied to ERT P307ox corresponds to a 1 min RT window. Peptide ions of low abundance that were compatible with oxidation but not assigned by MSMS are also indicated (pink arrow). Quantitative data for observed species are presented as pie charts with XIC data. Assignment and quantitation data are tabulated below each panel, table headers are as follows: (−10lgP) significance score of leading assignment at given (RT) with ambiguity score (AScore) for PTM localisation and reference to primary MSMS data in Supplementary file 1. Quantitative data reports ion counts (Area) of observed masses (MH+2) integrated over time (RT Win.), expressed as relative abundance (RA). Data on detection efficiency for synthetic peptides (Panel A, P: Hyp) is an aggregated ratio of prolyl (P) to hydroxyprolyl (Hyp) containing species.
Figure 3—figure supplement 5
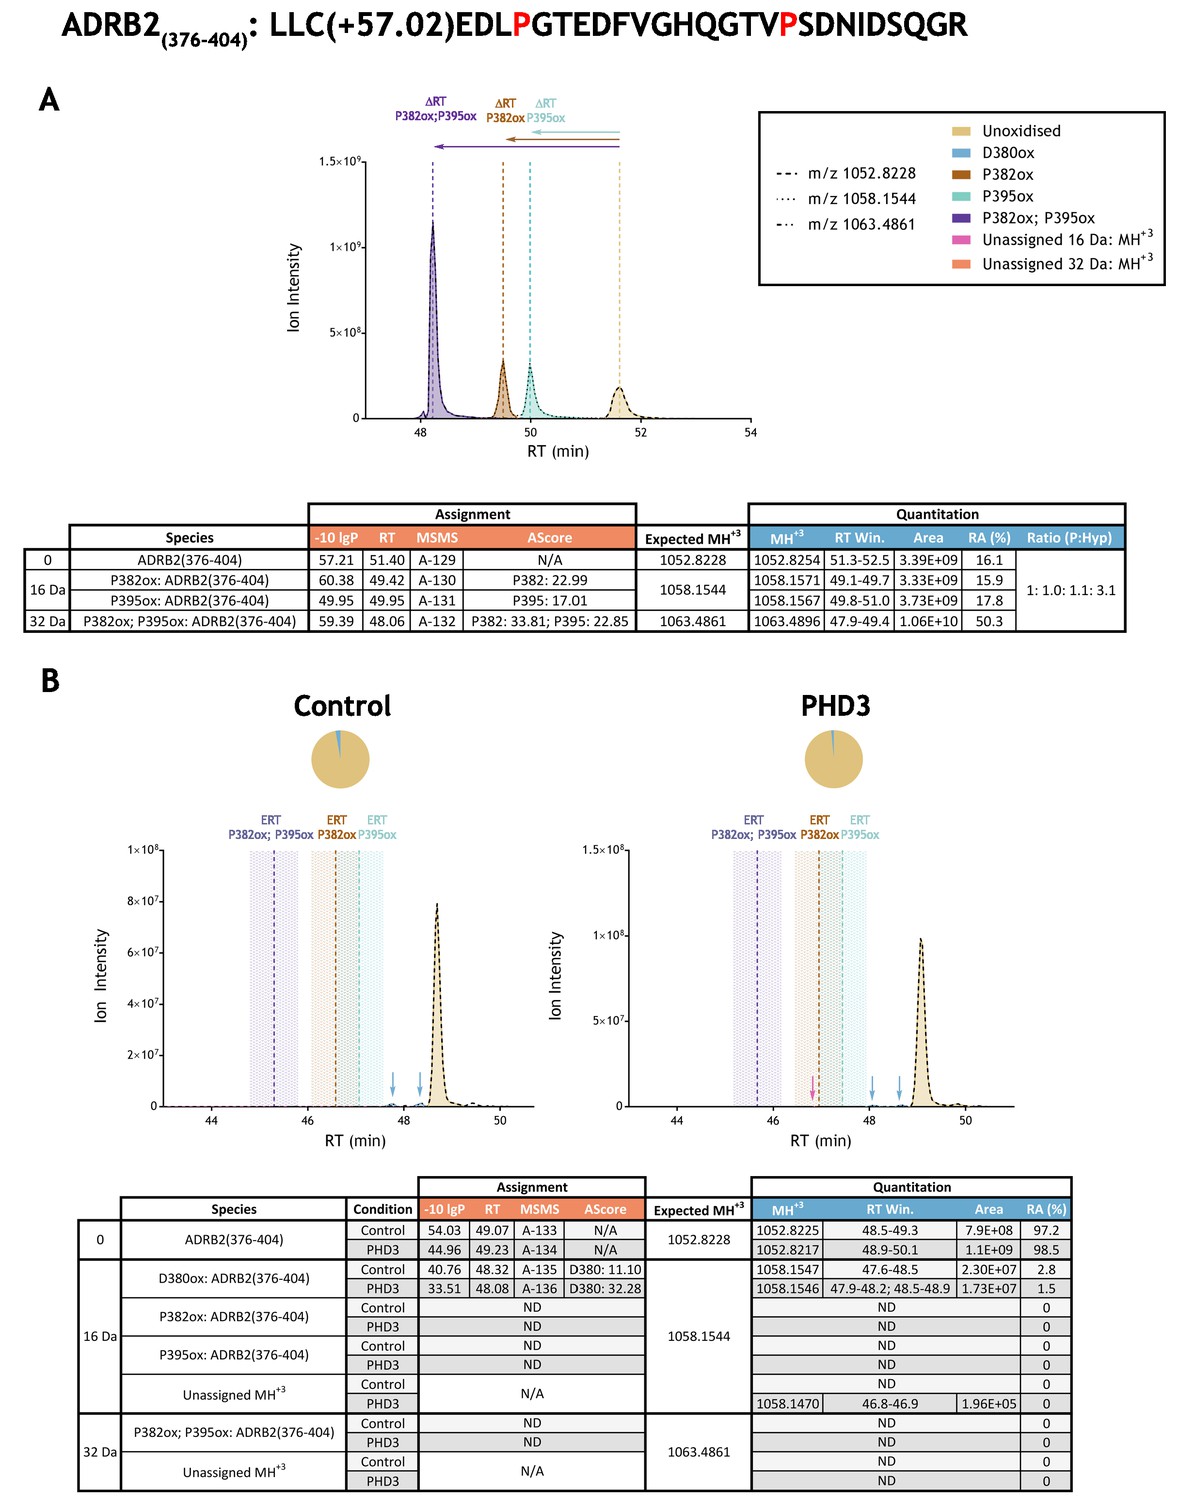
Quantitation of peptide oxidation on ADRB2(376–404) following reaction of full-length beta-2 adrenergic receptor with recombinant PHD3.
XIC data presented in (A) shows ion intensity and retention time (RT) characteristics of equimolar synthetic peptide standards for unoxidised and proline oxidised forms (P382ox, P395ox or combined) of the ADRB2(376–404) peptide. MSMS assigned species are coloured (see inset); vertical dashed lines define peak maxima used to derive ΔRT values for the different hydroxyproline-containing peptides. Note, comparative ion counts were 3-fold higher for the doubly oxidised peptide (purple) relative to the unoxidised and singly-oxidised peptides. Panel (B) shows comparable XIC data for protease-digested IVTT substrate under control (left) or PHD3-reacted (right) conditions. Peaks corresponding to unoxidised ions and two discrete low stoichiometry D380ox forms of ADRB2(376–404) were assigned by MSMS (indicated with blue arrows); prolyl hydroxylation was not detected. Estimated RT (ERT) values for proline oxidised peptides, derived from (A), are indicated by dashed vertical lines; shading corresponds to a 1 min RT window. Peptide ions of low abundance that were compatible with a single (+16 Da) oxidation event but not assigned by MSMS are indicated (pink arrow); unassigned ions with a compatible mass over charge for double oxidation (i.e.,+32 Da) were not observed across the elution window. Quantitative data for observed species are presented as pie charts with XIC data. Assignment and quantitation data are tabulated below each panel, table headers are as follows: (−10lgP) significance score of leading assignment at given (RT) with ambiguity score (AScore) for PTM localisation and reference to primary MSMS data in Supplementary file 1. Quantitative data reports ion counts (Area) of observed masses (MH+3) integrated over time (RT Win.), expressed as relative abundance (RA). Data on detection efficiency for synthetic peptides (Panel A, P: Hyp) is an aggregated ratio of prolyl (P) to hydroxyprolyl (Hyp) containing species.
Figure 3—figure supplement 6
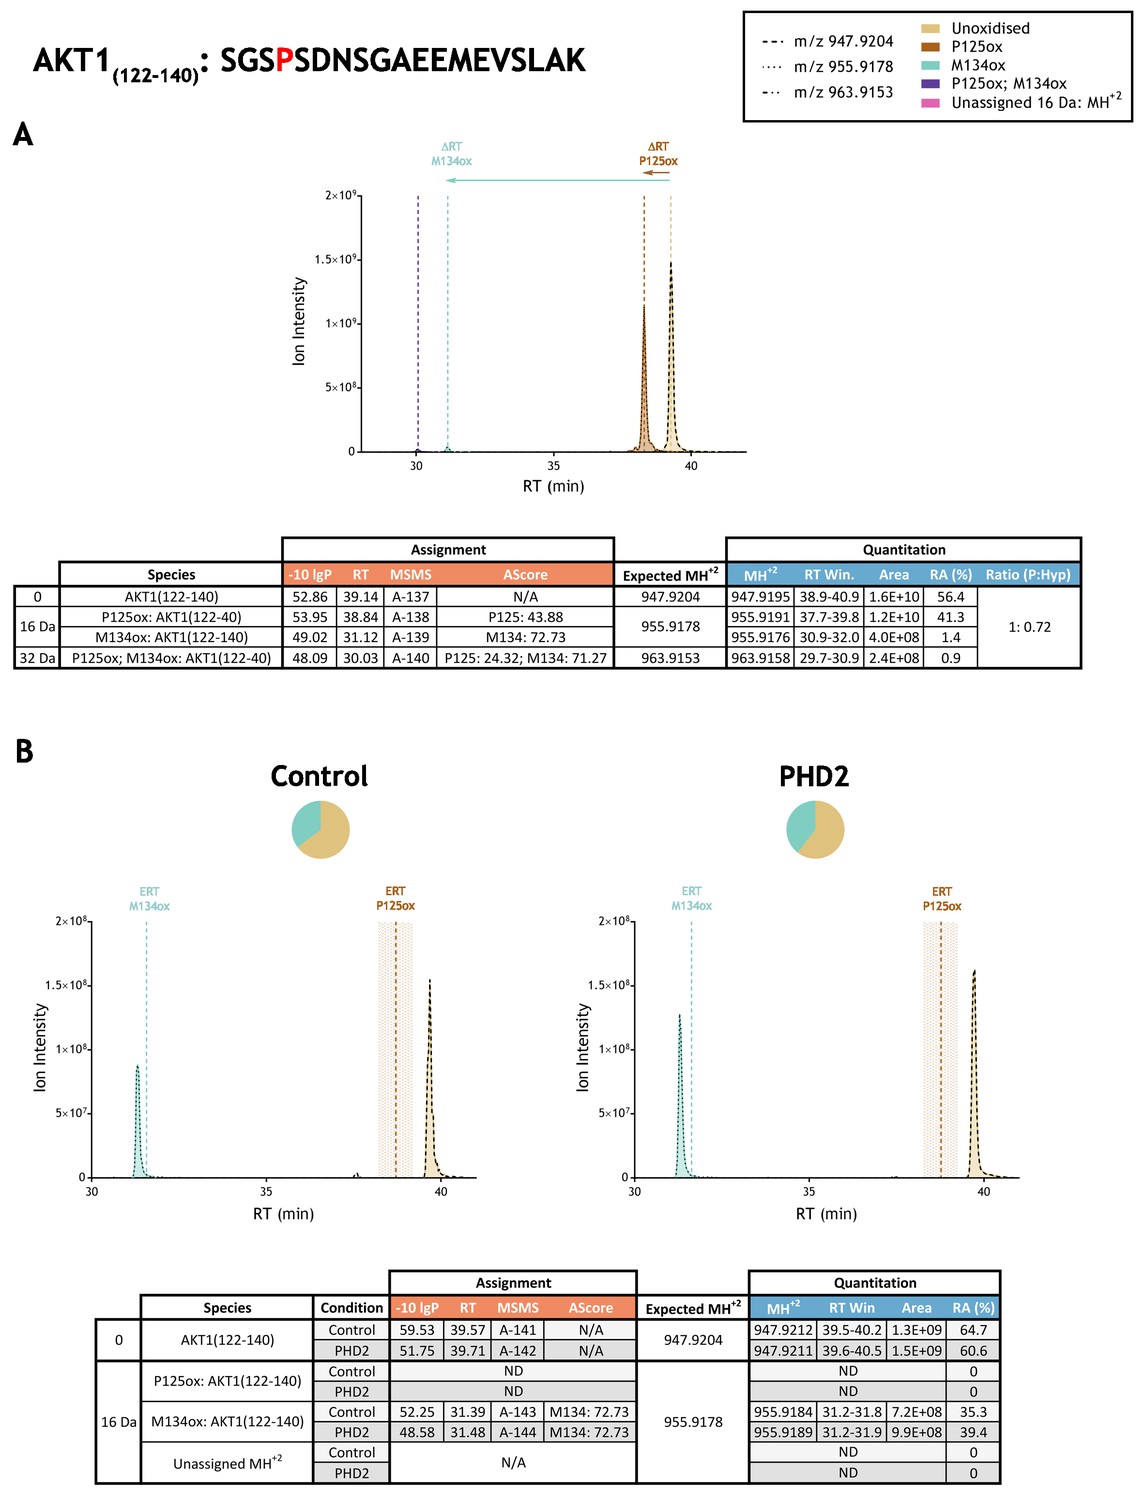
Quantitation of peptide oxidation on AKT1(122–140) following reaction of full-length AKT serine/threonine kinase 1 with recombinant PHD2.
XIC data presented in (A) shows ion intensity and retention time (RT) characteristics of equimolar synthetic peptide standards for unoxidised and P125ox forms of the AKT1(122–140) peptide. MSMS assigned species are coloured (see inset) and include low abundance non-enzymatic methionine oxidation (M134ox; turquoise); vertical dashed lines define peak maxima used to derive ΔRT values for P125ox and M134ox. Panel (B) shows comparable XIC data for protease-digested IVTT substrate under control (left) or PHD2-reacted (right) conditions. Peaks corresponding to unoxidised and M134ox forms of AKT1(122–140) were assigned by MSMS; P125ox was not detected. Estimated RT (ERT) values for oxidised peptides, derived from (A), are indicated by dashed vertical lines and show IVTT-derived M134ox eluting close to the ERT; shading applied to ERT P125ox corresponds to a 1 min RT window. Unassigned ions of compatible mass over charge for hydroxylation were not observed across the elution window. Quantitative data for observed species are presented as pie charts with XIC data. Assignment and quantitation data are tabulated below each panel, table headers are as follows: (−10lgP) significance score of leading assignment at given (RT) with ambiguity score (AScore) for PTM localisation and reference to primary MSMS data in Supplementary file 1. Quantitative data reports ion counts (Area) of observed masses (MH+2) integrated over time (RT Win.), expressed as relative abundance (RA). Data on detection efficiency for synthetic peptides (Panel A, P: Hyp) is an aggregated ratio of prolyl (P) to hydroxyprolyl (Hyp) containing species.
Figure 3—figure supplement 7

Quantitation of peptide oxidation on AKT1(308–328) following reaction of full-length AKT serine/threonine kinase 1 with recombinant PHD2.
XIC data presented in (A) shows ion intensity and retention time (RT) characteristics of equimolar synthetic peptide standards for unoxidised and proline oxidised forms (P313ox, P318ox or combined) of the AKT1(308–328) peptide. MSMS assigned species are coloured (see inset); vertical dashed lines define peak maxima used to derive ΔRT values for the different hydroxyproline-containing peptides. Panel (B) shows comparable XIC data for protease-digested IVTT substrate under control (left) or PHD2-reacted (right) conditions. Peaks corresponding to unoxidised AKT1(308–328) were detected in both control and enzyme reacted conditions. An oxidised form of AKT1(308–328) was detected in the PHD2-reacted preparation (blue arrow) and was nominally localised to Tyrosine 315 (assignment was ambiguous, AScore 0; see Supplementary file 1 A-277 for MSMS). The elution profile of this low abundance oxidised ion, which was also observed in the control data, was distinct from the expected retention time (ERT) of hydroxyproline-containing peptides (indicated by dashed vertical lines; shading corresponds to a 1 min RT window). Unassigned ions with a compatible mass over charge for oxidation (including +16 Da and +32 Da species) were not observed across the elution window. Quantitative data for observed species are presented as pie charts with XIC data. Assignment and quantitation data are tabulated below each panel, table headers are as follows: (−10lgP) significance score of leading assignment at given (RT) with ambiguity score (AScore) for PTM localisation and reference to primary MSMS data in Supplementary file 1. Species column: †Fragment ions (including neutral loss) localise oxidation to residues 313–315. Quantitative data reports ion counts (Area) of observed masses (MH+2) integrated over time (RT Win.), expressed as relative abundance (RA). Data on detection efficiency for synthetic peptides (Panel A, P: Hyp) is an aggregated ratio of prolyl (P) to hydroxyprolyl (Hyp) containing species.
Figure 3—figure supplement 8
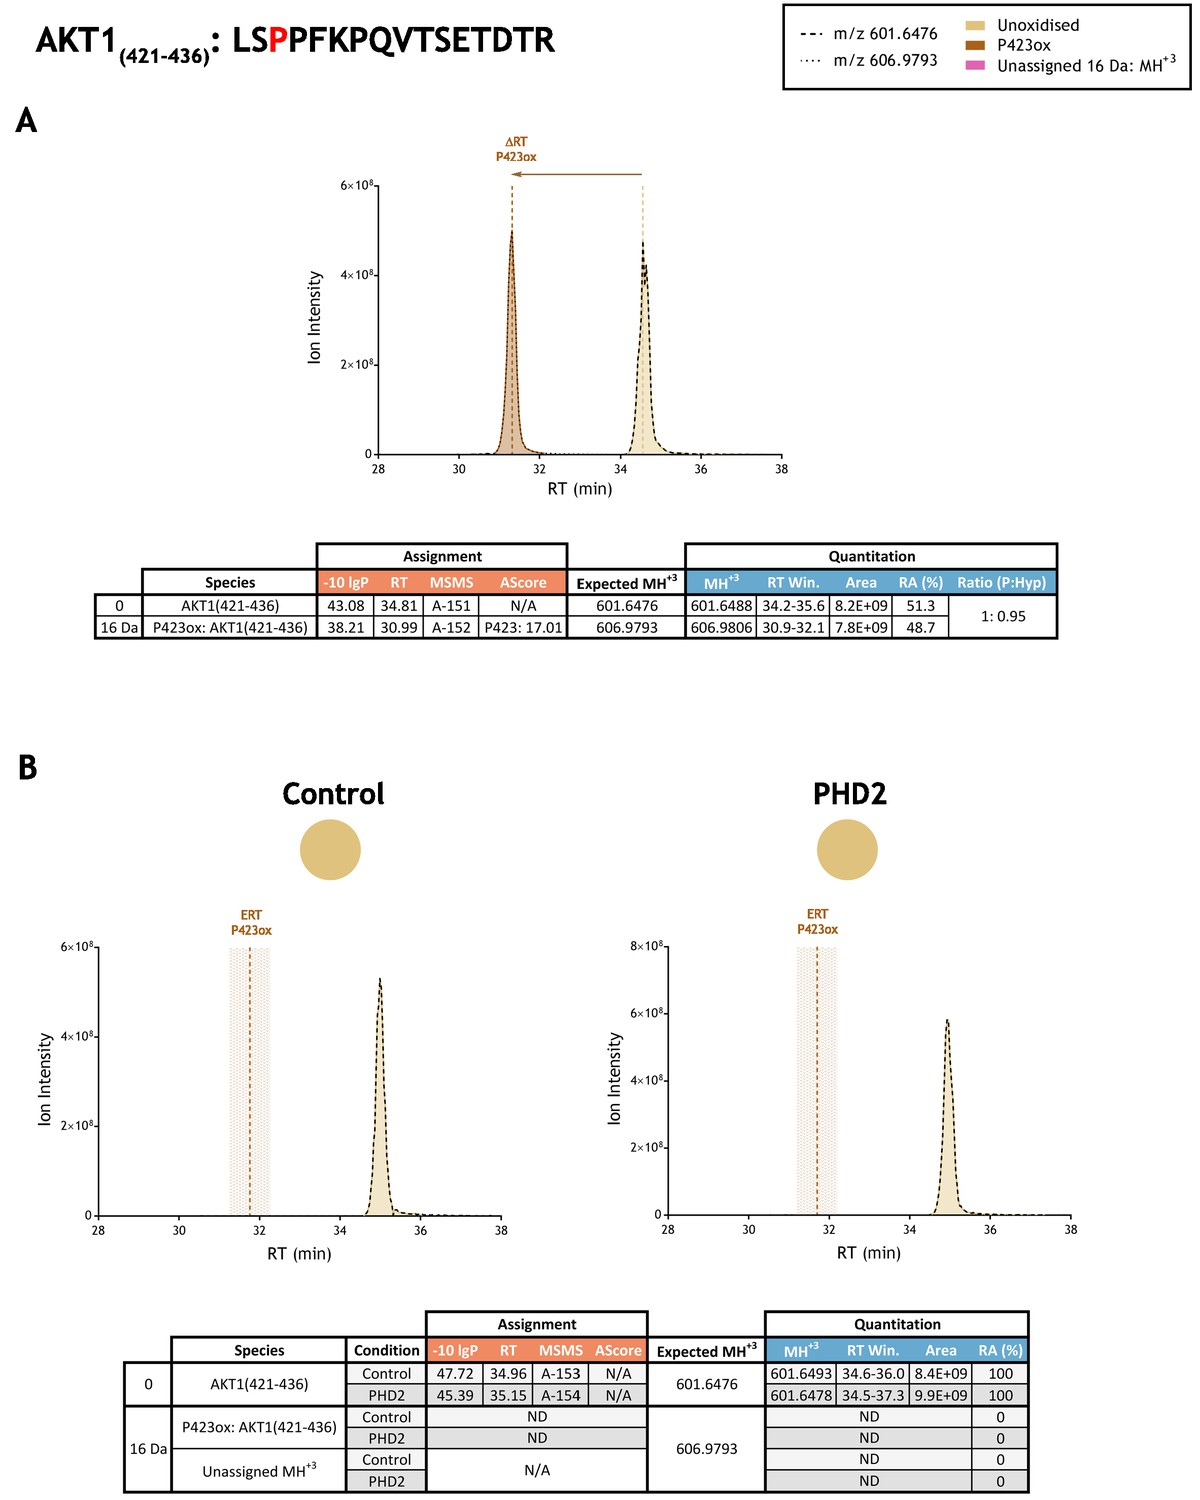
Quantitation of peptide oxidation on AKT1(421–436) following reaction of full-length AKT serine/threonine kinase 1 with recombinant PHD2.
XIC data presented in (A) shows ion intensity and retention time (RT) characteristics of equimolar synthetic peptide standards for unoxidised and P423ox forms of the AKT(421-436) peptide. MSMS assigned species are coloured (see inset); vertical dashed lines define peak maxima used to derive ΔRT values for P423ox. Panel (B) shows comparable XIC data for protease-digested IVTT substrate under control (left) or PHD2-reacted (right) conditions. Peaks corresponding to unoxidised AKT1(421–436) were assigned by MSMS (see inset for colour code); P423ox was not detected. The estimated RT (ERT) for P423ox, derived from (A), is indicated by dashed vertical line, shading corresponds to a 1 min RT window. Unassigned ions with a compatible mass over charge for oxidation were not observed across the elution window. Quantitative data for observed species are presented as pie charts with XIC data. Assignment and quantitation data are tabulated below each panel, table headers are as follows: (−10lgP) significance score of leading assignment at given (RT) with ambiguity score (AScore) for PTM localisation and reference to primary MSMS data in Supplementary file 1. Quantitative data reports ion counts (Area) of observed masses (MH+3) integrated over time (RT Win.), expressed as relative abundance (RA). Data on detection efficiency for synthetic peptides (Panel A, P: Hyp) is an aggregated ratio of prolyl (P) to hydroxyprolyl (Hyp) containing species.
Figure 3—figure supplement 9
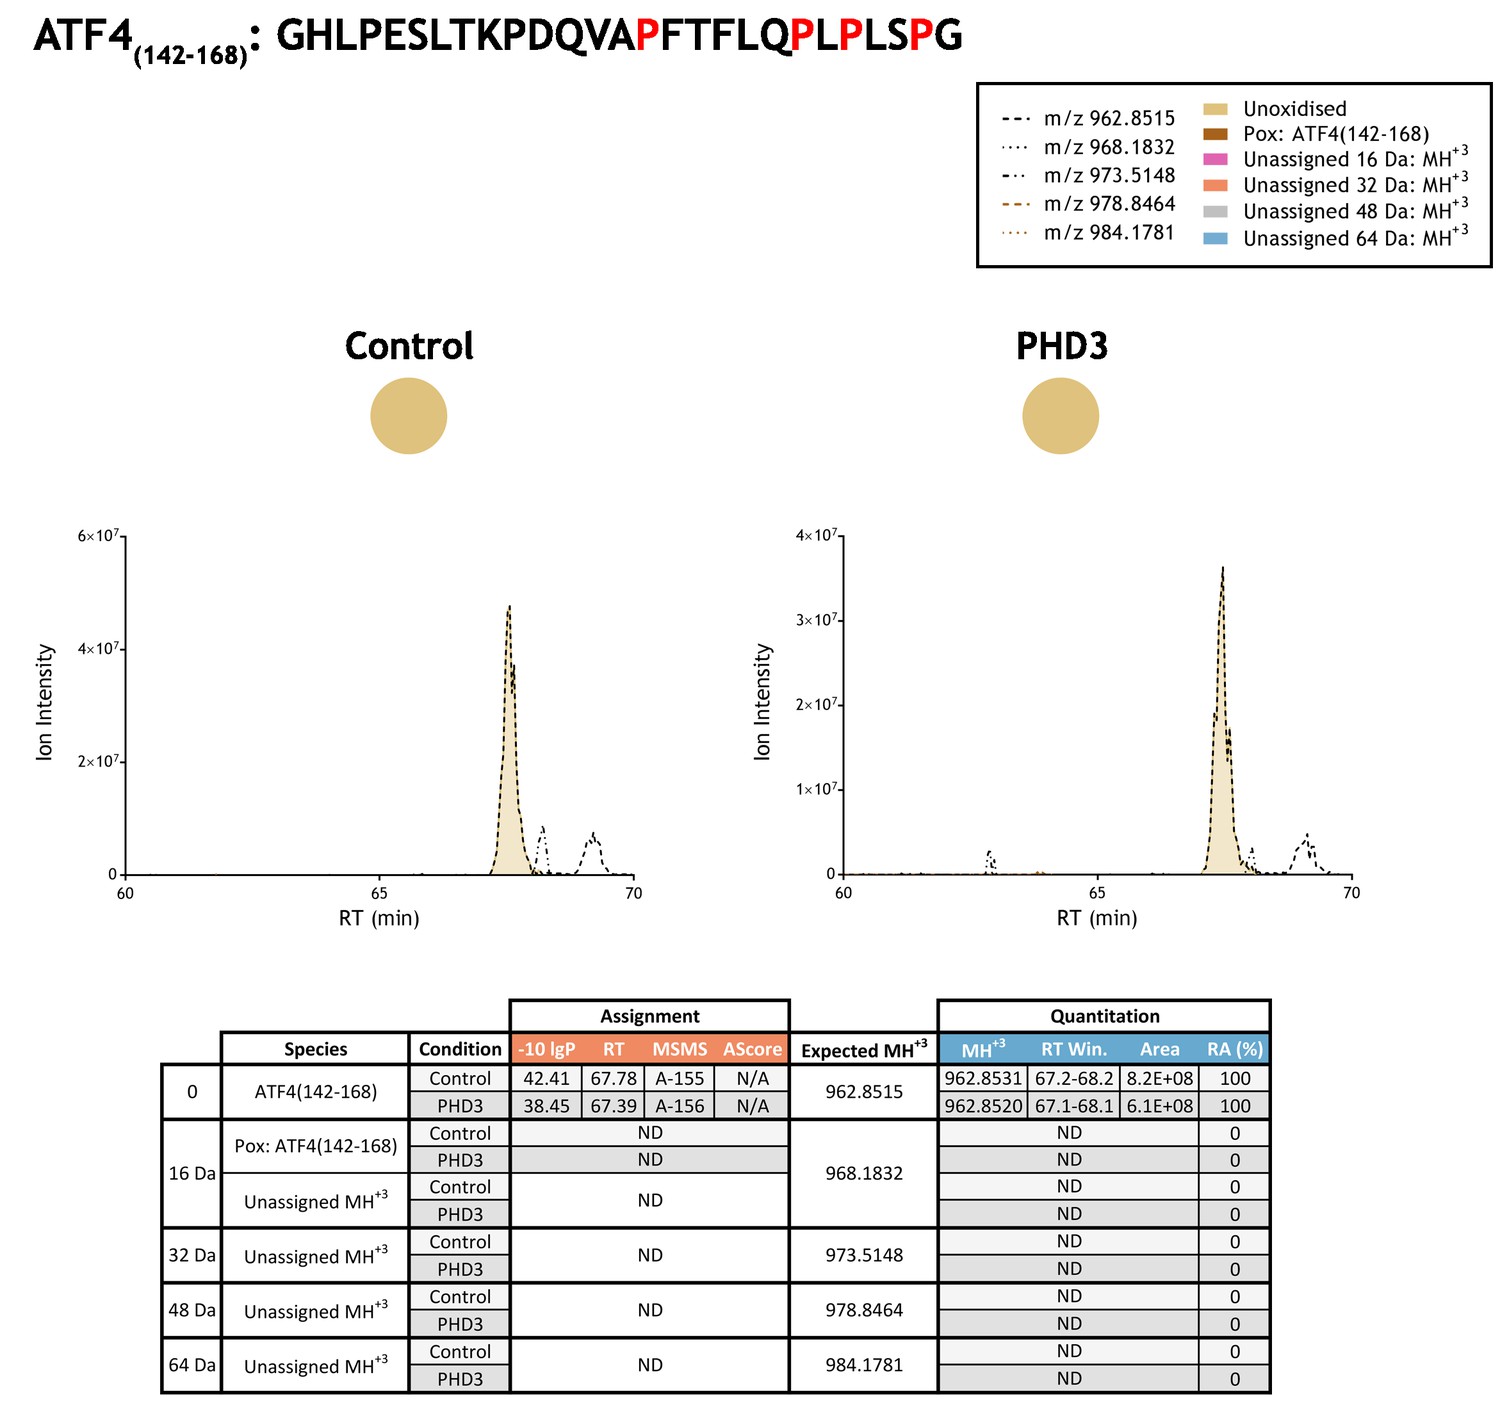
Quantitation of peptide oxidation on ATF4(142–168) following reaction of full-length activating transcription factor 4 with recombinant PHD3.
Peptide LC-MSMS analysis of activating transcription factor four target residues (P156, P162, P164, P167) required digestion with a broad specificity protease (elastase); XIC data correspond to abundant fragment ions and are representative of an overlapping series of fragment ions containing one or more target proline residues. Note, hydroxyproline peptide standards were not employed owing to the number of target proline residues in ATF4 (five candidate proline sites were defined between residues 156–174), which would require an extensive panel of peptide standards to represent all permutations (including multiple oxidations). XIC data for elastase-digested IVTT substrate under control (left) or PHD3-reacted (right) conditions. Peaks corresponding to unoxidised ATF4(142–168) were assigned by MSMS; proline oxidation was not detected on this peptide (or related peptides). Note, unshaded peaks (at RT:~69 min) corresponding to m/z 962.8515 and m/z 973.5148 are unrelated ions based on isotopic profiles (different monoisotopic mass and/or charge) observed in LC-MS data. Unassigned ions of compatible mass over charge for hydroxylation were not observed across the elution window; up to four oxidations commensurate with the number of target prolines in the ATF4(142–168) peptide were considered (see inset). Quantitative data for observed species are presented as pie charts with XIC data. Assignment and quantitation data are tabulated below, table headers are as follows: (−10lgP) significance score of leading assignment at given (RT) with ambiguity score (AScore) for PTM localisation and reference to primary MSMS data in Supplementary file 1. Quantitative data reports ion counts (Area) of observed masses (MH+3) integrated over time (RT Win.), expressed as relative abundance (RA).
Figure 3—figure supplement 10
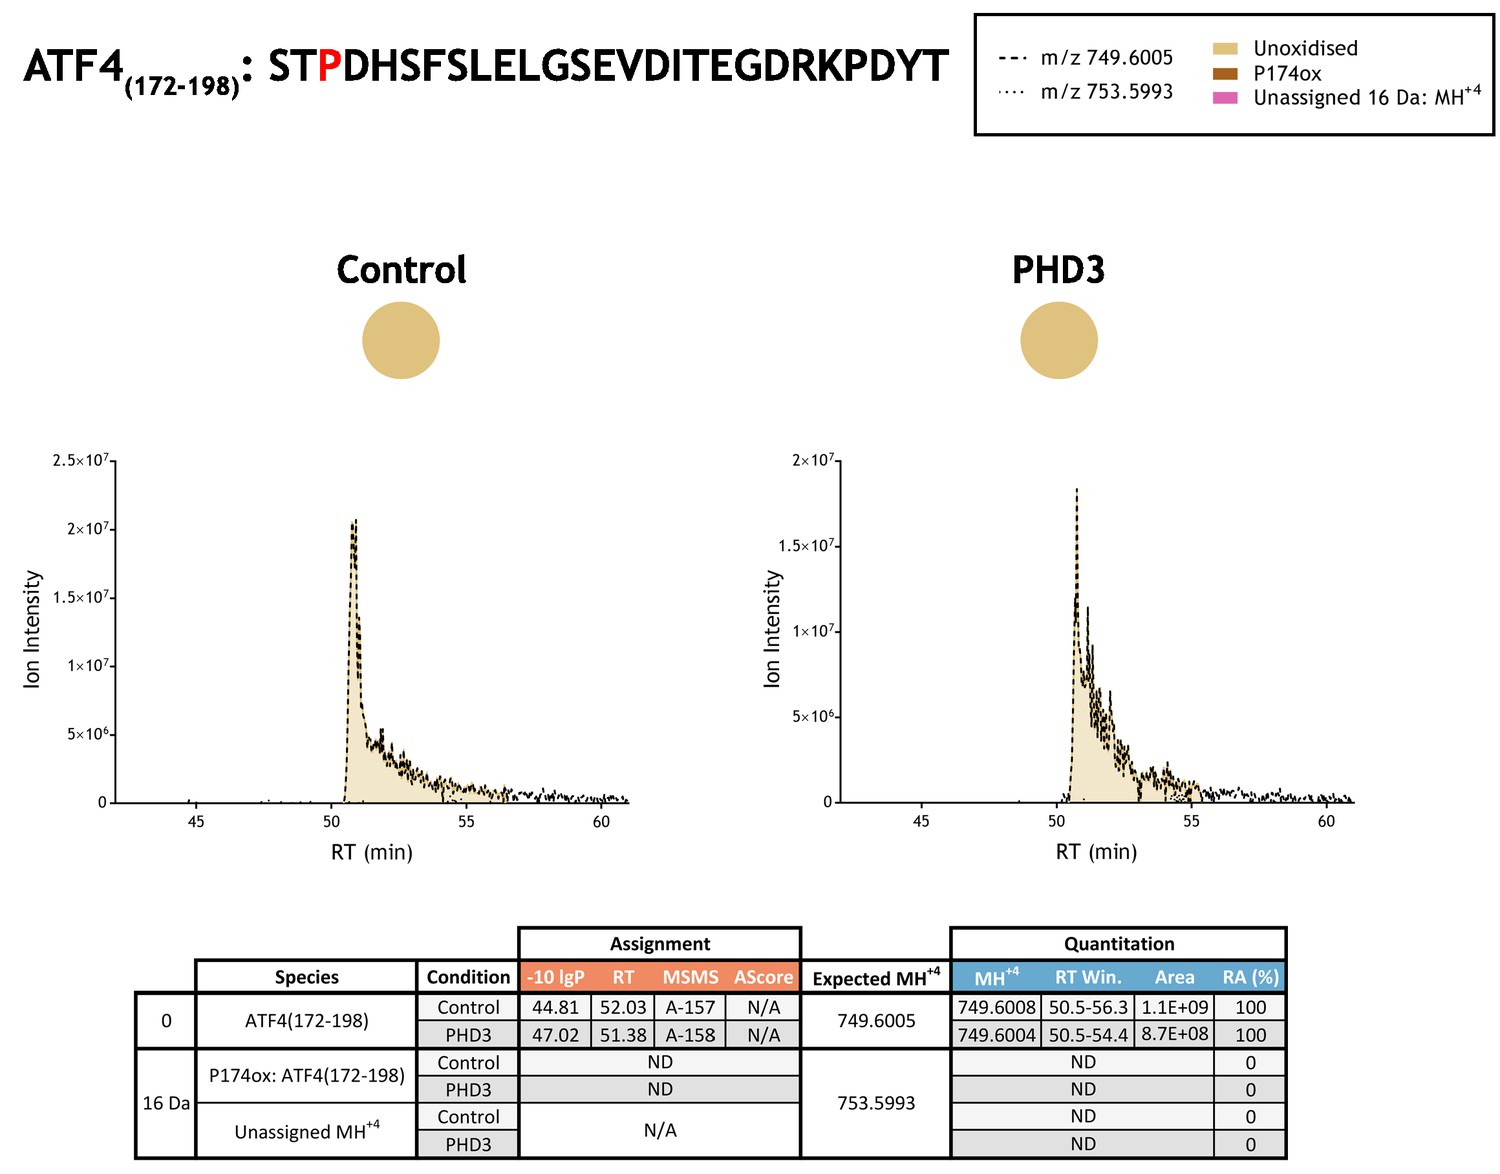
Quantitation of peptide oxidation on ATF4(172–198) following reaction of full-length activating transcription factor 4 with recombinant PHD3.
Peptide LC-MSMS analysis of activating transcription factor four target residues (P174) required digestion with a broad specificity protease (elastase); illustrated XIC data correspond to abundant fragment ions and are representative of an overlapping series of fragment ions containing P174. Note, hydroxyproline peptide standards were not employed owing to the number of target proline residues in ATF4 (five candidate proline sites were defined between residues 156–174), which would require an extensive panel of peptide standards to represent all permutations (including multiple oxidations). XIC data for elastase-digested IVTT substrate under control (left) or PHD3-reacted (right) conditions. Peaks corresponding to unoxidised ATF4(172–198) were assigned by MSMS; proline oxidation was not detected on this peptide (or any related P174-containing peptide). Unassigned ions of compatible mass over charge for hydroxylation were not observed across the elution window. Quantitative data for observed species are presented as pie charts with XIC data. Assignment and quantitation data are tabulated below, table headers are as follows: (−10lgP) significance score of leading assignment at given (RT) with ambiguity score (AScore) for PTM localisation and reference to primary MSMS data in Supplementary file 1. Quantitative data reports ion counts (Area) of observed masses (MH+4) integrated over time (RT Win.), expressed as relative abundance (RA).
Figure 3—figure supplement 11

Quantitation of peptide oxidation on CENPN(308-329) following reaction of full-length centromere protein N with recombinant PHD2.
XIC data presented in (A) shows ion intensity and retention time (RT) characteristics of equimolar synthetic peptide standards for unoxidised and P311ox forms of the CENPN(308-329) peptide. MSMS assigned species are coloured (see inset); vertical dashed lines define peak maxima used to derive ΔRT values for P311ox. Panel (B) shows comparable XIC data for protease-digested IVTT substrate under control (left) or PHD2-reacted (right) conditions. Peaks corresponding to unoxidised CENPN(308-329) were assigned by MSMS (see inset for colour code); P311ox was not detected. The estimated RT (ERT) for P311ox, derived from (A), is indicated by dashed vertical line, shading corresponds to a 1 min RT window. Note, unshaded peaks (at RT: 54–56 min) corresponding to m/z 792.4420 are unrelated ions based on isotopic profiles (different monoisotopic mass and/or charge) observed in LC-MS data. Unassigned ions of compatible mass over charge for hydroxylation were not observed across the elution window. Quantitative data for observed species are presented as pie charts with XIC data. Assignment and quantitation data are tabulated below each panel, table headers are as follows: (−10lgP) significance score of leading assignment at given (RT) with ambiguity score (AScore) for PTM localisation and reference to primary MSMS data in Supplementary file 1. Quantitative data reports ion counts (Area) of observed masses (MH+3) integrated over time (RT Win.), expressed as relative abundance (RA). Data on detection efficiency for synthetic peptides (Panel A, P: Hyp) is an aggregated ratio of prolyl (P) to hydroxyprolyl (Hyp) containing species.
Figure 3—figure supplement 12
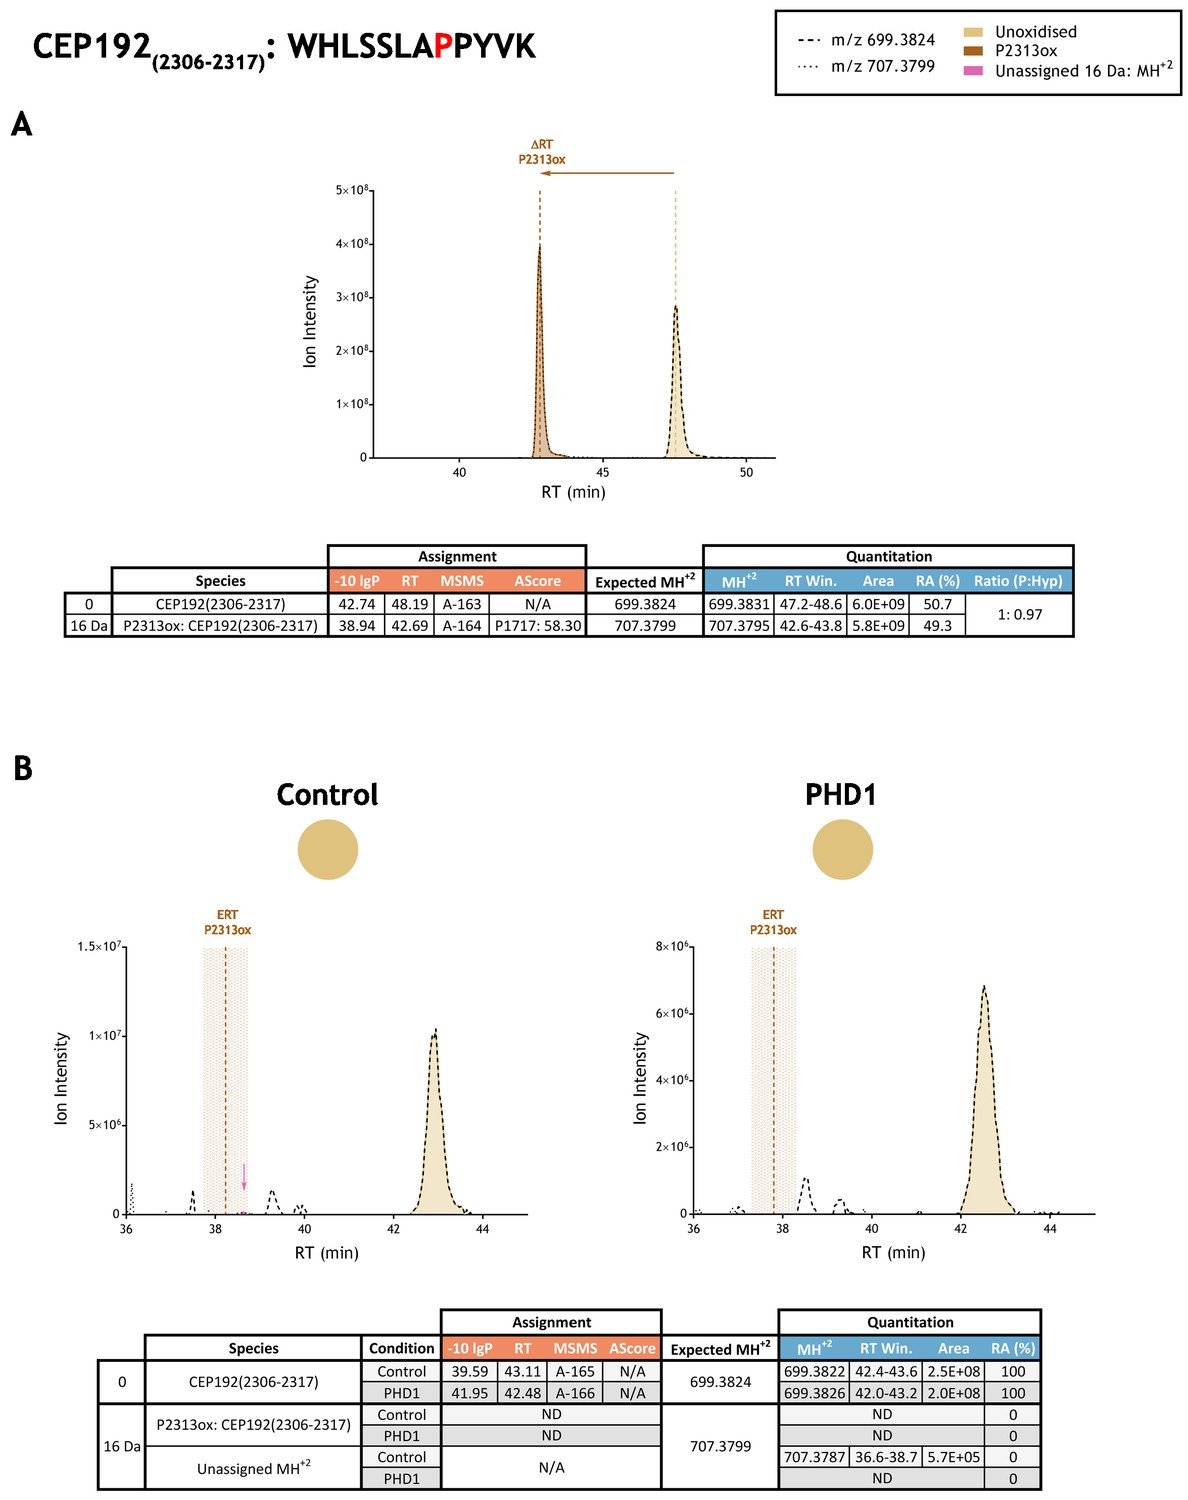
Quantitation of peptide oxidation on CEP192(2306–2317) following reaction of full-length centrosomal protein 192 (isoform 1) with recombinant PHD1.
XIC data presented in (A) shows ion intensity and retention time (RT) characteristics of equimolar synthetic peptide standards for unoxidised and P2313ox forms of the CEP192(2306–2317) peptide. MSMS assigned species are coloured (see inset); vertical dashed lines define peak maxima used to derive ΔRT values for P2313ox. Panel (B) shows comparable XIC data for protease-digested IVTT substrate under control (left) or PHD1-reacted (right) conditions. Peaks corresponding to unoxidised CEP192(2306–2317) were assigned by MSMS (see inset for colour code); P2313ox was not detected. The estimated RT (ERT) for P2313ox, derived from (A), is indicated by dashed vertical line; shading corresponds to a 1 min RT window. Peptide ions of low abundance that were compatible with oxidation but not assigned by MSMS are indicated (pink arrow). Quantitative data for observed species are presented as pie charts with XIC data. Assignment and quantitation data are tabulated below each panel, table headers are as follows: (−10lgP) significance score of leading assignment at given (RT) with ambiguity score (AScore) for PTM localisation and reference to primary MSMS data in Supplementary file 1. Quantitative data reports ion counts (Area) of observed masses (MH+2) integrated over time (RT Win.), expressed as relative abundance (RA). Data on detection efficiency for synthetic peptides (Panel A, P: Hyp) is an aggregated ratio of prolyl (P) to hydroxyprolyl (Hyp) containing species.
Figure 3—figure supplement 13
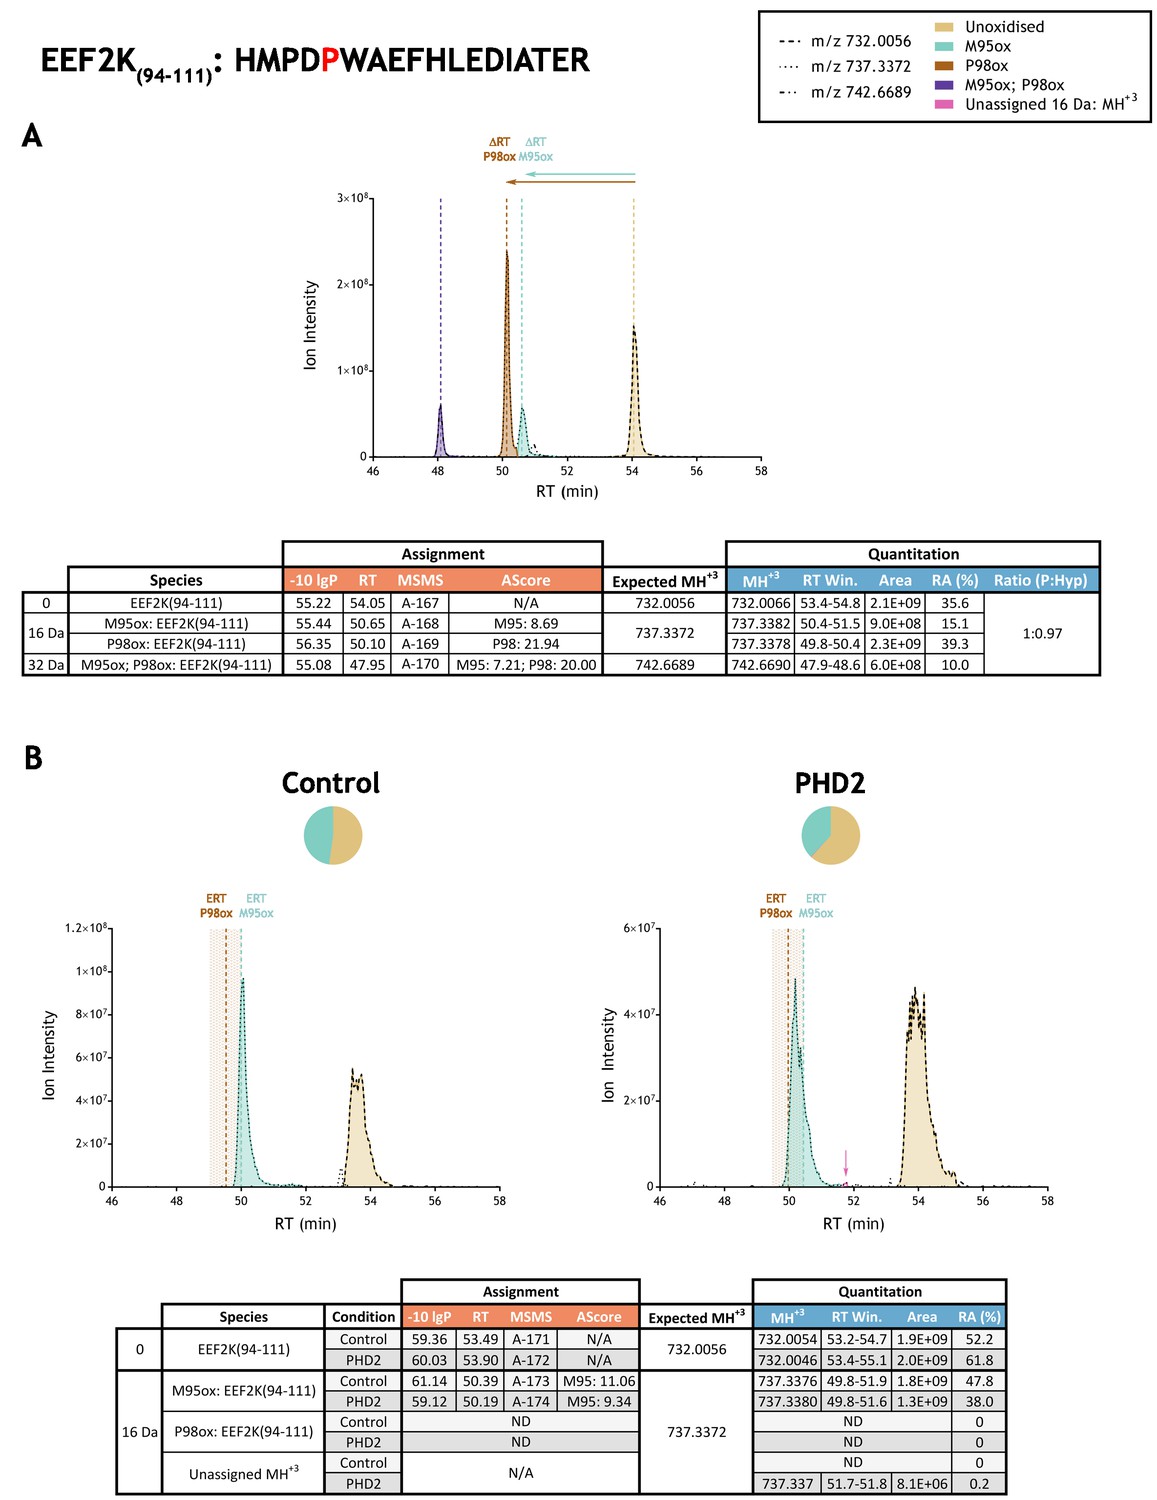
Quantitation of peptide oxidation on EEF2K(94-111) following reaction of full-length eukaryotic elongation factor 2 kinase with recombinant PHD2.
XIC data presented in (A) shows ion intensity and retention time (RT) characteristics of equimolar synthetic peptide standards for unoxidised and P98ox forms of the EEF2K(94-111) peptide. MSMS assigned species are coloured (see inset) and include non-enzymatic methionine oxidation (M95ox; turquoise) which elutes close to the hydroxyproline-containing (P95ox; brown) ion. Vertical dashed lines define peak maxima used to derive ΔRT values for M95ox and P98ox. Panel (B) shows comparable XIC data for protease-digested IVTT substrate under control (left) or PHD2-reacted (right) conditions. Peaks corresponding to unoxidised and M95ox forms of EEF2K(94-111) were assigned by MSMS; P98ox was not detected. Estimated RT (ERT) values for oxidised peptides, derived from (A), are indicated by dashed vertical lines; shading applied to ERT P98ox corresponds to a 1 min RT window that partially overlaps with the elution profile of M95ox. Note, follow-up studies that employed parallel reaction monitoring of MS2 ions found no evidence for P98ox co-eluting with M95ox in IVTT-derived material (Figure 3). Peptide ions of low abundance that were compatible with oxidation but not assigned by MSMS are indicated (pink arrow). Quantitative data for observed species are presented as pie charts with XIC data. Assignment and quantitation data are tabulated below each panel, table headers are as follows: (−10lgP) significance score of leading assignment at given (RT) with ambiguity score (AScore) for PTM localisation and reference to primary MSMS data in Supplementary file 1. Quantitative data reports ion counts (Area) of observed masses (MH+3) integrated over time (RT Win.), expressed as relative abundance (RA). Data on detection efficiency for synthetic peptides (Panel A, P: Hyp) is an aggregated ratio of prolyl (P) to hydroxyprolyl (Hyp) containing species.
Figure 3—figure supplement 14
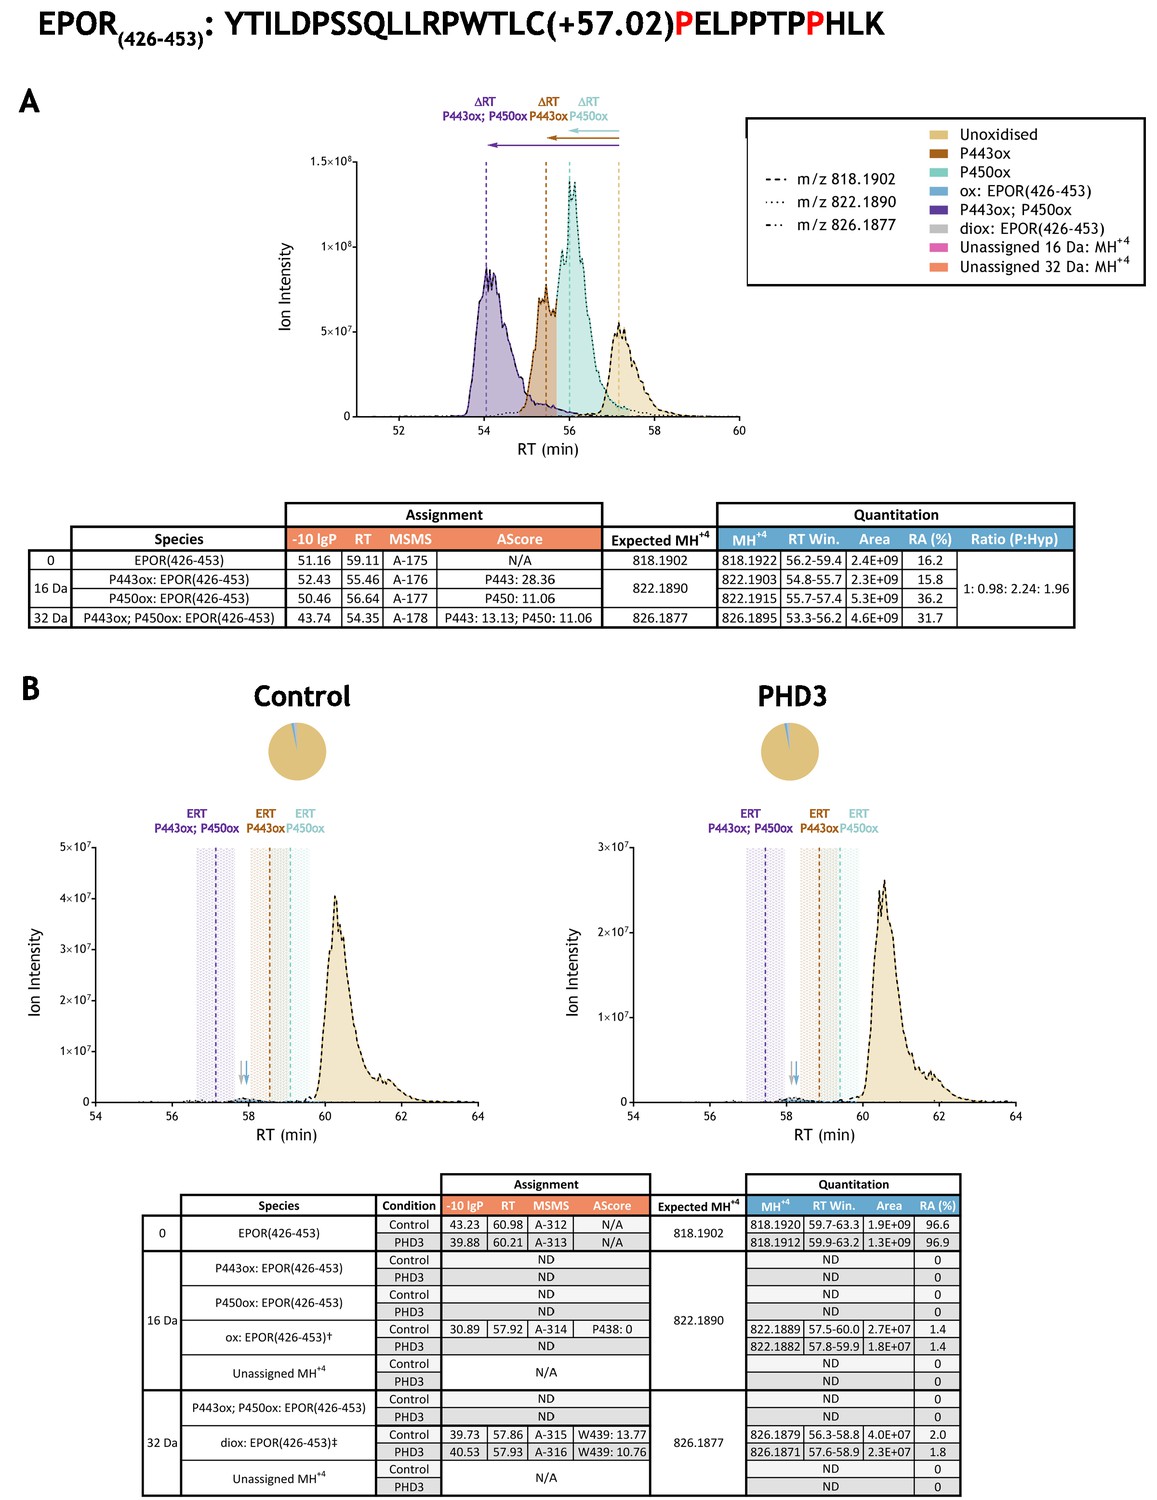
Quantitation of peptide oxidation on EPOR(426-453) following reaction of the cytoplasmic domain of erythropoietin receptor (274-508) with recombinant PHD3.
XIC data presented in (A) shows ion intensity and retention time (RT) characteristics of equimolar synthetic peptide standards for unoxidised and proline oxidised forms (P443ox, P450ox or combined) of the EPOR(426-453) peptide. MSMS assigned species are coloured (see inset); vertical dashed lines define peak maxima used to derive ΔRT values for the different hydroxyproline-containing peptides. Note, the elution profiles of P443ox (brown) and P450ox (turquoise) ions overlap; area calculations were performed by vertical bisection of the valley between the co-eluting peaks to the baseline. Panel (B) shows comparable XIC data for protease-digested IVTT substrate under control (left) or PHD3-reacted (right) conditions. Peaks corresponding to unoxidised (light brown) and low stoichiometry singly-oxidised (blue arrow) and doubly-oxidised (grey arrow) forms of EPOR(426-453) were detected in control and PHD3-reacted IVTT preparations. The site of oxidation was ambiguous in the context of the singly-oxidised peptide (nominally localised to P438: AScore 0; see Supplementary file 1 A-314 for MSMS) and assigned as low confidence tryptophan di-oxidation (W439: Ascore 13.77; see Supplementary file 1 A-315 and A-316 for MSMS) on the doubly-oxidised peptide. The elution profile of the low abundance oxidised ions was distinct from the expected retention time (ERT) of hydroxyproline-containing peptides (indicated by dashed vertical lines; shading corresponds to a 1 min RT window) and did not change in abundance relative to the unoxidised peptide following reaction with PHD3. Unassigned ions with a compatible mass over charge for oxidation (including +16 Da and +32 Da species) were not observed across the elution window. Quantitative data for observed species are presented as pie charts with XIC data. Assignment and quantitation data are tabulated below each panel, table headers are as follows: (−10lgP) significance score of leading assignment at given (RT) with ambiguity score (AScore) for PTM localisation and reference to primary MSMS data in Supplementary file 1. Species column: Fragment ions (including neutral loss ions) localise mono-oxidation† to residues 431–445 and di-oxidation‡ to residues 431–442. Quantitative data reports ion counts (Area) of observed masses (MH+4) integrated over time (RT Win.), expressed as relative abundance (RA). Data on detection efficiency for synthetic peptides (Panel A, P: Hyp) is an aggregated ratio of prolyl (P) to hydroxyprolyl (Hyp) containing species.
Figure 3—figure supplement 15
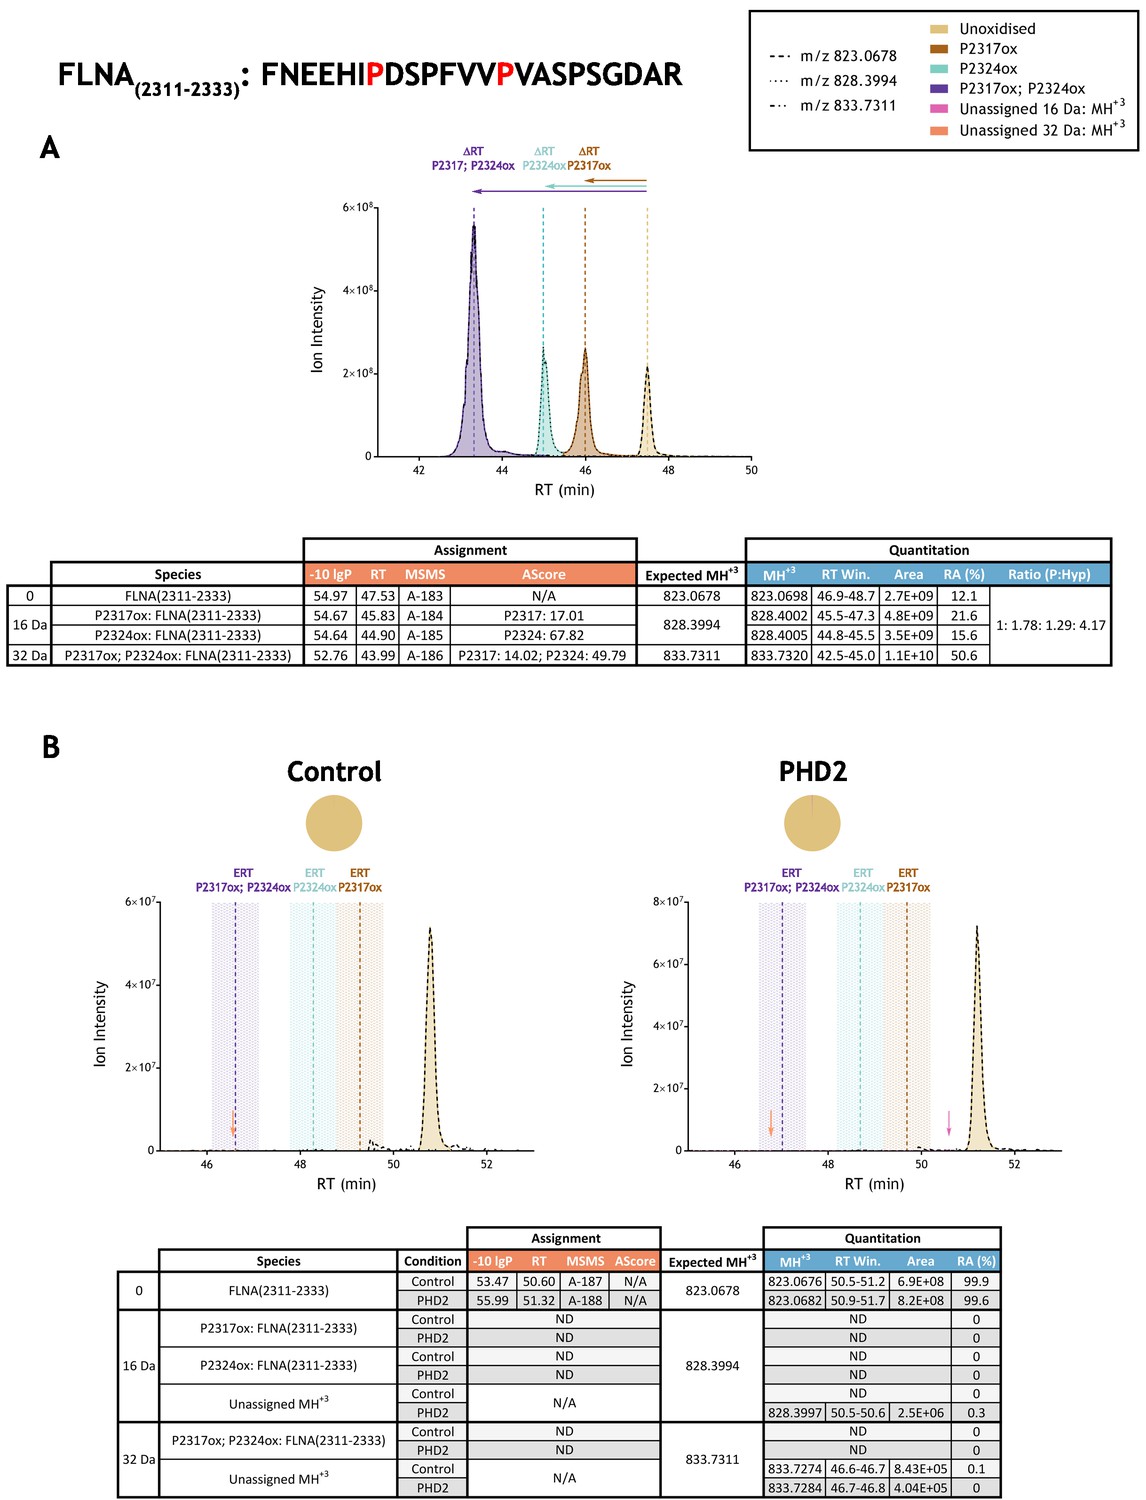
Quantitation of peptide oxidation on FLNA(2311–2333) following reaction of full-length filamin A with recombinant PHD2.
XIC data presented in (A) shows ion intensity and retention time (RT) characteristics of equimolar synthetic peptide standards for unoxidised and proline oxidised forms (P2317ox, P2324ox or combined) of the FLNA(2311–2333) peptide. MSMS assigned species are coloured (see inset); vertical dashed lines define peak maxima used to derive ΔRT values for the different hydroxyproline-containing peptides. Note, comparative ion counts were 4-fold higher for the doubly oxidised peptide (purple) relative to the unoxidised peptide. Panel (B) shows comparable XIC data for protease-digested IVTT substrate under control (left) or PHD2-reacted (right) conditions. Peaks corresponding to unoxidised FLNA(2311–2333) were detected in both control and enzyme reacted conditions; proline oxidation was not reported at any site. Estimated RT (ERT) values for proline oxidised peptides, derived from (A), are indicated by dashed vertical lines; shading corresponds to a 1 min RT window. Peptide ions of low abundance that were compatible with either single (+16 Da) or double (+32 Da) oxidation events but not assigned by MSMS are indicated with pink and orange arrows, respectively. Quantitative data for observed species are presented as pie charts with XIC data. Assignment and quantitation data are tabulated below each panel, table headers are as follows: (−10lgP) significance score of leading assignment at given (RT) with ambiguity score (AScore) for PTM localisation and reference to primary MSMS data in Supplementary file 1. Quantitative data reports ion counts (Area) of observed masses (MH+3) integrated over time (RT Win.), expressed as relative abundance (RA). Data on detection efficiency for synthetic peptides (Panel A, P: Hyp) is an aggregated ratio of prolyl (P) to hydroxyprolyl (Hyp) containing species.
Figure 3—figure supplement 16
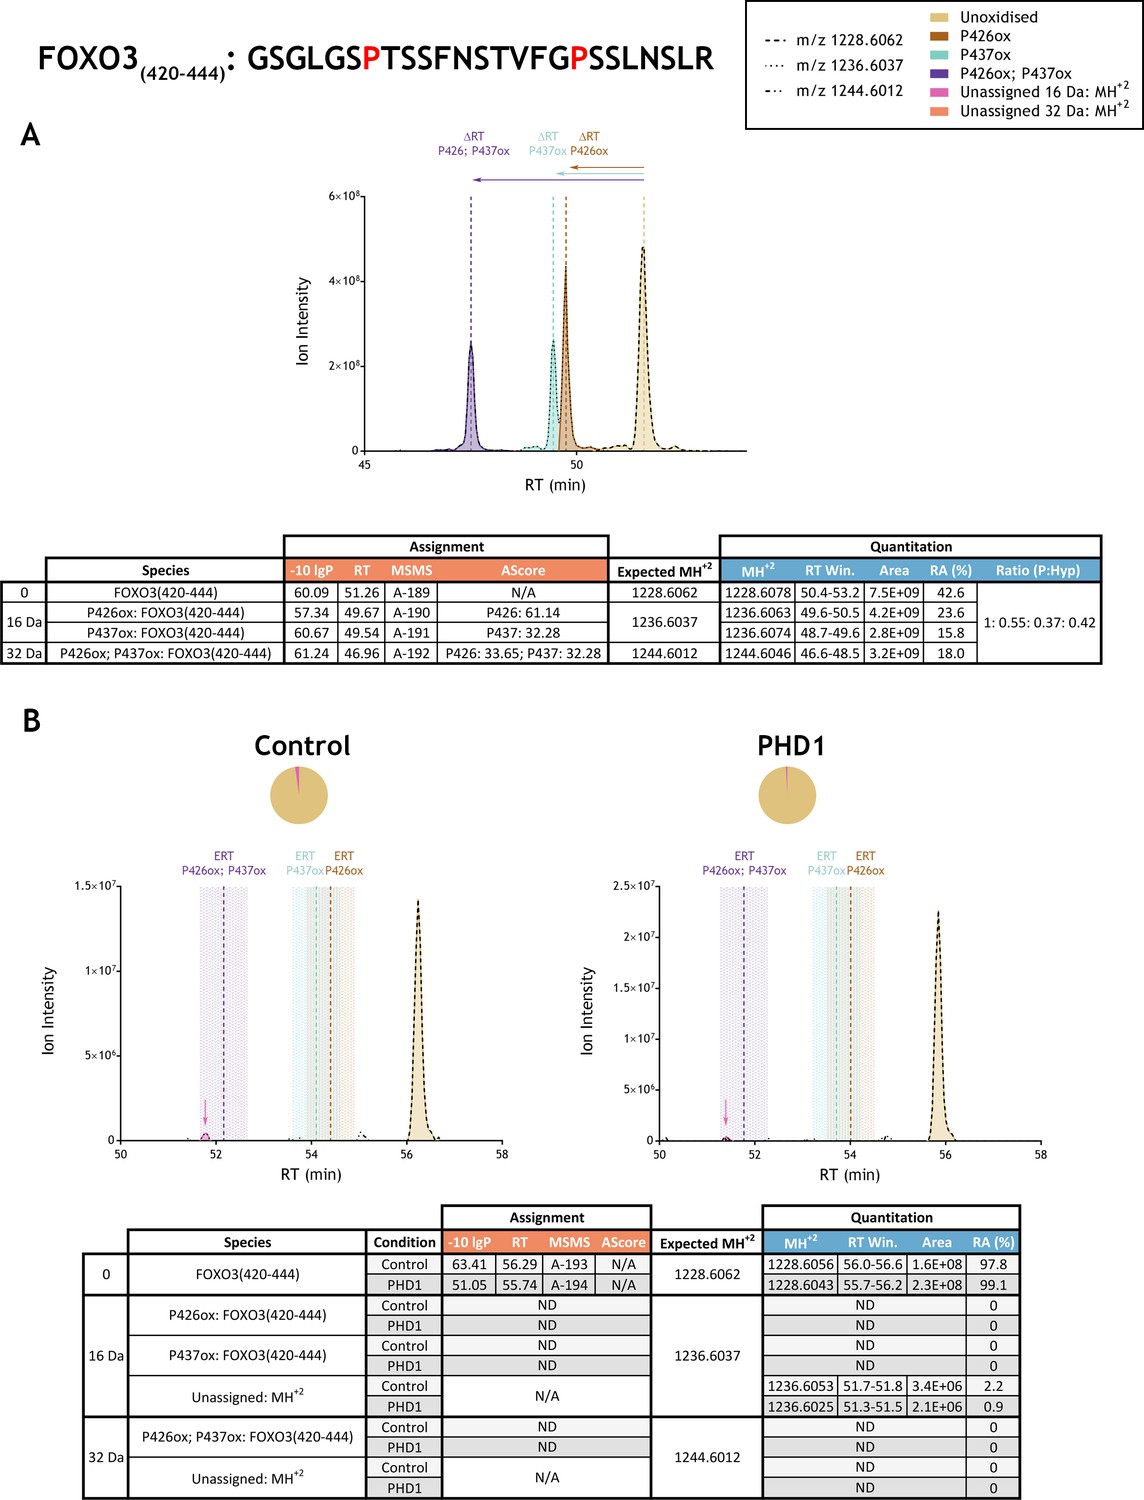
Quantitation of peptide oxidation on FOXO3(420–444) following reaction of full-length forkhead box O3 with recombinant PHD1.
XIC data presented in (A) shows ion intensity and retention time (RT) characteristics of equimolar synthetic peptide standards for unoxidised and proline oxidised forms (P426ox, P437ox or combined) of the FOXO3(420–444) peptide. MSMS assigned species are coloured (see inset); vertical dashed lines define peak maxima used to derive ΔRT values for the different hydroxyproline-containing peptides. Note, the elution profiles of P426ox (brown) and P437ox (turquoise) ions overlap; area calculations were performed by vertical bisection of the valley between the co-eluting peaks to the baseline. Panel (B) shows comparable XIC data for protease-digested IVTT substrate under control (left) or PHD1-reacted (right) conditions. Peaks corresponding to unoxidised FOXO3(420–444) were detected in both control and enzyme reacted conditions; proline oxidation was not reported at any site. Estimated RT (ERT) values for proline oxidised peptides, derived from (A), are indicated by dashed vertical lines; shading corresponds to a 1 min RT window. Peptide ions of low abundance that were compatible with a single (+16 Da) oxidation event but not assigned by MSMS are indicated (pink arrow); unassigned ions with a compatible mass over charge for double oxidation (i.e.,+32 Da) were not observed across the elution window. Quantitative data for observed species are presented as pie charts with XIC data. Assignment and quantitation data are tabulated below each panel, table headers are as follows: (−10lgP) significance score of leading assignment at given (RT) with ambiguity score (AScore) for PTM localisation and reference to primary MSMS data in Supplementary file 1. Quantitative data reports ion counts (Area) of observed masses (MH+2) integrated over time (RT Win.), expressed as relative abundance (RA). Data on detection efficiency for synthetic peptides (Panel A, P: Hyp) is an aggregated ratio of prolyl (P) to hydroxyprolyl (Hyp) containing species.
Figure 3—figure supplement 17
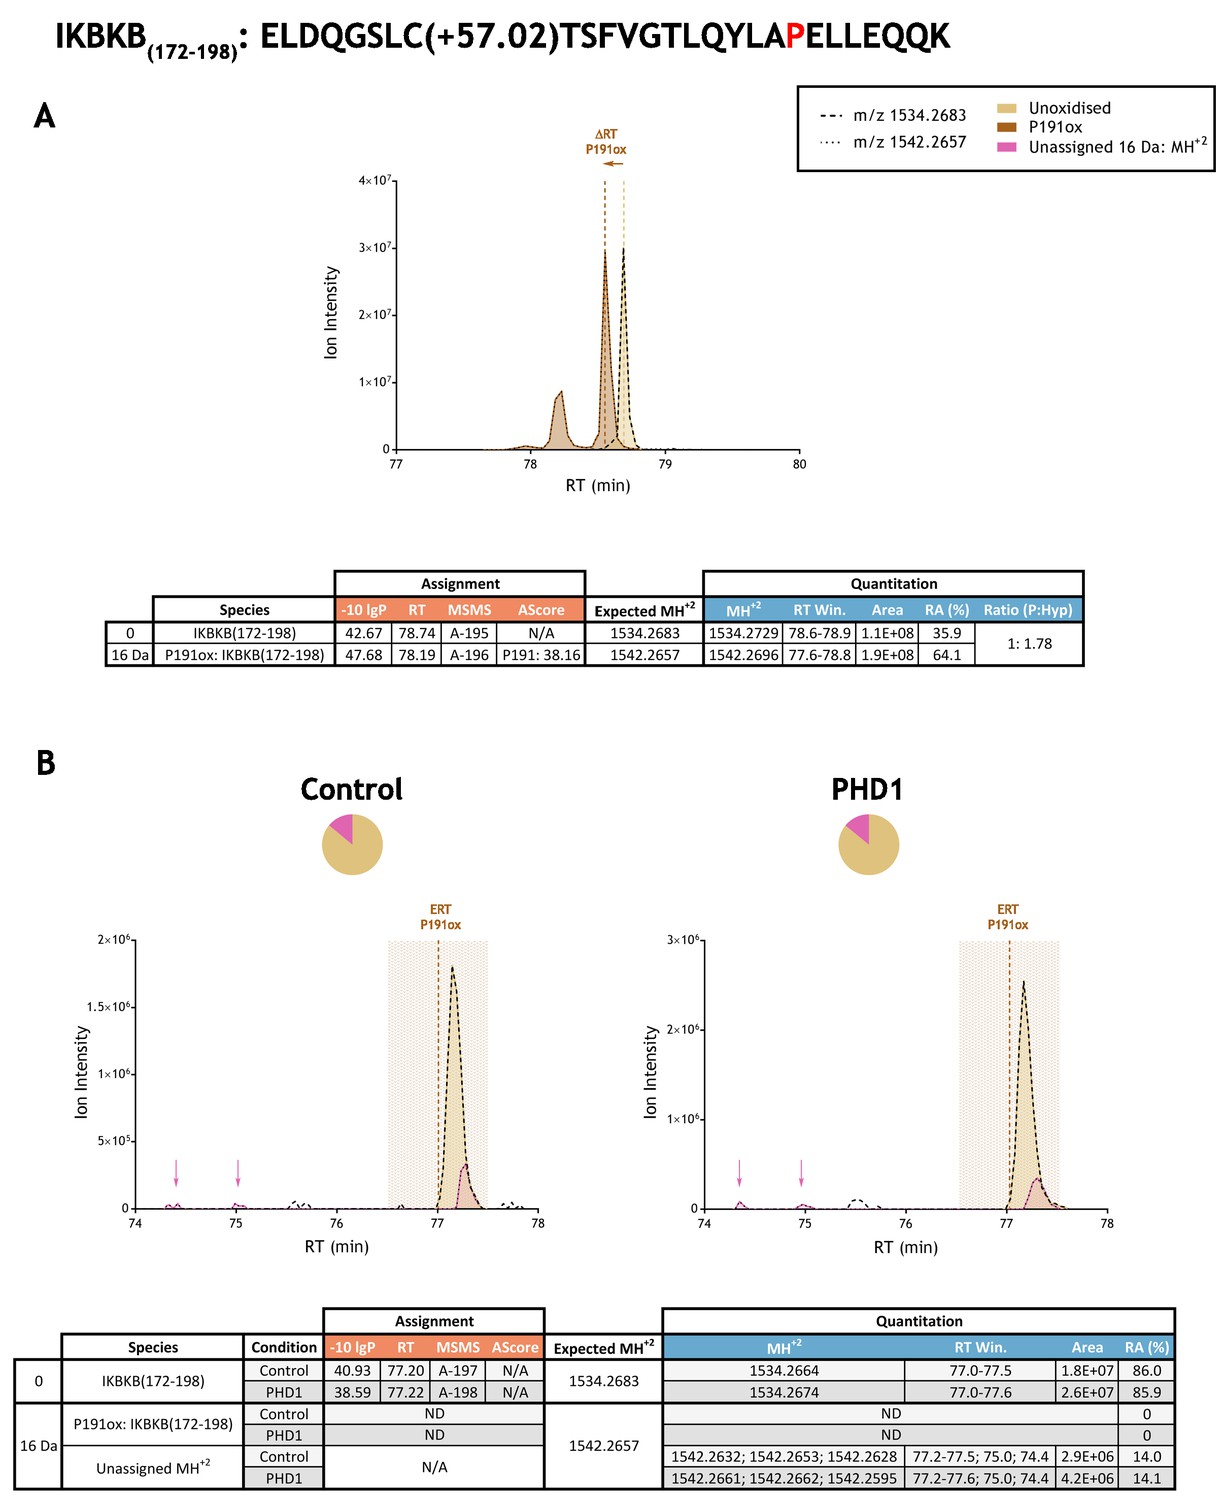
Quantitation of peptide oxidation on IKBKB(172-198) following reaction of full-length inhibitor of nuclear factor kappa B kinase subunit beta with recombinant PHD1.
XIC data presented in (A) shows ion intensity and retention time (RT) characteristics of equimolar synthetic peptide standards for unoxidised and P191ox forms of the IKBKB(172-198) peptide. MSMS assigned species are coloured (see inset); vertical dashed lines define peak maxima used to derive ΔRT values for P191ox. For reasons that are not clear, the P191ox peptide standard reproducibly displayed a minor peak that eluted ~0.5 min before the major peak (to which the ΔRT value is calculated). Panel (B) shows comparable XIC data for protease-digested IVTT substrate under control (left) or PHD1-reacted (right) conditions. Peaks corresponding to unoxidised IKBKB(172-198) were assigned by MSMS (see inset for colour code); P191ox was not detected. The estimated RT (ERT) for P191ox, derived from (A), is indicated by dashed vertical line, shading corresponds to a 1 min RT window. Unassigned ions of compatible mass over charge for hydroxylation were observed across the elution window but their relative abundance was unchanged following reaction with PHD1 (pink and arrow). Quantitative data for observed species are presented as pie charts with XIC data. Assignment and quantitation data are tabulated below each panel, table headers are as follows: (−10lgP) significance score of leading assignment at given (RT) with ambiguity score (AScore) for PTM localisation and reference to primary MSMS data in Supplementary file 1. Quantitative data reports ion counts (Area) of observed masses (MH+2) integrated over time (RT Win.), expressed as relative abundance (RA). Data on detection efficiency for synthetic peptides (Panel A, P: Hyp) is an aggregated ratio of prolyl (P) to hydroxyprolyl (Hyp) containing species.
Figure 3—figure supplement 18

Quantitation of peptide oxidation on NDRG3(287–301) following reaction of N-terminally truncated NDRG3 (residues 108–375) with recombinant PHD2.
XIC data presented in (A) shows ion intensity and retention time (RT) characteristics of equimolar synthetic peptide standards for unoxidised and P294ox forms of the tryptic NDRG3(287–301) peptide. MSMS assigned species including non-enzymatic oxidations are coloured (see inset); vertical dashed lines define peak maxima used to derive ΔRT values for key oxidised ions. (B) Shows comparable XIC data for protease-digested IVTT substrate under control (left) or PHD2-reacted (right) conditions. Peaks corresponding to unoxidised and M287ox forms of NDRG3(287–301) were assigned by MSMS (see inset for colour code); P294ox was not detected. Estimated RT (ERT) values for oxidised peptides, derived from (A), are indicated by dashed vertical lines, shading applied to ERT P294ox corresponds to a 1 min RT window. Peptide ions of low abundance that were compatible with oxidation but not assigned by MSMS are also indicated (pink arrow). Quantitative data for observed species are presented as pie charts with XIC data. Assignment and quantitative data is provided below each panel as follows: (−10lgP) significance score of leading assignment at given (RT) with ambiguity score (AScore) for PTM localisation and reference to primary MSMS data in Supplementary file 1. Quantitative data reports ion counts (Area) of observed masses (MH+2) integrated over time (RT Win.), expressed as relative abundance (RA). Data on detection efficiency for synthetic peptides (Panel A, P: Hyp) is an aggregated ratio of prolyl (P) to hydroxyprolyl (Hyp) species.
Figure 3—figure supplement 19
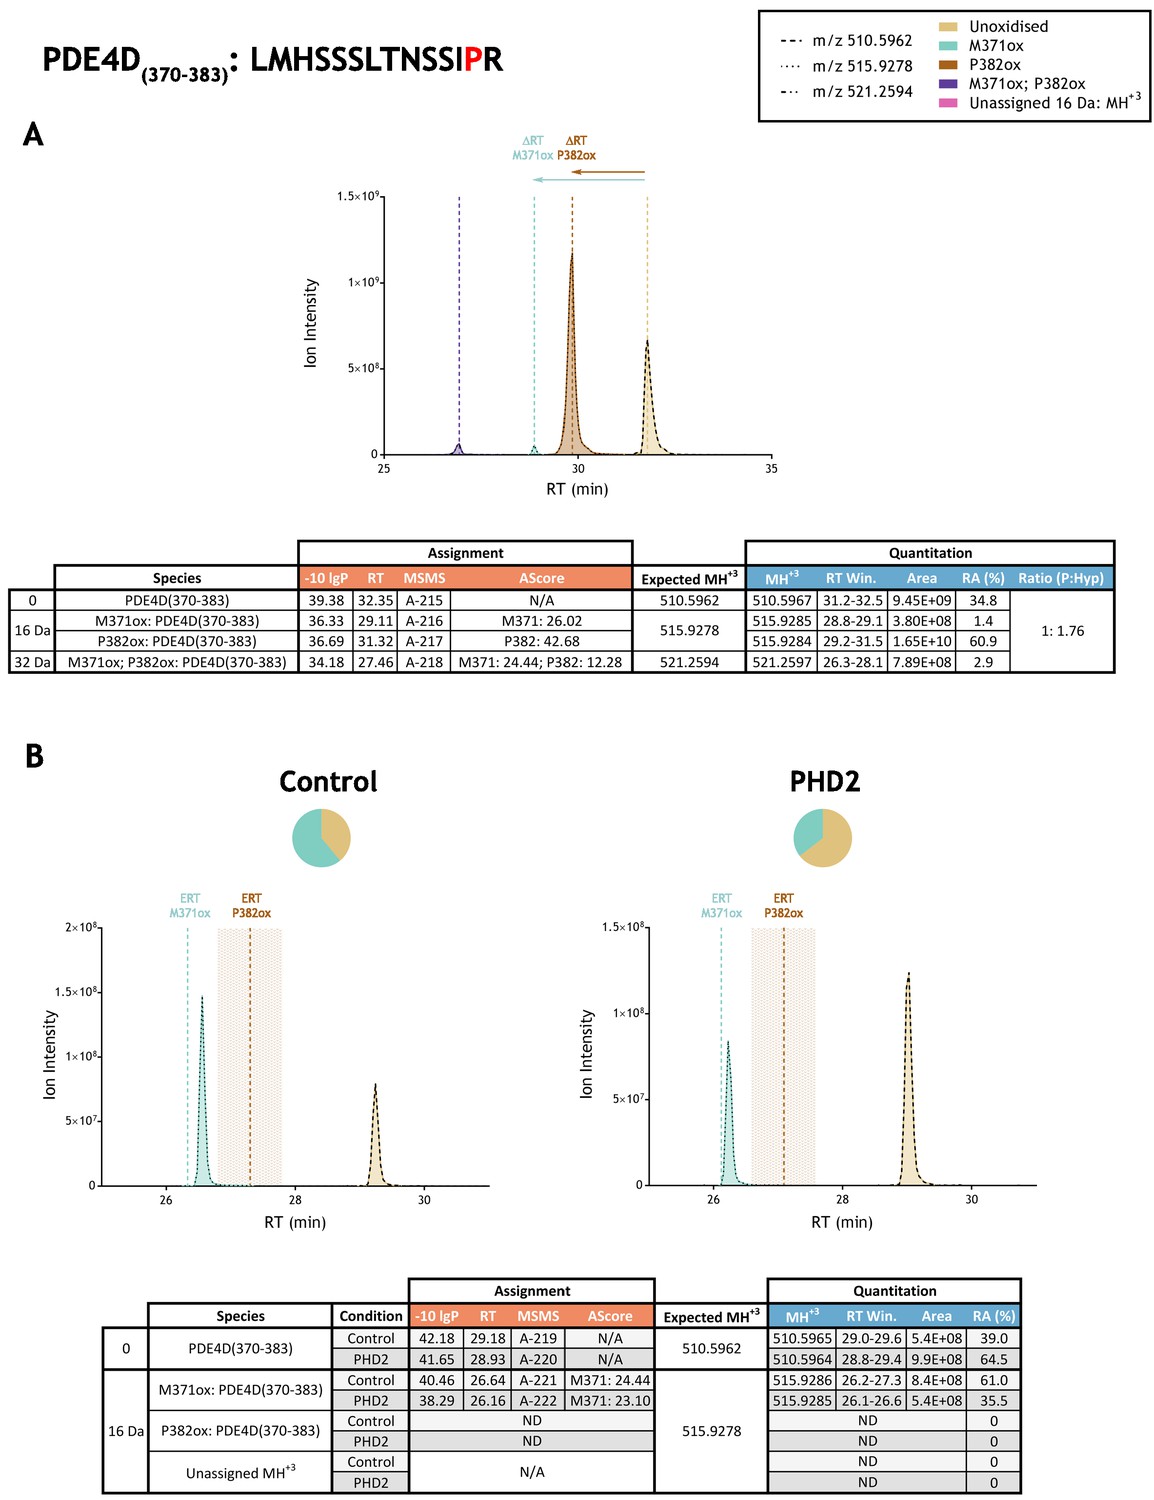
Quantitation of peptide oxidation on PDE4D(370-383) following reaction of full-length phosphodiesterase 4D (isoform 6) with recombinant PHD2.
XIC data presented in (A) shows ion intensity and retention time (RT) characteristics of equimolar synthetic peptide standards for unoxidised and P382ox forms of the PDE4D(370-383) peptide. MSMS assigned species are coloured (see inset) and include low abundance non-enzymatic methionine oxidation (M371ox; turquoise); vertical dashed lines define peak maxima used to derive ΔRT values for M371ox and P382ox. Panel (B) shows comparable XIC data for protease-digested IVTT substrate under control (left) or PHD2-reacted (right) conditions. Peaks corresponding to unoxidised and M371ox forms of PDE4D(370-383) were assigned by MSMS; P382ox was not detected. Estimated RT (ERT) values for oxidised peptides, derived from (A), are indicated by dashed vertical lines and show IVTT-derived M371ox eluting close to the ERT; shading applied to ERT P382ox corresponds to a 1 min RT window. Unassigned ions of compatible mass over charge for hydroxylation were not observed across the elution window. Quantitative data for observed species are presented as pie charts with XIC data. Assignment and quantitation data are tabulated below each panel, table headers are as follows: (−10lgP) significance score of leading assignment at given (RT) with ambiguity score (AScore) for PTM localisation and reference to primary MSMS data in Supplementary file 1. Quantitative data reports ion counts (Area) of observed masses (MH+3) integrated over time (RT Win.), expressed as relative abundance (RA). Data on detection efficiency for synthetic peptides (Panel A, P: Hyp) is an aggregated ratio of prolyl (P) to hydroxyprolyl (Hyp) containing species.
Figure 3—figure supplement 20
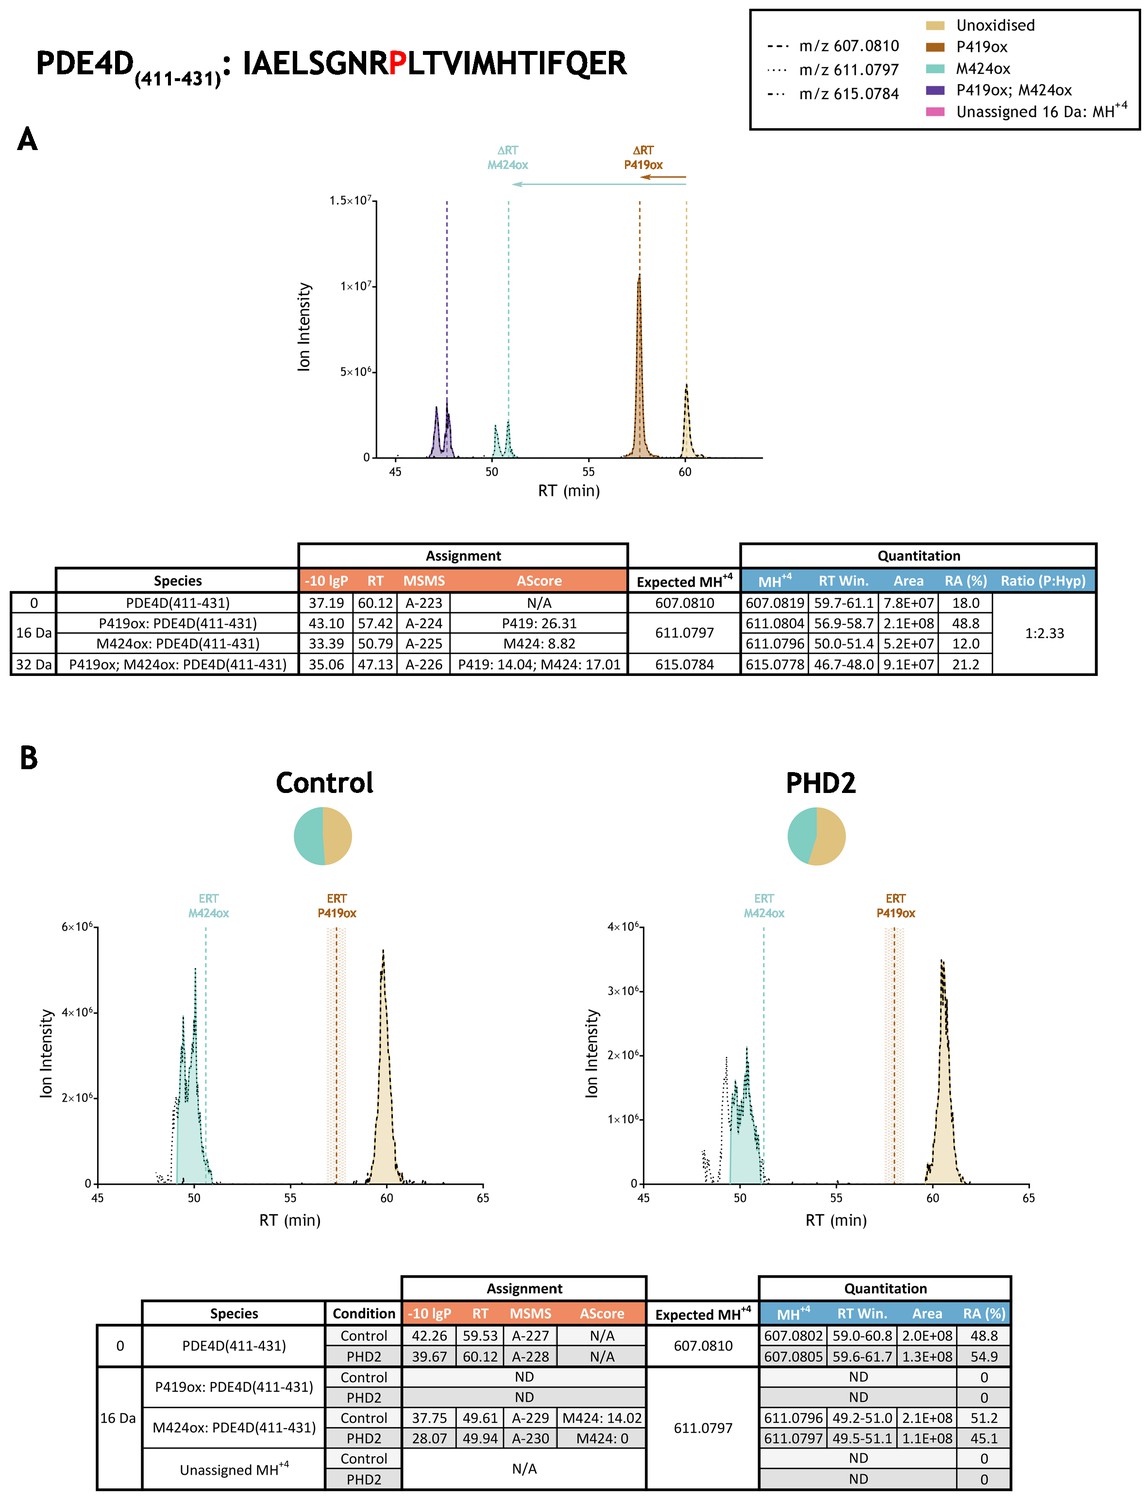
Quantitation of peptide oxidation on PDE4D(411-431) following reaction of full-length phosphodiesterase 4D (isoform 6) with recombinant PHD2.
XIC data presented in (A) shows ion intensity and retention time (RT) characteristics of equimolar synthetic peptide standards for unoxidised and P419ox forms of the PDE4D(411-431) peptide. MSMS assigned species are coloured (see inset) and include non-enzymatic methionine oxidation (M424ox; turquoise) that elutes as a split peak; vertical dashed lines define peak maxima used to derive ΔRT values for P419ox and M424ox. Panel (B) shows comparable XIC data for protease-digested IVTT substrate under control (left) or PHD2-reacted (right) conditions. Peaks corresponding to unoxidised and M424ox forms of PDE4D(411-431) were assigned by MSMS (see inset for colour code); P419ox was not detected. Estimated RT (ERT) values for oxidised peptides, derived from (A), are indicated by dashed vertical lines, shading applied to ERT P419ox corresponds to a 1 min RT window. Unassigned ions of compatible mass over charge for hydroxylation were not observed across the elution window. Note, unrelated ions were detected in the XIC of m/z 611.0797; turquoise shading corresponds to the monoisotopic MSMS-assigned M424ox species. Quantitative data for observed species are presented as pie charts with XIC data. Assignment and quantitation data are tabulated below each panel, table headers are as follows: (−10lgP) significance score of leading assignment at given (RT) with ambiguity score (AScore) for PTM localisation and reference to primary MSMS data in Supplementary file 1. Quantitative data reports ion counts (Area) of observed masses (MH+3) integrated over time (RT Win.), expressed as relative abundance (RA). Data on detection efficiency for synthetic peptides (Panel A, P: Hyp) is an aggregated ratio of prolyl (P) to hydroxyprolyl (Hyp) containing species.
Figure 3—figure supplement 21
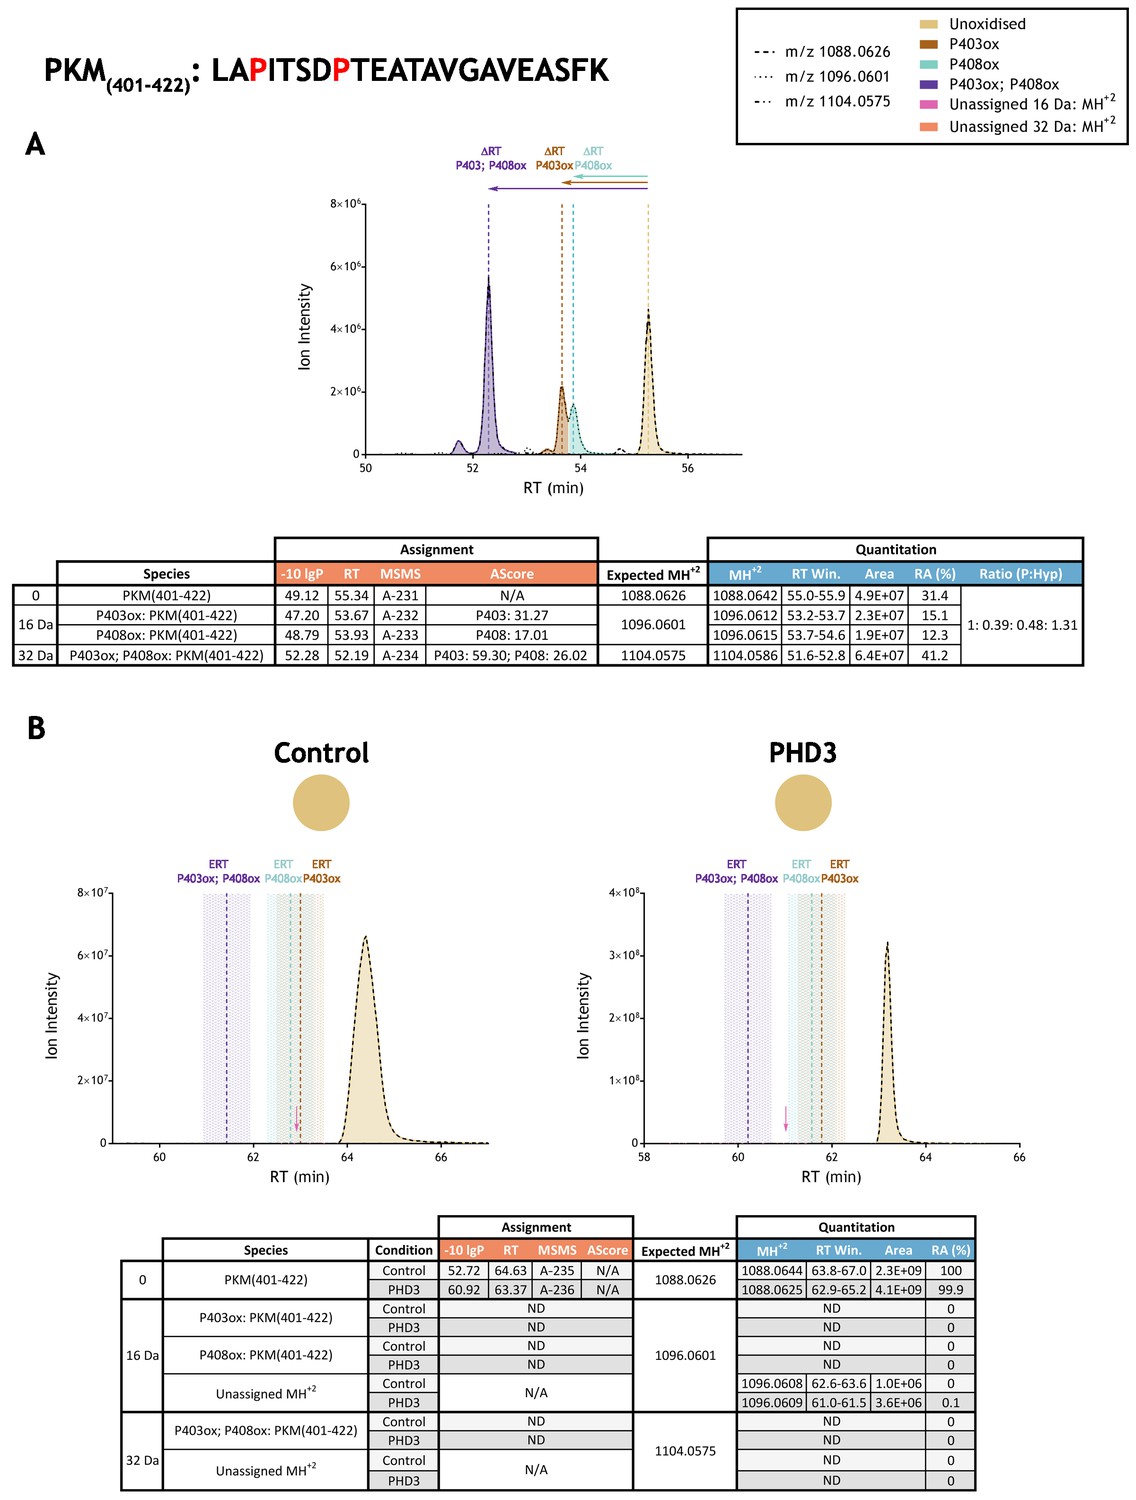
Quantitation of peptide oxidation on PKM(401-422) following reaction of full-length pyruvate kinase M2 with recombinant PHD3.
XIC data presented in (A) shows ion intensity and retention time (RT) characteristics of equimolar synthetic peptide standards for unoxidised and proline oxidised forms (P403ox, P408ox or combined) of the PKM(401-422) peptide. MSMS assigned species are coloured (see inset); vertical dashed lines define peak maxima used to derive ΔRT values for the different hydroxyproline-containing peptides. Note, the elution profiles of P403ox (brown) and P408ox (turquoise) ions overlap; area calculations were performed by vertical bisection of the valley between the co-eluting peaks to the baseline. Panel (B) shows comparable XIC data for protease-digested IVTT substrate under control (left) or PHD3-reacted (right) conditions. Peaks corresponding to unoxidised PKM(401-422) were detected in both control and enzyme reacted conditions; proline oxidation was not reported at any site. Estimated RT (ERT) values for proline oxidised peptides, derived from (A), are indicated by dashed vertical lines; shading corresponds to a 1 min RT window. Peptide ions of low abundance that were compatible with a single (+16 Da) oxidation event but not assigned by MSMS are indicated (pink arrow); unassigned ions with a compatible mass over charge for double oxidation (i.e.,+32 Da) were not observed across the elution window. Quantitative data for observed species are presented as pie charts with XIC data. Assignment and quantitation data are tabulated below each panel, table headers are as follows: (−10lgP) significance score of leading assignment at given (RT) with ambiguity score (AScore) for PTM localisation and reference to primary MSMS data in Supplementary file 1. Quantitative data reports ion counts (Area) of observed masses (MH+2) integrated over time (RT Win.), expressed as relative abundance (RA). Data on detection efficiency for synthetic peptides (Panel A, P: Hyp) is an aggregated ratio of prolyl (P) to hydroxyprolyl (Hyp) containing species.
Figure 3—figure supplement 22
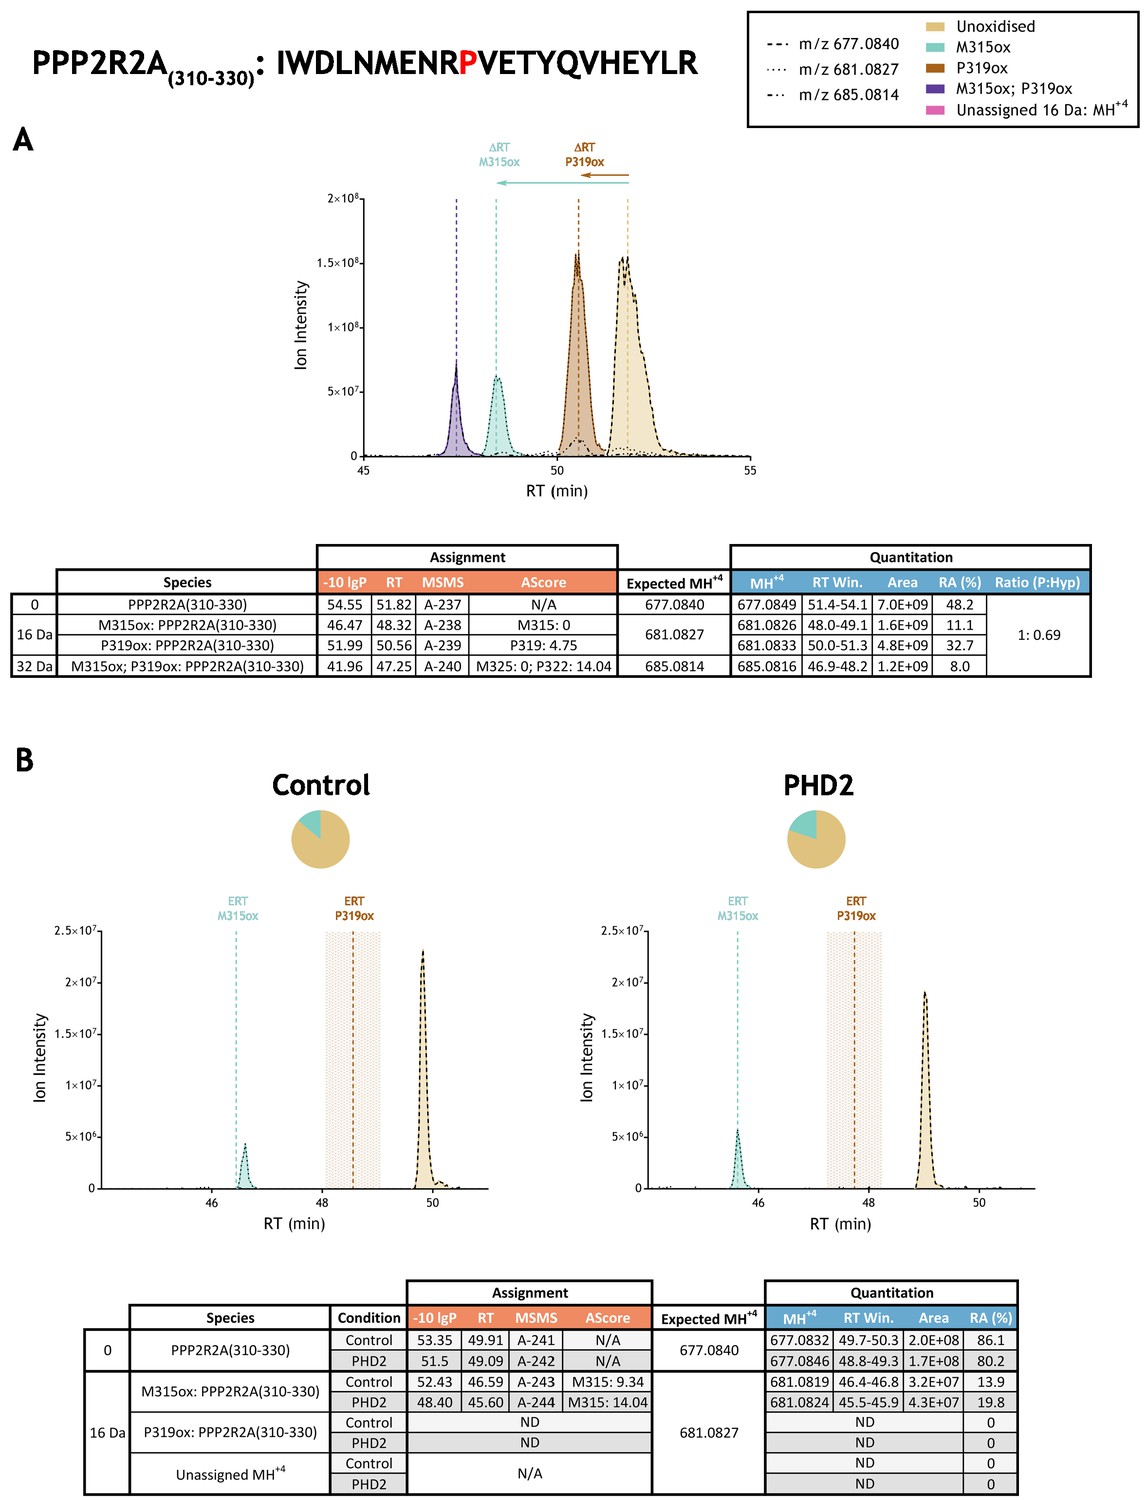
Quantitation of peptide oxidation on PPP2R2A(310-330) following reaction of full-length protein phosphatase 2 regulatory subunit B α with recombinant PHD2.
XIC data presented in (A) shows ion intensity and retention time (RT) characteristics of equimolar synthetic peptide standards for unoxidised and P319ox forms of the PPP2R2A(310-330) peptide. MSMS assigned species are coloured (see inset) and include non-enzymatic methionine oxidation (M315ox; turquoise); vertical dashed lines define peak maxima used to derive ΔRT values for M315ox and P319ox. Note, the peak corresponding to m/z 685.0814 at RT 50.5 min was assigned as W311diox by MSMS; this non-enzymatic oxidation is not annotated on the XIC. Panel (B) shows comparable XIC data for protease-digested IVTT substrate under control (left) or PHD2-reacted (right) conditions. Peaks corresponding to unoxidised and M315ox forms of PPP2R2A(310-330) were assigned by MSMS; P319ox was not detected. Estimated RT (ERT) values for oxidised peptides, derived from (A), are indicated by dashed vertical lines and show IVTT-derived M315ox eluting close to the ERT; shading applied to ERT P319ox corresponds to a 1 min RT window. Unassigned ions of compatible mass over charge for hydroxylation were not observed across the elution window. Quantitative data for observed species are presented as pie charts with XIC data. Assignment and quantitation data are tabulated below each panel, table headers are as follows: (−10lgP) significance score of leading assignment at given (RT) with ambiguity score (AScore) for PTM localisation and reference to primary MSMS data in Supplementary file 1. Quantitative data reports ion counts (Area) of observed masses (MH+4) integrated over time (RT Win.), expressed as relative abundance (RA). Data on detection efficiency for synthetic peptides (Panel A, P: Hyp) is an aggregated ratio of prolyl (P) to hydroxyprolyl (Hyp) containing species.
Figure 3—figure supplement 23
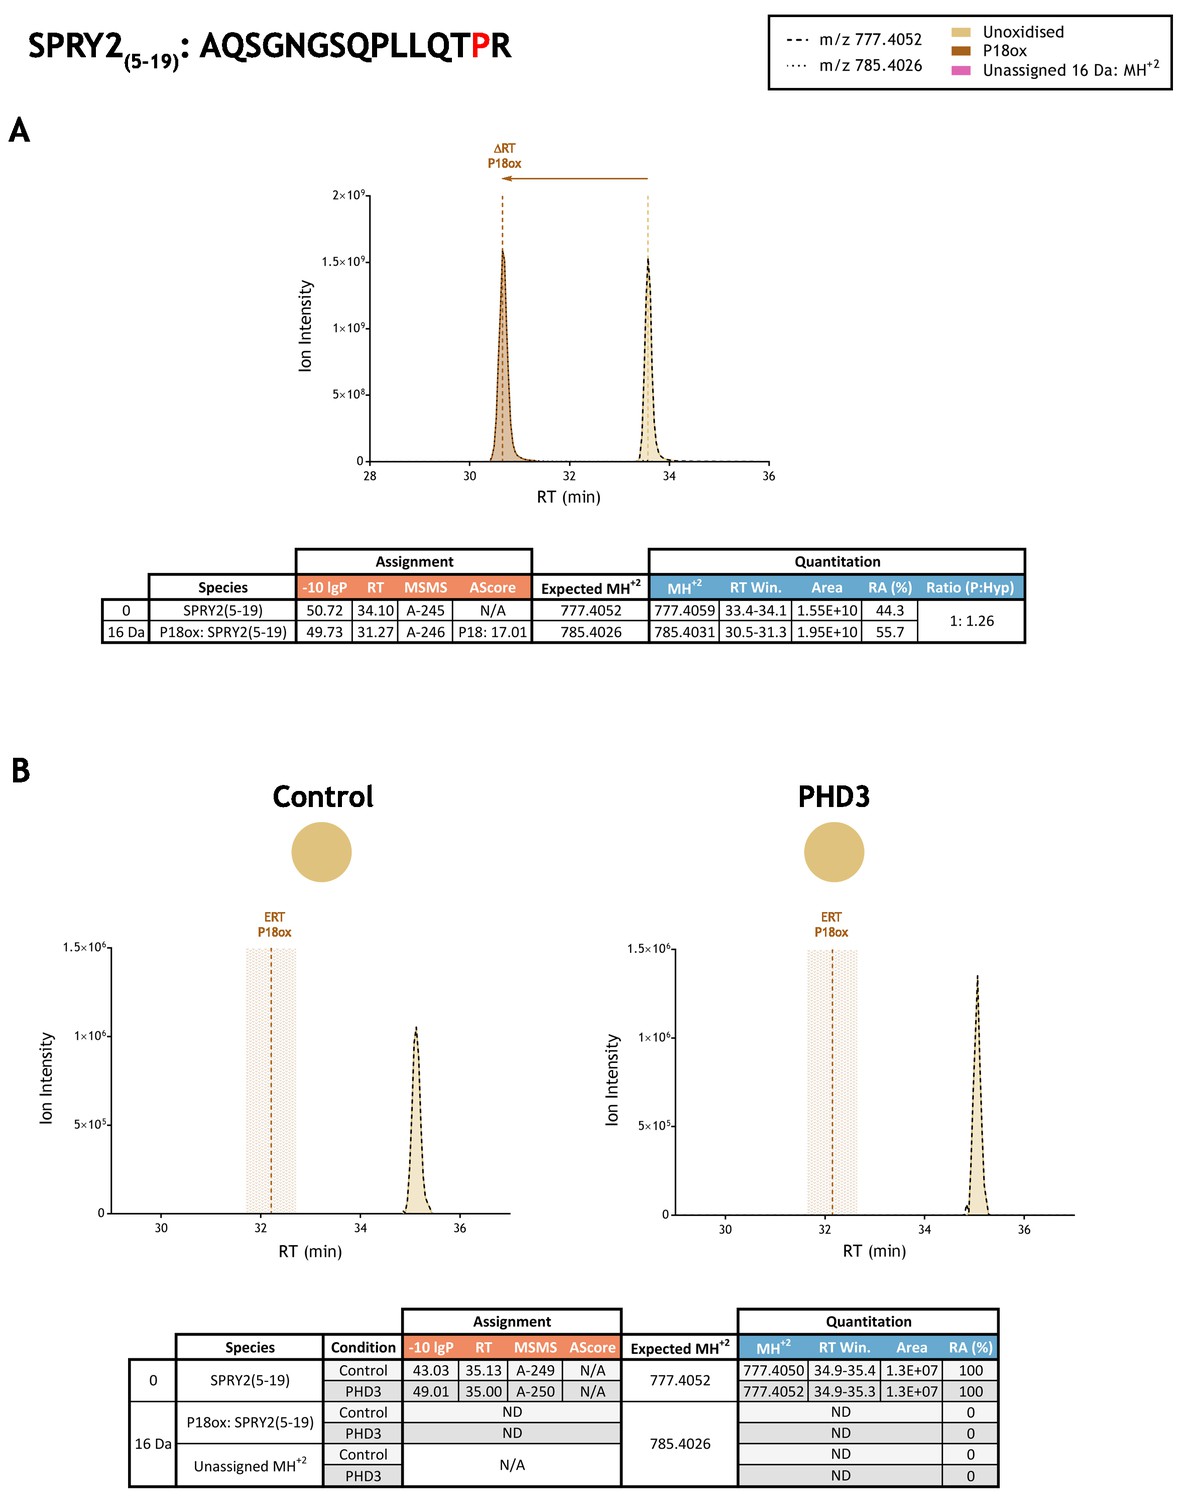
Quantitation of peptide oxidation on SPRY2(5–19) following reaction of full-length sprouty homolog 2 with recombinant PHD3.
XIC data presented in (A) shows ion intensity and retention time (RT) characteristics of equimolar synthetic peptide standards for unoxidised and P18ox forms of the SPRY2(5–19) peptide. MSMS assigned species are coloured (see inset); vertical dashed lines define peak maxima used to derive ΔRT values for P18ox. Panel (B) shows comparable XIC data for protease-digested IVTT substrate under control (left) or PHD3-reacted (right) conditions. Peaks corresponding to unoxidised SPRY2(5–19) were assigned by MSMS (see inset for colour code); P18ox was not detected. The estimated RT (ERT) for P18ox, derived from (A), is indicated by dashed vertical line, shading corresponds to a 1 min RT window. Unassigned ions of compatible mass over charge for hydroxylation were not observed across the elution window. Quantitative data for observed species are presented as pie charts with XIC data. Assignment and quantitation data are tabulated below each panel, table headers are as follows: (−10lgP) significance score of leading assignment at given (RT) with ambiguity score (AScore) for PTM localisation and reference to primary MSMS data in Supplementary file 1. Quantitative data reports ion counts (Area) of observed masses (MH+2) integrated over time (RT Win.), expressed as relative abundance (RA). Data on detection efficiency for synthetic peptides (Panel A, P: Hyp) is an aggregated ratio of prolyl (P) to hydroxyprolyl (Hyp) containing species.
Figure 3—figure supplement 24
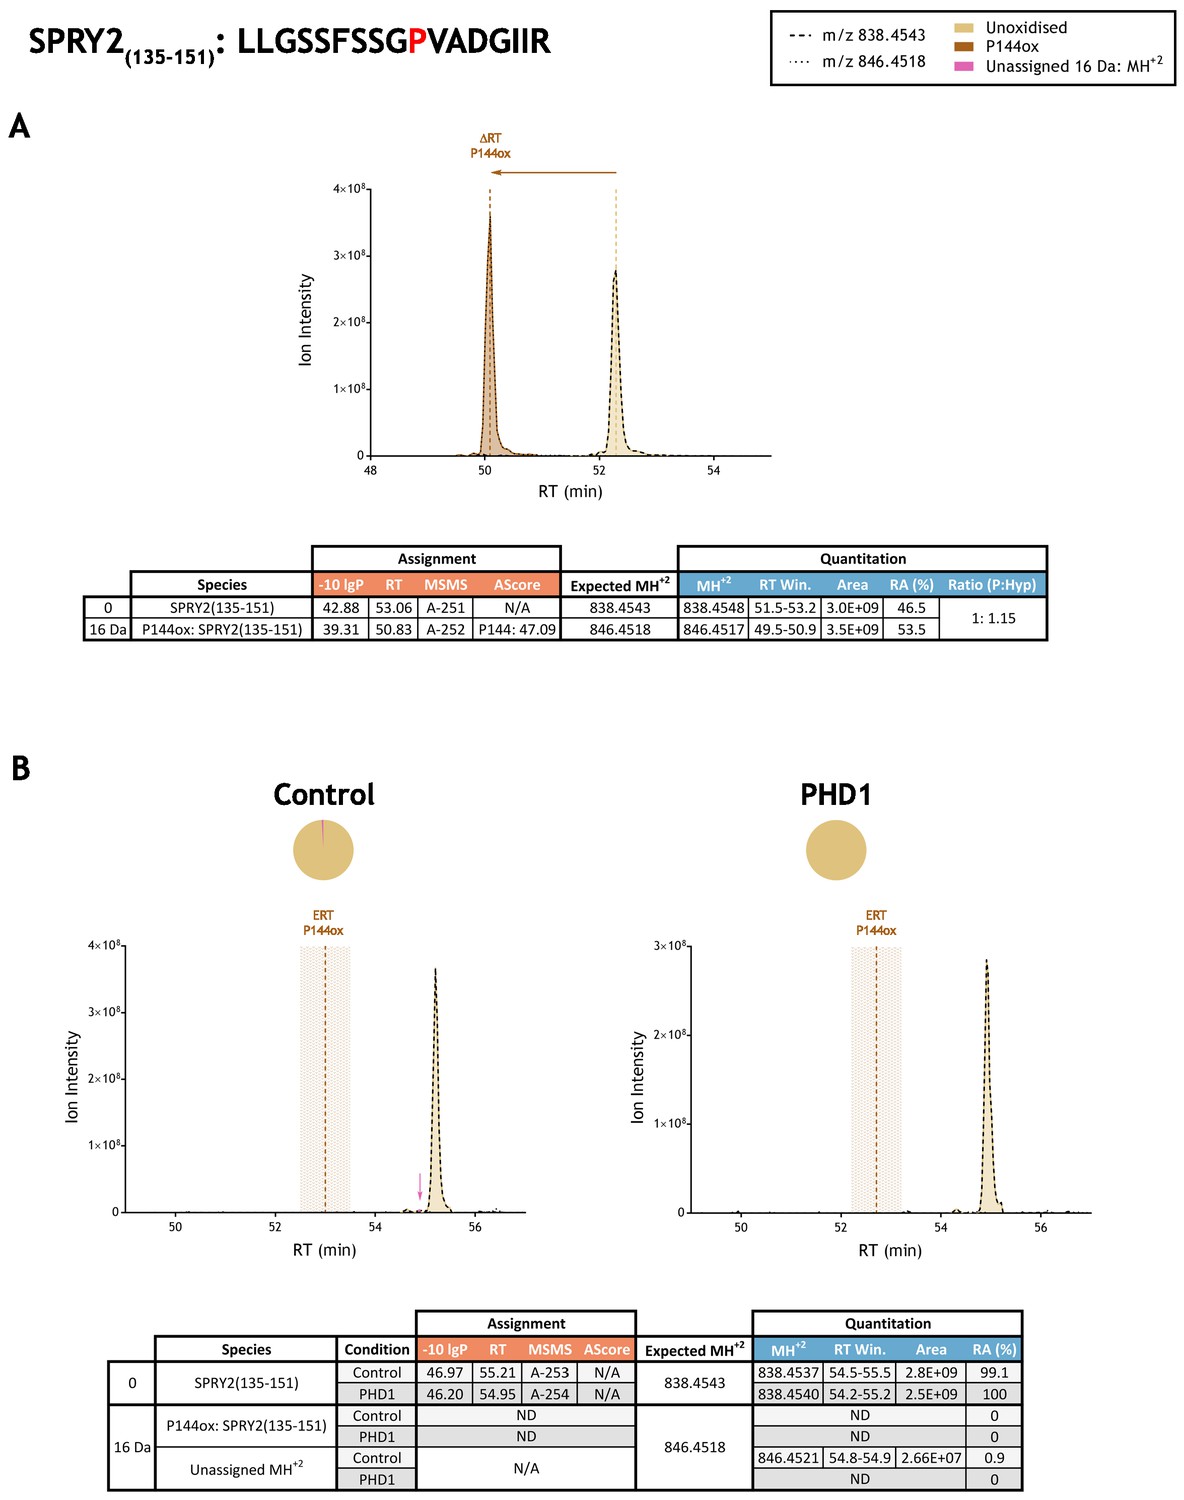
Quantitation of peptide oxidation on SPRY2(135–151) following reaction of full-length sprouty homolog 2 with recombinant PHD1.
XIC data presented in (A) shows ion intensity and retention time (RT) characteristics of equimolar synthetic peptide standards for unoxidised and P144ox forms of the SPRY2(135–151) peptide. MSMS assigned species are coloured (see inset); vertical dashed lines define peak maxima used to derive ΔRT values for P144ox. Panel (B) shows comparable XIC data for protease-digested IVTT substrate under control (left) or PHD1-reacted (right) conditions. Peaks corresponding to unoxidised SPRY2(135–151) were assigned by MSMS (see inset for colour code); P144ox was not detected. The estimated RT (ERT) for P144ox, derived from (A), is indicated by dashed vertical line, shading corresponds to a 1 min RT window. Peptide ions of low abundance that were compatible with hydroxylation but not assigned by MSMS are indicated (pink arrow). Quantitative data for observed species are presented as pie charts with XIC data. Assignment and quantitation data are tabulated below each panel, table headers are as follows: (−10lgP) significance score of leading assignment at given (RT) with ambiguity score (AScore) for PTM localisation and reference to primary MSMS data in Supplementary file 1. Quantitative data reports ion counts (Area) of observed masses (MH+2) integrated over time (RT Win.), expressed as relative abundance (RA). Data on detection efficiency for synthetic peptides (Panel A, P: Hyp) is an aggregated ratio of prolyl (P) to hydroxyprolyl (Hyp) containing species.
Figure 3—figure supplement 25
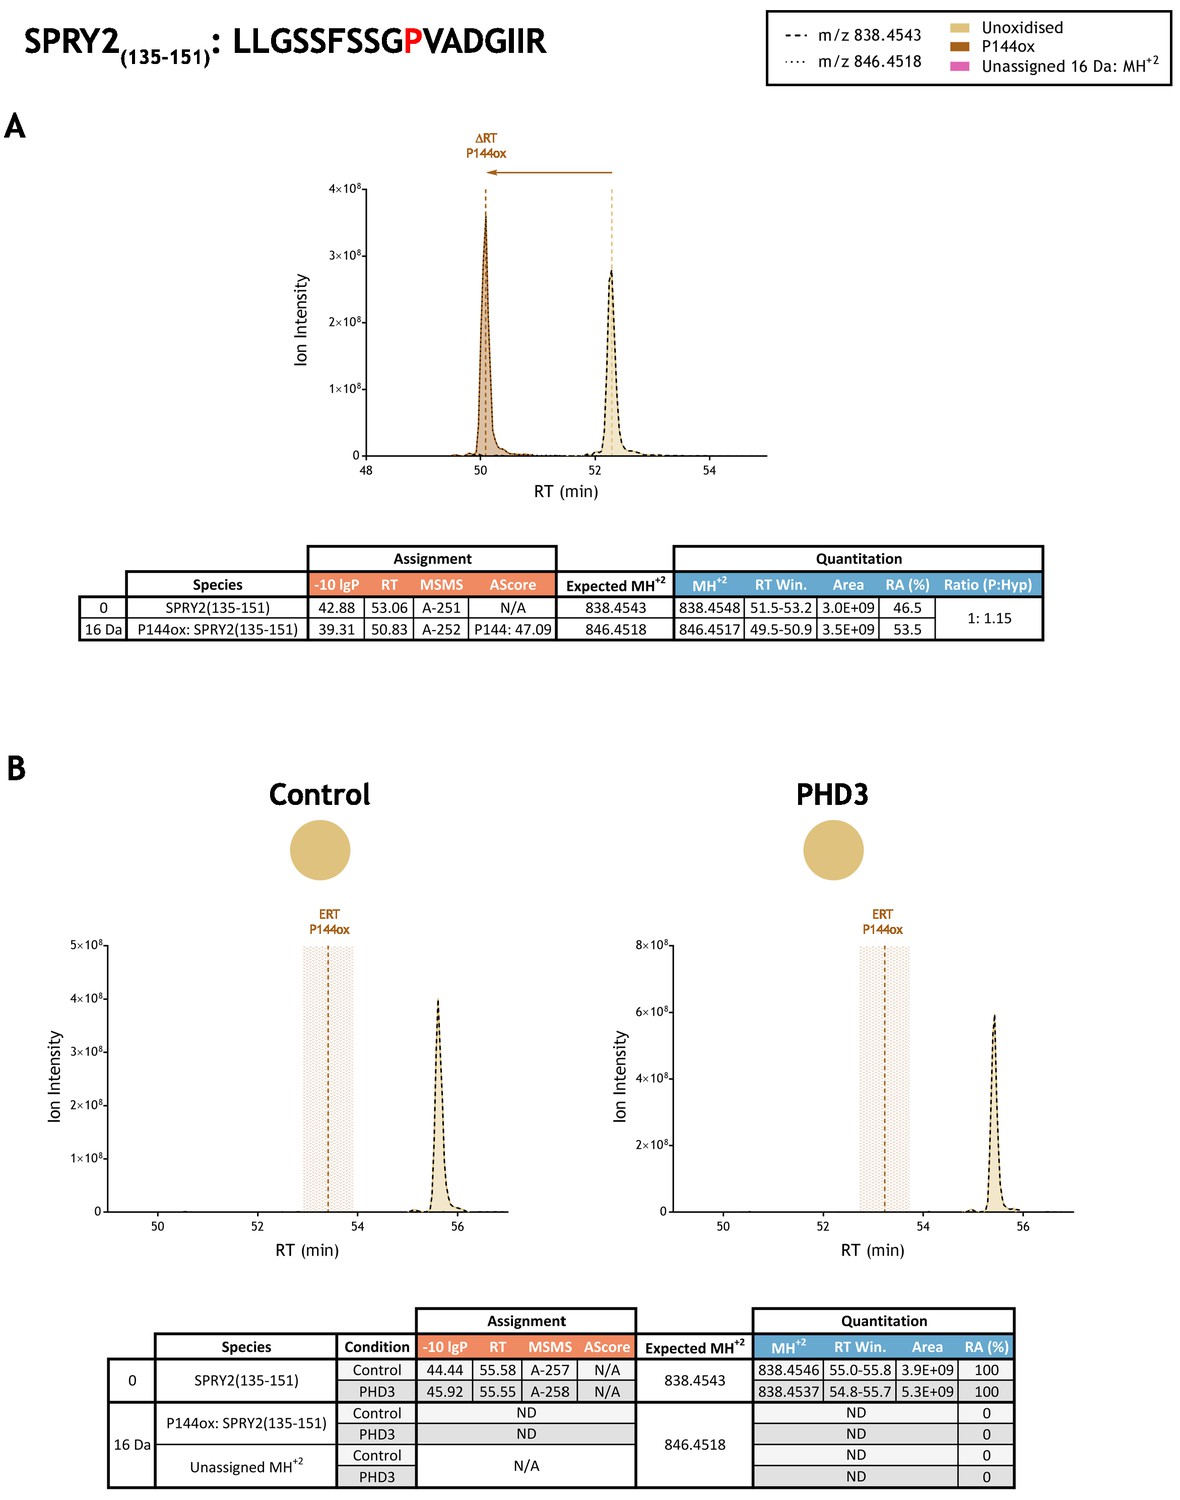
Quantitation of peptide oxidation on SPRY2(135–151) following reaction of full-length sprouty homolog 2 with recombinant PHD3.
XIC data presented in (A) shows ion intensity and retention time (RT) characteristics of equimolar synthetic peptide standards for unoxidised and P144ox forms of the SPRY2(135–151) peptide. MSMS assigned species are coloured (see inset); vertical dashed lines define peak maxima used to derive ΔRT values for P144ox. Panel (B) shows comparable XIC data for protease-digested IVTT substrate under control (left) or PHD3-reacted (right) conditions. Peaks corresponding to unoxidised SPRY2(135–151) were assigned by MSMS (see inset for colour code); P144ox was not detected. The estimated RT (ERT) for P144ox, derived from (A), is indicated by dashed vertical line, shading corresponds to a 1 min RT window. Unassigned ions of compatible mass over charge for hydroxylation were not observed across the elution window. Quantitative data for observed species are presented as pie charts with XIC data. Assignment and quantitation data are tabulated below each panel, table headers are as follows: (−10lgP) significance score of leading assignment at given (RT) with ambiguity score (AScore) for PTM localisation and reference to primary MSMS data in Supplementary file 1. Quantitative data reports ion counts (Area) of observed masses (MH+2) integrated over time (RT Win.), expressed as relative abundance (RA). Data on detection efficiency for synthetic peptides (Panel A, P: Hyp) is an aggregated ratio of prolyl (P) to hydroxyprolyl (Hyp) containing species.
Figure 3—figure supplement 26
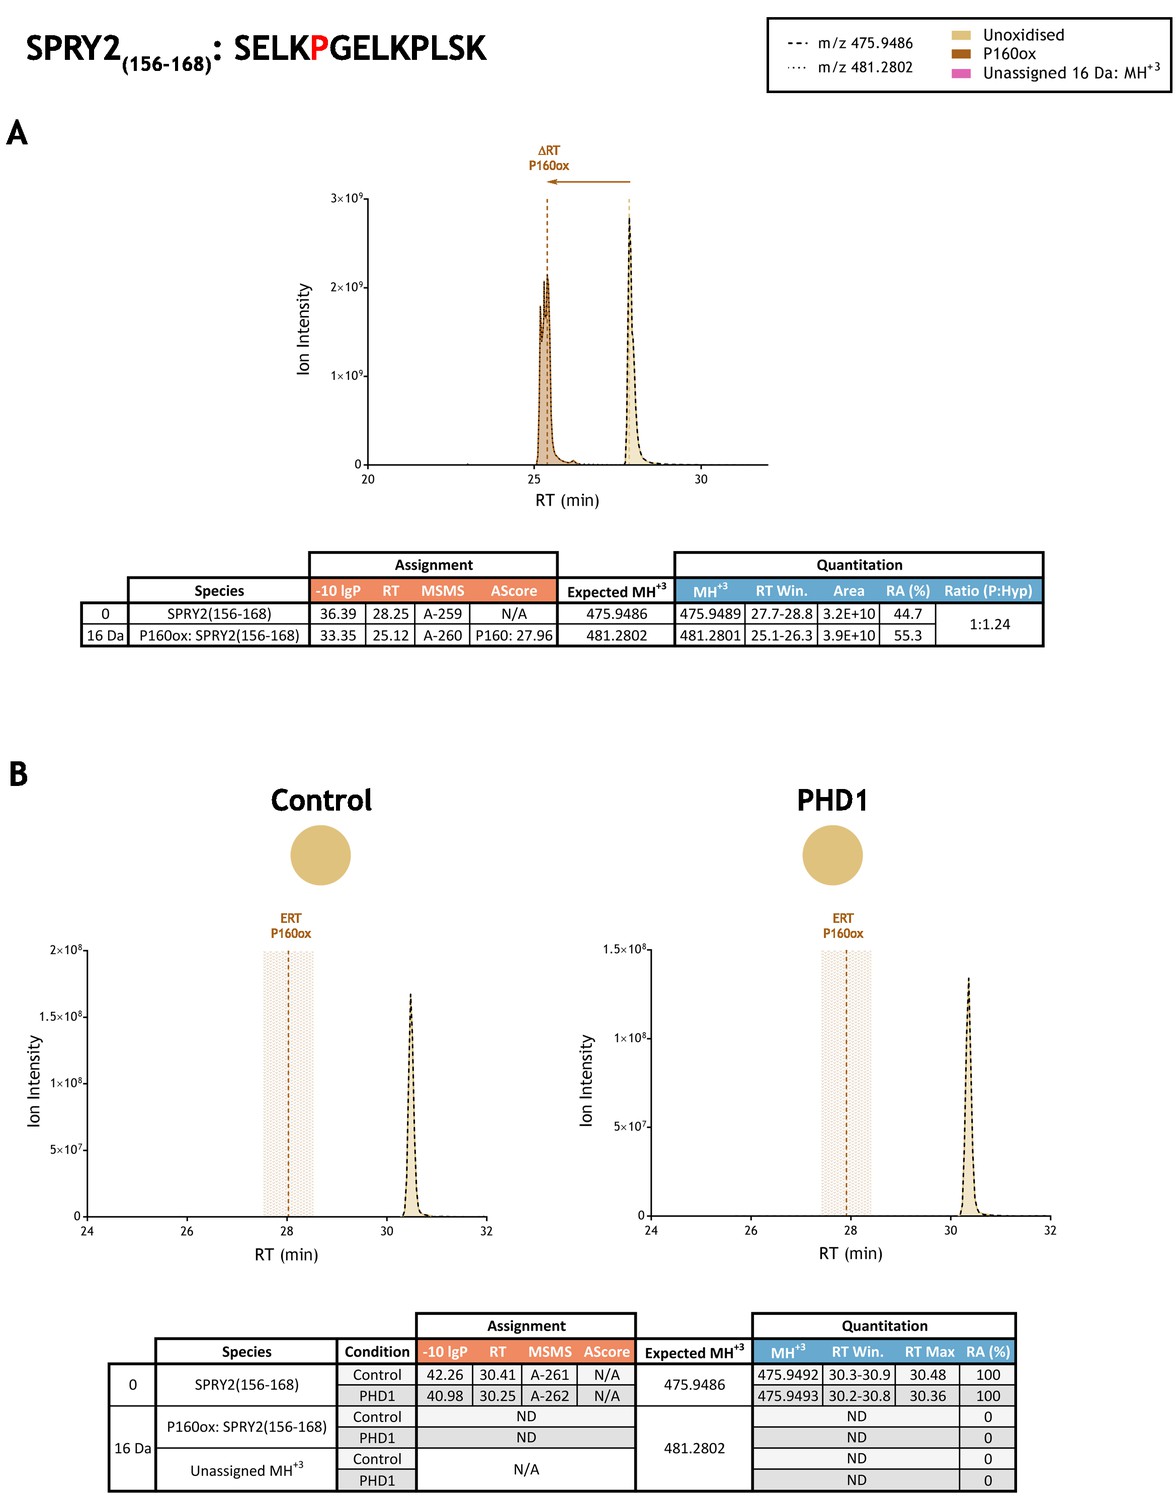
Quantitation of peptide oxidation on SPRY2(156–168) following reaction of full-length sprouty homolog 2 with recombinant PHD1.
XIC data presented in (A) shows ion intensity and retention time (RT) characteristics of equimolar synthetic peptide standards for unoxidised and P160ox forms of the SPRY2(156–168) peptide. MSMS assigned species are coloured (see inset); vertical dashed lines define peak maxima used to derive ΔRT values for P160ox. Panel (B) shows comparable XIC data for protease-digested IVTT substrate under control (left) or PHD1-reacted (right) conditions. Peaks corresponding to unoxidised SPRY2(156–168) were assigned by MSMS (see inset for colour code); P160ox was not detected. The estimated RT (ERT) for P160ox, derived from (A), is indicated by dashed vertical line, shading corresponds to a 1 min RT window. Unassigned ions of compatible mass over charge for hydroxylation were not observed across the elution window. Quantitative data for observed species are presented as pie charts with XIC data. Assignment and quantitation data are tabulated below each panel, table headers are as follows: (−10lgP) significance score of leading assignment at given (RT) with ambiguity score (AScore) for PTM localisation and reference to primary MSMS data in Supplementary file 1. Quantitative data reports ion counts (Area) of observed masses (MH+3) integrated over time (RT Win.), expressed as relative abundance (RA). Data on detection efficiency for synthetic peptides (Panel A, P: Hyp) is an aggregated ratio of prolyl (P) to hydroxyprolyl (Hyp) containing species.
Figure 3—figure supplement 27
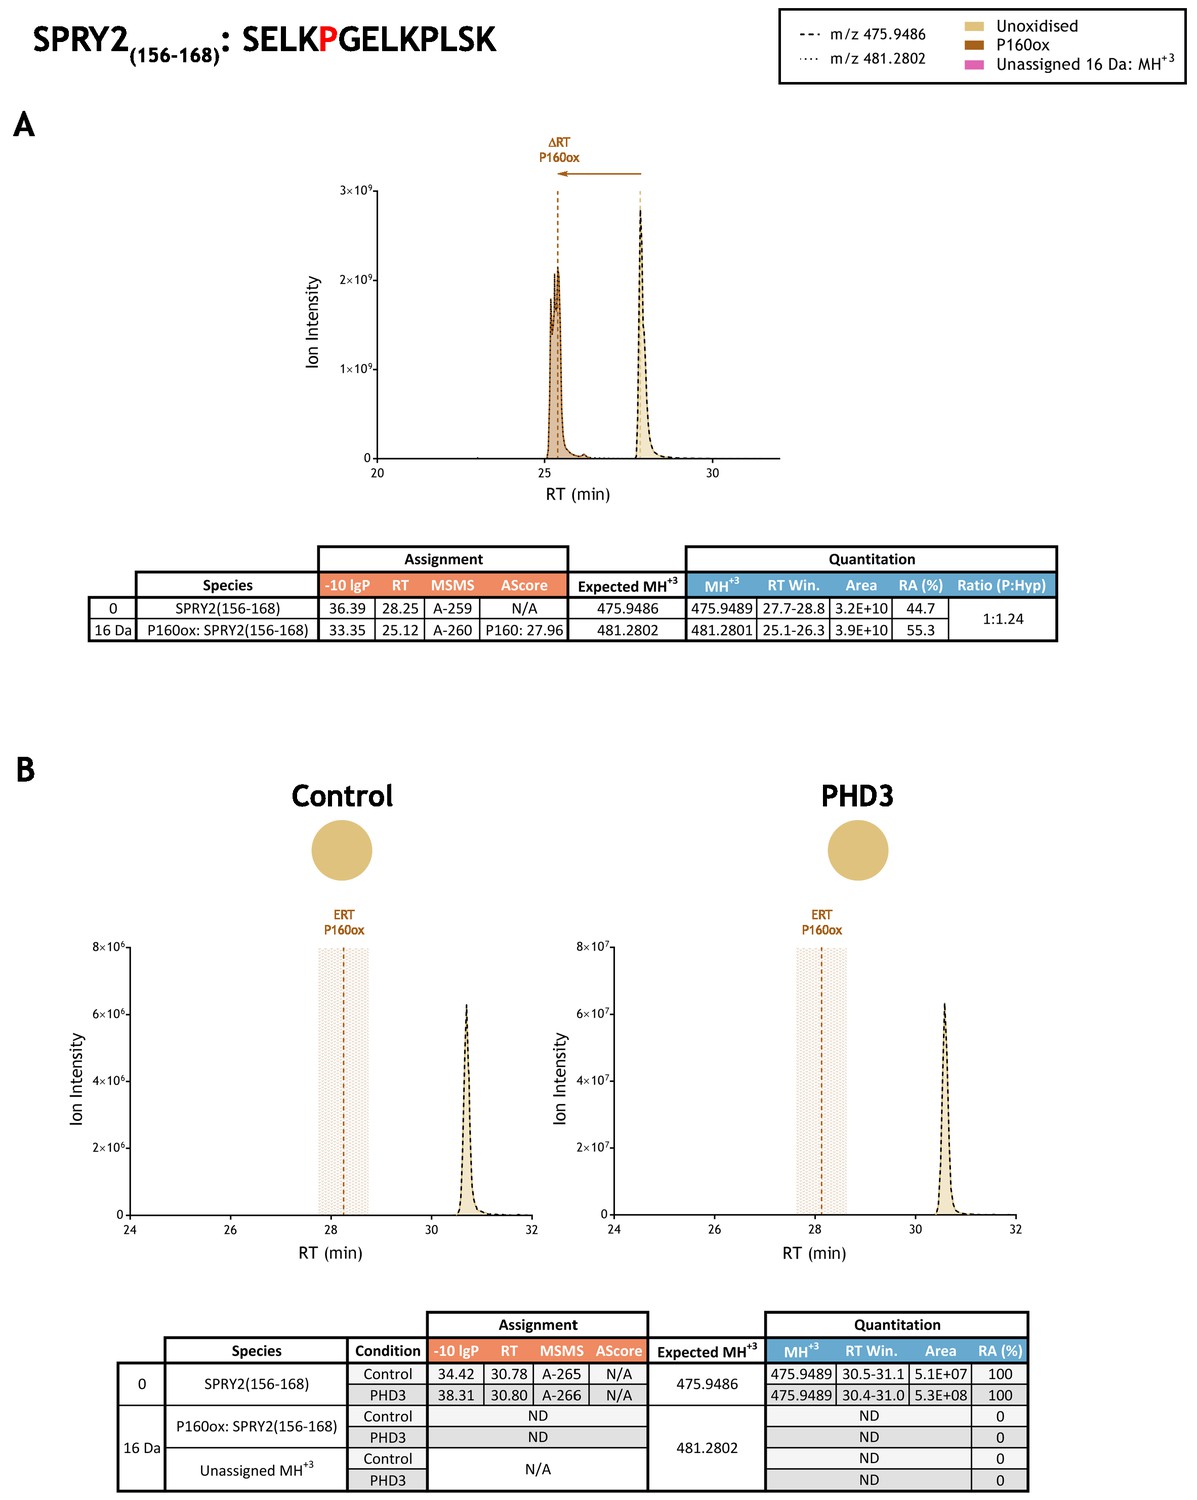
Quantitation of peptide oxidation on SPRY2(156–168) following reaction of full-length sprouty homolog 2 with recombinant PHD3.
XIC data presented in (A) shows ion intensity and retention time (RT) characteristics of equimolar synthetic peptide standards for unoxidised and P160ox forms of the SPRY2(156–168) peptide. MSMS assigned species are coloured (see inset); vertical dashed lines define peak maxima used to derive ΔRT values for P160ox. Panel (B) shows comparable XIC data for protease-digested IVTT substrate under control (left) or PHD3-reacted (right) conditions. Peaks corresponding to unoxidised SPRY2(156–168) were assigned by MSMS (see inset for colour code); P160ox was not detected. The estimated RT (ERT) for P160ox, derived from (A), is indicated by dashed vertical line, shading corresponds to a 1 min RT window. Unassigned ions of compatible mass over charge for hydroxylation were not observed across the elution window. Quantitative data for observed species are presented as pie charts with XIC data. Assignment and quantitation data are tabulated below each panel, table headers are as follows: (−10lgP) significance score of leading assignment at given (RT) with ambiguity score (AScore) for PTM localisation and reference to primary MSMS data in Supplementary file 1. Quantitative data reports ion counts (Area) of observed masses (MH+3) integrated over time (RT Win.), expressed as relative abundance (RA). Data on detection efficiency for synthetic peptides (Panel A, P: Hyp) is an aggregated ratio of prolyl (P) to hydroxyprolyl (Hyp) containing species.
Figure 3—figure supplement 28

Quantitation of peptide oxidation on TELO2(363–377) following reaction of full-length telomere maintenance 2 with recombinant PHD3.
XIC data presented in (A) shows ion intensity and retention time (RT) characteristics of equimolar synthetic peptide standards for unoxidised and P374ox forms of the TELO2(363–377) peptide. MSMS assigned species are coloured (see inset); vertical dashed lines define peak maxima used to derive ΔRT values for P374ox. Panel (B) shows comparable XIC data for protease-digested IVTT substrate under control (left) or PHD3-reacted (right) conditions. Peaks corresponding to unoxidised TELO2(363–377) were assigned by MSMS (see inset for colour code); P374ox was not detected. The estimated RT (ERT) for P374ox, derived from (A), is indicated by dashed vertical line, shading corresponds to a 1 min RT window. Unassigned ions of compatible mass over charge for hydroxylation were observed across the elution window but their relative abundance was unchanged following reaction with PHD3 (pink arrow). Quantitative data for observed species are presented as pie charts with XIC data. Assignment and quantitation data are tabulated below each panel, table headers are as follows: (−10lgP) significance score of leading assignment at given (RT) with ambiguity score (AScore) for PTM localisation and reference to primary MSMS data in Supplementary file 1. Quantitative data reports ion counts (Area) of observed masses (MH+2) integrated over time (RT Win.), expressed as relative abundance (RA). Data on detection efficiency for synthetic peptides (Panel A, P: Hyp) is an aggregated ratio of prolyl (P) to hydroxyprolyl (Hyp) containing species.
Figure 3—figure supplement 29
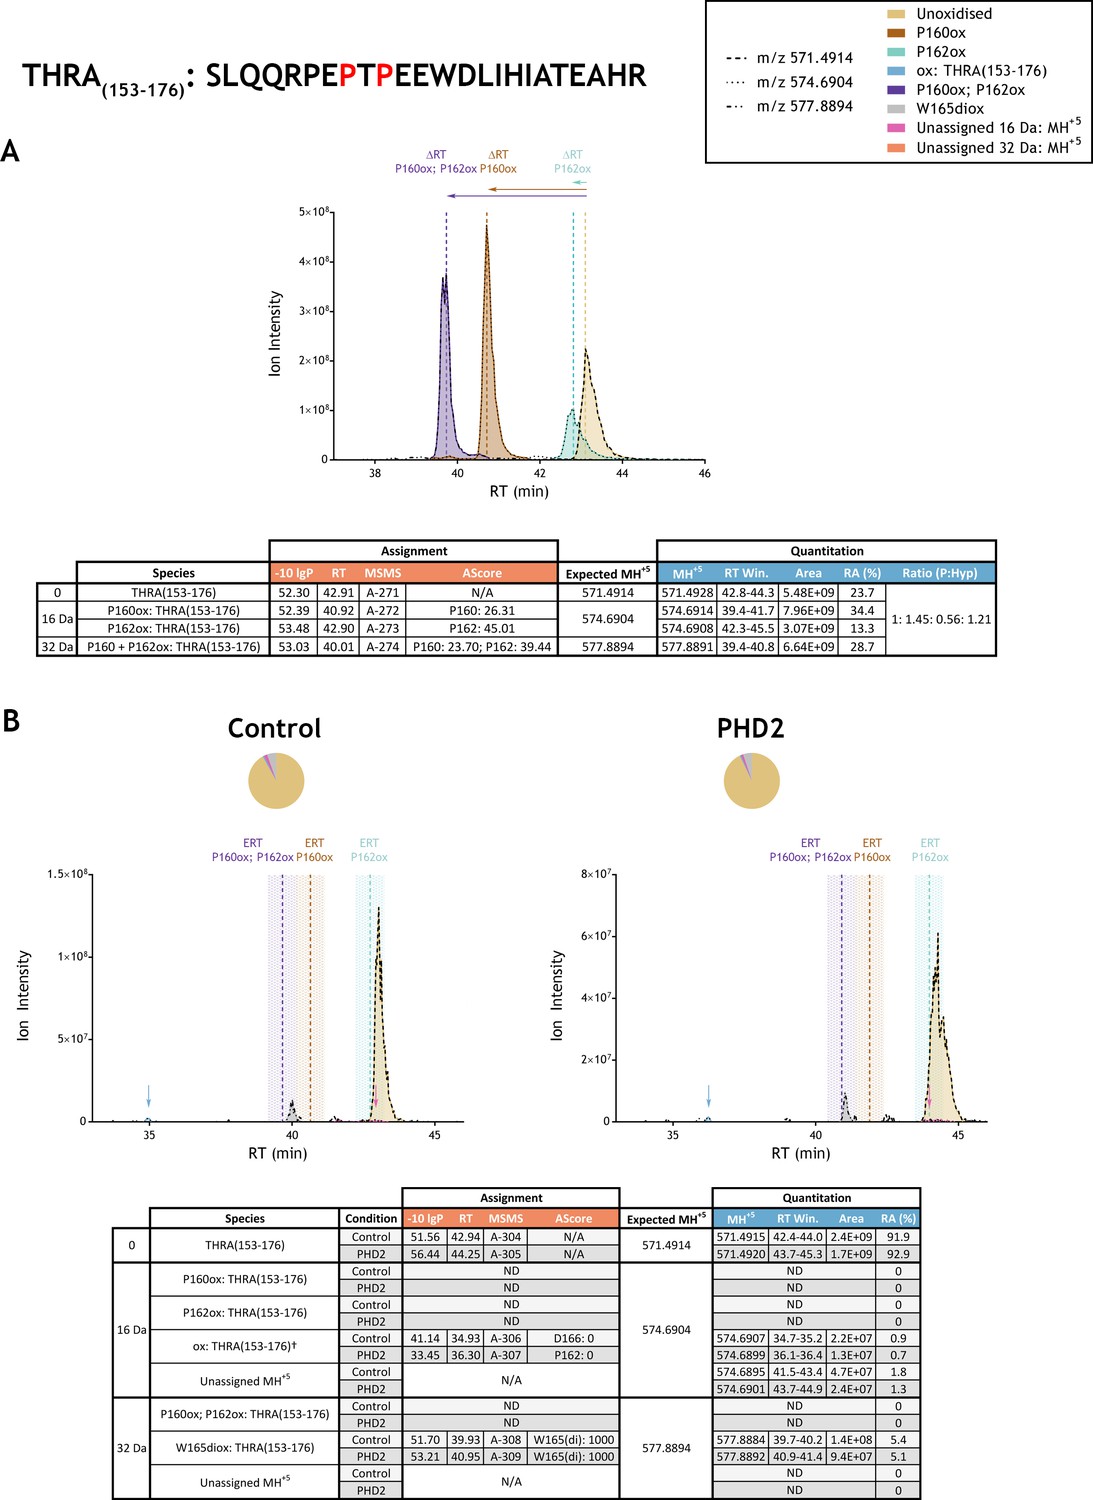
Quantitation of peptide oxidation on THRA(153-176) following reaction of full-length thyroid hormone receptor alpha with recombinant PHD2.
XIC data presented in (A) shows ion intensity and retention time (RT) characteristics of equimolar synthetic peptide standards for unoxidised and proline oxidised forms (P160ox, P162ox or combined) of the THRA(153-176) peptide. MSMS assigned species are coloured (see inset); vertical dashed lines define peak maxima used to derive ΔRT values for the different hydroxyproline-containing peptides. Panel (B) shows comparable XIC data for protease-digested IVTT substrate under control (left) or PHD2-reacted (right) conditions. Peaks corresponding to unoxidised (light brown) and low stoichiometry singly-oxidised (blue arrow) and doubly-oxidised (grey) forms of THRA(153-176) were detected in control and PHD2-reacted IVTT preparations. The site of oxidation was ambiguous in the context of the singly-oxidised peptide (nominally localised to P162 or D166: AScore 0; see Supplementary file 1 A-306 and A-307 respectively for MSMS) and assigned as tryptophan di-oxidation (W439: AScore 1000; see Supplementary file 1 A-308 and A-309 for MSMS) on the doubly-oxidised peptide. The elution profile of the low abundance singly oxidised ions was chromatographically distinct (>5 min) from the expected retention time (ERT) of hydroxyproline-containing peptides (indicated by dashed vertical lines; shading corresponds to a 1 min RT window) and did not change in abundance relative to the unoxidised peptide following reaction with PHD2. Peptide ions of low abundance that were compatible with a single (+16 Da) oxidation event but not assigned by MSMS are indicated (pink arrow); unassigned ions with a compatible mass over charge for double oxidation (i.e.,+32 Da) were not observed across the elution window. Quantitative data for observed species are presented as pie charts with XIC data. Assignment and quantitation data are tabulated below each panel, table headers are as follows: (−10lgP) significance score of leading assignment at given (RT) with ambiguity score (AScore) for PTM localisation and reference to primary MSMS data in Supplementary file 1. Species column: Fragment ions (including neutral loss ions) localise mono-oxidation† to residues 165–166 (see Supplementary file 1, A-306). Quantitative data reports ion counts (Area) of observed masses (MH+5) integrated over time (RT Win.), expressed as relative abundance (RA). Data on detection efficiency for synthetic peptides (Panel A, P: Hyp) is an aggregated ratio of prolyl (P) to hydroxyprolyl (Hyp) containing species.
Figure 3—figure supplement 30
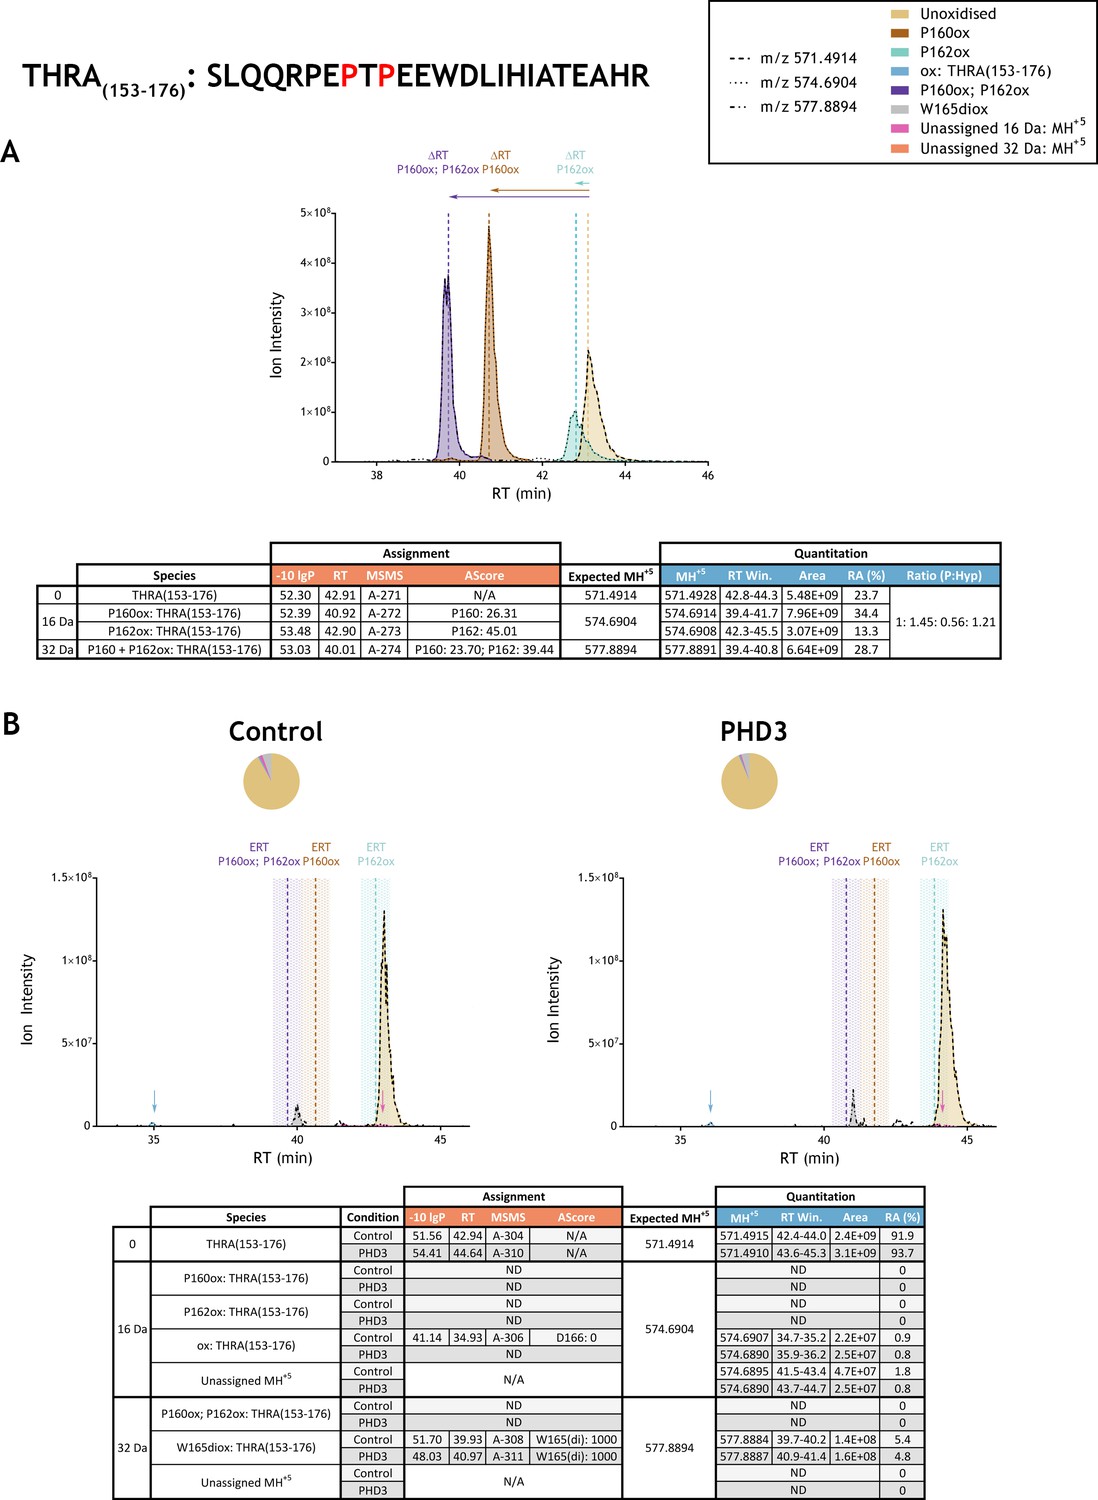
Quantitation of peptide oxidation on THRA(153-176) following reaction of full-length thyroid hormone receptor alpha with recombinant PHD3.
XIC data presented in (A) shows ion intensity and retention time (RT) characteristics of equimolar synthetic peptide standards for unoxidised and proline oxidised forms (P160ox, P162ox or combined) of the THRA(153-176) peptide. MSMS assigned species are coloured (see inset); vertical dashed lines define peak maxima used to derive ΔRT values for the different hydroxyproline-containing peptides. Panel (B) shows comparable XIC data for protease-digested IVTT substrate under control (left) or PHD3-reacted (right) conditions. Peaks corresponding to unoxidised (light brown) and low stoichiometry singly-oxidised (blue arrow) and doubly-oxidised (grey) forms of THRA(153-176) were detected in control and PHD3-reacted IVTT preparations. The site of oxidation was ambiguous in the context of the singly-oxidised peptide (nominally localised to D166: AScore 0; see Supplementary file 1 A-306) and assigned as tryptophan di-oxidation (W165: AScore 1000; see Supplementary file 1 A-308 and A-311 for MSMS) on the doubly-oxidised peptide. The elution profile of the low abundance singly oxidised ions was chromatographically distinct (>5 min) from the expected retention time (ERT) of hydroxyproline-containing peptides (indicated by dashed vertical lines; shading corresponds to a 1 min RT window) and did not change in abundance relative to the unoxidised peptide following reaction with PHD3. Peptide ions of low abundance that were compatible with a single (+16 Da) oxidation event but not assigned by MSMS are indicated (pink arrow); unassigned ions with a compatible mass over charge for double oxidation (i.e.,+32 Da) were not observed across the elution window. Quantitative data for observed species are presented as pie charts with XIC data. Assignment and quantitation data are tabulated below each panel, table headers are as follows: (−10lgP) significance score of leading assignment at given (RT) with ambiguity score (AScore) for PTM localisation and reference to primary MSMS data in Supplementary file 1. Species column: Fragment ions (including neutral loss ions) localise mono-oxidation† to residues 165–166 (see Supplementary file 1, A-306). Quantitative data reports ion counts (Area) of observed masses (MH+5) integrated over time (RT Win.), expressed as relative abundance (RA). Data on detection efficiency for synthetic peptides (Panel A, P: Hyp) is an aggregated ratio of prolyl (P) to hydroxyprolyl (Hyp) containing species.
Figure 3—figure supplement 31
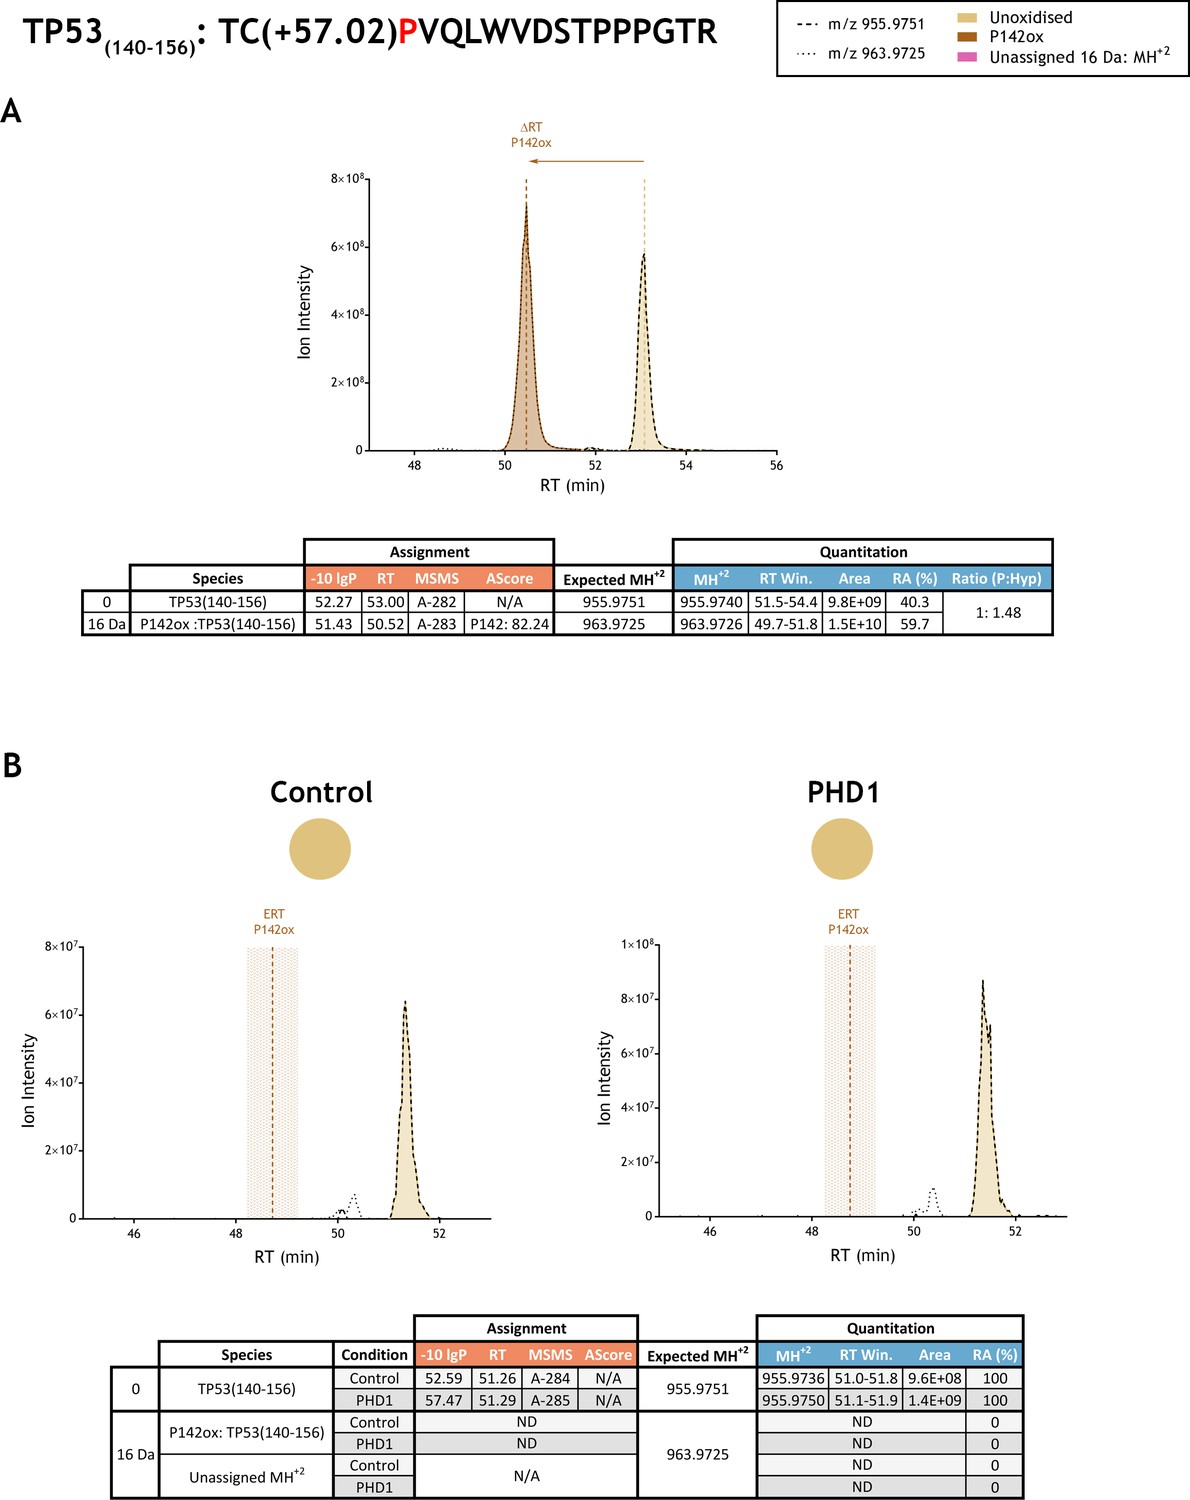
Quantitation of peptide oxidation on TP53(140-156) following reaction of full-length tumour protein p53 with recombinant PHD1.
XIC data presented in (A) shows ion intensity and retention time (RT) characteristics of equimolar synthetic peptide standards for unoxidised and P142ox forms of the TP53(140-156) peptide. MSMS assigned species are coloured (see inset); vertical dashed lines define peak maxima used to derive ΔRT values for P142ox. Panel (B) shows comparable XIC data for protease-digested IVTT substrate under control (left) or PHD1-reacted (right) conditions. Peaks corresponding to unoxidised TP53(140-156) were assigned by MSMS (see inset for colour code); P142ox was not detected. The estimated RT (ERT) for P142ox, derived from (A), is indicated by dashed vertical line, shading corresponds to a 1 min RT window. Note, unshaded peaks (at RT: 50.5 min) corresponding to m/z 963.9725 are unrelated ions based on isotopic profiles (different monoisotopic mass and/or charge) observed in LC-MS data. Unassigned ions of compatible mass over charge for hydroxylation were not observed across the elution window. Quantitative data for observed species are presented as pie charts with XIC data. Assignment and quantitation data are tabulated below each panel, table headers are as follows: (−10lgP) significance score of leading assignment at given (RT) with ambiguity score (AScore) for PTM localisation and reference to primary MSMS data in Supplementary file 1. Quantitative data reports ion counts (Area) of observed masses (MH+2) integrated over time (RT Win.), expressed as relative abundance (RA). Data on detection efficiency for synthetic peptides (Panel A, P: Hyp) is an aggregated ratio of prolyl (P) to hydroxyprolyl (Hyp) containing species.
Figure 3—figure supplement 32

Quantitation of peptide oxidation on TP53(358-370) following reaction of full-length tumour protein p53 with recombinant PHD3.
XIC data presented in (A) shows ion intensity and retention time (RT) characteristics of equimolar synthetic peptide standards for unoxidised and P359ox forms of the TP53(358-370) peptide. MSMS assigned species are coloured (see inset); vertical dashed lines define peak maxima used to derive ΔRT values for P359ox. Note, comparative ion counts were 2.5-fold lower for P359ox (brown) relative to the unoxidised peptide (light brown). Panel (B) shows comparable XIC data for protease-digested IVTT substrate under control (left) or PHD3-reacted (right) conditions. Peaks corresponding to unoxidised TP53(358-370) were assigned by MSMS (see inset for colour code); P359ox was not detected. The estimated RT (ERT) for P359ox, derived from (A), is indicated by dashed vertical line, shading corresponds to a 1 min RT window. Peptide ions of low abundance that were compatible with oxidation but not assigned by MSMS are also indicated (pink arrow). Quantitative data for observed species are presented as pie charts with XIC data. Assignment and quantitation data are tabulated below each panel, table headers are as follows: (−10lgP) significance score of leading assignment at given (RT) with ambiguity score (AScore) for PTM localisation and reference to primary MSMS data in Supplementary file 1. Quantitative data reports ion counts (Area) of observed masses (MH+3) integrated over time (RT Win.), expressed as relative abundance (RA). Data on detection efficiency for synthetic peptides (Panel A, P: Hyp) is an aggregated ratio of prolyl (P) to hydroxyprolyl (Hyp) containing species.
Figure 3—figure supplement 33
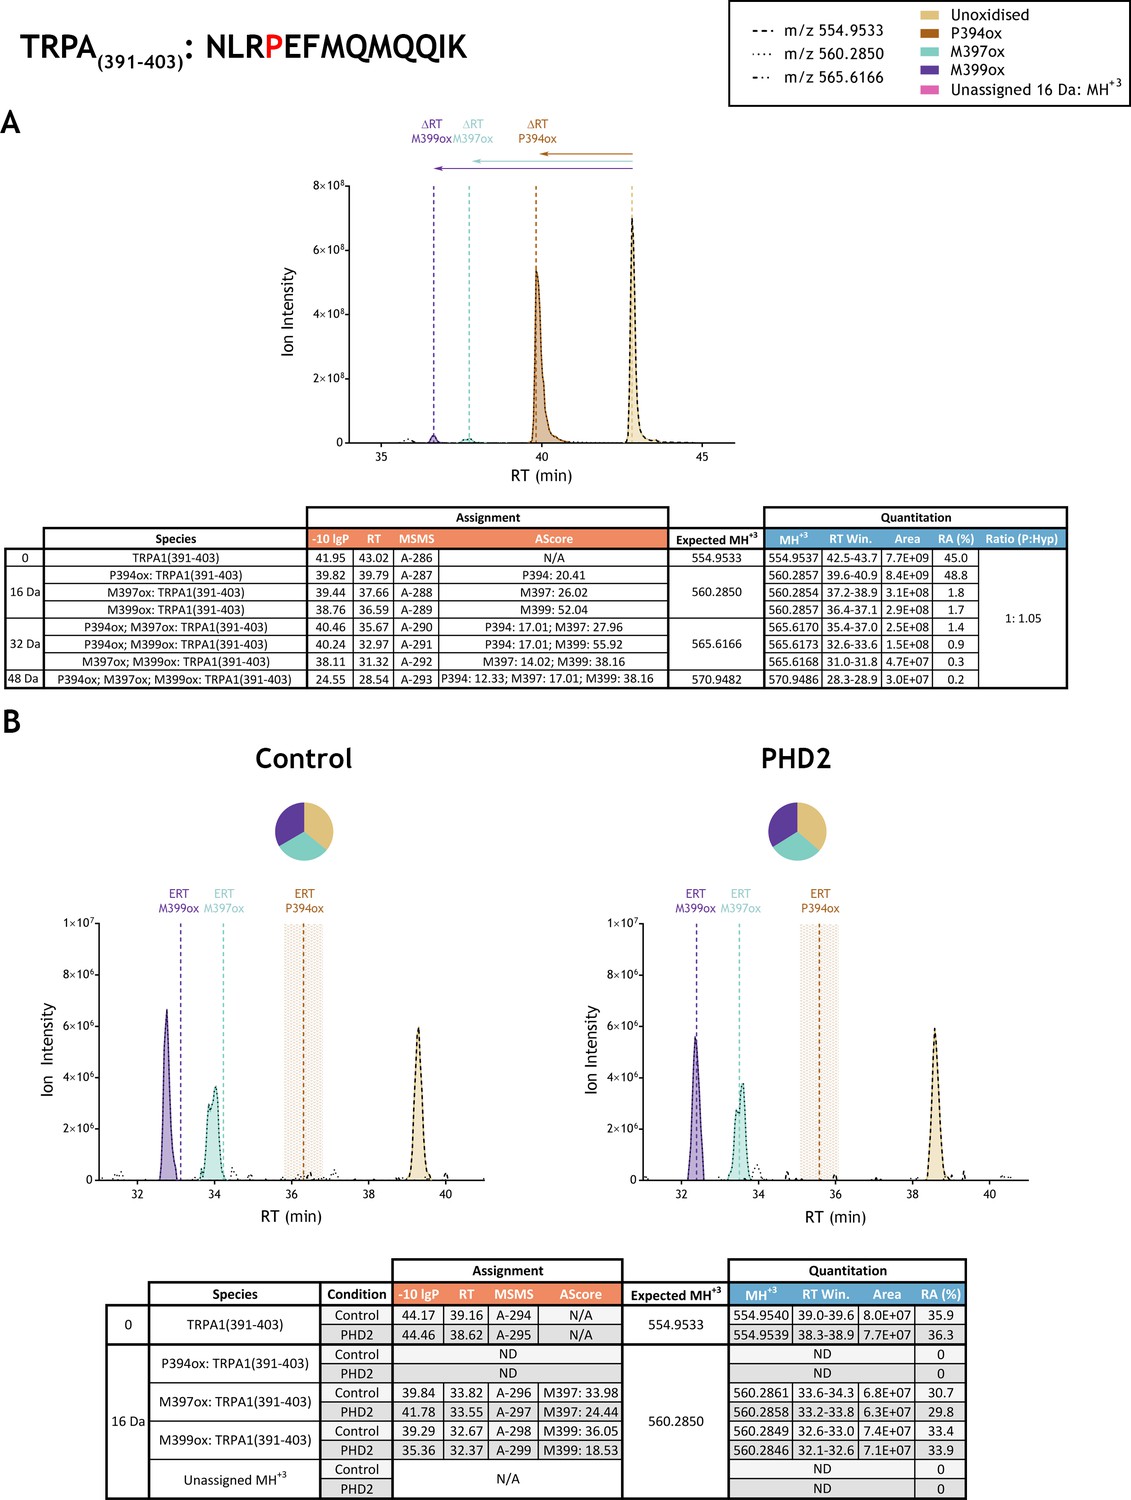
Quantitation of peptide oxidation on TRPA1(391–403) following reaction of full-length transient receptor potential cation channel subfamily A member 1 with recombinant PHD2.
XIC data presented in (A) shows ion intensity and retention time (RT) characteristics of equimolar synthetic peptide standards for unoxidised and P394ox forms of the TRPA1(391–403) peptide. MSMS assigned species are coloured (see inset) and include low abundance non-enzymatic methionine oxidations (M397ox: turquoise; M399ox: purple); vertical dashed lines define peak maxima used to derive ΔRT values for P394ox, M397ox and M399ox. Panel (B) shows comparable XIC data for protease-digested IVTT substrate under control (left) or PHD2-reacted (right) conditions. Peaks corresponding to unoxidised and methionine oxidised forms were assigned by MSMS; P394ox was not detected. Estimated RT (ERT) values for oxidised peptides, derived from (A), are indicated by dashed vertical lines and show IVTT-derived M397ox and M399ox eluting close to the ERT; shading applied to ERT P394ox corresponds to a 1 min RT window. Unassigned ions of compatible mass over charge for hydroxylation were not observed across the elution window. Quantitative data for observed species are presented as pie charts with XIC data. Assignment and quantitation data are tabulated below each panel, table headers are as follows: (−10lgP) significance score of leading assignment at given (RT) with ambiguity score (AScore) for PTM localisation and reference to primary MSMS data in Supplementary file 1. Quantitative data reports ion counts (Area) of observed masses (MH+3) integrated over time (RT Win.), expressed as relative abundance (RA). Data on detection efficiency for synthetic peptides (Panel A, P: Hyp) is an aggregated ratio of prolyl (P) to hydroxyprolyl (Hyp) containing species. Table A reports values for doubly- and triply-oxidised forms of TRPA1(391–403) which are used to derive P: Hyp ratio; for clarity only the singly oxidised ions are illustrated in XIC data.
Figure 4
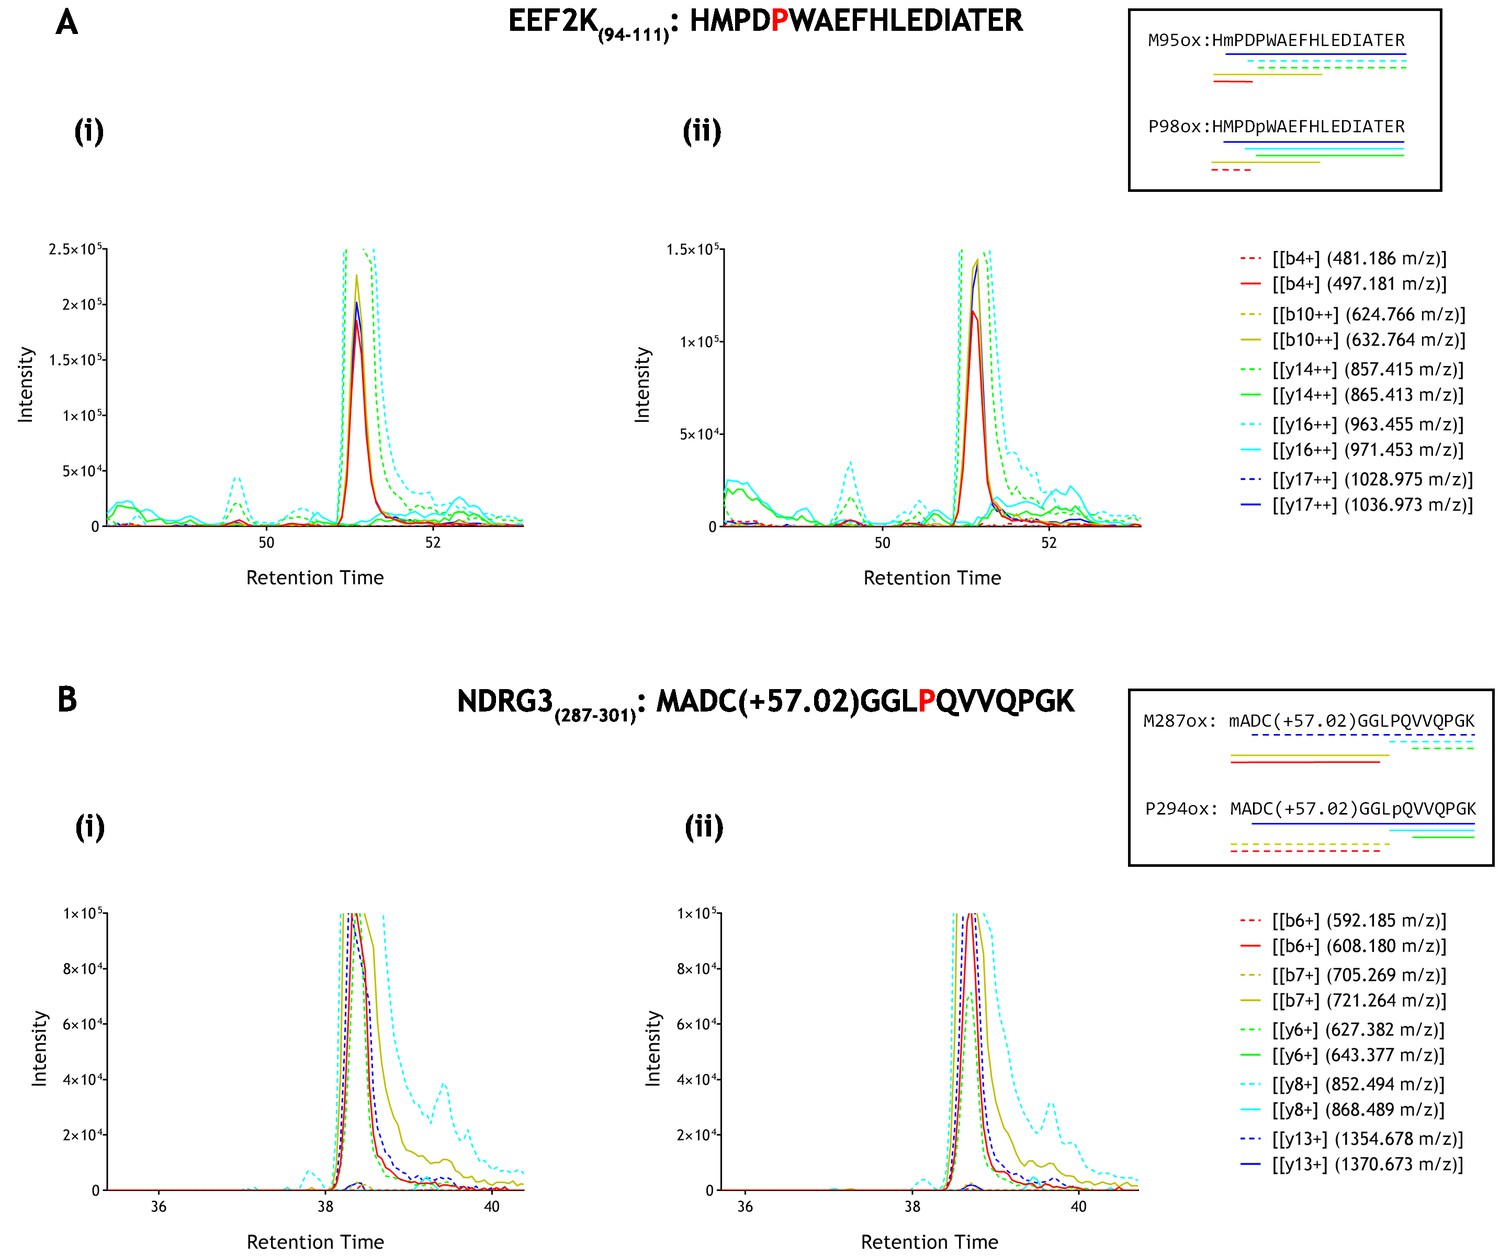
Parallel reaction monitoring (PRM) of oxidised EEF2K(94-111) and NDRG3(287–301) peptide species by mass spectrometry.
Fragment ions (n = 5), including ions of discriminatory mass for proline and methionine oxidation (see inset for schematic representation of fragment ions; dashed lines: unoxidised, solid lines: oxidised) were selected for PRM acquisition, based on existing MSMS data (Supplementary file 1: A167-169 and A207-209). The figure shows XIC data of PRM fragment ions corresponding to oxidised forms of (A) EEF2K(94-111) and (B) NDRG3(287–301) derived from IVTT hydroxylation assays under (i) control or (ii) PHD2-reacted conditions. Fragment ion masses indicative of proline oxidation were not observed across the elution profile. Note, the y-axis has been truncated to show fragment ions of lesser abundance (peak maxima for panels A and B: >1×10⁶ ion counts).
Figure 5
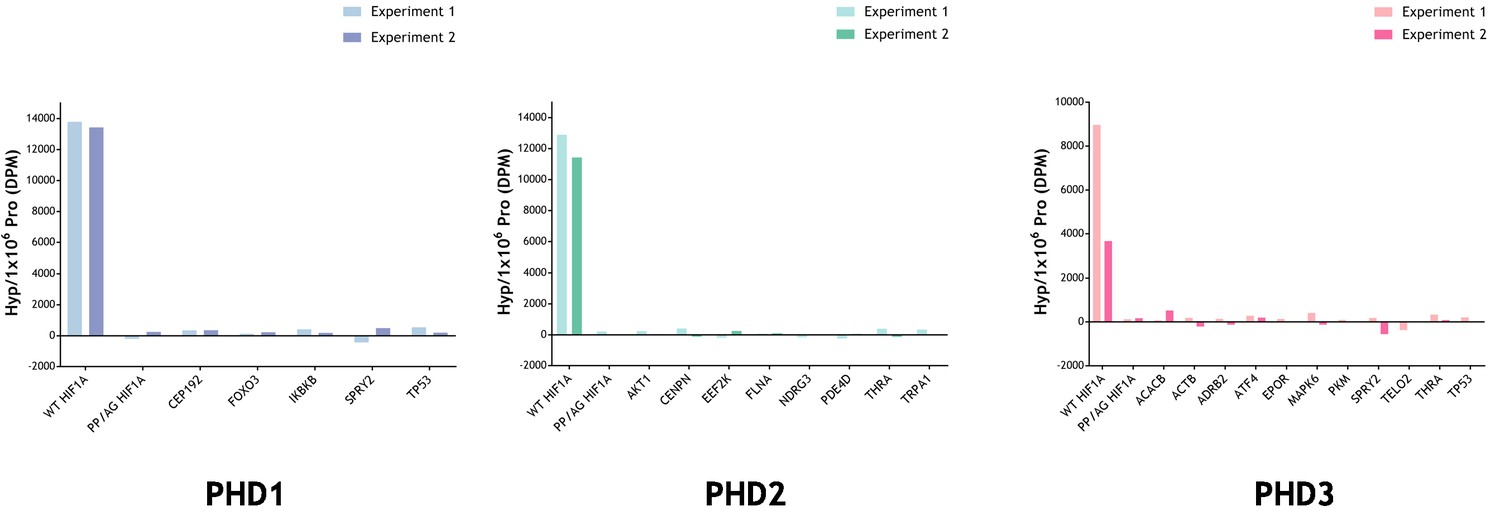
Radiochemical assay measuring the relative amount of 4-Hydroxy[3H]proline formed after incubation of reported substrate with PHD enzyme.
Substrates were produced by IVTT in the presence of L-[2,3,4,5-3H]proline and incubated with and without the indicated recombinant PHD enzyme. Conversion to 4-hydroxy[3H]proline was measured by radiochemical assay with data expressed as DPM Hyp/1 × 106 DPM Pro, DPM of the reaction without the PHD being subtracted. Assay efficacy was confirmed with a positive HIF-1α (WT) control. Background DPM range was determined with a negative PP/AG HIF-1α (P402A, P564G proline mutant) control. The hydroxylation level observed in PHD-reacted non-HIF substrates was not above background. Data are from two independent assays with the following (n = 1) exceptions: PKM (PHD3); TELO2 (PHD3); TRPA1 (PHD2).
-
Figure 5—source data 1
Numerical data for 4-hydroxy[3H]proline assay represented in Figure 5.
- https://doi.org/10.7554/eLife.46490.051
Tables
Table 1
Non-HIF substrates tested in assays of PHD-catalysed hydroxylation.
Potential target proline residues in the proposed substrate (Gene ID, column 1) have been defined according to the sequence numbering of the canonical proteoform (Uniprot Accession, column 2).
| Substrate | Uniprot Acc # | Target site(s) | PHD isoform | Reference |
|---|---|---|---|---|
| ACACB | O00763-1 | P343; P450; P2131 | PHD3 | German et al., 2016 |
| ACTB | P60709-1 | P307; P322 | PHD3 | Luo et al., 2014 |
| ADRB2 | P07550-1 | P382; P395 | PHD3 | Xie et al., 2009 |
| AKT1 | P31749-1 | P125; P313; P318; P423 | PHD2 | Guo et al., 2016 |
| ATF4 | P18848-1 | P156; P162; P164; P167; P174 | PHD3 | Köditz et al., 2007 |
| CENPN | Q96H22-1 | P311 | PHD2 | Moser et al., 2015 |
| CEP192 | Q8TEP8-3 | P2313 | PHD1 | Moser et al., 2013 |
| EEF2K | O00418-1 | P98 | Not defined | Moore et al., 2015 |
| EPOR | P19235-1 | P443; P450 | PHD3 | Heir et al., 2016 |
| FLNA | P21333-1 | P2317; P2324 | PHD2 | Segura et al., 2016 |
| FOXO3 | O43524-1 | P426; P437 | PHD1 | Zheng et al., 2014 |
| IKBKB | O14920-1 | P191 | PHD1 | Cummins et al., 2006 |
| MAPK6 | Q16659-1 | P25 | PHD3 | Rodriguez et al., 2016 |
| NDRG3 | Q9UGV2-1 | P294 | PHD2 | Lee et al., 2015 |
| PDE4D | Q08499-1 | P29; P382; P419 | PHD2 | Huo et al., 2012 |
| PKM | P14618-1 | P403; P408 | PHD3 | Luo et al., 2011 |
| POLR2A | P24928-1 | P1465 | PHD1 | Mikhaylova et al., 2008 |
| PPP2R2A | P63151-1 | P319 | PHD2 | Di Conza et al., 2017 |
| SPRY2 | O43597-1 | P18; P144; P160 | PHD1, 2, 3 | Anderson et al., 2011 |
| TELO2 | Q9Y4R8-1 | P374; P419; P422 | PHD3 | Xie et al., 2012 |
| THRA | P10827-1 | P160; P162 | PHD2, 3 | Xie et al., 2015 |
| TP53 | P04637-1 | P142 | PHD1 | Ullah et al., 2017 |
| TP53 | P04637-1 | P359 | PHD3 | Rodriguez et al., 2018 |
| TRPA1 | O75762-1 | P394 | PHD2 | Takahashi et al., 2011 |
-
Table 1—source data 1
Synthetic peptides tested in assays of PHD-catalysed hydroxylation.
Reported prolyl hydroxylation sites are indicated in red.
- https://doi.org/10.7554/eLife.46490.003
-
Table 1—source data 2
Secondary structure comparison of HIF and non-HIF PHD substrates using crystallographic data and PSIPRED prediction software.
The secondary structures of metazoan HIF-α (upper panel) and reported non-HIF PHD substrates (human; lower panel) were predicted by PSIPRED (Jones, 1999) and, where possible, referenced to crystallographic data from the protein data bank (PDB). Predicted structural elements are defined as alpha-helical (red), beta-strand (blue), or coiled/no secondary structure (uncoloured). Note, PSIPRED does not define detailed secondary structures, such as bends/turns (green) and beta-bridges (start of a strand; yellow). Input sequences for PSIPRED were 30-mer in length with the target proline (bold) sited centrally. To limit duplication, for sequences containing multiple target residues in close proximity (i.e., less than five residues apart), only one sequence corresponding to the N-terminal target proline is shown. Metazoan HIF sequences which support human PHD2 catalytic activity in vitro are included (Loenarz et al., 2011): dr, Danio rerio; bf, Branchiostoma floridae; sp, Strongylocentrotus purpurtas; mm, Mus musculus; nv, Nasonia vitripensis; ta, Trichoplax adhaerens. Italicised PDB codes indicate substrates crystalized in complex with a PHD; ‘-' denotes end of resolved structure.
- https://doi.org/10.7554/eLife.46490.004
Table 2
Summary of oxidations observed on protein substrates produced by IVTT and reacted with the indicated PHD enzyme(s).
Mass spectrometry was performed on IVTT-derived substrates (column 1) reacted in the presence or absence of the indicated PHD isoform (column 2). Substrates were immunopurified by FLAG affinity and digested with the specified protease(s) (column 3) to yield peptides encompassing the putative target prolyl site, which are indicated in bold (column 4); note, during sample processing peptides containing cysteine residues were derivatized with iodoacetamide to give carbamidomethylated cysteine (+57.02). Reference to primary data for non-HIF substrates (i.e., MSMS assignment and quantitation) is provided in column five and summarised in columns 6–10. Assigned oxidations are listed in column 6; no oxidation detected (ND); oxidation detected but not localised to a specific residue (NL). Note, prolyl hydroxylation was not detected. Quantitative data for control and PHD-reacted IVTTs is given for these oxidations (columns 7–8, respectively). Low abundance peptide ions of compatible mass for oxidation, which were below the threshold for MSMS determination but present in LC-MS data (within −5 min retention time window), were also quantified (columns 9–10). The abundance of each assigned or putative oxidation is expressed as a percentage of the non-hydroxylated peptide. Summary results for the products of control reactions that were conducted in parallel on HIF-1α to verify PHD enzyme activity are shown in columns 11–14; values were obtained by similar methods (see Supplementary file 2 for figures depicting these primary data). Each row relates a specific ‘test’ reaction to its batch control HIF-1α reaction; note that high levels of activity on HIF-1α substrates were observed upon addition of exogenous PHD enzyme in all controls.
| Non-HIF substrate | HIF-1α control | ||||||||||||
|---|---|---|---|---|---|---|---|---|---|---|---|---|---|
| Quantified peptide | Figure | Oxidation | Assigned ox (%) | Unassigned ions (%) | HIF-1α P402ox (%) | HIF-1α P564ox (%) | |||||||
| Substrate | PHD Isoform | Protease | Control | Enzyme | Control | Enzyme | Control | Enzyme | Control | Enzyme | |||
| ACACB | PHD3 | LysC | RIPVQAVWAGWGHASENPKLPELLC(+57.02)K | 3, s1 | ND | - | - | 0.4% | 1.7% | 58% | 52% | 53% | 72% |
| DVDEGLEAAERIGFPLMIK | 3, s2 | M452 | 76% | 77% | 2.3% | 0.9% | |||||||
| ACTB | PHD3 | Trypsin | DLYANTVLSGGTTMYPGIADR | 3, s3 | M305 | 71% | 48% | ND | ND | 6.3% | 9.9% | 29% | 91% |
| EITALAPSTMK | 3, s4 | M325 | 54% | 30% | 0.3% | 0.1% | |||||||
| ADRB2 | PHD3 | Trypsin | LLC(+57.02)EDLPGTEDFVGHQGTVPSDNIDSQGR | 3, s5 | D380 | 2.8% | 1.5% | ND | <0.1% | 6.3% | 9.9% | 29% | 91% |
| AKT1 | PHD2 | Trypsin | SGSPSDNSGAEEMEVSLAK | 3, s6 | M134 | 35% | 39% | ND | ND | 18% | 94% | 30% | 96% |
| TFC(+57.02)GTPEYLAPEVLEDNDYGR | 3, s7 | ox: NL | 0.6% | 0.8% | ND | ND | |||||||
| LSPPFKPQVTSETDTR | 3, s8 | ND | - | - | ND | ND | |||||||
| ATF4 | PHD3 | Elastase | GHLPESLTKPDQVAPFTFLQPLPLSPG | 3, s9 | ND | - | - | ND | ND | 6.3% | 9.9% | 29% | 91% |
| STPDHSFSLELGSEVDITEGDRKPDYT | 3, s10 | ND | - | - | ND | ND | |||||||
| CENPN | PHD2 | Trypsin | SLAPAGIADAPLSPLLTC(+57.02)IPNKR | 3, s11 | ND | - | - | ND | ND | ND | ND | 22% | 94% |
| CEP192 | PHD1 | Trypsin | WHLSSLAPPYVK | 3, s12 | ND | - | - | <0.1% | ND | 51% | 95% | 60% | 82% |
| EEF2K | PHD2 | Trypsin | HMPDPWAEFHLEDIATER | 3, s13 | M95 | 48% | 38% | ND | 0.2% | 0.5% | 88% | 36% | 93% |
| EPOR | PHD3 | LysC + GluC | YTILDPSSQLLRPWTLC(+57.02)PELPPTPPHLK | 3, s14 | ox: NL | 1.4% | 1.4% | ND | ND | 9.5% | 15% | 23% | 94% |
| diox: W439 | 2.0% | 1.8% | |||||||||||
| FLNA | PHD2 | Trypsin | FNEEHIPDSPFVVPVASPSGDAR | 3, s15 | ND | - | - | 0.1% | 0.3% | ND | ND | 22% | 94% |
| FOXO3 | PHD1 | Trypsin | GSGLGSPTSSFNSTVFGPSSLNSLR | 3, s16 | ND | - | - | 2.2% | 0.9% | 14% | 97% | 25% | 86% |
| IKBKB | PHD1 | Trypsin | ELDQGSLC(+57.02)TSFVGTLQYLAPELLEQQK | 3, s17 | ND | - | - | 14% | 14% | 14% | 97% | 25% | 86% |
| MAPK6 | PHD3 | Trypsin | YMDLKPLGC(+57.02)GGNGLVFSAVDNDC(+57.02)DKR | 3 | M21 | 19% | 12% | 0.3% | 0.3% | 9.5% | 15% | 23% | 94% |
| NDRG3 | PHD2 | Trypsin | MADC(+57.02)GGLPQVVQPGK | 3, s18 | M287 | 48% | 21% | 1.8% | 0.9% | 17% | 92% | 24% | 93% |
| PDE4D | PHD2 | Trypsin | LMHSSSLTNSSIPR | 3, s19 | M371 | 61% | 36% | ND | ND | 0.5% | 88% | 36% | 93% |
| IAELSGNRPLTVIMHTIFQER | 3, s20 | M424 | 51% | 45% | ND | ND | |||||||
| PKM | PHD3 | Trypsin | LAPITSDPTEATAVGAVEASFK | 3, s21 | ND | - | - | <0.1% | 0.1% | 6.3% | 9.9% | 29% | 91% |
| PPP2R2A | PHD2 | Trypsin | IWDLNMENRPVETYQVHEYLR | 3, s22 | M315 | 14% | 20% | ND | ND | 27% | 86% | 36% | 91% |
| SPRY2 | PHD1 | Trypsin | AQSGNGSQPLLQTPR | - | - | - | - | ND | ND | - | - | - | - |
| PHD3 | 3, s23 | ND | - | - | ND | ND | ND | ND | 52% | 92% | |||
| PHD1 | LLGSSFSSGPVADGIIR | 3, s24 | ND | - | - | 0.9% | ND | 9.5% | 92% | 23% | 83% | ||
| PHD3 | 3, s25 | ND | - | - | ND | ND | ND | ND | 52% | 92% | |||
| PHD1 | SELKPGELKPLSK | 3, s26 | ND | - | - | ND | ND | 9.5% | 92% | 23% | 83% | ||
| PHD3 | 3, s27 | ND | - | - | ND | ND | ND | ND | 52% | 92% | |||
| TELO2 | PHD3 | Trypsin | AVLIC(+57.02)LAQLGEPELR | 3, s28 | ND | - | - | 8.9% | 6.5% | ND | ND | 52% | 92% |
| THRA | PHD2 | Trypsin | SLQQRPEPTPEEWDLIHIATEAHR | 3, s29 | ox: NL | 0.9% | 0.7% | 1.8% | 1.3% | 15% | 94% | 26% | 96% |
| diox: W165 | 5.4% | 5.1% | |||||||||||
| PHD3 | 3, s30 | ox: NL | 0.9% | 0.8% | 1.8% | 0.8% | 15% | 16% | 26% | 86% | |||
| diox: W165 | 5.4% | 4.8% | |||||||||||
| TP53 | PHD1 | Trypsin | TC(+57.02)PVQLWVDSTPPPGTR | 3, s31 | ND | - | - | ND | ND | 9.5% | 92% | 23% | 83% |
| PHD3 | LysC | EPGGSRAHSSHLK | 3, s32 | ND | - | - | ND | 0.4% | 21% | 24% | 30% | 78% | |
| TRPA1 | PHD2 | Trypsin | NLRPEFMQMQQIK | 3, s33 | M397 | 31% | 30% | ND | ND | 0.5% | 88% | 36% | 93% |
| M399 | 33% | 34% | |||||||||||
-
Table 2—source data 1
Peptide standards employed in IVTT hydroxylation assays.
The table lists synthetic peptide sequences corresponding to unoxidised and hydroxylated variants (column 3) of protease-digested peptides assigned and quantified in IVTT hydroxylation assays. Equimolar injections of the indicated peptide variants were used for comparison of detection efficiency (column 4) and chromatographic elution time (column 5) by LC-MSMS analysis. References to the primary XIC data are indicated in column 6.
- https://doi.org/10.7554/eLife.46490.008
Table 3
Analysis of the cellular proteome for oxidised peptides encompassing reported sites of prolyl hydroxylation.
The number of unmodified and singly oxidised peptides containing reported sites of PHD-catalysed hydroxylation were counted over a range of stringency filters. Where multiple reported oxidation sites of one protein occur on separate peptides the number of spectra recorded is a summation of all interrogated peptides. The number of assigned target site prolyl oxidations is indicated in bold; methionine (Met) and alternate oxidation sites, including non-target proline residues (Other) are also presented together with unoxidised peptides for comparison. Stringency filters were applied as follows; PTM assignment confidence as assessed by ambiguity score (AScore:>20) and fragment ion intensity (Ion Intensity:>5%). These filters were applied separately and in combination to derive a list of assigned peptides with confidently localised oxidations. There are no high confidence proline oxidation assignments (i.e., meeting both AScore and Ion Intensity thresholds) of the reported substrates, suggesting a high degree of uncertainty from the software.
| # Spectra filtered by confidence of modification site | |||||||
|---|---|---|---|---|---|---|---|
| Gene ID | Reported site | Assigned | No filter | AScore | Ion Intensity | AScore and Ion Intensity | |
| ACACB | P343, P450, P2131 | Unoxidised | 63 | N/A | N/A | N/A | |
| ACTB | P307, P322 | P322 | 57 | 7 | 11 | - | |
| Met | 4528 | 647 | 4096 | 406 | |||
| Other | 336 | 58 | 62 | 7 | |||
| Unoxidised | 8650 | N/A | N/A | N/A | |||
| ADRB2 | P382*, P395* | Unoxidised | 1 | N/A | N/A | N/A | |
| AKT1 | P125, P313*, P318*, P423 | Unoxidised | 160 | N/A | N/A | N/A | |
| CENPN | P311 | Unoxidised | 7 | N/A | N/A | N/A | |
| EEF2K | P98 | Met | 5 | - | - | - | |
| Unoxidised | 41 | N/A | N/A | N/A | |||
| FLNA | P2317*, P2324* | P2324 | 2 | - | - | - | |
| Other | 1 | - | - | - | |||
| Unoxidised | 562 | N/A | N/A | N/A | |||
| FOXO3 | P426*, P437* | Unoxidised | 4 | N/A | N/A | N/A | |
| NDRG3 | P294 | Met | 13 | 5 | - | - | |
| Unoxidised | 49 | N/A | N/A | N/A | |||
| PDE4D | P29, P382, P419 | Met | 14 | 13 | 9 | 9 | |
| Other | 1 | - | - | - | |||
| Unoxidised | 23 | N/A | N/A | N/A | |||
| PKM | P403*, P408* | P403 | 3 | 1 | - | - | |
| P408 | 5 | - | - | - | |||
| Other | 5 | - | - | - | |||
| Unoxidised | 3394 | N/A | N/A | N/A | |||
| PPP2R2A | P319 | Met | 50 | 11 | 26 | 11 | |
| Other | 18 | - | - | - | |||
| Unoxidised | 119 | N/A | N/A | N/A | |||
| SPRY2 | P18, P144, P160 | Unoxidised | 7 | N/A | N/A | N/A | |
| TELO2 | P374, P419, P422 | Unoxidised | 47 | N/A | N/A | N/A | |
| THRA | P160*, P162* | Unoxidised | 20 | N/A | N/A | N/A | |
| TP53 | P142, P359 | Unoxidised | 7 | N/A | N/A | N/A | |
| | Total | Pro | 67 | 8 | 11 | 0 | |
| Met | 4610 | 676 | 4131 | 426 | |||
| Other | 361 | 58 | 62 | 7 | |||
| Unoxidised | 13154 | 0 | 0 | 0 | |||
| All | 18192 | 742 | 4204 | 433 | |||
-
*Doubly oxidised peptides were interrogated when multiple prolyl hydroxylation sites had been reported on the same tryptic peptide.
-
Table 3—source data 1
Summary of non-enzymatic oxidation assignments on synthetic peptide standards.
MSMS assignment frequency of artefactual oxidations observed on unmodified tryptic peptide standards; oxidations are stratified by residue (e.g., Met, Pro, other). Reported assignments (column 4) were not subject to PTM localisation (AScore) filtering. Oxidations assigned to target Pro residues are indicated in red. Variation in the total number of peptide assignments (Column 5) reflects differences in the amount of peptide injected and/or replicate runs.
- https://doi.org/10.7554/eLife.46490.053
-
Table 3—source data 2
Peptide identification results from database search represented in Table 3.
- https://doi.org/10.7554/eLife.46490.054
Key resources table
| Reagent type (species) or resource | Designation | Source or reference | Identifiers | Additional information |
|---|---|---|---|---|
| Gene (human) | ACACB | ORFeome collaboration | GenBank: BC172264 | |
| Gene (human) | ACTB | Mammalian Gene Collection | GenBank: BC001301.1 | |
| Gene (human) | ADRB2 | Mammalian Gene Collection | GenBank: BC073856.1 | |
| Gene (human) | AKT1 | ORFeome collaboration | GenBank: EU832571.1 | |
| Gene (human) | ATF4 | ORFeome collaboration | GenBank: DQ891758.2 | |
| Gene (human) | CENPN | Mammalian Gene Collection | GenBank: BC008972.1 | |
| Gene (human) | CEP192 | PMID: 23641073 | ||
| Gene (human) | EEF2K | ORFeome collaboration | GenBank: DQ894050.2 | |
| Gene (human) | EPOR | Sino Biological | NCBI Refseq: NR_033663.1 | |
| Gene (human) | FLNA | Addgene (#8982) | ||
| Gene (human) | FOXO3 | Mammalian Gene Collection | GenBank: BC020227.1 | |
| Gene (human) | IKBKB | Addgene (#11103) | ||
| Gene (human) | MAPK6 | ORFeome collaboration | GenBank: DQ894810.2 | |
| Gene (human) | NDRG3 | Mammalian Gene Collection | GenBank: BC144169.1 | |
| Gene (human) | PDE4D | ORFeome collaboration | GenBank: JF432192.1 | |
| Gene (human) | PKM | Mammalian Gene Collection | GenBank: BC012811.2 | |
| Gene (human) | PPP2R2A | Addgene (#13804) | ||
| Gene (human) | SPRY2 | ORFeome collaboration | GenBank: AM392994.1 | |
| Gene (human) | TELO2 | ORFeome collaboration | GenBank: AM392917.1 | |
| Gene (human) | THRA | ORFeome collaboration | GenBank: DQ895726.2 | |
| Gene (human) | TP53 | ORFeome collaboration | GenBank: DQ892492.2 | |
| Gene (human) | TRPA1 | ORFeome collaboration | GenBank: BC148423.1 | |
| Recombinant DNA reagent | 3xFLAG-tagged ORF | This study | Vector backbone: pT7CFE1 (Thermo Fisher Scientific) | |
| Recombinant protein | PHD3 (EGLN3) | PMID: 27502280 | E. coli expression | |
| Recombinant protein | PHD3 (EGLN3) | PMID: 12788921 | Insect cell (Sf9) expression | |
| Recombinant protein | PHD2 (EGLN1) | PMID: 12788921 | Insect cell (Sf9) expression | |
| Recombinant protein | PHD1 (EGLN2) | PMID: 12788921 | Insect cell (Sf9) expression | |
| Peptide | Assorted peptides | This study | Sequence information provided in Table 1—source data 1.and Table 2—source data 1. | |
| Commercial assay or kit | 1-Step Human Coupled IVT kit | Thermo Fisher Scientific | ||
| Software, algorithm | PEAKS Studio | Bioinformatics Solutions |
Additional files
-
Supplementary file 1
MSMS assignments corresponding to Figures 2 and 3 and associated supplements.
- https://doi.org/10.7554/eLife.46490.055
-
Supplementary file 2
Quantitation of PHD-catalysed prolyl hydroxylation of full-length hypoxia-inducible factor 1α; control hydroxylation assays for HIF-1α corresponding to Figure 3 and supplements.
HIF-1α hydroxylation assays were performed in parallel with alternative substrates to confirm the activity of recombinant PHD enzyme preparations. The relationship between each HIF1A hydroxylation dataset and corresponding alternative substrate assay is indicated above each figure. Full-length HIF-1α protein produced by IVTT was incubated in the absence (Control) or presence of the indicated (PHD) enzyme and digested with trypsin. Endogenous PHD activity in HeLa cell lysate gave rise to a basal (control) level of hydroxylation that markedly increased upon addition of recombinant PHD. To facilitate quantitation of P564ox we used a variant of HIF1A in which adjacent methionine residues that are prone to de novo oxidation were substituted to alanine (HIF1A*: M561A, M568A). This modified form of HIF1A is more amenable to LC-MS based quantitation (peak intensities are not reduced as a consequence of methionine oxidation) and has no appreciable effect on the rate of PHD-dependent catalysis (Tian et al., 2011). Detection of P564 peptide ions was robust across replicate assays and relative quantitation data are presented for all HIF-1α hydroxylation assays. Detection of P402 peptide ions was more variable, requiring an additional (i.e., non-specific) cleavage by trypsin in order to monitor hydroxylation at this site. Relative quantitation of P564ox is presented in panel A, as XIC of m/z 1590.7540 and 1598.7515 corresponding to unoxidised (pink) and P564ox (blue) forms of HIF1A*(548-575). Where present, semi-tryptic peptides encompassing P402 were detected as either HIF1A*(392-403) or HIF1A*(392-411). Panel B shows XIC for precursor ion masses corresponding to unoxidised (pink; (i) m/z 619.8532, (ii) m/z 1005.0619) and P402ox (blue; (i) 627.8506, (ii) 1013.0592) forms of related (i) HIF1A*(392-403) or (ii) HIF1A*(392-411) peptides. Quantitative data for observed species are presented as pie charts with XIC data. Assignment and quantitation data are tabulated below each panel, table headers are as follows: (−10lgP) significance score of leading assignment at given (RT) with ambiguity score (AScore) for PTM localisation and reference to primary MSMS data in Supplementary file 1. Quantitative data reports ion counts (Area) of observed masses (MH+2) integrated over time (RT Win.), expressed as relative abundance (RA).
- https://doi.org/10.7554/eLife.46490.056
-
Supplementary file 3
Tabulated inventory of unprocessed MS data (RAW files) associated with IVTT hydroxylation assays presented in Figure 2 (table i) and Figure 3 (table ii).
- https://doi.org/10.7554/eLife.46490.057
-
Supplementary file 4
Replicate information for peptide hydroxylation assays, IVTT hydroxylation assays and radioassays for hydroxyproline.
- https://doi.org/10.7554/eLife.46490.058
-
Transparent reporting form
- https://doi.org/10.7554/eLife.46490.059
Download links
A two-part list of links to download the article, or parts of the article, in various formats.
Downloads (link to download the article as PDF)
Open citations (links to open the citations from this article in various online reference manager services)
Cite this article (links to download the citations from this article in formats compatible with various reference manager tools)
Lack of activity of recombinant HIF prolyl hydroxylases (PHDs) on reported non-HIF substrates
eLife 8:e46490.
https://doi.org/10.7554/eLife.46490


