The transcription factor odd-paired regulates temporal identity in transit-amplifying neural progenitors via an incoherent feed-forward loop
- IMBA – Institute of Molecular Biotechnology of the Austrian Academy of Science, Vienna Biocenter (VBC), Austria
Figures
Figure 1 with 2 supplements
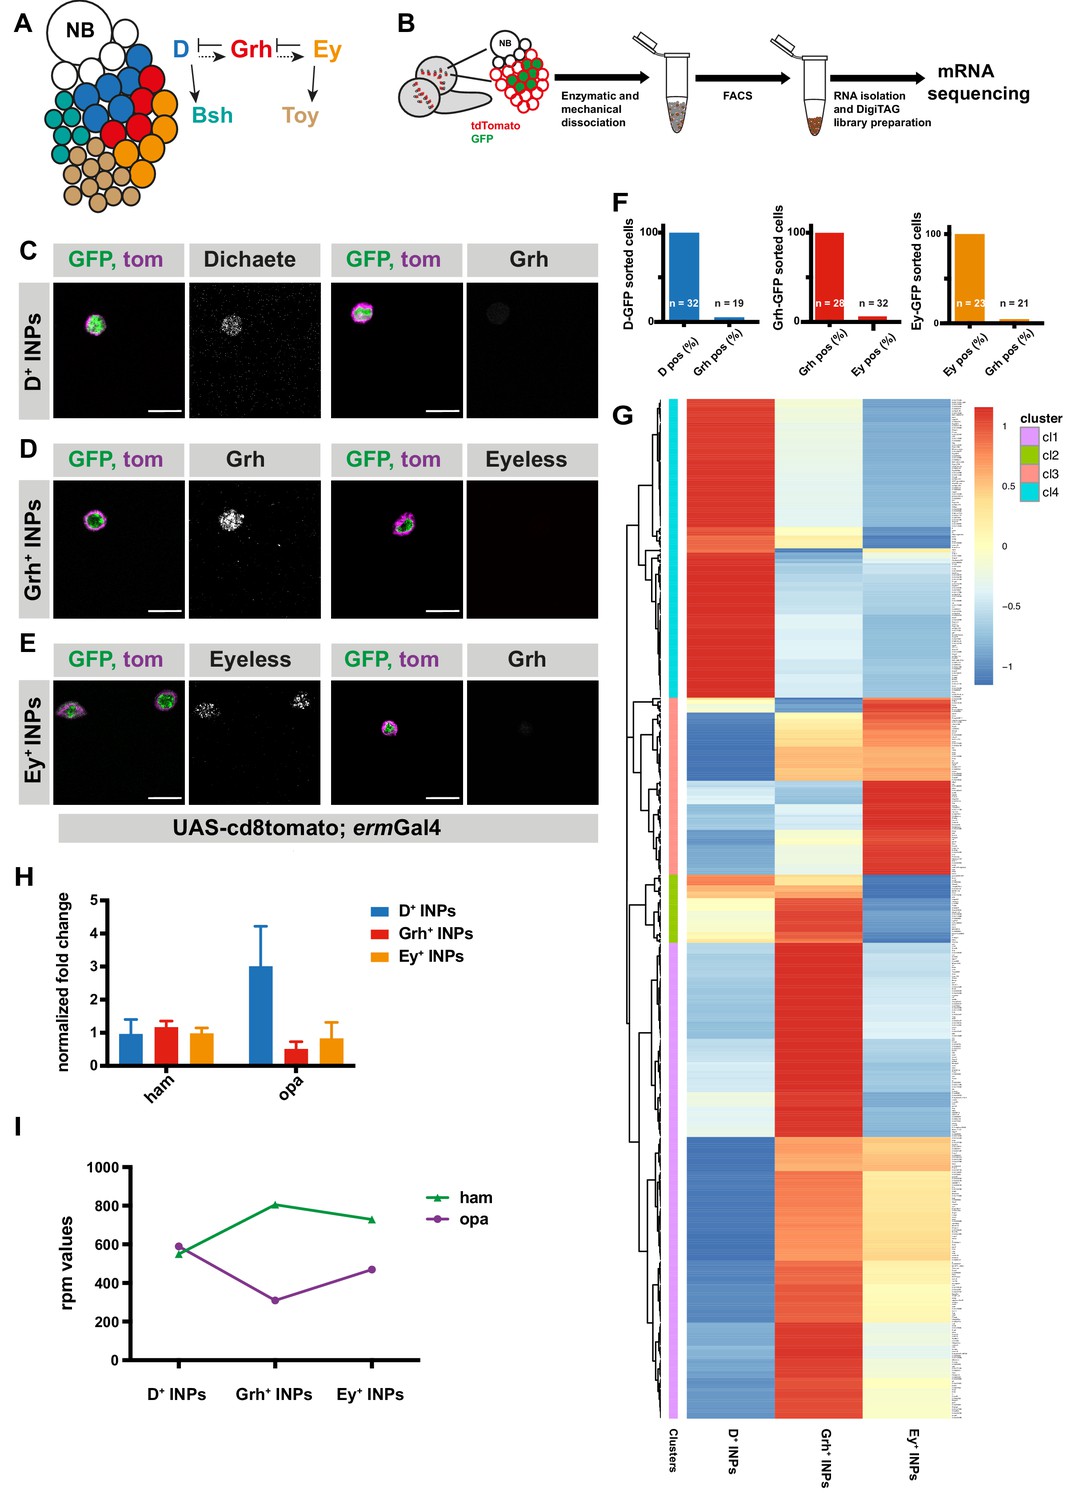
Transcriptomic analysis of temporally staged-INPs.
(A) Cartoon depicting a typical type II neuroblast of larval Drosophila brain; NB and imINPs (empty circles) are followed by mINPs and neurons, GMCs omitted for simplicity. INPs are temporally patterned with Dichaete (blue), Grainyhead (red), and Eyeless (orange), and neurons are Bsh (green) or Toy (brown) positive. Summary of the regulation of temporal identity factors, and their progeny. (B) Cartoon illustrating the strategy used to isolate temporally-staged INPs. (C–E) D-, Grh and Ey-GFP FACS-sorted cells are stained for D and Grh (C), Grh or Ey (D–E), GFP-tagging temporal identity factors (in green, D or, Grh or Ey), tdTomato tagging the membrane of INPs (magenta), antibody staining (gray) scale bar 10 μm, (induced with ermGal4, marked with membrane bound tdTomato). (F) Graphs showing the percentage of temporal identity positive cells in D-, Grh- or Ey-GFP FACS sorted cells. n numbers are depicted on the graphs. (G) Hierarchical clustering analysis of gene log2fc between three different temporally-staged INP populations. (H) qPCR analysis of opa and ham expression levels in FACS-sorted D+, Grh+ and Ey+ INPs. Data are mean ± SD, n = 3, genes were normalized to Act5c, and then the average expression levels, Delta-Delta Ct method is used. (I) Graph showing the rpm levels of opa and ham between different INP temporal stages.
-
Figure 1—source data 1
Quantification of temporally FACS-sorted INPs for temporal markers (Figure 1F).
- https://doi.org/10.7554/eLife.46566.006
-
Figure 1—source data 2
qPCR data (Figure 1H).
- https://doi.org/10.7554/eLife.46566.007
-
Figure 1—source data 3
Rpm levels of opa and ham genes in three different temporal states of INPs (Figure 1I).
- https://doi.org/10.7554/eLife.46566.008
Figure 1—figure supplement 1
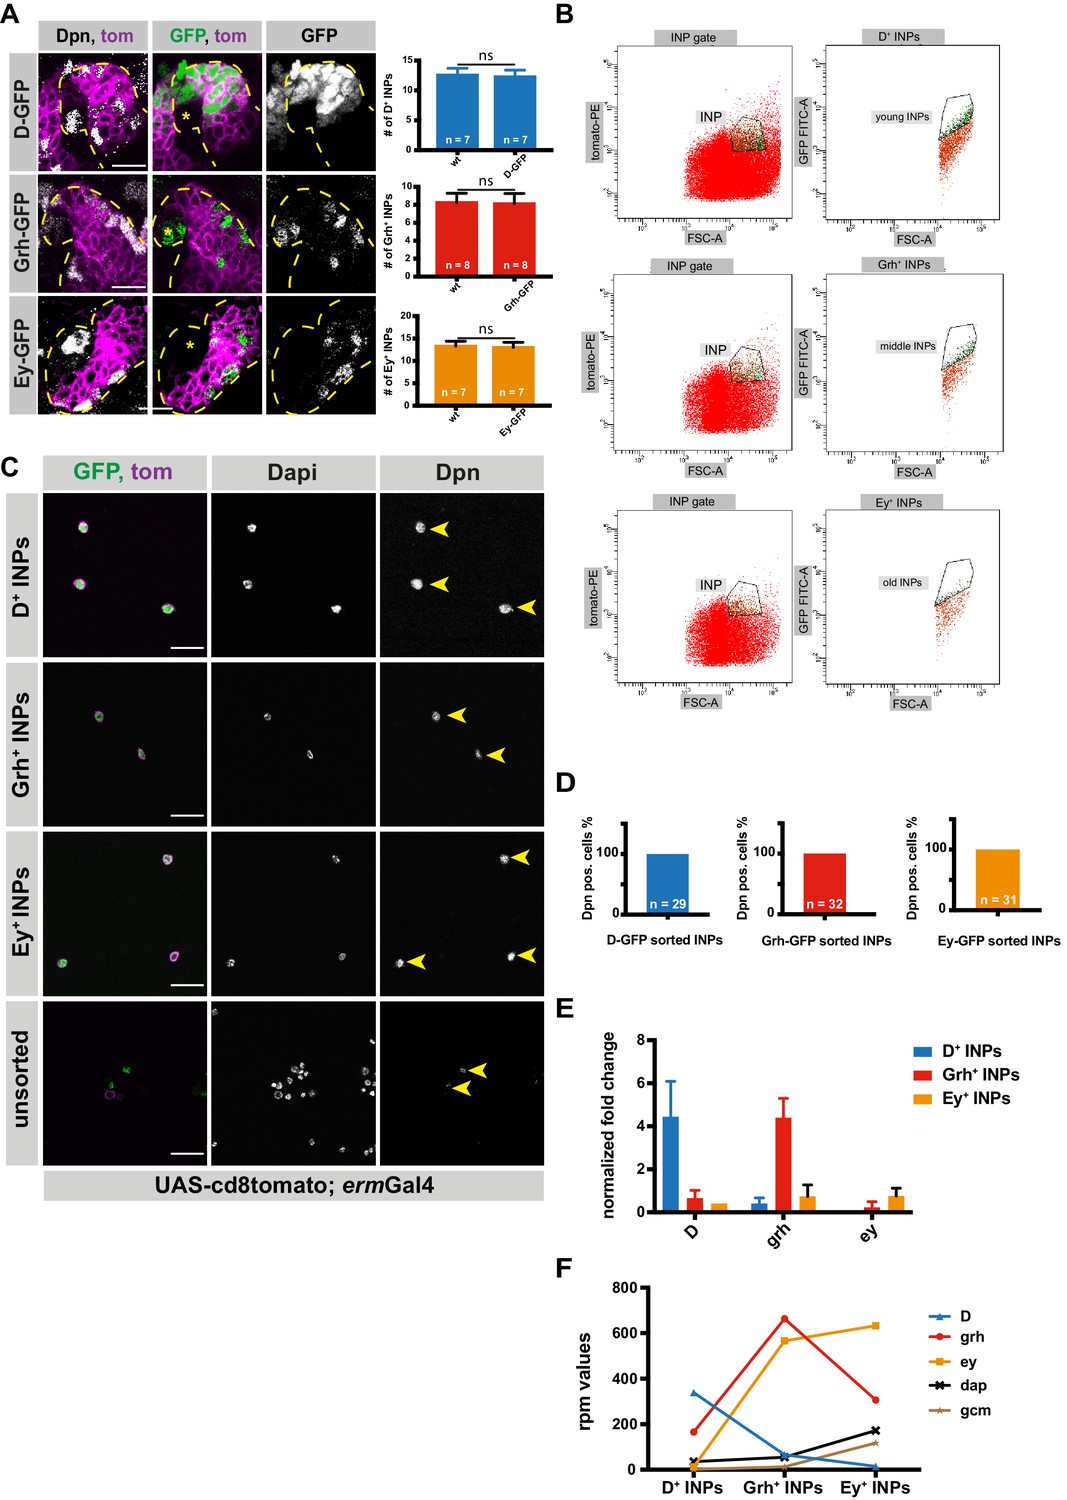
INPs can be FACS-sorted depending on their temporal identity.
(A) Close-up images of larval brains expressing tdtomato in INP-specific manner (UAS-cd8tomato; ermGal4, shown in magenta) and temporal identity markers, Dichaete, Grainyhead and Eyeless tagged with GFP, stained for Dpn (gray). Type II lineages are outlined with yellow dashed lines, NBs are marked with *, scale bar 10 μm, (induced with ermGal4, marked with membrane bound tdTomato). Graphs showing the numbers of each temporal identity markers in control vs GFP-tagged brains. (B) Representative FACS plots of sorted INP temporal stages. The population with highest tomato and GFP expression (vertical axis) versus biggest cell size (horizontal axis) was sorted to obtain D+, Grh+, and Ey+ INPs. (C) D-, Grh- and Ey-GFP FACS-sorted cells and their unsorted control are stained for Dpn (gray), GFP-tagging temporal identity factors (in green, D or, Grh or Ey), tdTomato tagging the membrane of INPs (magenta), Dapi (gray), scale bar 20 μm, yellow arrowheads mark Dpn positive cells, (induced with ermGal4, marked with membrane bound tdTomato). (D) Graph showing the percentages of Dpn positive cells, n is the number of the cells analyzed. (E) qPCR analysis of temporal identity expression levels in FACS-sorted D+, Grh+ and Ey+ INPs. Data are mean ± SD, n = 3, genes were normalized to Act5c, and then the average expression levels, Delta-Delta Ct method is used. (F) Graph showing the rpm levels of marker genes between different INP temporal stages.
-
Figure 1—figure supplement 1—source data 1
Quantification of number of INPs in three different temporal states versus their GFP-tagged counterparts (Figure 1—figure supplement 1A).
- https://doi.org/10.7554/eLife.46566.009
-
Figure 1—figure supplement 1—source data 2
Quantification of FACS-sorted INPs Dpn staining positivity (Figure 1—figure supplement 1D).
- https://doi.org/10.7554/eLife.46566.010
-
Figure 1—figure supplement 1—source data 3
qPCR data (Figure 1—figure supplement 1E).
- https://doi.org/10.7554/eLife.46566.011
-
Figure 1—figure supplement 1—source data 4
Rpm levels of genes in three different temporal states of INPs (Figure 1—figure supplement 1F).
- https://doi.org/10.7554/eLife.46566.012
Figure 1—figure supplement 2
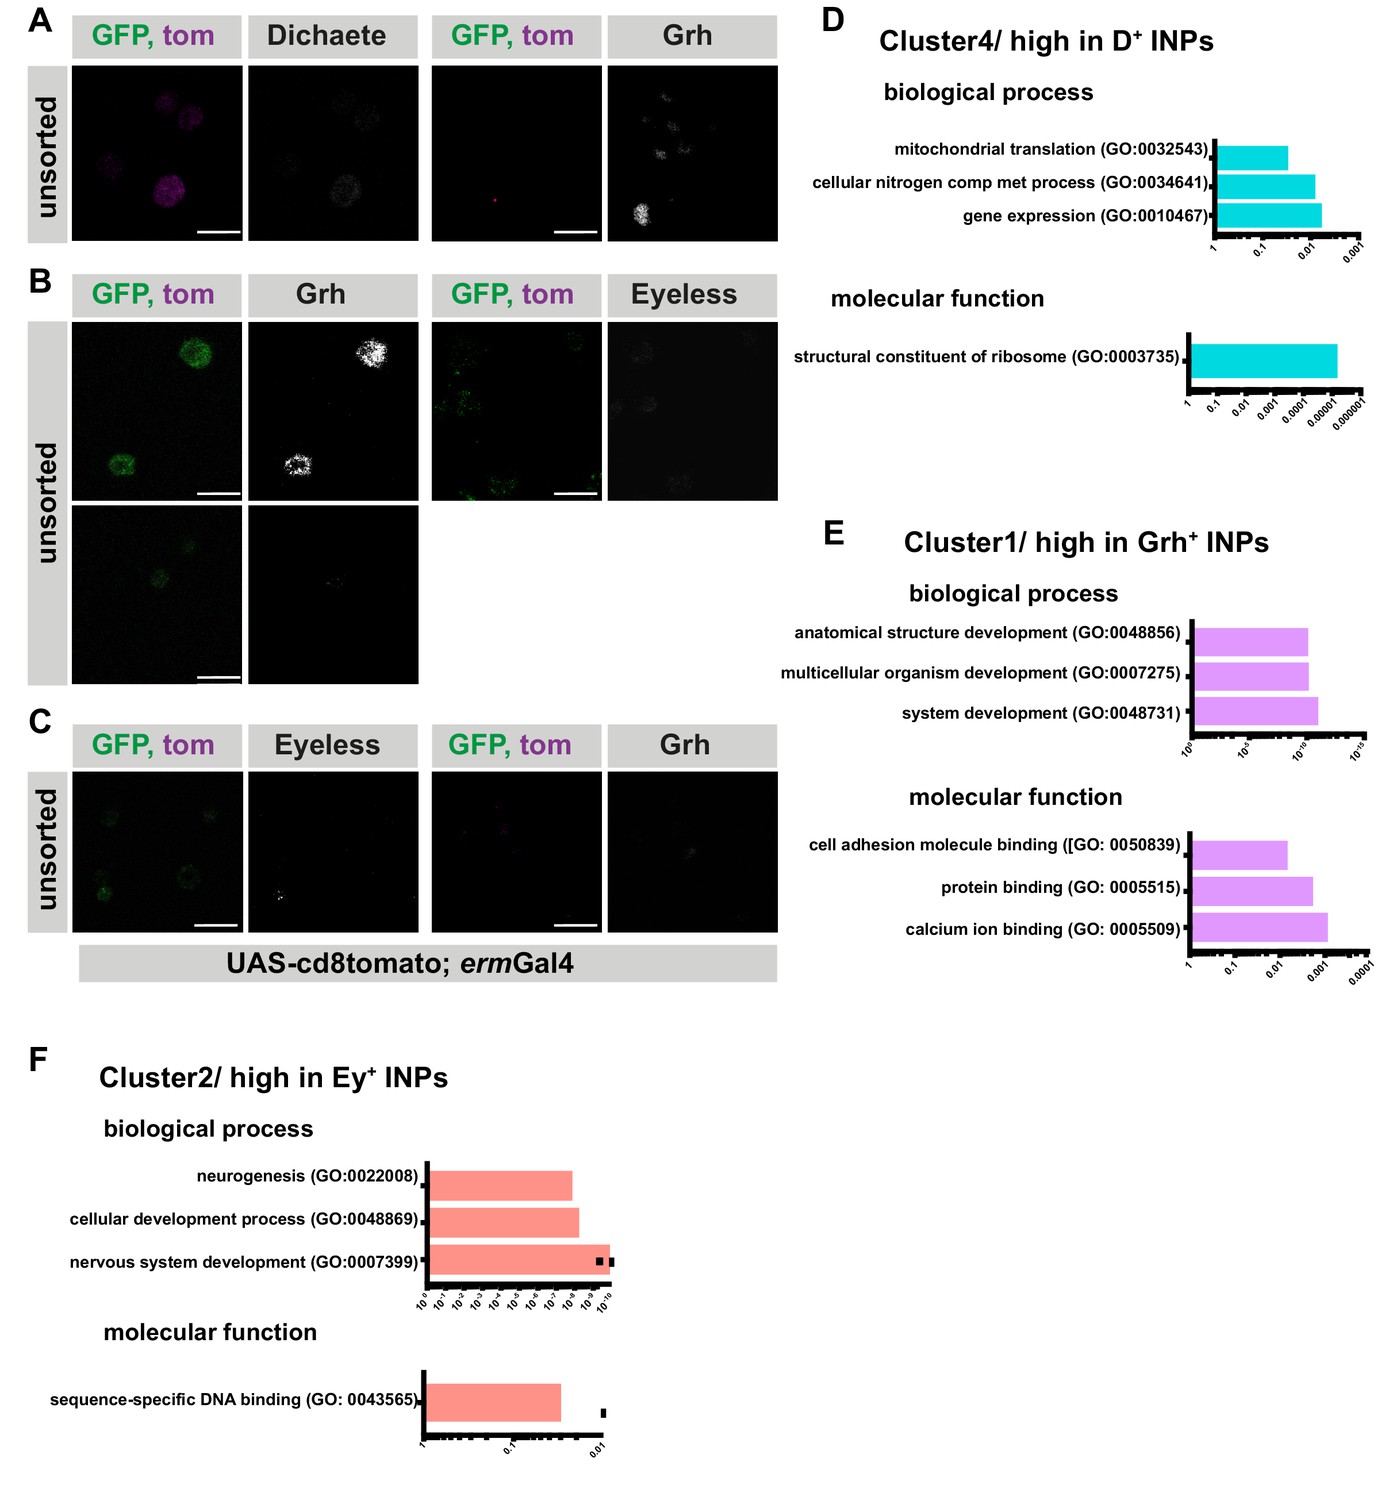
Temporally sorted INPs are pure populations.
(A–C) Immunofluorescence of unsorted controls for Figure 1C–E, scale bar 10 μm, (induced with ermGal4, marked with membrane bound tdTomato). (D–F) GO-term analysis of each cluster found in hierarchical clustering analysis for biological process, and molecular function. The graphs are color-coded with their respective clusters, the top three hits were shown if applicable. Cluster two doesn’t have any GO-term enrichment.
Figure 2 with 2 supplements

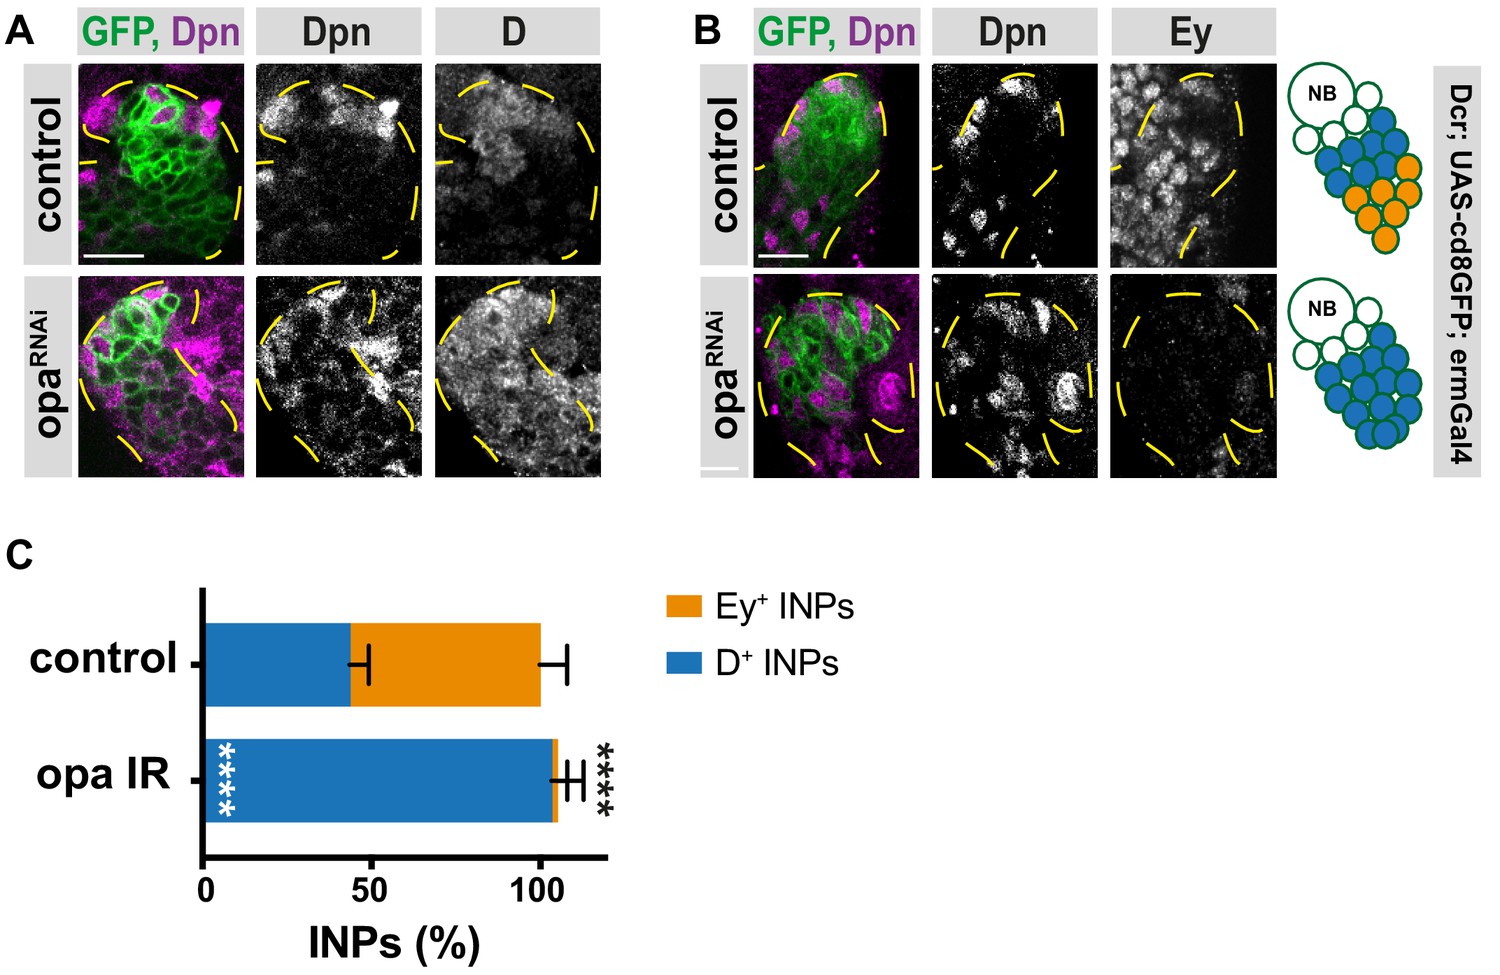
Opa is required for the progression of temporal patterning of INPs.
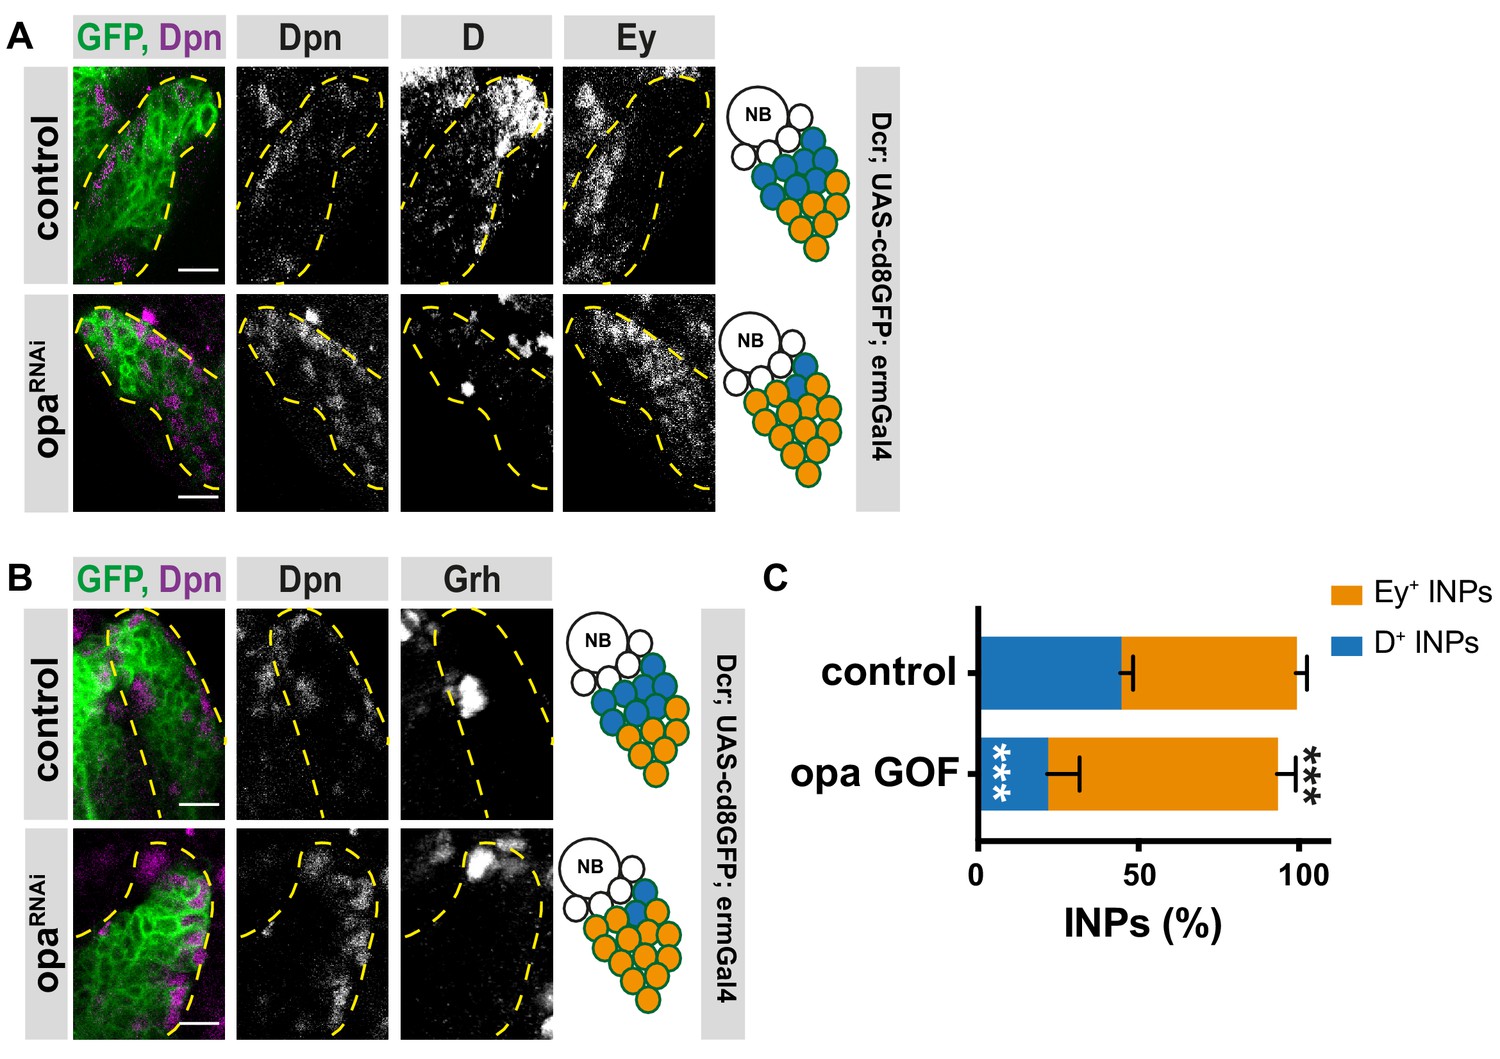
(A) Close-up images of larval brains expressing RNAi against opa in INPs, stained for Dpn and D (induced with ermGal4, marked with membrane bound GFP). Lineages are outlined with yellow dashed line. (B) Close-up images of larval brains expressing RNAi against opa in INPs, stained for Dpn and Grh (induced with ermGal4, marked with membrane bound GFP). Lineages are outlined with yellow dashed line. (C) Close-up images of larval brains expressing RNAi against opa in INPs, stained for Dpn and Ey (induced with ermGal4, marked with membrane bound GFP). Lineages are outlined with yellow dashed line. (D) Quantification of INP numbers in different temporal stages identified by antibody staining of Dpn+, D+ cells, Dpn+, Grh+ cells, and Dpn+, Ey+ cells in control and opa knock-down brains, n = 10, total INP numbers in control were normalized to 100%. Data represent mean ± SD, ***p<=0.001, Student’s t-test (D+ INPs control 12.44 ± 1.42 [n = 10], opa RNAi 34.66 ± 1.02 [n = 12], p<0.001; Grh+ INPs control 8.5 ± 1.32 [n = 10], opa RNAi 0.5 ± 0.65 [n = 12], p<0.001; Ey+ INPs control 13.2 ± 0.98 [n = 10], opa RNAi 0.2 ± 0.4 [n = 10], p<0.001). (E) Control and opa mutant MARCM clones marked by membrane-bound GFP, stained for Dpn, Grh and D after 120 hr of induction. Control clone has D+, Dpn+ INPs followed by Grh+ INPs while opa mutant clone has increased number of D+ INPs and decreased number of Grh+ INPs. (F) Control and opa mutant MARCM clones marked by membrane-bound GFP, stained for Dpn, D and Ey after 120 hr of induction. Opa mutant clone has higher number of D+ INPs and lower number of Ey+ INPs. Scale bar 10 μm in all images.
-
Figure 2—source data 1
Quantification of number of INPs in three different temporal identities between control versus opa-depleted brains with INP-specific driver (Figure 2D).
- https://doi.org/10.7554/eLife.46566.016
Figure 2—figure supplement 1
Opa is required for D repression.
(A–B) Close-up images of larval brains expressing RNAi against opa in type II DM1 lineages, stained for Dpn, D (A), Dpn and Ey (B), lineages are outlined with yellow dashed line, scale bar 10 μm (induced with ermGal4, marked with membrane bound GFP). (C) Quantification of Dpn+, D+, and Dpn+, Ey+ INPs in control and opa knock-down brains, n = 5, total INP numbers in control were normalized to 100%. Data represent mean ± SD, ***p<=0.001, Student’s t-test. (D+ INPs control 11.14 ± 0.55 [n = 7], opa RNAi 26.43 ± 0.92 [n = 7], p<0.001; Ey+ INPs control 14.4 ± 0.92 [n = 5], opa RNAi 0.43 ± 0.29 [n = 7], p<0.001).
-
Figure 2—figure supplement 1—source data 1
Quantification of number of INPs in three different temporal identities between control versus opa-depleted brains with INP-specific driver in DM1 lineages (Figure 2—figure supplement 1C).
- https://doi.org/10.7554/eLife.46566.017
Figure 2—figure supplement 2

Opa regulates the transition from D-to-grh.
(A) Close-up images of larval brains expressing RNAi against opa in type II lineages, stained for Dpn and Ase, lineages outlined with yellow dashed lines, Dpn-/Ase- INPs are marked with white arrowhead, Dpn-/Ase+ INPs are marked with yellow arrowhead, scale bar 10 μm (induced with worGal4, aseGal80, marked with membrane bound GFP). (B–C) Close-up images of larval brains expressing RNAi against opa in type II lineages, stained for Dpn, D and Ey (B), and Grh (C), lineages are outlined with yellow dashed line, scale bar 10 μm (induced with worGal4, aseGal80, marked with membrane bound GFP). (D) Quantification of Dpn+, D+, and Dpn+, Grh+, and Dpn+, Ey+ INPs in control and opa knock-down brains, n = 5, total INP numbers in control were normalized to 100%. Data represent mean ± SD, ***p<=0.001, Student’s t-test. (D+ INPs control 12.6 ± 1.5 [n = 5], opa RNAi 33.3 ± 2.35 [n = 6], p<0.001; Grh+ INPs control 8.8 ± 1.6 [n = 5], opa RNAi 0 [n = 6], p<0.001; Ey+ INPs control 14 ± 0.89 [n = 5], opa RNAi 0.5 ± 0.86 [n = 5], p<0.001). (E) Close-up images of larval brains expressing opa RNAi in INPs, stained for pH3, Mira and aPKC, the crescents of Mira staining are marked with white arrowhead, and the crescents of aPKC staining are marked with yellow arrowhead, scale bar 10 μm, (induced with ermGal4, marked with membrane bound GFP).
-
Figure 2—figure supplement 2—source data 2
Quantification of number of INPs in three different temporal identities between control versus opa-depleted brains with type II-specific driver (Figure 2—figure supplement 2D).
- https://doi.org/10.7554/eLife.46566.018
Figure 3
opa is an important factor for the generation of both early and late-born INP progeny and contributes to adult brain central complex.
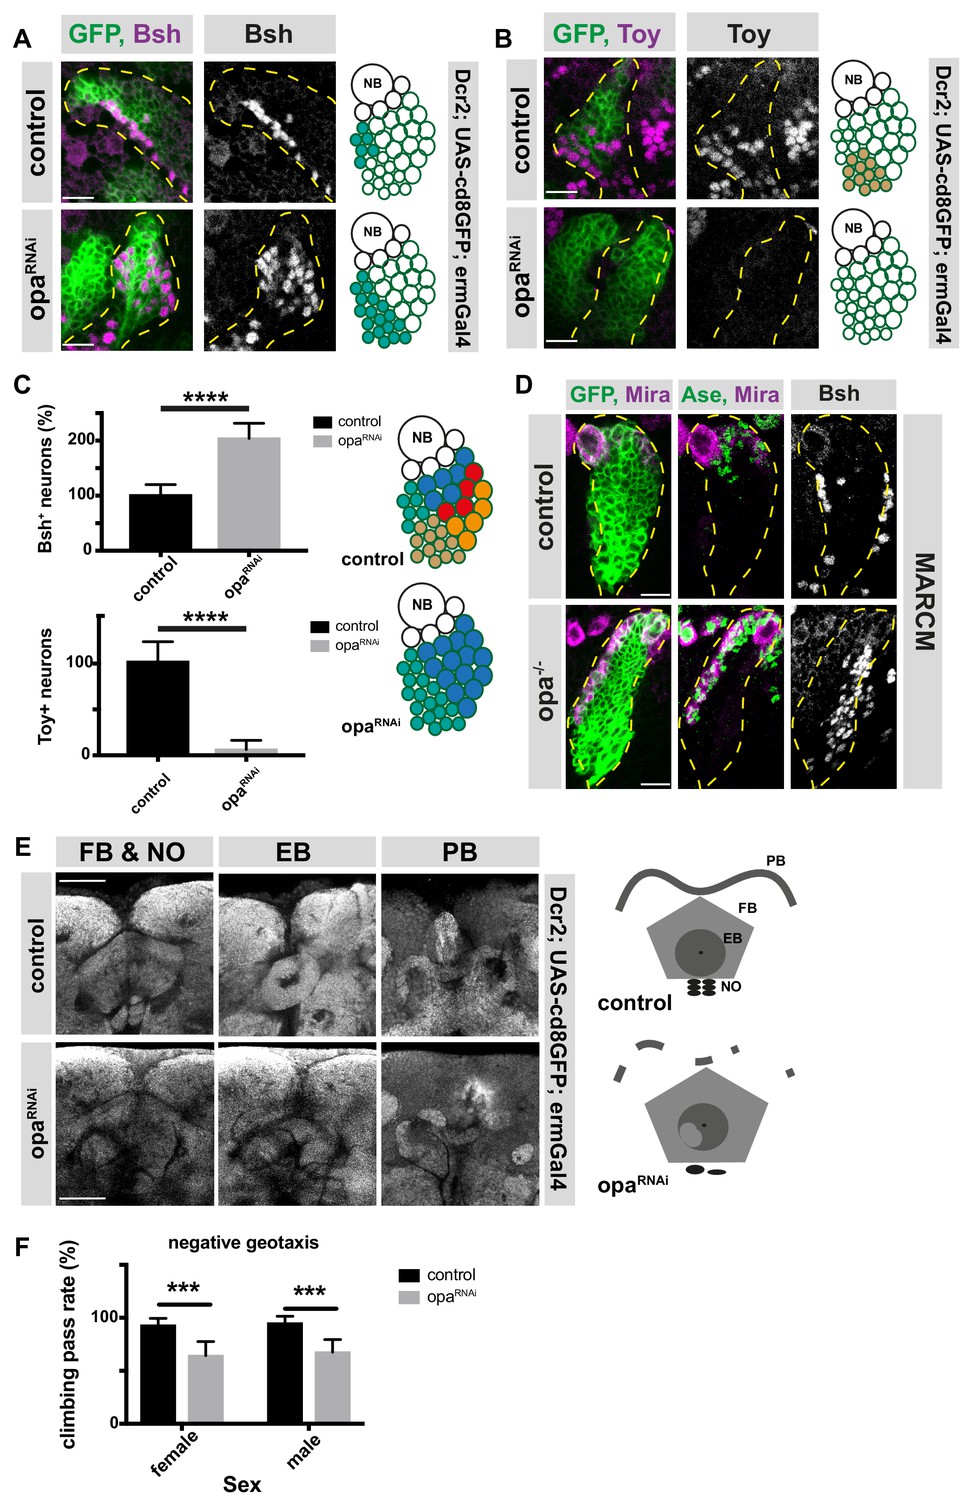
(A–B) Close-up images of larval brains expressing RNAi against opa in INPs, immunofluorescence for Bsh (A), and Toy (B) neuronal markers, scale bar 10 μm, lineages are outlined with yellow dashed line (induced with ermGal4, marked with membrane bound GFP). (C) Quantification of Bsh+ and Toy+ neurons in control and opa knock-down brains, n = 11, total Bsh+ or Toy+ neuron numbers in control were normalized to 100%. Data represent mean ± SD, ***p<=0.001, Student’s t-test. (D) Control and opa mutant MARCM clone marked by membrane-bound GFP, stained with Mira, Ase, and Bsh antibodies after 120 hr of induction. The clones are marked with yellow dashed line, scale bar 10 μm. (E) Close-up images of adult central complex, composed of fan-shaped body (FB), noduli (NO), ellipsoid body (EB), and protocerebral bridge (PB) of control and opa knock-down brains, stained with Bruchpilot antibody (gray) (induced with ermGal4) scale bar 50 μm. (F) Negative geotaxis assay with control and opa RNAi expressing flies (induced with ermGal4, marked with membrane bound GFP). For each genotype n = 10 replicates, each consisting of 10 adult female or male adults. Data are mean ± SD, ***p<0.001, Student’s t-test.
-
Figure 3—source data 1
Quantification of Bsh+ or Toy+ neuron numbers in control versus opa-depleted brains with INP-specific driver (Figure 3C).
- https://doi.org/10.7554/eLife.46566.020
-
Figure 3—source data 2
Quantification of the percentage pass rate of flies with control versus opa-depleted brains (Figure 3F).
- https://doi.org/10.7554/eLife.46566.021
Figure 4 with 3 supplements
Osa initiates D expression before initiating Opa.
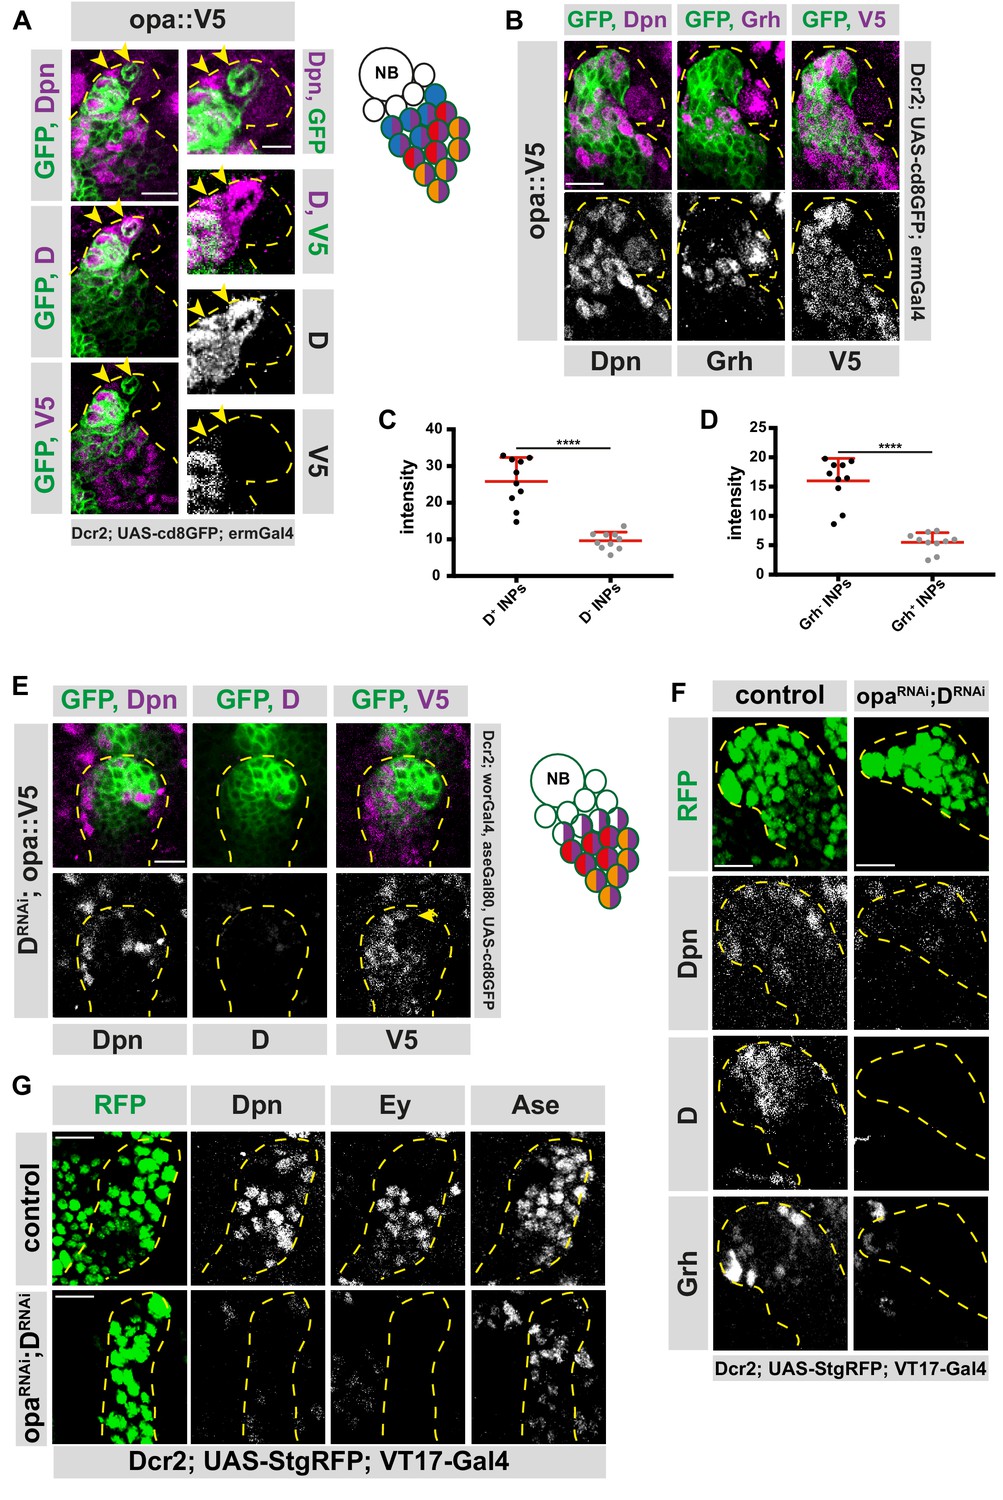
(A) Close-up images of fly brains endogenously expressing V5-tagged opa in INPs, stained for V5, Dpn and D. D+, V5- cell is marked with arrows, lineages are outlined with yellow dashed line, scale bar 10 μm and 5 μm, (induced with ermGal4, marked with membrane bound GFP). (B) Close-up images of fly brains endogenously expressing V5-tagged opa in INPs, stained for V5, Dpn and Grh, lineages are outlined with yellow dashed line, scale bar 10 μm, (induced with ermGal4, marked with membrane bound GFP). (C) Quantifications of opa::V5-signal intensity measurements of D+ vs D- INPs, n = 10, normalized to background intensity. Data represent mean ± SD, ***p<=0.001, Student’s t-test. (D) Quantifications of opa::V5-signal intensity measurements of Grh+ vs Grh- INPs, n = 10, normalized to background intensity. Data represent mean ± SD, ***p<=0.001, Student’s t-test. (E) Close-up images of fly brains endogenously expressing V5-tagged opa and RNAi for D in type II lineages, stained for V5, Dpn and D, lineages are outlined with yellow dashed line, scale bar 10 μm, (induced with worGal4, aseGal80, marked with membrane bound GFP). (F–G) Close up images of control versus opa and D double knock-down brains in type II lineages, stained with Dpn, D and Grh (C), or for Dpn, Ey and Ase (C) antibodies, lineages are outlined with yellow dashed lines, scale bar 10 μm, (induced with Dcr2; UAS-StgRFP; VT17-Gal4, marked with nuclear RFP).
-
Figure 4—source data 1
Quantification of intensity measurements of opa::V5 signal in D+ versus D- INPs in wild-type brains (Figure 4C).
- https://doi.org/10.7554/eLife.46566.026
-
Figure 4—source data 2
Quantification of intensity measurements of opa::V5 signal in Grh+ versus Grh- INPs in wild-type brains (Figure 4C).
- https://doi.org/10.7554/eLife.46566.027
Figure 4—figure supplement 1
Opa is expressed in type II lineages.
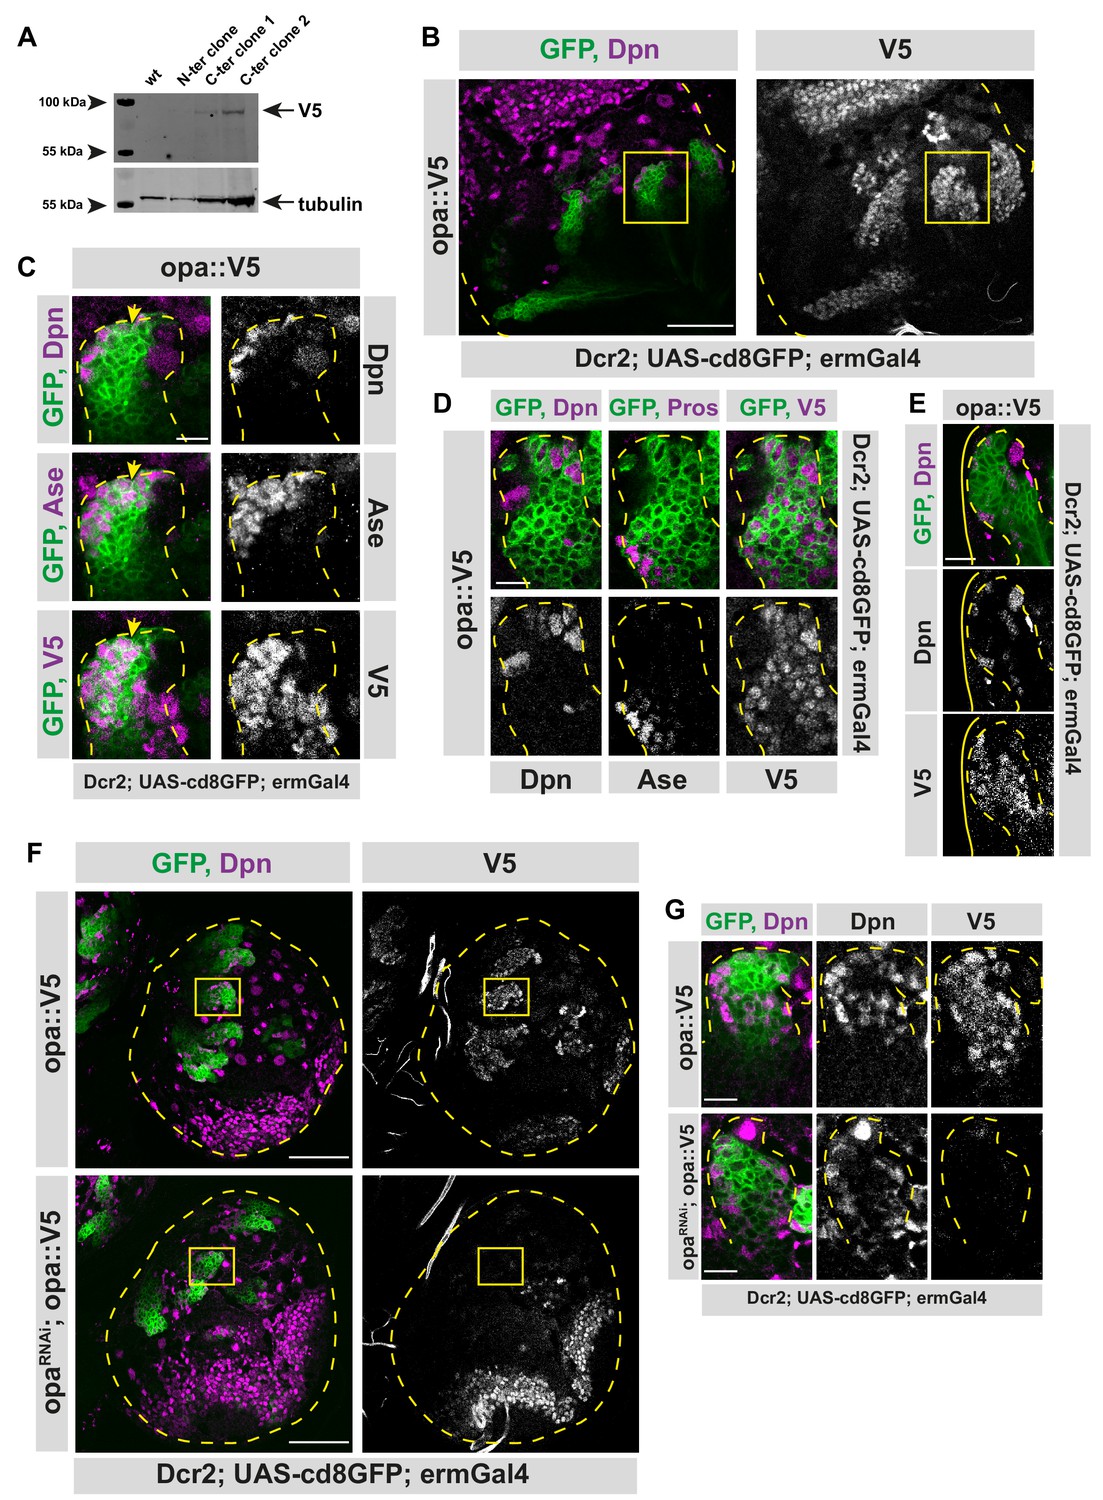
(A) Western blot confirmation of opa::V5 expressing flies. Wild-type embryos were used as control, three different clones were tested: two C-terminus tagged embryos and one N-terminus tagged embryos were used. Alpha-tubulin is used as loading control while V5 antibody was used for opa::V5 tag. (B) Opa is expressed in type II lineages. Overview image of brain lobe expressing endogenously V5-tagged opa, stained for Dpn and V5 antibodies, lobes are outlined with yellow dashed lines, scale bar 50 μm, (induced with ermGal4, marked with membrane bound GFP). (C) Close-up images of (B) marked with yellow square, stained for Dpn, Ase, and V5 antibodies. Type II lineage is outlined with yellow dashed lines, scale bar 10 μm, (induced with ermGal4, marked with membrane bound GFP). Yellow arrow is marking the start of opa expression. (D) Close-up images of brain lobes expressing endogenously V5-tagged opa, stained for Dpn, Prospero and V5 antibodies, lineages are outlined with yellow dashed lines, scale bar 10 μm, (induced with ermGal4, marked with membrane bound GFP). (E) Close-up images of DM1 lineage expressing endogenously V5-tagged opa, stained for Dpn and V5 antibodies, lineage is outlined with yellow dashed lines, while the brain lobe is outlined with yellow line (DM1 lineages can be deduced from their localization in the brain lobe), scale bar 10 μm, (induced with ermGal4, marked with membrane bound GFP). (F) Overview images of brain lobes expressing opa-V5 alone or along with opa RNAi in type II lineages, stained for Dpn and V5 antibodies, lobes are outlined with yellow dashed lines, scale bar 50 μm, (induced with worGal4, aseGal80, marked with membrane bound GFP). (G) Close up images of (F) marked with yellow square, stained with Dpn and V5 antibodies. Type II lineages are outlined with yellow dashed lines, scale bar 10 μm, (induced with worGal4, aseGal80, marked with membrane bound GFP).
Figure 4—figure supplement 2
Osa initiates the expression of opa in INPs.
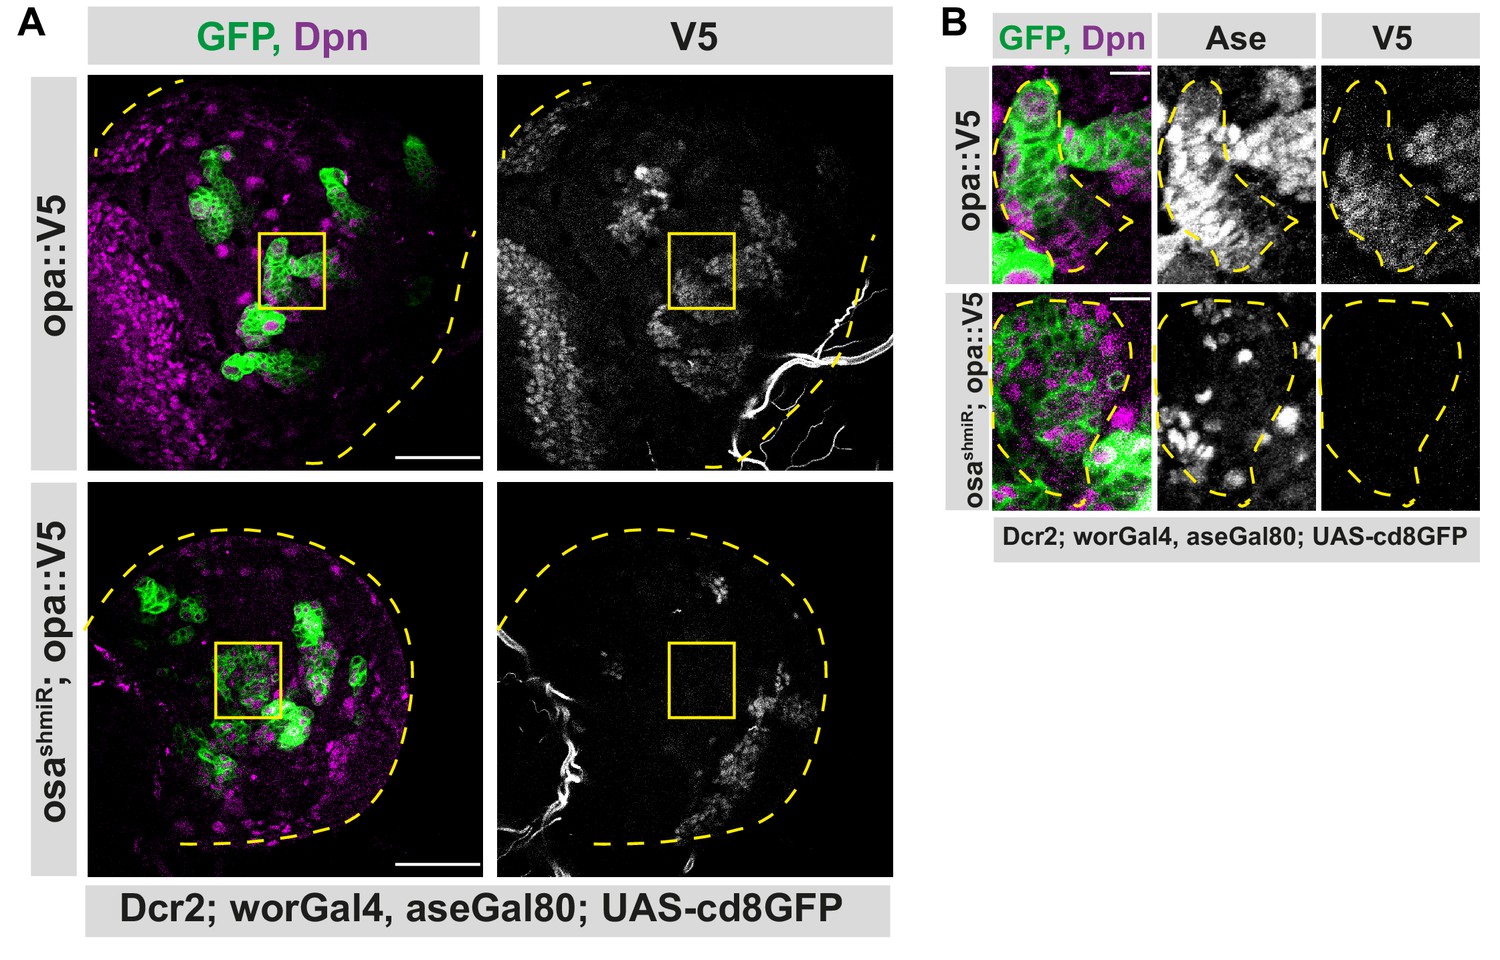
(A) Opa is induced directly by Osa. Overview images of brain lobes expressing opa-V5 alone or along with osa shmiR in type II lineages, stained for Dpn and V5 antibodies, lobes are outlined with yellow dashed lines, scale bar 50 μm, (induced with worGal4, aseGal80, marked with membrane bound GFP). Osa knock-down causes the loss of V5 expression in type II lineages. (B) Close-up images of (A) marked with yellow square, stained with Dpn, V5 and Ase antibodies. Type II lineage is outlined with yellow dashed lines, scale bar 10 μm, (induced with worGal4, aseGal80, marked with membrane bound GFP). Knock-down of Osa causes higher numbers of Dpn+ cells which are V5-.
Figure 4—figure supplement 3
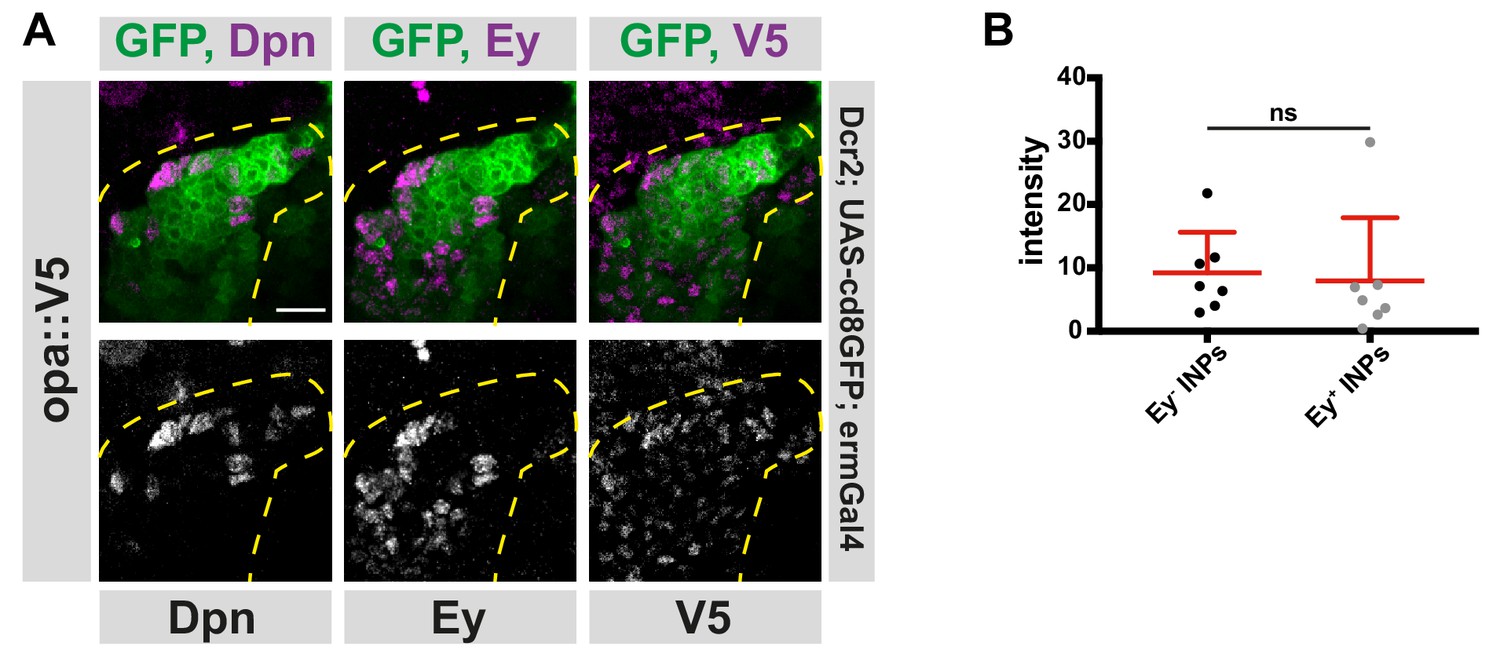
Different temporal states have different opa levels.
(A) Close-up images of fly brains endogenously expressing V5-tagged opa in INPs, stained for V5, Dpn and Ey. Lineages are outlined with yellow dashed line, scale bar 10 μm, (induced with ermGal4, marked with membrane bound GFP). (B) Quantifications of opa::V5-signal intensity measurements of Ey+ vs Ey- INPs, n = 7, normalized to background intensity. Data represent mean ± SD, not significant, Student’s t-test.
-
Figure 4—figure supplement 3—source data 1
Quantification of intensity measurements of opa::V5 signal in Ey+ versus Ey- INPs in wild-type brains (Figure 4—figure supplement 3B).
- https://doi.org/10.7554/eLife.46566.028
Figure 5 with 2 supplements
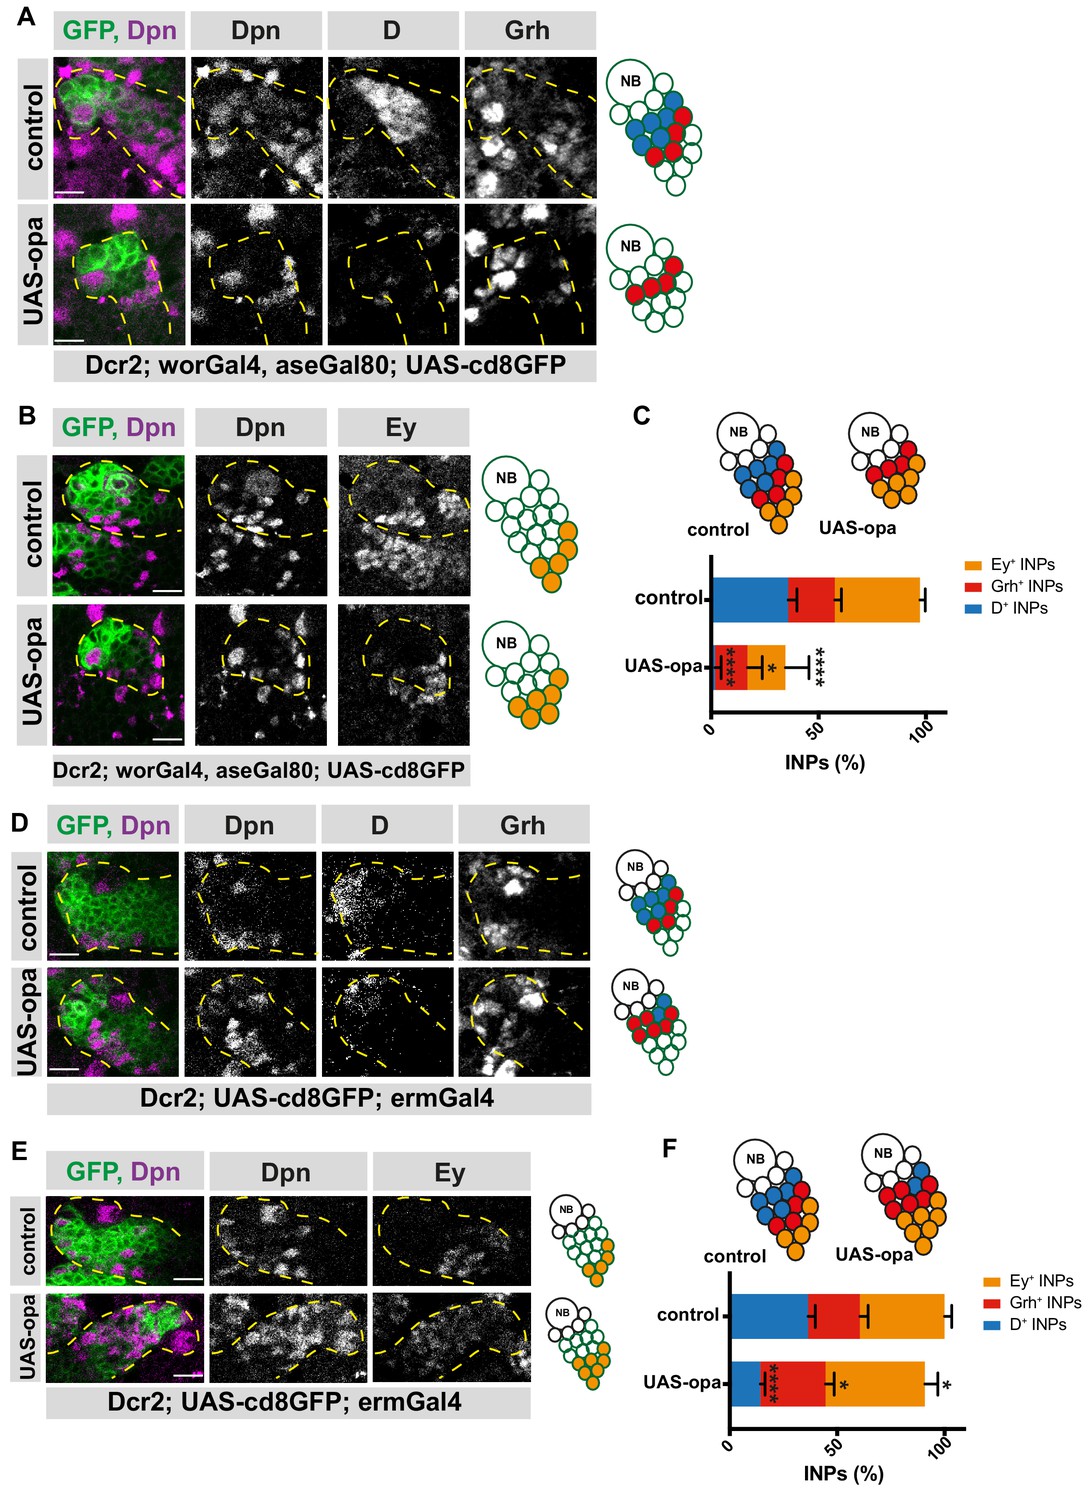
Opa overexpression results in the loss of D+INPs.
(A) Close-up images of control and opa overexpressing brains in type II lineages, stained for Dpn, D and Grh antibodies, lineages are outlined with yellow dashed lines, scale bar 10 μm, (induced with worGal4, aseGal80, marked with membrane bound GFP). Overexpression of opa in type II lineages causes the loss of D+ INPs. (B) Close-up images of control and opa overexpressing brains in type II lineages, stained for Dpn, and Ey antibodies, lineages are outlined with yellow dashed lines, scale bar 10 μm, (induced with worGal4, aseGal80, marked with membrane bound GFP). (C) Quantification of D+, Grh+ and Ey+ INPs in control and opa overexpressing brains, n = 10, total INP numbers in control were normalized to 100%. Data represent mean ± SD, p<=0.05, ***p<=0.001, Student’s t-test (D+ INPs control 12.18 ± 1.33 [n = 10], opa GOF 0.4 ± 0.6 [n = 10], p<0.001; Grh+ INPs control 7.38 ± 1 [n = 10], opa GOF 5.12 ± 2.20 [n = 10], p<0.05; Ey+ INPs control 13.5 ± 0.76 [n = 10], opa GOF 6 ± 3.5 [n = 10], p<0.001). (D) Close-up images of control and opa overexpressing brains in INPs, stained for Dpn, and Ey, lineages are outlined with yellow dashed lines, scale bar 10 μm, (induced with ermGal4, marked with membrane bound GFP). (E) Close-up images of control and opa overexpressing brains in INPs, stained for Dpn, D and Grh, lineages are outlined with yellow dashed lines, scale bar 10 μm, (induced with ermGal4, marked with membrane bound GFP). (F) Quantification of D+, Grh+ and Ey+ INPs in control and opa overexpressing brains, n = 5, total INP numbers in control were normalized to 100%. Data represent mean ± SD, *p<=0.05, ***p<0.001, Student’s t-test (D+ INPs control 12.4 ± 1.01 [n = 5], opa GOF 4.83 ± 0.68 [n = 5], p<0.0001; Grh+ INPs control 8.2 ± 1.16 [n = 5], opa GOF 10.33 ± 1.24 [n = 5], p<0.05; Ey+ INPs control 13.4 ± 1.01 [n = 5], opa GOF 15.71 ± 1.9 [n = 5], p<0.05).
-
Figure 5—source data 1
Quantification of number of INPs in three different temporal identities between control versus opa-overexpressed brains with type II-specific driver (Figure 5C).
- https://doi.org/10.7554/eLife.46566.032
-
Figure 5—source data 2
Quantification of number of INPs in three different temporal identities between control versus opa-overexpressed brains with INP-specific driver (Figure 5F).
- https://doi.org/10.7554/eLife.46566.033
Figure 5—figure supplement 1
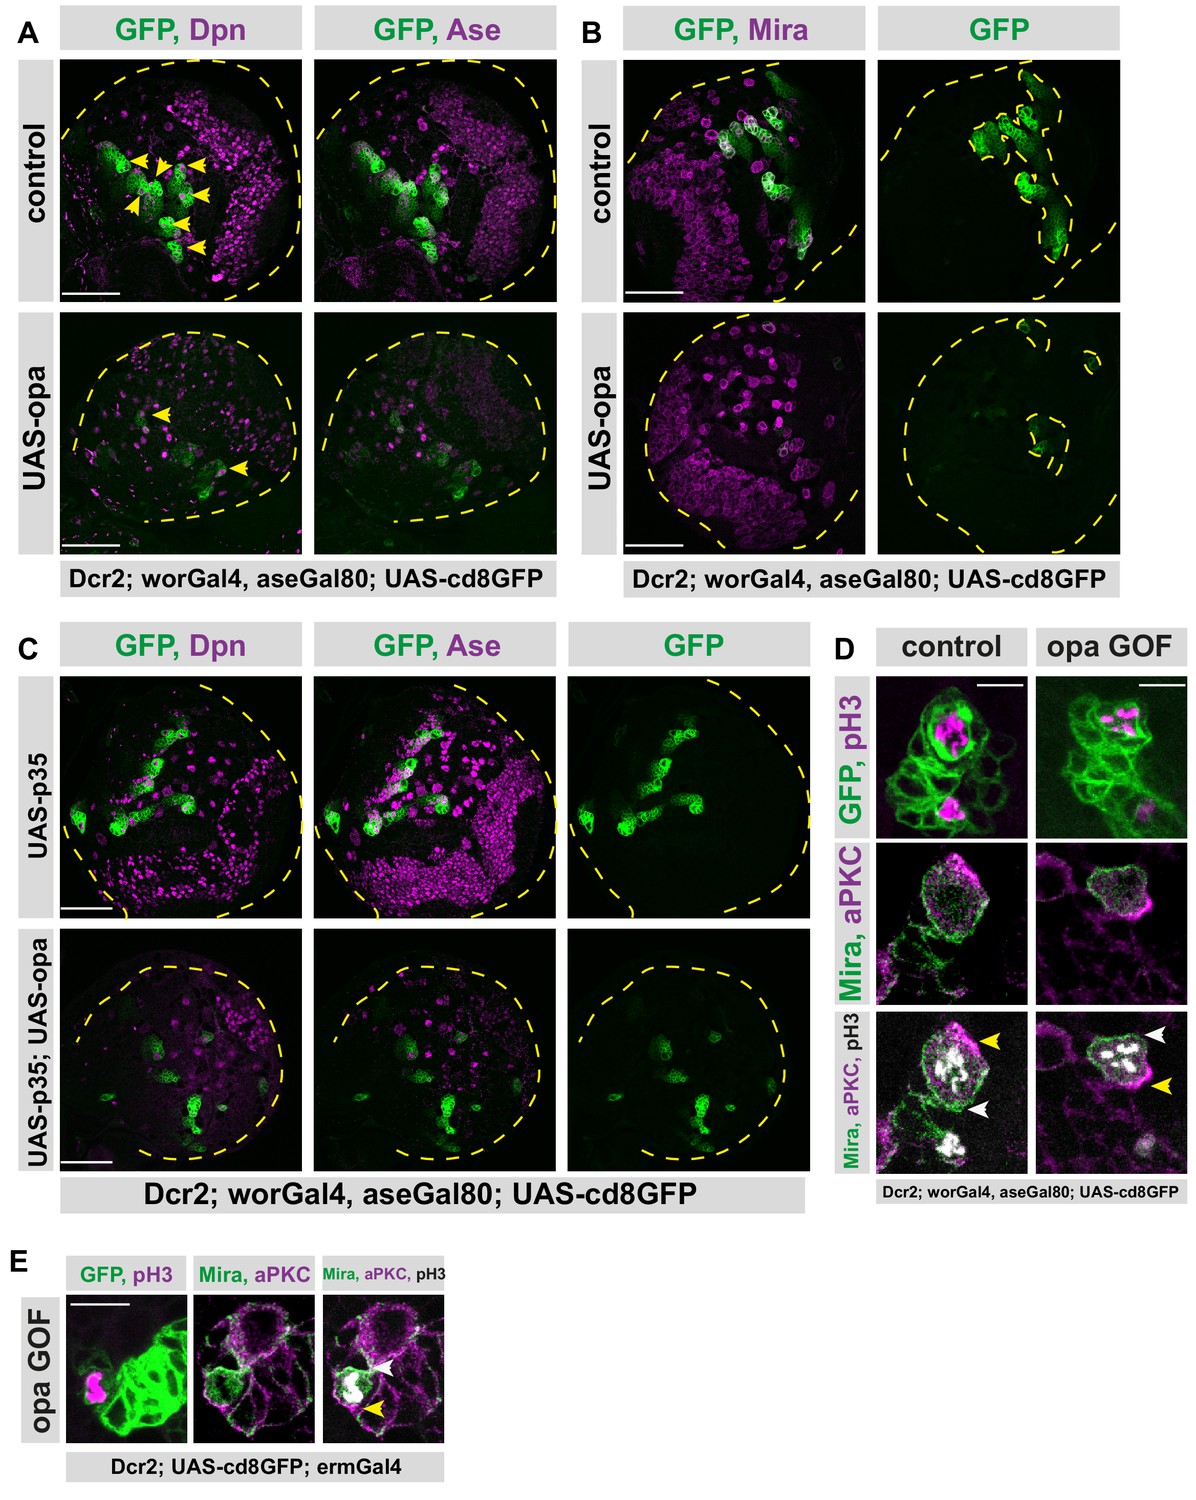
Opa overexpression causes shorter type II lineages.
(A) Overview images of brain lobes, control or type II lineage-specific opa overexpression, stained for Dpn, and Ase antibodies, lobes are outlined with yellow dashed lines, yellow arrowheads mark Dpn positive type II NB lineages, one lineage is invisible in this z-plane, scale bar 50 μm, (induced with worGal4, aseGal80, marked with membrane bound GFP). (B) Overview images of brain lobes, control or type II lineage-specific opa overexpression, stained for Mira antibody, lobes and type II lineages are outlined with yellow dashed lines, scale bar 50 μm, (induced with worGal4, aseGal80, marked with membrane bound GFP). (C) Overexpression of apoptosis inhibitor p35 in type II lineages is not sufficient to prevent type II lineage loss upon opa overexpression. Overview images of brain lobes overexpressing opa alone and together with p35, stained for Dpn and Ase antibodies, lobes are outlined with yellow dashed lines, scale bar 50 μm, (induced with worGal4, aseGal80, marked with membrane bound GFP). (D) Close-up images of control and opa overexpressing type II NBs stained for pH3, Mira and aPKC, scale bar 10 μm, the crescents of Mira staining are marked with white arrowhead, and the crescents of aPKC staining are marked with yellow arrowhead, (induced with worGal4, aseGal80, marked with membrane bound GFP). (E) Close-up images of larval brains overexpressing opa in INPs, stained for pH3, Mira and aPKC, the crescents of Mira staining are marked with white arrowhead, and the crescents of aPKC staining are marked with yellow arrowhead, scale bar 10 μm, control is in Figure 2—figure supplement 2E (induced with ermGal4, marked with membrane bound GFP).
Figure 5—figure supplement 2
Opa overexpression causes loss of D+INPs in DM1 lineages.
(A–B) Close-up images of larval brains overexpressing opa in type II DM1 lineages, stained for Dpn, D and Ey (A), and Dpn and Grh (B), lineages are outlined with yellow dashed line, scale bar 10 μm (induced with ermGal4, marked with membrane bound GFP). (C) Quantification of Dpn+, D+, and Dpn+, Ey+ INPs in control and opa gain-of-function brains, n = 6, total INP numbers in control were normalized to 100%. Data represent mean ± SD, ***p<=0.001, Student’s t-test. (D+ INPs control 11.33 ± 0.42 [n = 6], opa GOF 5.5 ± 1.05 [n = 6], p<0.001; Ey+ INPs control 14 ± 0.36 [n = 6], opa GOF 18.33 ± 0.61 [n = 6], p<0.001).
-
Figure 5—figure supplement 2—source data 1
Quantification of number of INPs in three different temporal identities between control versus opa-overexpressed brains with INP-specific driver in DM1 lineages (Figure 5—figure supplement 2C).
- https://doi.org/10.7554/eLife.46566.034
Figure 6 with 1 supplement

Opa and hamlet are required for INP temporal patterning and correct lineage progression.
(A–B) Overview images of brain lobes expressing RNAi against opa and ham in INPs and their close-up images (marked with yellow squares), stained for Dpn, D and Ey (A), or Dpn and Grh (B) antibodies, lineages and lobes are outlined with yellow dashed lines, scale bar 50 μm for brain lobes, 10 μm for zoomed images, (induced with ermGal4, marked with membrane bound GFP). (C) Model depicting the genetic interactions between temporal switch genes (opa and hamlet), and temporal identity genes (D, Grh, and Ey).
Figure 6—figure supplement 1

Opa and hamlet cannot recapitulate Osa knock-down phenotype.
(A) Overview images of opa and ham RNAi expressing brains in type II lineages are stained for Dpn and Ase antibodies, brain lobes are outlined with yellow dashed lines, yellow arrowheads mark lineages with overproliferation, scale bar 50 μm, (induced with ermGal4, marked with membrane bound GFP). (B) Overview images of osa RNAi, and opa/ham double RNAi expressing brains in type II lineages are stained for Dpn and Ase antibodies, brain lobes are outlined with yellow dashed lines, scale bar 50 μm, (induced with worGal4, aseGal80, marked with membrane bound GFP).
Tables
Key resources table
| Reagent type (species) or resource | Designation | Source or reference | Identifiers | Additional information |
|---|---|---|---|---|
| Gene (Drosophila melanogaster) | osa | NA | FBgn0261885 | |
| Gene (D. melanogaster) | Dichaete | NA | FBgn0000411 | |
| Gene (D. melanogaster) | Grainyhead | NA | FBgn0259211 | |
| Gene (D. melanogaster) | Eyeless | NA | FBgn0259211 | |
| Gene (D. melanogaster) | Hamlet | NA | FBgn0045852 | |
| Gene (D. melanogaster) | Odd-paired | NA | FBgn0003002 | |
| Genetic reagent (D. melanogaster) | UAS-CD8::GFP; ermGAL4 | PMID:18621688 and 20152183 | ||
| Genetic reagent (D. melanogaster) | UAS-CD8::tdTomato; ermGAL4 | PMID:18621688 and 20152183 | ||
| Genetic reagent (D. melanogaster) | UAS-dcr2; wor-GAL4, aseGAL80; UAS-CD8::GFP | PMID:21549331 | ||
| Genetic reagent (D. melanogaster) | VT17-GAL4 | Vienna Drosophila RNAi Center | 212057, discarded | |
| Genetic reagent (D. melanogaster) | UAS-stinger::RFP | PMID:11056799 | ||
| Genetic reagent (D. melanogaster) | UAS-opaRNAi | Vienna Drosophila RNAi Center | 101531 | |
| Genetic reagent (D. melanogaster) | UAS-DRNAi | Vienna Drosophila RNAi Center | 49549 and 107194 | |
| Genetic reagent (D. melanogaster) | UAS-mcherryshmiR | Bloomington Drosophila Stock Center | 35785 | |
| Genetic reagent (D. melanogaster) | UAS-osaRNAi | Vienna Drosophila RNAi Center | 7810 | |
| Genetic reagent (D. melanogaster) | UAS-hamshmiR | Bloomington Drosophila Stock Center | 32470 | |
| Genetic reagent (D. melanogaster) | UAS-osashmiR | PMID:2460726 | ||
| Genetic reagent (D. melanogaster) | UAS-p35 | PMID:7925015 | ||
| Genetic reagent (D. melanogaster) | UAS-opa | PMID:17329368 | ||
| Genetic reagent (D. melanogaster) | D::GFP | this paper | endogenously GFP-tagged D in C-terminus | |
| Genetic reagent (D. melanogaster) | Grh-GFP | Bloomington Drosophila Stock Center | 42272 | |
| Genetic reagent (D. melanogaster) | Ey-GFP | Bloomington Drosophila Stock Center | 42271 | |
| Genetic reagent (D. melanogaster) | opa::V5 | this paper | endogenously V5-tagged opa in C-terminus | |
| Genetic reagent (D. melanogaster) | FRT82B, opa7 | PMID:17329368 | ||
| Genetic reagent (D. melanogaster) | elavGal4 (C155) | PMID:10197526 | ||
| Genetic reagent (D. melanogaster) | actCas9 | Bloomington Drosophila Stock Center | 54590 | |
| Genetic reagent (D. melanogaster) | hsCre | Bloomington Drosophila Stock Center | 851 | |
| Antibody | anti-Deadpan (guinea pig, polyclonal) | PMID:2460726 | (1:1000) | |
| Antibody | anti-Asense (rat, polyclonal) | PMID:2460726 | (1:500) | |
| Antibody | anti-Miranda (guinea pig, polyclonal) | PMID:2460726 | (1:500) | |
| Antibody | anti-Grainyhead (rat, polyclonal) | PMID:19945380 | (1:1000) | |
| Antibody | anti-Dichaete (rabbit, polyclonal) | gift from Steve Russell | (1:1000) | |
| Antibody | anti-Eyeless (mouse, monoclonal) | Developmental Studies Hybridoma Bank | anti-eyeless | (1:50), RRID:AB_2253542 |
| Antibody | anti-Toy (guinea pig, polyclonal) | gift from Uwe Walldorf | (1:500) | |
| Antibody | anti-Bsh (guinea pig, polyclonal) | gift from Makoto Sato, PMID:21303851 | (1:500), RRID:AB_2567934 | |
| Antibody | anti-V5 (mouse, monoclonal) | Sigma Aldrich | V8012 | (1:500 IF, 1:1000 WB), RRID:AB_261888 |
| Antibody | anti-Bruchpilot nc82 (mouse, monoclonal) | Developmental Studies Hybridoma Bank | nc82 | (1:10), RRID:AB_2314866 |
| Antibody | anti-V5 IgG2a (mouse, monoclonal) | Thermo Fisher Scientific | R960-25 | (1:500), RRID:AB_2556564 |
| Antibody | anti-V5 (rabbit, polyclonal) | Abcam | ab9116 | (1:500), RRID:AB_307024 |
| Antibody | anti-Prospero (mouse, monoclonal) | Developmental Studies Hybridoma Bank | MR1A | (1:20), RRID:AB_528440 |
| Antibody | anti-pH3(Ser10) (mouse, monoclonal) | Cell Signaling Technologies | 9706S | (1:1000), RRID:AB_331748 |
| Antibody | anti-aPKC (rabbit, polyclonal) | Santa Cruz Biotechnologies | sc-216 | (1:500), RRID:AB_2300359 |
| Antibody | anti-alpha tubulin (mouse, monoclonal) | Sigma Aldrich | T6199 | (1:10000), RRID:AB_477583 |
| Antibody | Alexa 405, 568, 647 | Invitrogen | Alexa Fluor dyes | (1:500) |
| Antibody | IRDye 700, 800 | LI-COR | IRDye | (1:15000) |
| Software, algorithm | Prism 7 | GraphPad Software | ||
| Software, algorithm | BWA | PMID:19451168 | RRID:SCR_010910 | |
| Software, algorithm | TopHat | PMID:19289445 | RRID:SCR_013035 | |
| Software, algorithm | HTSeq | PMID:25260700 | RRID:SCR_005514 | |
| Software, algorithm | DESeq2 (v1.12.4) | PMID:25516281 | RRID:SCR_016533 | |
| Software, algorithm | bedtools (v2.26.0) | PMID:20110278 | RRID:SCR_006646 | |
| Commercial assay | TRIzol LS | Ambion | 10296010 | |
| Commercial assay | Agencourt AMPure XP beads | Beckman Coulter | A63880 | |
| Commercial assay | Nextera DNA Library Prep Kit | Illumina | FC-121–1031 | |
| Recombinant DNA reagent | pU6-Bbsl-chiRNA | PMID:23709638 | ||
| Other | Rinaldini solution | PMID:22884370 |
Additional files
-
Supplementary file 1
List of genes that are dynamically changing between INP populations with higher expression in D+ and Ey+ INPs.
- https://doi.org/10.7554/eLife.46566.037
-
Supplementary file 2
List of genes that are dynamically changing between INP populations with highest expression in Grh+ INPs.
- https://doi.org/10.7554/eLife.46566.038
-
Transparent reporting form
- https://doi.org/10.7554/eLife.46566.039
Download links
A two-part list of links to download the article, or parts of the article, in various formats.
Downloads (link to download the article as PDF)
Open citations (links to open the citations from this article in various online reference manager services)
Cite this article (links to download the citations from this article in formats compatible with various reference manager tools)
The transcription factor odd-paired regulates temporal identity in transit-amplifying neural progenitors via an incoherent feed-forward loop
eLife 8:e46566.
https://doi.org/10.7554/eLife.46566


