Ceapins block the unfolded protein response sensor ATF6α by inducing a neomorphic inter-organelle tether
- University of California, San Francisco, United States
- Howard Hughes Medical Institute, University of California, San Francisco, United States
- Vanderbilt University, United States
- Chan Zuckerberg Biohub, United States
Figures
Figure 1 with 2 supplements
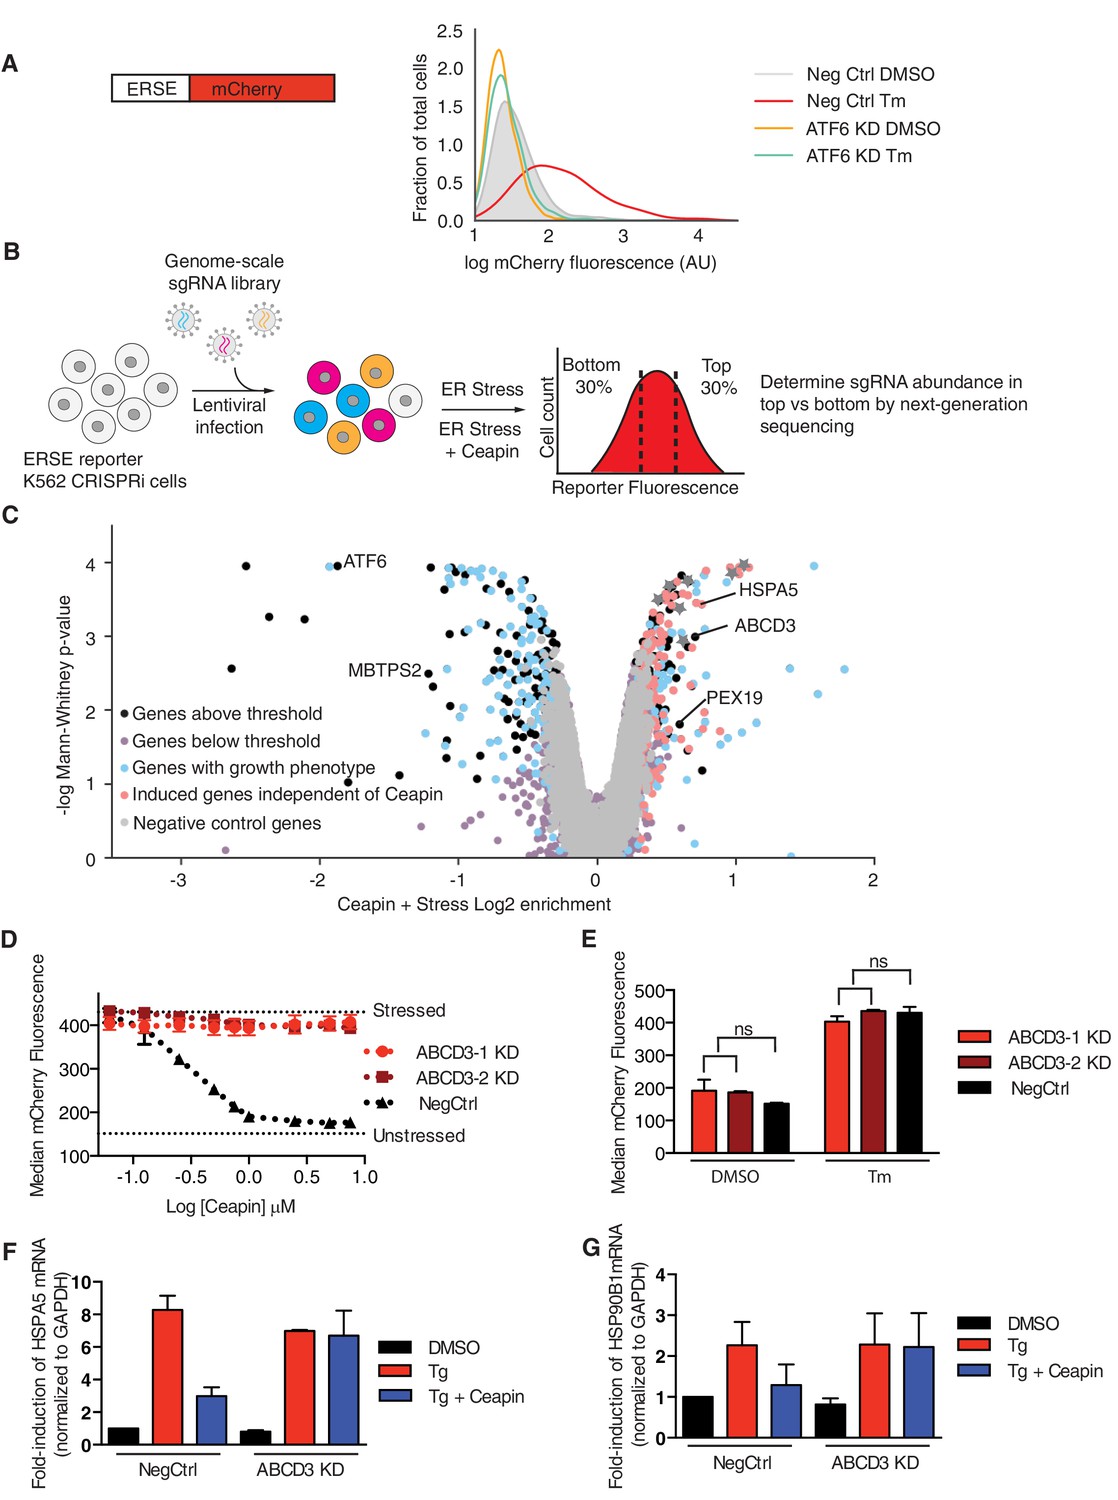
ABCD3 KD desensitizes cells to Ceapin-A7.
(A) Schematic of the ER stress element (ERSE) reporter cassette. K562 ERSE reporter cells were transduced with the indicated sgRNAs and treated with vehicle (DMSO) or tunicamycin (Tm) (6 μg/ml) for 16 hr. (B) Schematic of the CRISPRi screen to identify the target of Ceapin. K562 cells expressing the ERSE reporter were transduced with the sgRNA library. The population was then divided into two subpopulations, which were treated with Tm or Tm plus Ceapin-A7 at EC90 (3 μM) for 16 hr. Cells in the top and bottom thirds of mCherry fluorescence of each subpopulation (Tm-treatment and Tm + Ceapin-treatment) were collected by FACS and processed to measure the frequencies of sgRNAs contained within each. (C) Volcano plot of gene-reporter phenotypes and p values from CRISPRi screen. Negative control sgRNA targeted genes (gray), Ceapin-independent genes (red), genes with growth phenotypes (blue), and Ceapin hits (black) are indicated. (*) denotes chromatin architecture and remodeling related genes that impact reporter transcription. The reporter phenotypes and p values for genes in CRISPRi screen are listed in Figure 1—source data 1. (D) K562 ERSE reporter cells with individual ABCD3 sgRNAs or control sgRNA (NegCtrl) were treated with Tm and increasing concentrations of Ceapin-A7 for 16 hr. Reporter fluorescence was measured by flow cytometry and median values were plotted (N = 3, ± SD). (E) K562 ERSE reporter ABCD3 and NegCtrl KD cells were treated with DMSO or Tm and reporter activation was measured as in (D). (F and G) qPCR analysis of ATF6α target genes HSPA5 and HSP90B1, respectively. HepG2 CRISPRi NegCrl and ABCD3 KD cell lines were treated with DMSO, thapsigargin (Tg) (100 nM), and Tg with Ceapin (6 μM). Tg blocks the ER calcium pump and induces ER stress. Data plotted are mRNA levels for HSPA5 and HSP90B1 normalized to GAPDH and then compared to unstressed NegCtrl cells ± standard deviation of duplicate technical replicates of two biological replicates.
-
Figure 1—source data 1
Reporter phenotypes and p values for genes in CRISPRi screen.
- https://doi.org/10.7554/eLife.46595.005
Figure 1—figure supplement 1
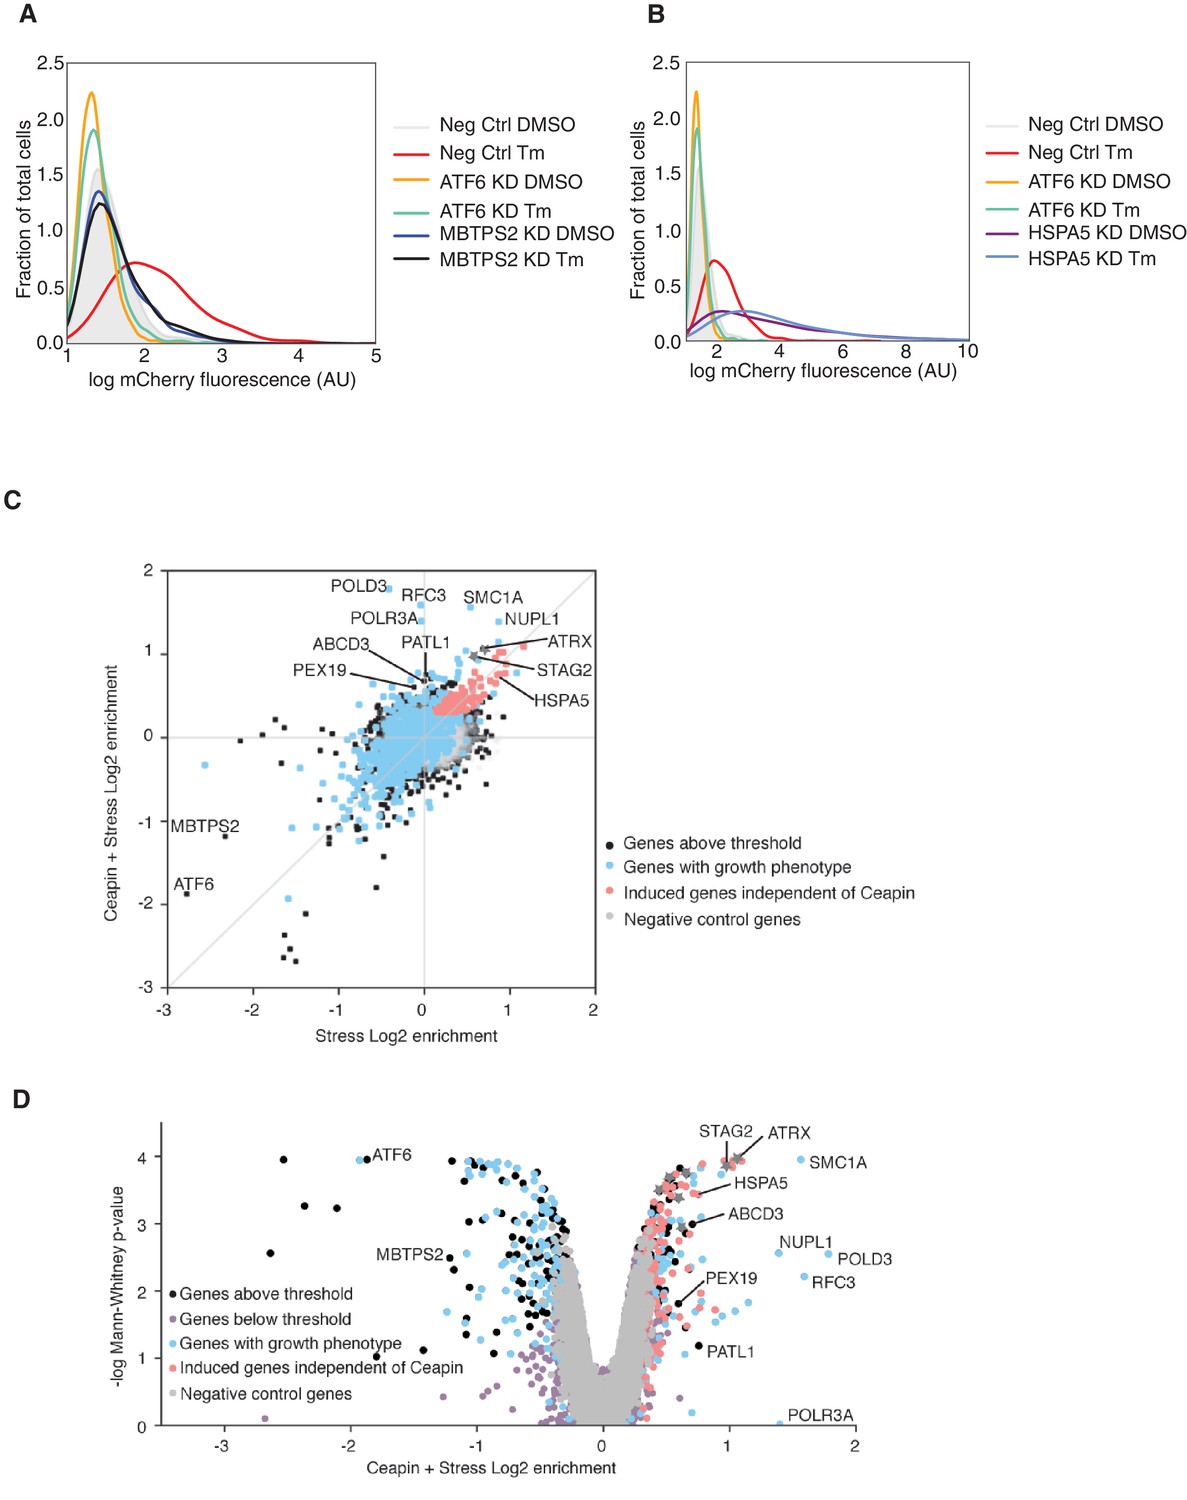
Genome-scale CRISPRi screen to identify molecular target of Ceapin.
(A and B) K562 ERSE reporter cells were transduced with the indicated sgRNAs and treated with vehicle (DMSO) or tunicamycin (Tm) (6 μg/ml) for 16 hr. (C) Reporter phenotypes from CRISPRi screens treated with ER stress in the absence (x-axis) and presence (y-axis) of Ceapin. Ceapin-independent genes (labeled in red) are genes whose knockdown changed the expression of the reporter to the same degree in both treatments and localized to the diagonal. Genes with growth phenotypes of at least −0.19 in previous growth screens (Horlbeck et al., 2016) are labeled in blue. (*) denotes chromatin architecture and remodeling related genes that impact reporter transcription. Negative control genes are labeled in gray. (D) Volcano plot of gene-reporter phenotypes and p values from CRISPRi screen described in (Figure 1C) and shown on y-axis of (A) with additional genes labeled. The reporter phenotypes and p values for genes in CRISPRi screen are listed in Figure 1—source data 1.
Figure 1—figure supplement 2
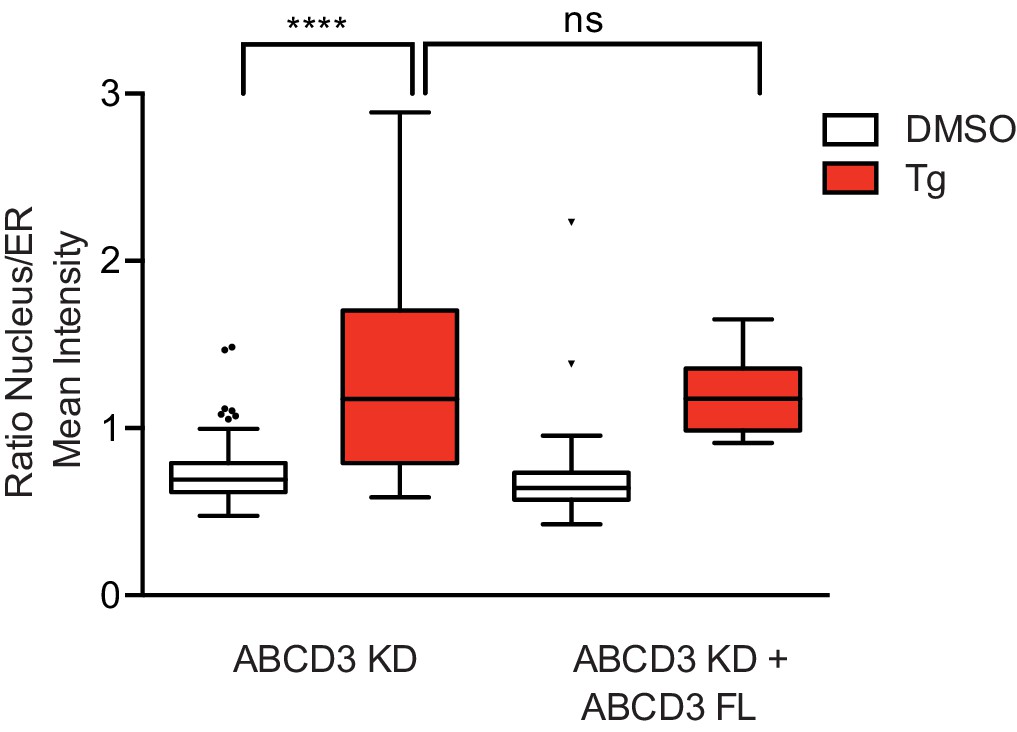
ABCD3 KD does not affect ATF6α nuclear translocation.
Quantification of nuclear translocation of ATF6α. Endogenous ABCD3 was knocked-down in 3xFLAG-ATF6α HEK293 CRISPRi cells and full length GFP-ABCD3 construct was added back by FACS soring for narrow, low GFP levels. Data plotted is the ratio of ATF6α signal intensity of nucleus to ER per cell, from one of three independent experiments and with at least twenty cells per condition. Statistical analysis used unpaired two-tailed t-tests, **** indicates p<0.0001.
Figure 2 with 3 supplements

ABCD3 is required for Ceapin-induced ATF6α foci.
(A) HEK293 CRISPRi cells stably expressing doxycycline inducible 3xFLAG-ATF6α with ABCD3 or NegCtrl KD were treated either with DMSO or Ceapin (6 μM) for 30 min prior to fixation, staining with anti-ABCD3 and/or anti-PEX14, and confocal fluorescent imaging. Scale bar, 10 μm. Images are representative of two independent experiments, in which we imaged at least 20 positions per well for each experiment. (B and C) Plotted is the mean and standard deviation of the mean per cell correlation of 3xFLAG-ATF6α and ABCD3 or PEX14 from (A) with at least 30 cells imaged per condition. All cells imaged in ABCD3 KD (96% KD), including wildtype cells, were used in quantification. Statistical analysis used unpaired two-tailed t-tests, **** indicates p<0.0001. (D) U2-OS cells stably expressing GFP-ATF6α were treated either with vehicle (DMSO), Tg (100 nM), Tm (2 μg/ml), or Ceapin (6 μM) for 2 hr or 4 hr (shown) prior to fixation, co-staining with anti-ABCD3 and anti-PEX14, and fluorescent imaging. Stress attenuated GFP-ATF6α foci are indicated by arrowheads. Scale bar, 10 μm. (E) Quantification of correlation of GFP-ATF6α and ABCD3 within PEX14 sites.
Figure 2—figure supplement 1

ABCD3 is not co-translationally translocated into the ER.
Data from Jan et al. (2014) is plotted. Gene enrichments obtained with the general BirA-Sec61ß ER marker in HEK293 cells and signal sequence (SS) annotations predicted by SignalP. ABCD4 was previously annotated to be peroxisomal, but recently shown to be ER localized. PEX16 has been previously shown to be co-translationally translocated. PXPM2 is a peroxisomal membrane protein.
Figure 2—figure supplement 2
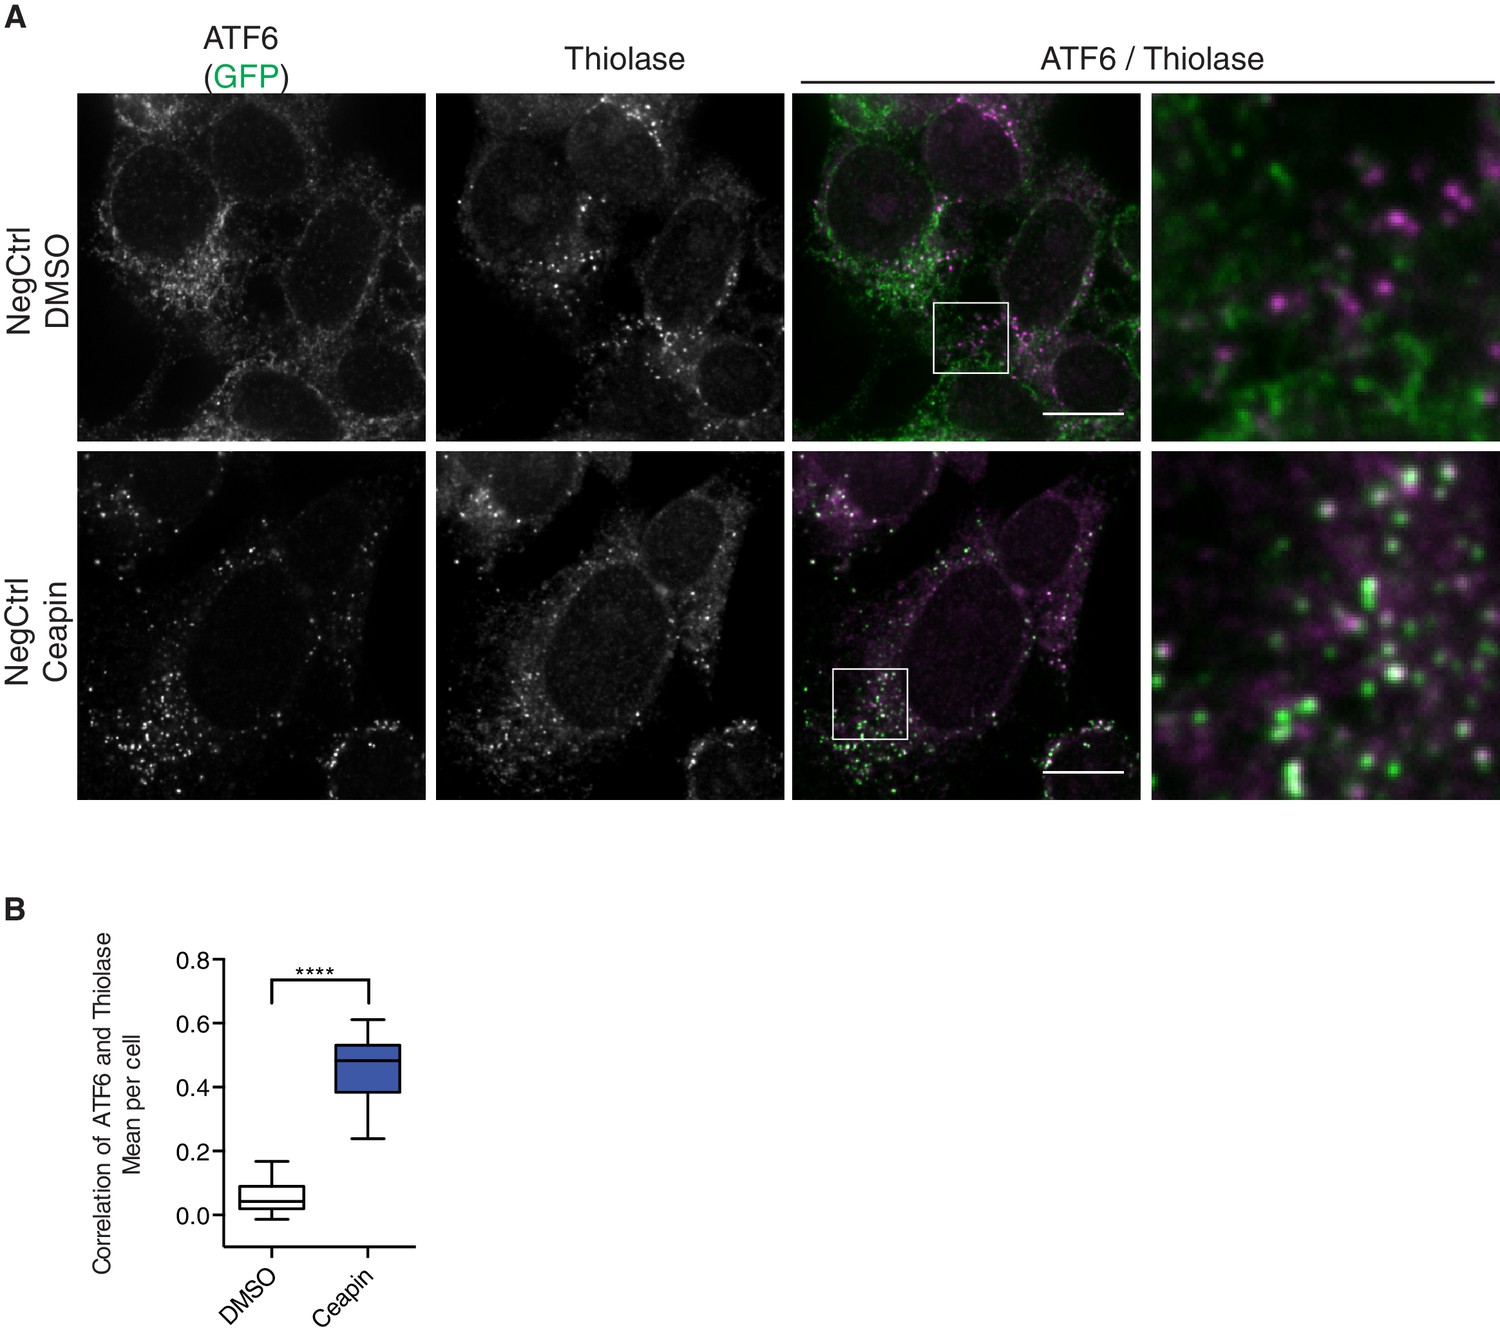
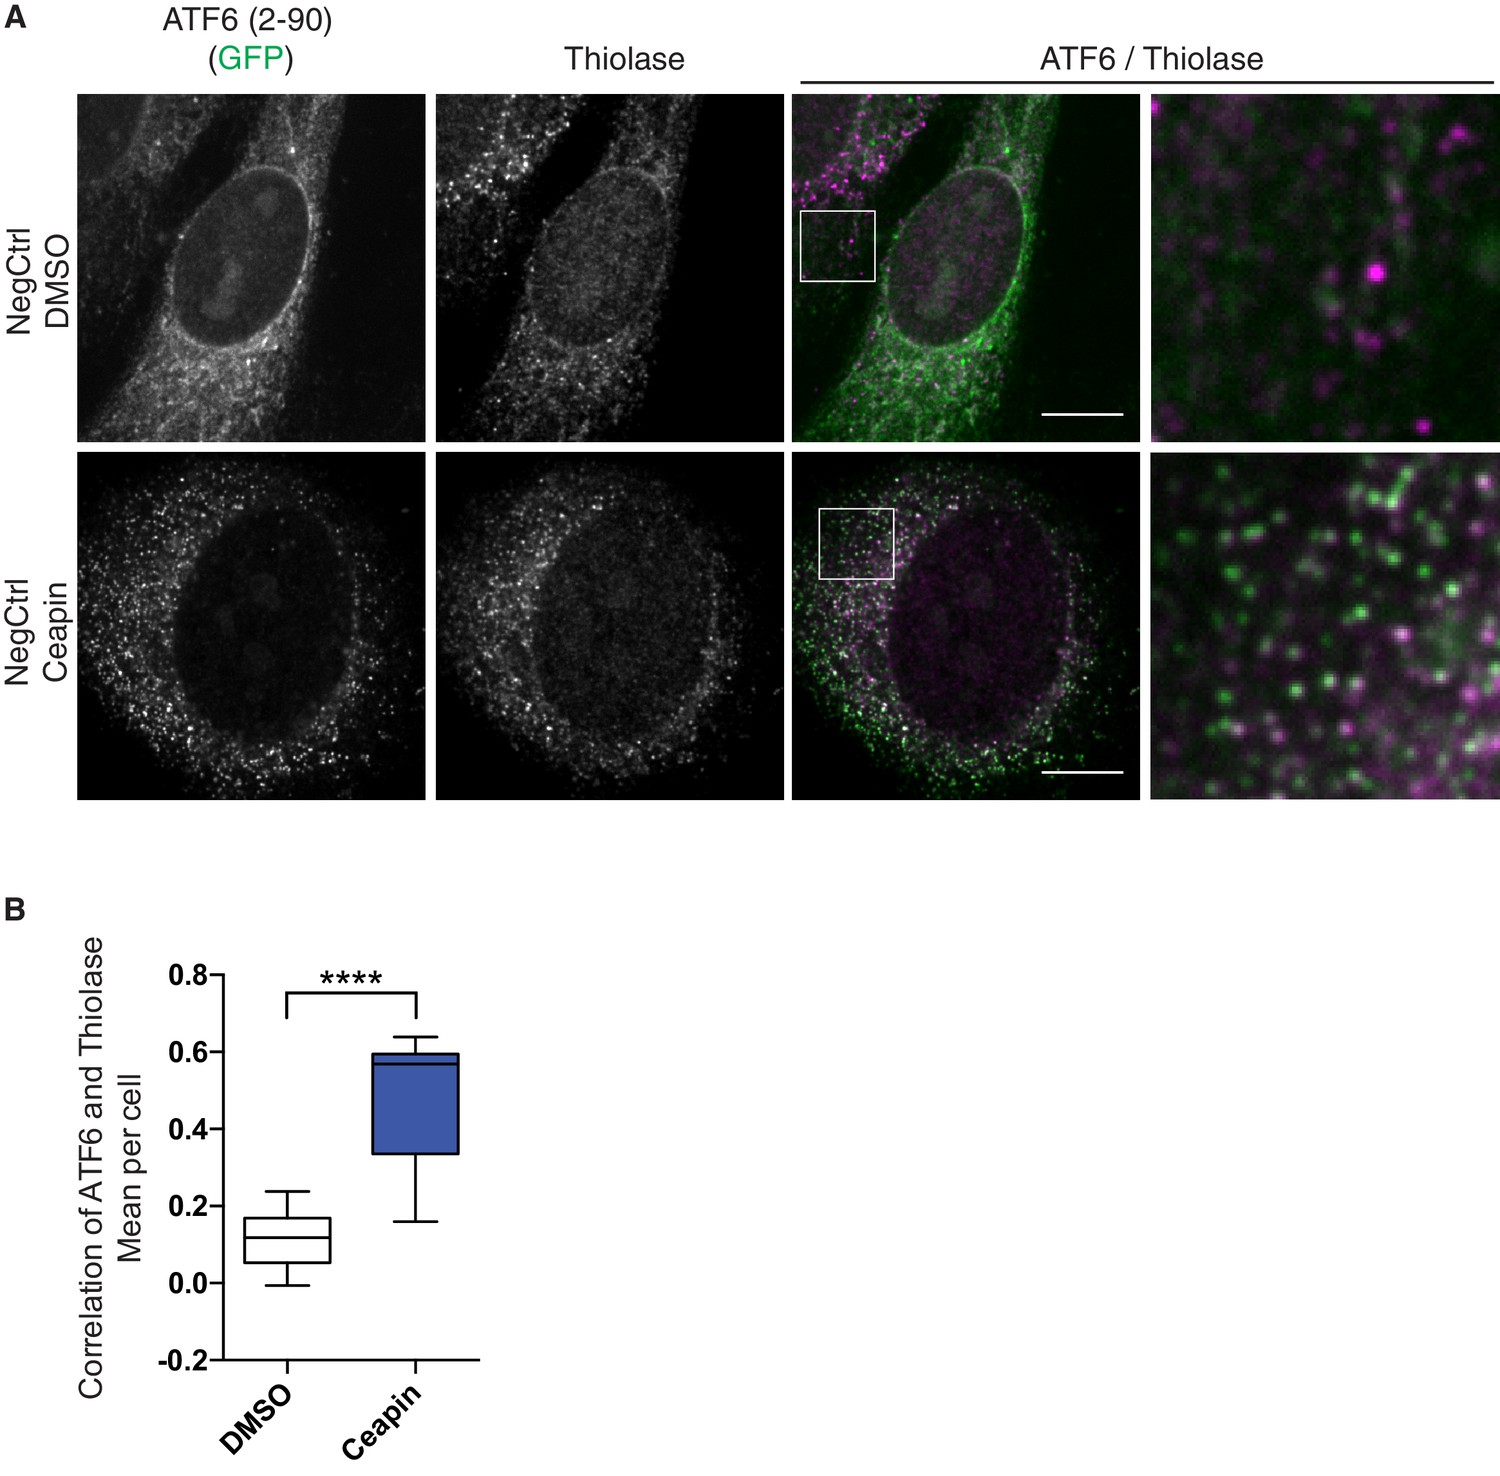
Ceapin-induced ATF6α foci colocalize with peroxisomal matrix protein Thiolase.
(A) 3xFLAG-ATF6α HEK293 CRISPRi cells with NegCtrl KD were treated and fixed as in Figure 2A and stained for Thiolase. Scale bar, 10 μm. (B) Quantification of the correlation of ATF6α and Thiolase from (A) and plotted as in Figure 2B.
Figure 2—figure supplement 3
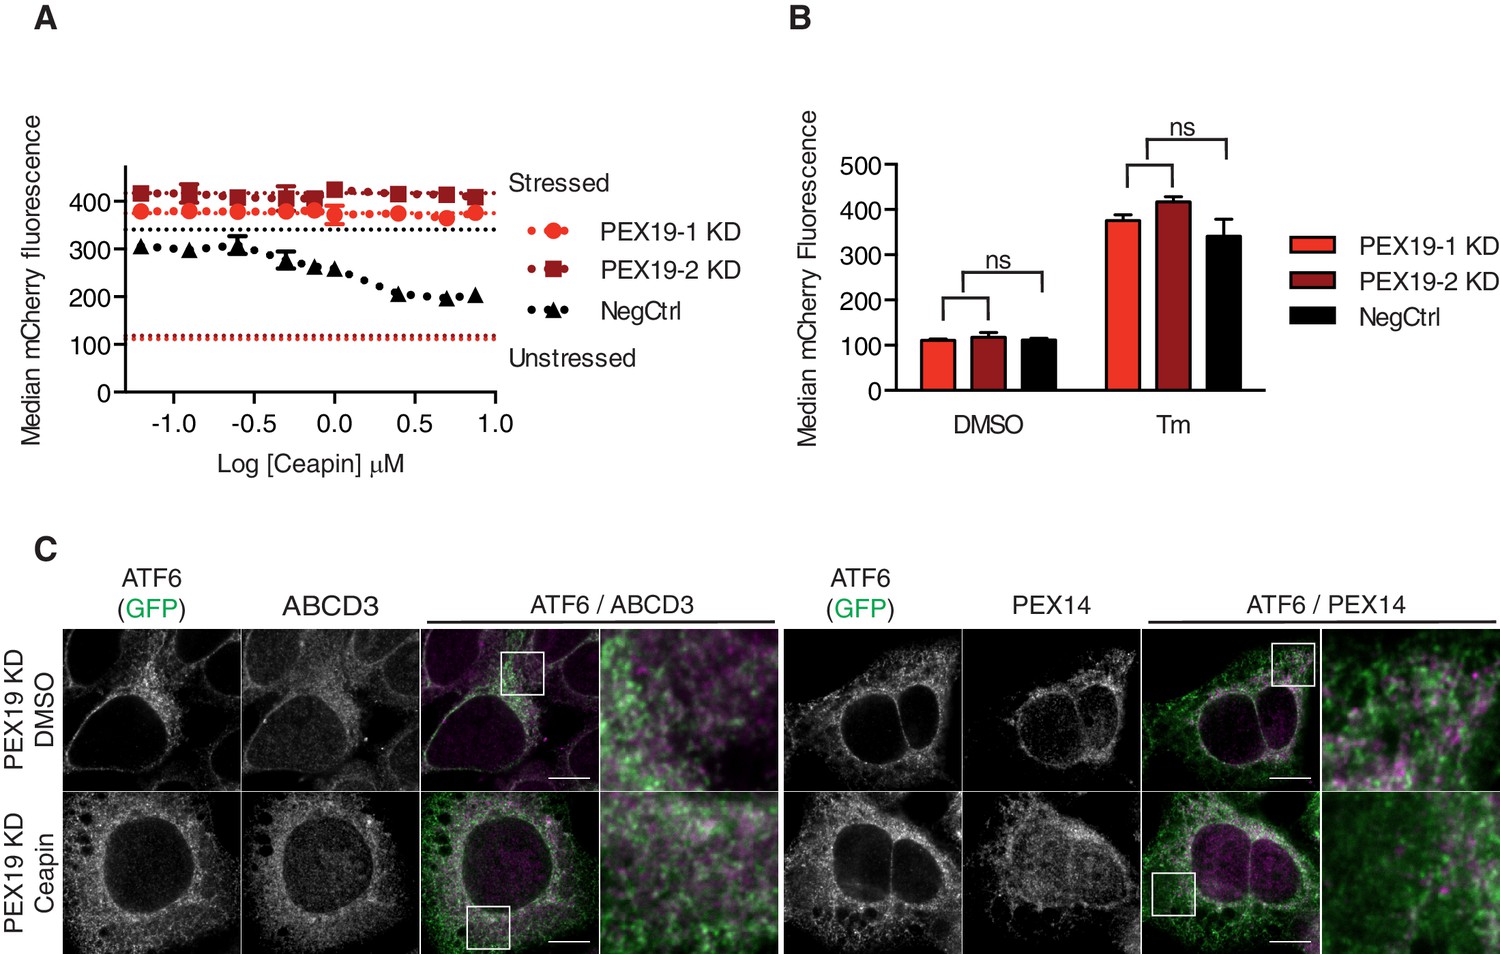
PEX19 KD desensitizes cells to Ceapin and is required for Ceapin-induced ATF6α foci.
(A) K562 ERSE reporter cells with NegCtrl or PEX19 sgRNA KD were treated with ER stressor (6 μg/ml Tm) and increasing concentrations of Ceapin-A7 for 16 hr. Reporter fluorescence was measured by flow cytometry and median values were plotted (N = 3, ± SD). (B) K562 ERSE reporter PEX19 and NegCtrl KD cells were treated without (DMSO) or with ER stressor (Tm) and reporter activation was measured as in (A). (C) 3xFLAG-ATF6α HEK293 CRISPRi cells with PEX19 sgRNA or NegCtrl KD were treated, fixed, and stained as in Figure 2A. Scale bar, 10 μm.
Figure 3
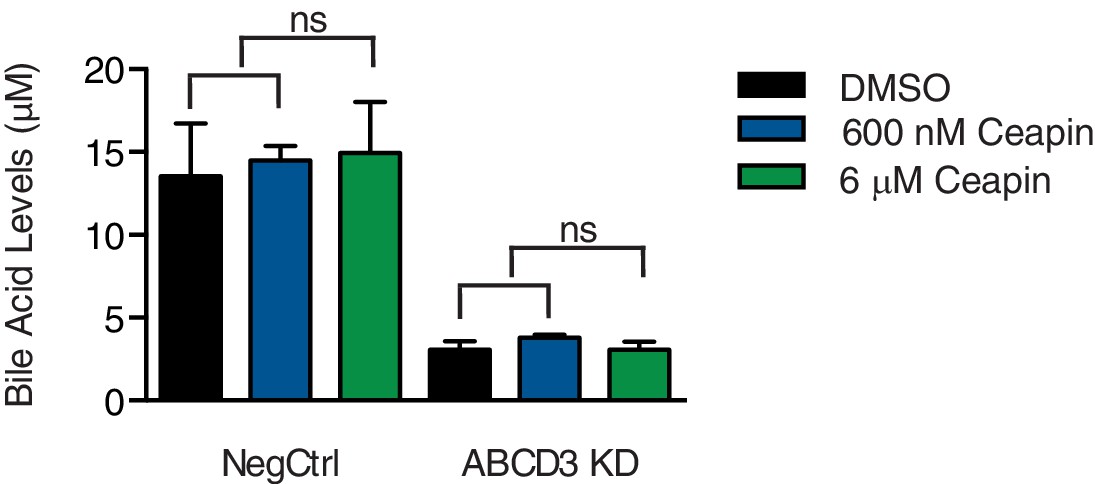
Ceapin treatment does not inhibit ABCD3 activity.
Bile acid levels were measured in HepG2 CRISPRi cells with NegCtrl or ABCD3 KD treated with vehicle (DMSO), EC50 of Ceapin (600 nM), and ten times the EC50 of Ceapin-A7 (6 μM).
Figure 4
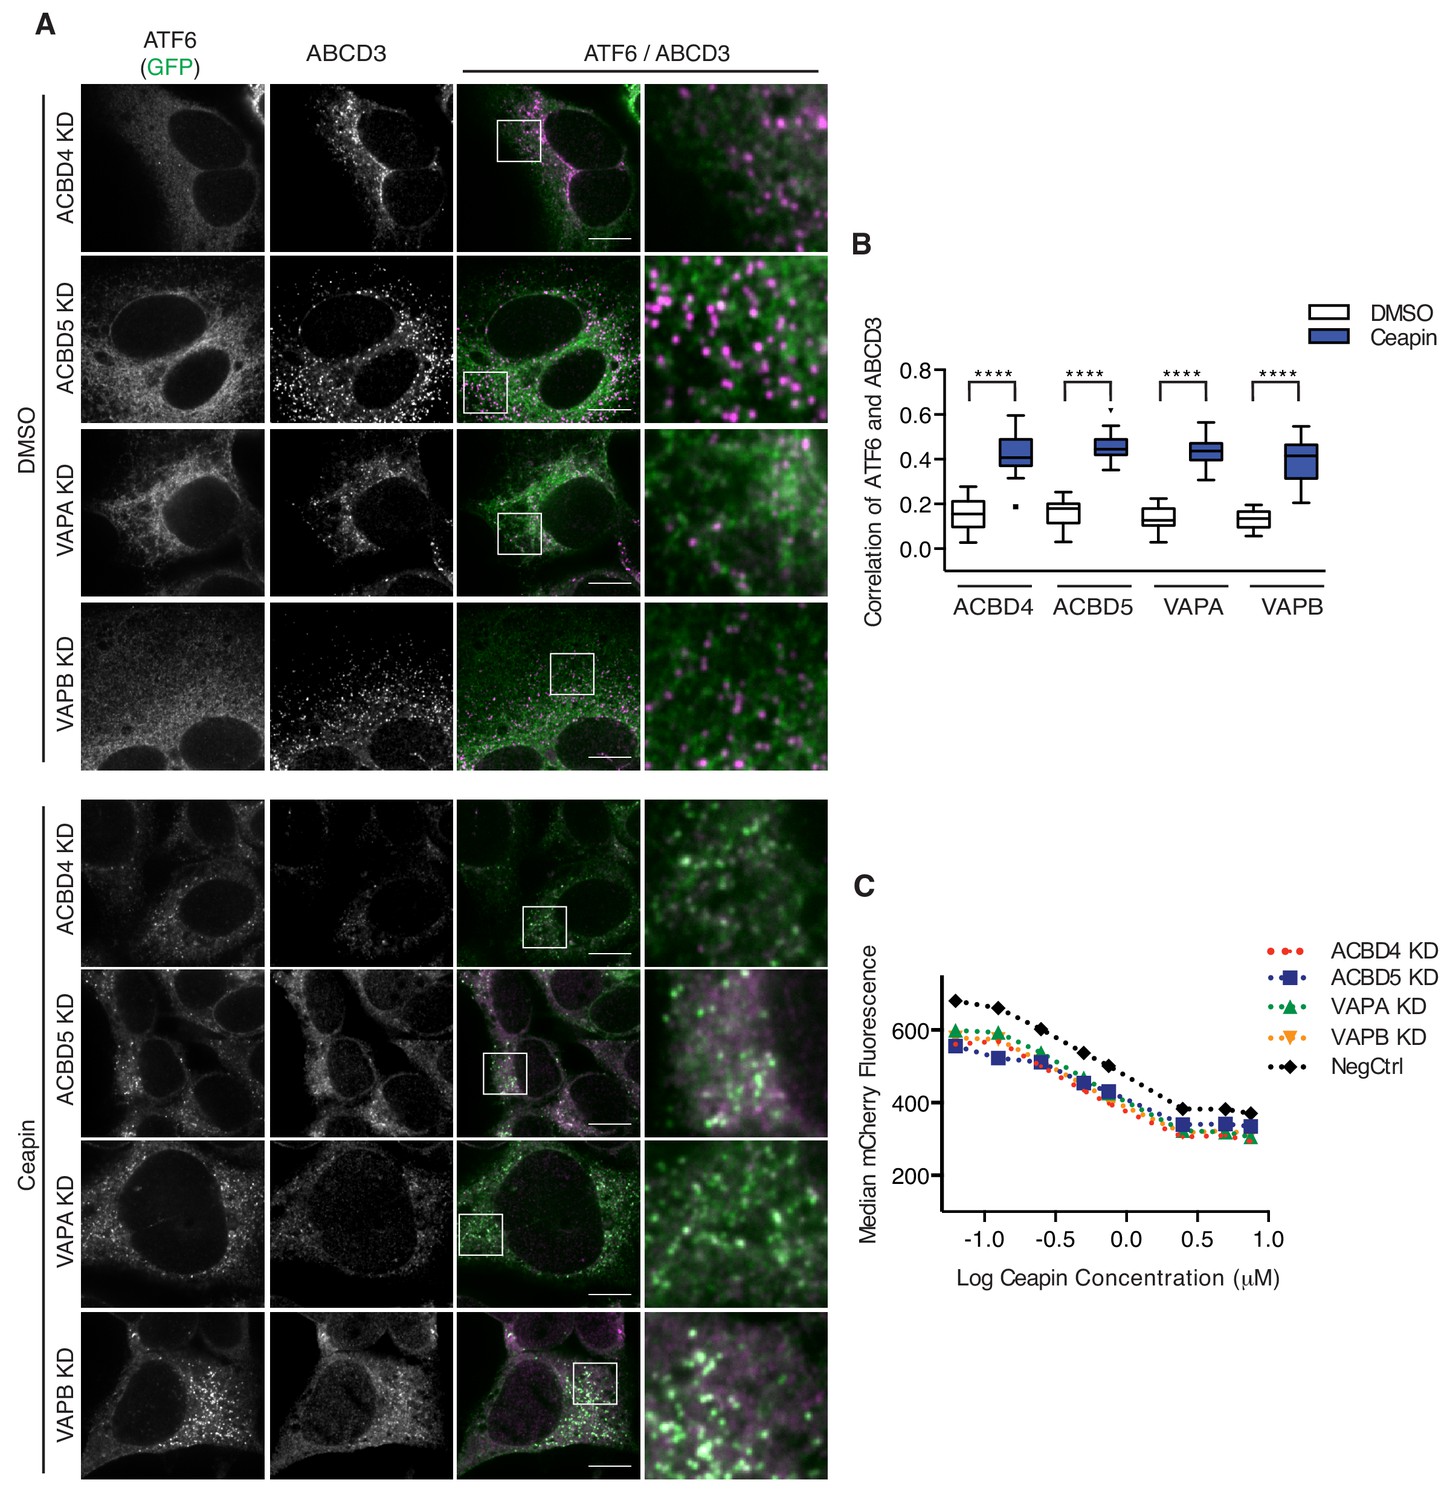
Ceapin-induced ATF6α-ABCD3 interaction does not require known ER-peroxisome tethers.
(A) ER tether components, VAPA and VAPB, and peroxisome tether components, ACBD4 and ACBD5, were individually knocked-down in 3xFLAG-ATF6α HEK293 CRISPRi cell line, treated, fixed, and stained as in Figure 2A prior to fluorescence imaging. Scale bar, 10 μm. (B) Quantification of the correlation of ATF6α and ABCD3 from (A) and plotted as in Figure 2B. (C) K562 ERSE reporter cells with NegCtrl or indicated knockdowns were treated with Tm and increasing concentrations of Ceapin-A7 for 16 hr. Reporter fluorescence was measured by flow cytometry and median values were plotted (N = 3, ± SD).
Figure 5 with 2 supplements
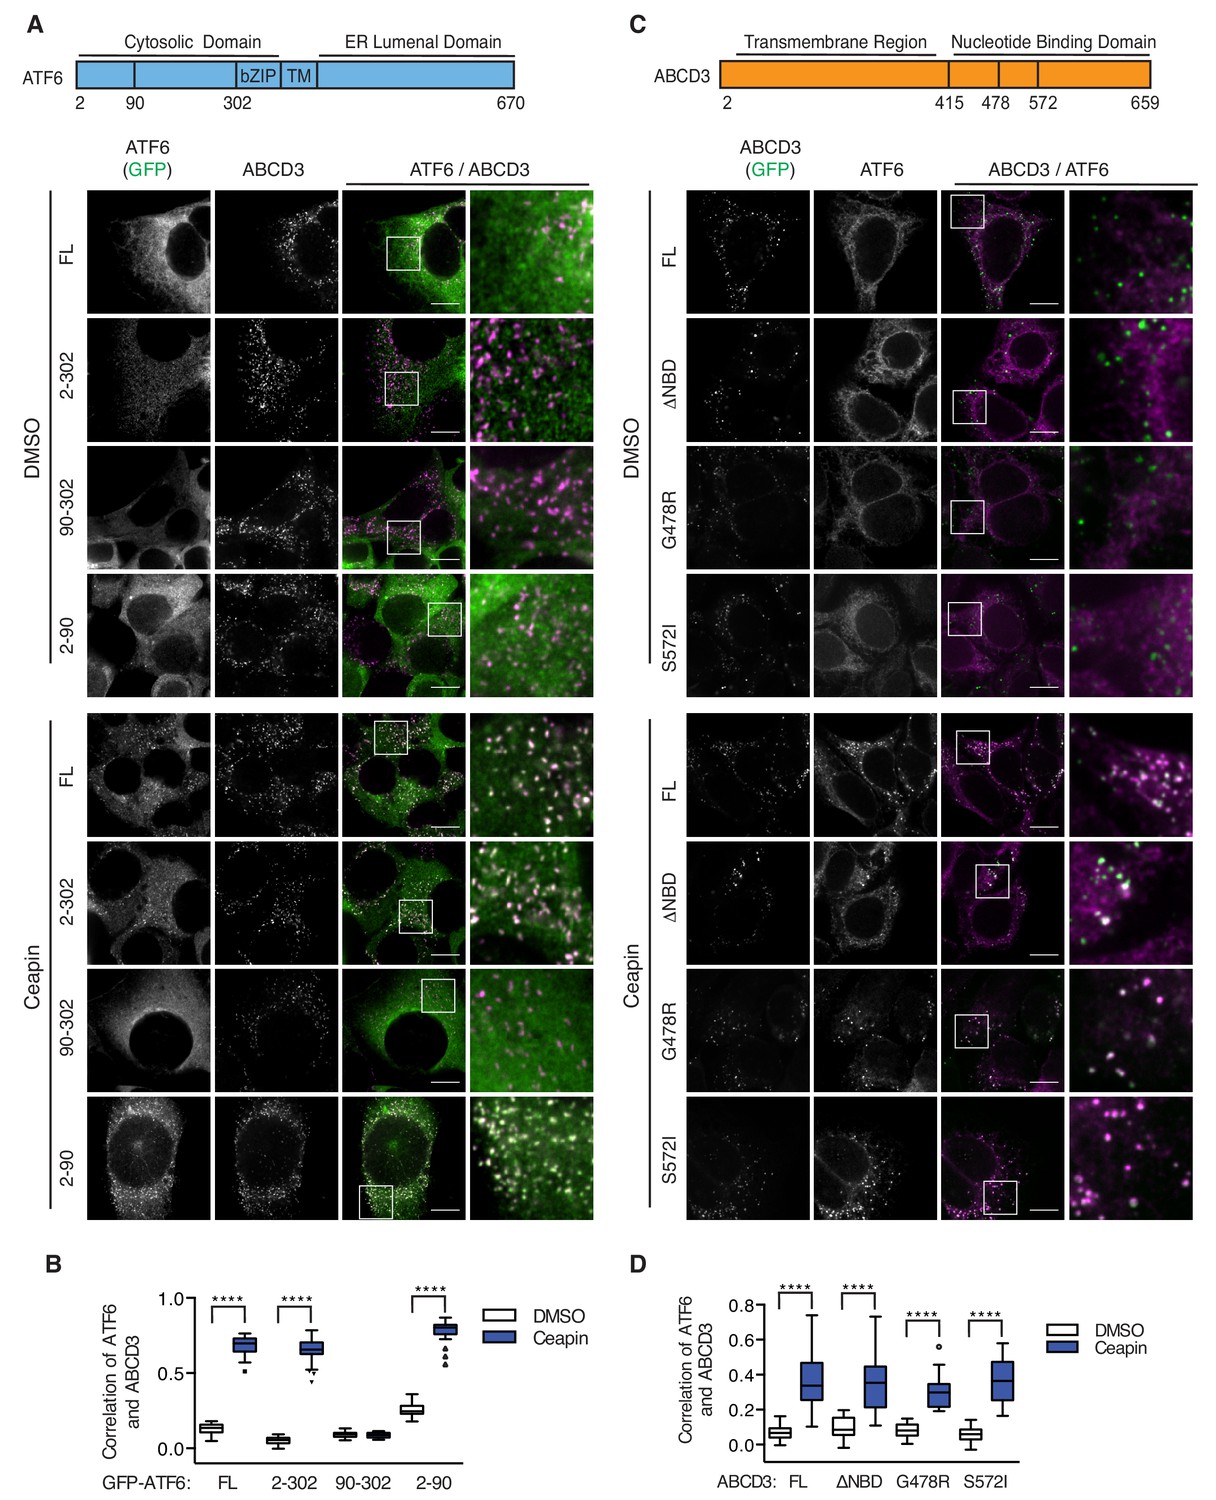
Ceapin-induced interactions do not require ER localized ATF6α nor ABCD3 transporter activity.
(A) Diagram of GFP-ATF6α constructs tested. A nuclear exit signal (NES) was added to ATF6α truncated constructs to retain ATF6α in the cytosol. Endogenous ATF6α was knocked-down in 3xFLAG-ATF6α HEK293 CRISPRi cells grown without doxycycline, so that only GFP-ATF6α constructs were expressed. GFP-ATF6α-truncated cell lines were treated with DMSO or Ceapin-A7, fixed and stained for ABCD3. Scale bar, 10 μm. (B) Quantification of the correlation of GFP-ATF6α within ABCD3 sites. (C) Diagram of the GFP-ABCD3 mutants and truncations tested. Endogenous ABCD3 was knocked-down in 3xFLAG-ATF6α HEK293 CRISPRi cells so only GFP-ABCD3 constructs were expressed. GFP-ABCD3 cell lines were treated with DMSO or Ceapin-A7, fixed and stained for FLAG(ATF6α) (shown) and PEX14. Scale bar, 10 μm. (D) Quantification of the correlation of GFP-ABCD3 and 3xFLAG-ATF6α within PEX14 sites.
Figure 5—figure supplement 1
ATF6α(2-90) colocalizes with peroxisomal matrix protein Thiolase.
(A) Endogenous ATF6 was knocked-down in U2OS Flp-In CRISPRi cells and FACS sorted for narrow, low GFP levels so only GFP-ATF6α(2-90) construct was expressed. Cells were treated and fixed as in Figure 2A and stained for Thiolase. Scale bar, 10 μm. (B) Quantification of the correlation of ATF6α and Thiolase from (A) and plotted as in Figure 2B.
Figure 5—figure supplement 2
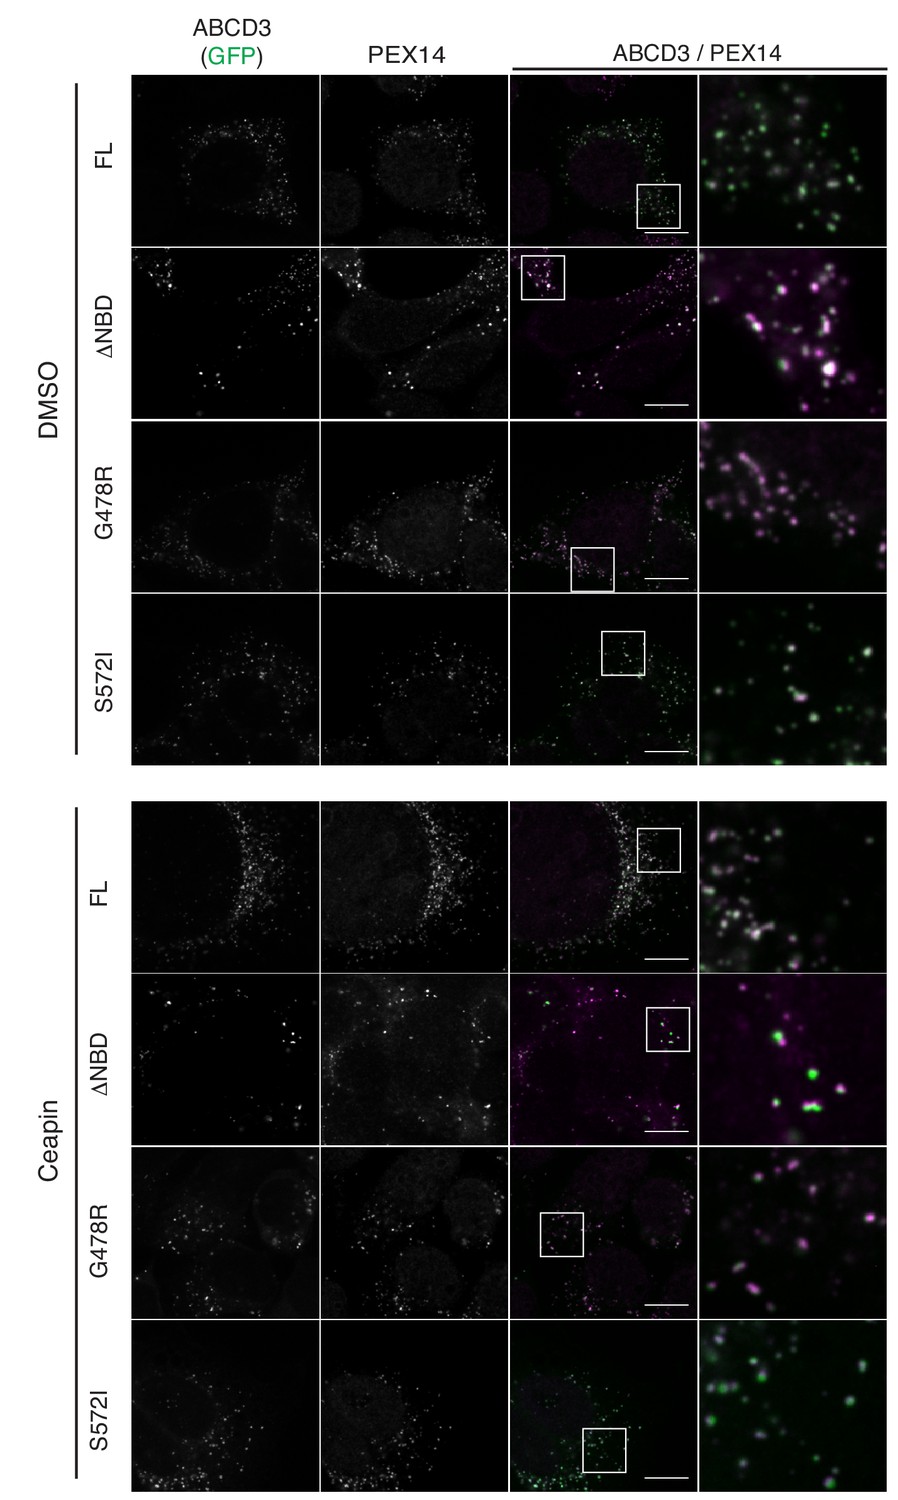
ABCD3 constructs localization to peroxisome.
Endogenous ABCD3 was knocked-down in 3xFLAG-ATF6α HEK293 CRISPRi cells and FACS sorted for narrow, low GFP levels so only GFP-ABCD3 constructs were expressed. GFP-ABCD3 cell lines were treated with DMSO or Ceapin-A7, fixed and stained for PEX14 (shown) and FLAG(ATF6α). Scale bar, 10 μm.
Figure 6
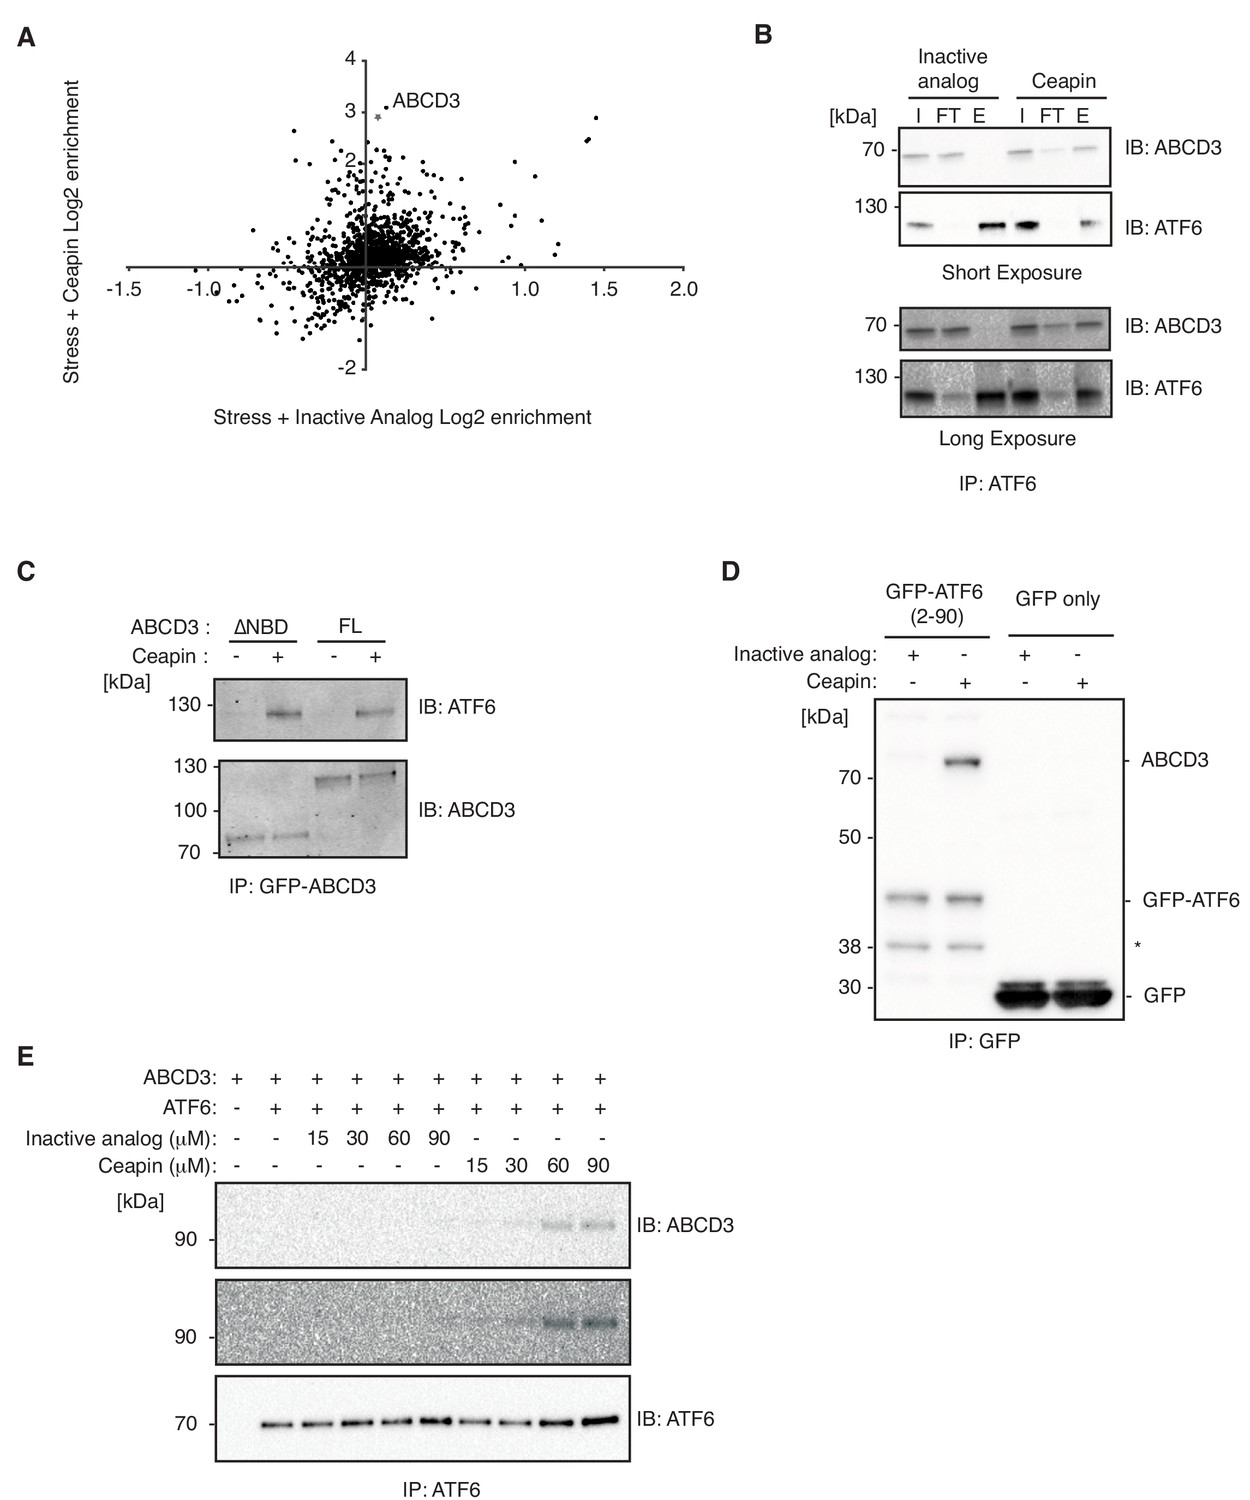
Ceapin drives ATF6α-ABCD3 interaction in cells and in vitro.
(A and B) Proteomic analysis and immunoblot (IB) of anti-FLAG affinity purification from 3xFLAG-ATF6α HEK293 cells treated with stress (100 nM Tg) and inactive Ceapin-A5 analog (6 μM) or active Ceapin-A7 (6 μM) with two replicates for each treatment condition. The proteins identified with affinity-purified FLAG-ATF6 treated with ER stress and Ceapin-A5 or Ceapin-A7 are listed in Figure 6—source data 1. SQSTM1 KD (*) was the top second hit in proteomics, however, SQSTM1 KD in the K562 ATF6 reporter cell line did not render cells resistant to Ceapin treatment and retained a similar response to negative control cells. I, input; FT, flow-through; E, elution. (C) Immunoprecipitation of full-length GFP-ABCD3 and GFP-ABCD3ΔNBD from cells treated with DMSO or Ceapin-A7. (D) Detergent solubilized GFP-ATF6α(2-90) or GFP-only cell lysates were incubated with Ceapin-A7 or inactive analog Ceapin-A5 and affinity purified with anti-GFP. (*) Indicates a degradation product. (E) Purified ATF6α-MBP and ABCD3-GFP were incubated with inactive Ceapin-A5 or active Ceapin-A7 and affinity purified with anti-MBP antibody.
-
Figure 6—source data 1
Excel spreadsheet showing all the proteins identified with affinity-purified FLAG-ATF6 treated with ER stress and Ceapin-A5 or Ceapin-A7.
- https://doi.org/10.7554/eLife.46595.016
Figure 7

Model for Ceapin induced ATF6α inhibition.
Ceapins sequester ATF6α into a transport-incompetent pool during ER stress by tethering ATF6α to peroxisomal ABCD3. ATF6α is occluded from COPII trafficking, while its transmembrane domain remains accessibly to protease cleavage.
Tables
Table 1
Protospacer sequence of sgRNAs.
https://doi.org/10.7554/eLife.46595.018| Gene | Protospacer |
|---|---|
| NegCtrl | GCGCCAAACGTGCCCTGACGG |
| ATF6 | GTGGGATCTGAGAATGTACCA |
| ABCD3-1 | GGTACCAGCGAGCCGGCGAG |
| ABCD3-2 | GACTGCCGGTACCAGCGAGC |
| PEX19-1 | GGCCGAAGCGGACAGGGAAT |
| PEX19-2 | GGAGGAAGGCTGTAGTGTCG |
| ACBD4 | GCCGGCCCTGCTGGACCCCG |
| ACBD5 | GGGAGCCGCTCTCCCACCCT |
| VAPA | GCACCGAACCGGTGACACAG |
| VAPB | GCGGGGGTCCTCTACCGGGT |
Additional files
-
Transparent reporting form
- https://doi.org/10.7554/eLife.46595.019
Download links
A two-part list of links to download the article, or parts of the article, in various formats.
Downloads (link to download the article as PDF)
Open citations (links to open the citations from this article in various online reference manager services)
Cite this article (links to download the citations from this article in formats compatible with various reference manager tools)
Ceapins block the unfolded protein response sensor ATF6α by inducing a neomorphic inter-organelle tether
eLife 8:e46595.
https://doi.org/10.7554/eLife.46595


