Critical role for Piccolo in synaptic vesicle retrieval
- German Center for Neurodegenerative Diseases e.V. (DZNE), Charité Medical University, Germany
- University of Oslo, Norwegian Radium Hospital, Norway
- Max-Delbrück Center for Molecular Medicine in the Helmholtz Society, Germany
- University of Texas Southwestern, United States
- Charité Medical University, Germany
Figures
Figure 1 with 1 supplement
Transposon mutagenesis leads to the loss of Piccolo protein in rats.
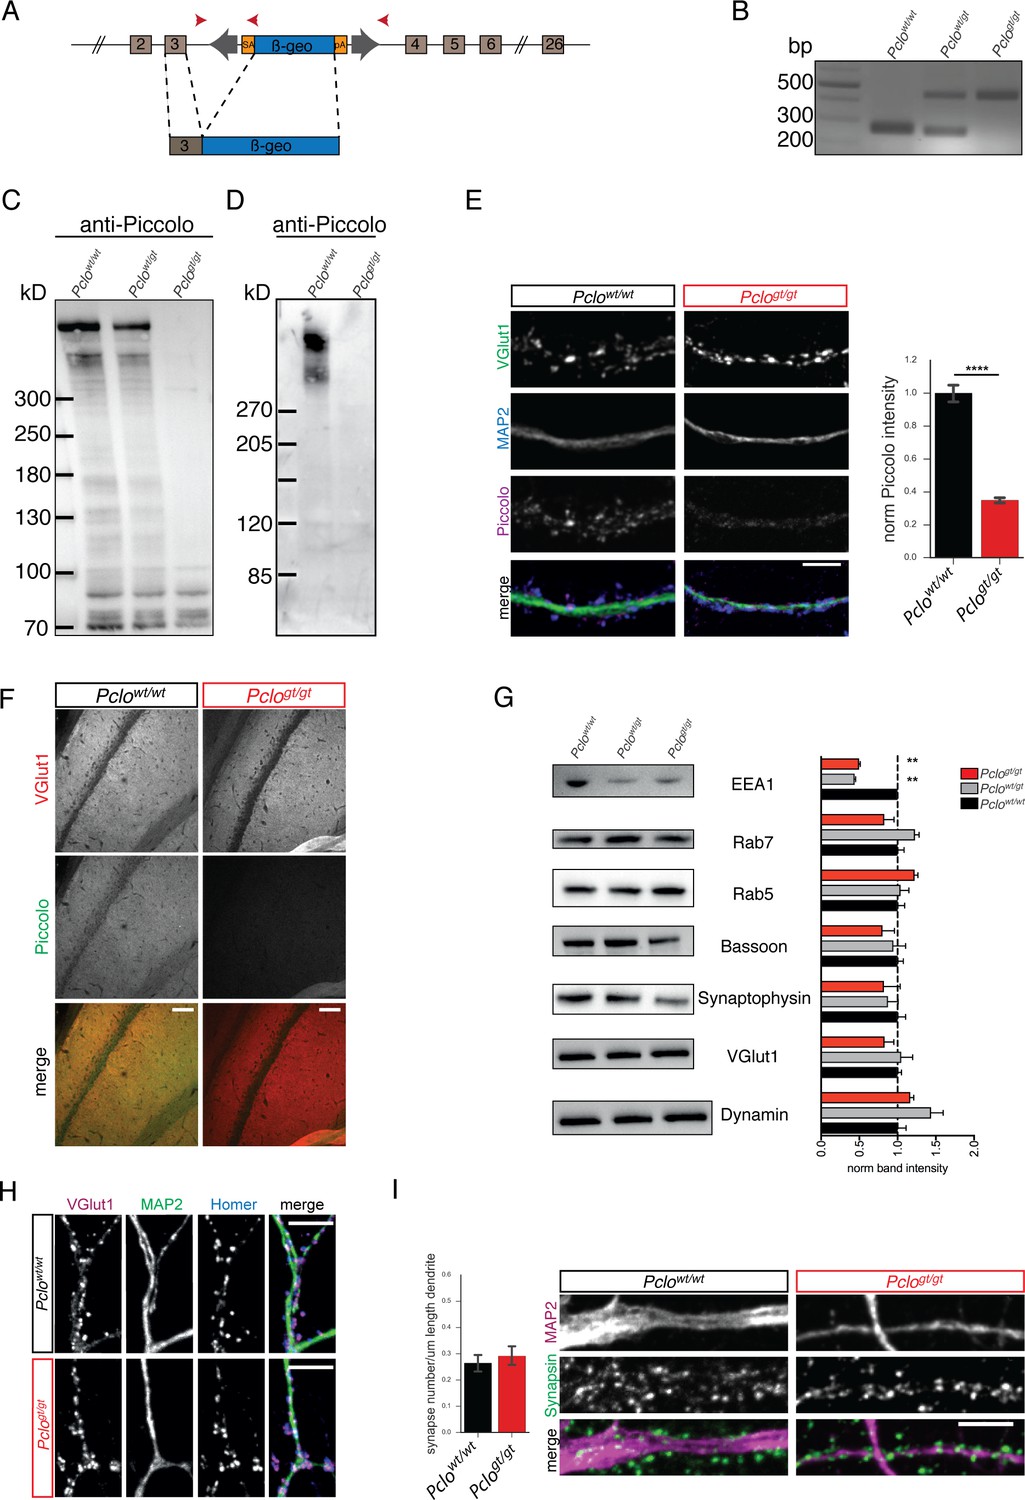
(A) Schematic of transposon insertion into exon 3 of Pclo genomic sequence creating a translational stop codon, truncating the generation of long Piccolo isoforms. (B) PCR verification of genotypes. PCR from Pclowt/wt, Pclowt/gt and Pclogt/gt genomic DNA results in the amplification of 260 bp WT and/or 450 bp KO specific bands, respectively. (C and D) Western blot analysis of P0-P2 brain lysates (C) and lysates from DIV14 cultured hippocampal neurons (D). Bands, corresponding to Piccolo isoforms (70–560 kDa), are detected in Pclowt/wt and Pclowt/gt brain lysates as well as Pclowt/wt neuron lysates, but not in Pclogt/gt lysates (n = 3 independent experiments). (E) Immunocytochemical staining of hippocampal neurons. Piccolo immuno-reactivity co-localizes with VGlut1 in Pclowt/wt neurons, but not in Pclogt/gt neurons. Right panel, quantification of Piccolo intensities at VGlut1 puncta (Pclowt/wt = 1 ± 0.03, n = 586 synapses; Pclogt/gt = 0.35 ± 0.01, n = 718 synapses; two independent experiments). (F) Immuno-histological staining of Pclowt/wt and Pclogt/gt brain sections. Representative images from the CA1 region of the hippocampus are shown. No Piccolo immuno-reactivity can be observed on Pclogt/gt sections. (G) Western blot analysis of P0-P2 brain lysates. Expression levels of synaptic proteins are altered in Pclogt/gt brain lysates (EEA1: Pclowt/wt = 1 ± 0.03, Pclowt/gt = 0.44 ± 0.01, Pclogt/gt = 0.50 ± 0.02; two independent experiments; Rab7: Pclowt/wt = 1 ± 0.08, Pclowt/gt = 1.23 ± 0.05, Pclogt/gt = 0.83 ± 0.13; four independent experiments; Rab5: Pclowt/wt = 1 ± 0.09, Pclowt/gt = 1.04 ± 0.11, Pclogt/gt = 1.22 ± 0.04; three independent experiments; Bassoon: Pclowt/wt = 1 ± 0.07, Pclowt/gt = 0.95 ± 0.16, Pclogt/gt = 0.80 ± 0.16; four independent experiments; Synaptophysin: Pclowt/wt = 1 ± 0.11, Pclowt/gt = 0.86 ± 0.13, Pclogt/gt = 0.82 ± 0.21; three independent experiments; VGlut1: Pclowt/wt = 1 ± 0.05, Pclowt/gt = 1.05 ± 0.15, Pclogt/gt = 0.83 ± 0.12; three independent experiments; Dynamin: Pclowt/wt = 1 ± 0.11, Pclowt/gt = 1.44 ± 0.16, Pclogt/gt = 1.17 ± 0.05; three independent experiments). (H) Immunocytochemical staining of hippocampal neurons with antibodies against Homer, VGlut1 and MAP2 reveal the presence of VGlut1/Homer positive synapses along MAP2 positive dendrites in Pclowt/wt and Pclogt/gt neurons. (I) Images, of hippocampal neurons immunostained with antibodies against Synapsin and MAP2. The number of Synapsin positive puncta along primary dendrites (MAP2) does not differ between Pclowt/wt and Pclogt/gt neurons (left panel, Pclowt/wt = 0.27 ± 0.02, n = 27 primary dendrites; Pclogt/gt = 0.29 ± 0.02, n = 22 primary dendrites; two independent experiments). Scale bar in E, H and I 10 μm, scale bar in F 50 μm. Error bars in bar graph represent 95% confidence intervals. Numbers given represent mean ± SEM, Students T-test. **** denotes p<0.0001.
-
Figure 1—source data 1
This spreadsheet contains the normalized values used to generate the bar plots shown in Figure 1E,G and I.
- https://doi.org/10.7554/eLife.46629.004
Figure 1—figure supplement 1

Levels of synaptic vesicle proteins are reduced at Pclogt/gt synapses.
(A) Immunocytochemical staining of cultured hippocampal neurons for SV proteins Synaptophysin, VGlut1, Synaptotagmin and Synapsin. The intensities of Synaptophysin, VGlut1 and Synaptotagmin are reduced in Pclogt/gt synapses. The levels of Synapsin, are not altered between Pclowt/wt and Pclogt/gt boutons. (B) Quantification of (A). (Synapotphysin: Pclowt/wt = 1.00 ± 0.01, n = 3457 puncta; Pclogt/gt = 0.81 ± 0.01, n = 2916 puncta; 13 independent experiments; VGlut1: Pclowt/wt = 1.00 ± 0.02, n = 1907 puncta; Pclogt/gt = 0.70 ± 0.01, n = 2098 puncta; five independent experiments; Synaptotagmin: Pclowt/wt = 1.00 ± 0.01, n = 1987 puncta; Pclogt/gt = 0.69 ± 0.01, n = 1734 puncta; three independent experiments; Synapsin: Pclowt/wt = 1.00 ± 0.01, n = 2773 puncta; Pclogt/gt = 0.99 ± 0.01, n = 1848 puncta; four independent experiments). Scale bars represent 10 μm. Error bars in bar graph represent 95% confidence intervals. Numbers given represent mean ± SEM. Student`s t-test. **** denotes p<0.0001.
Figure 2
Pclogt/gt synapses display morphological changes at the ultrastructural level.
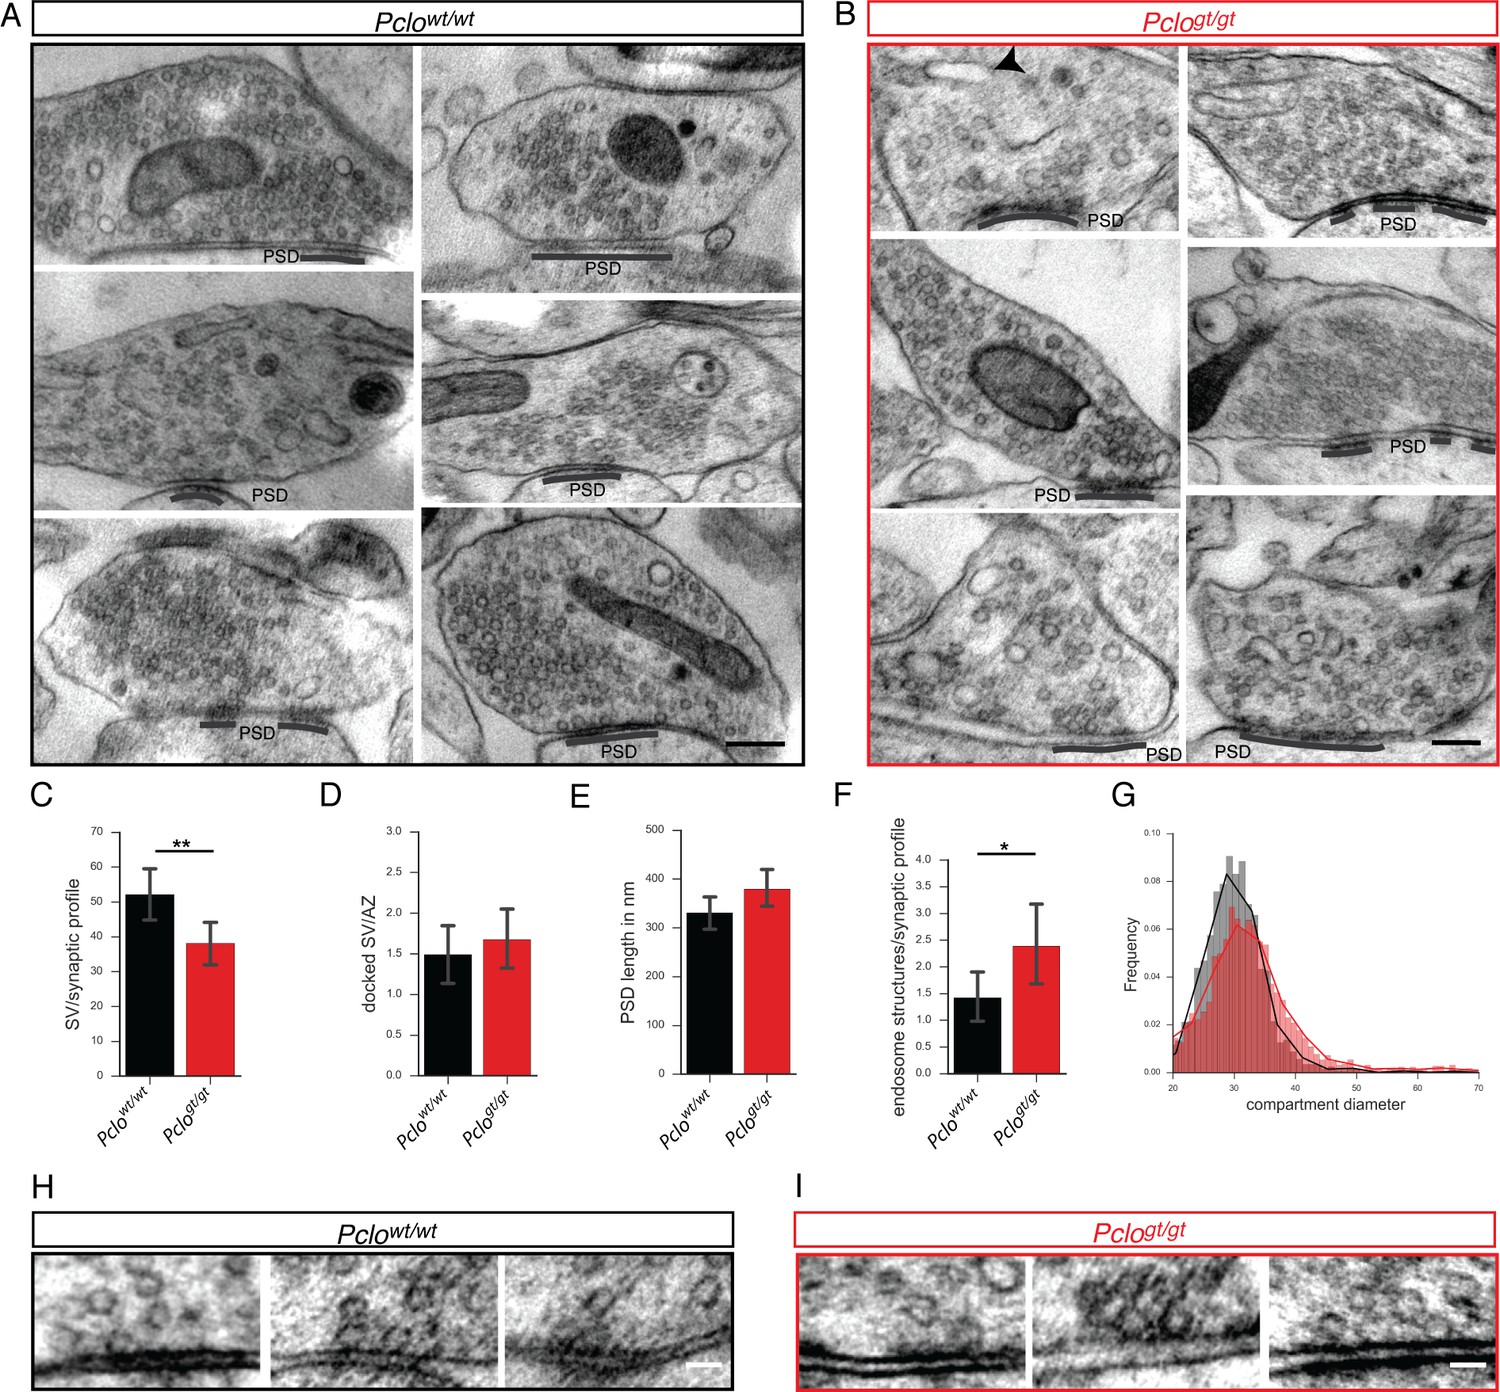
(A and B) Example electron micrographs of Pclowt/wt (A) and Pclogt/gt (B) synapses. (C–G) Quantification of electron micrographs. (C) Synaptic vesicle density is decreased in Pclogt/gt terminals (Pclowt/wt = 51.73 ± 4.05, n = 52 synapses; Pclogt/gt = 38.08 ± 3.19, n = 59 synapses). (D) The number of docked vesicles per active zone is not altered (Pclowt/wt = 1.49 ± 0.18, n = 59 AZs; Pclogt/gt = 1.67 ± 0.18, n = 40 AZs). (E) The total length of the PSDs is not altered (Pclowt/wt = 331 ± 17.09 nm, n = 72 PSDs; Pclogt/gt = 379.6 ± 18.22 nm, n = 69 PSDs). (F) The number of endosome structures is increased at Pclogt/gt synapses (Pclowt/wt = 1.42 ± 0.24, n = 52 synapses; Pclogt/gt = 2.39 ± 0.38, n = 57 synapses). (G) Histogram depicting the distribution of endosome compartment diameters. Pclogt/gt vesicular compartments show a shift towards larger diameters (Pclowt/wt: n = 2729 compartments measured; Pclogt/gt: n = 2387 compartments measured). (H and I) Example electron micrographs showing docked vesicles at Pclowt/wt (H) and Pclogt/gt AZs (I). Scale bar in A and B 200 nm, scale bar in D and E 50 nm. Error bars in bar graph represent 95% confidence intervals. Numbers given represent mean ± SEM, Students t-test. * denotes p<0.05, ** denotes p<0.01.
-
Figure 2—source data 1
This spreadsheet contains the normalized values used to generate the bar plots shown in Figure 2C,D,E,F and G.
- https://doi.org/10.7554/eLife.46629.006
Figure 3
Synaptic vesicle release properties are not altered, but the total recycling pool of vesicles is reduced due to the loss of Piccolo.
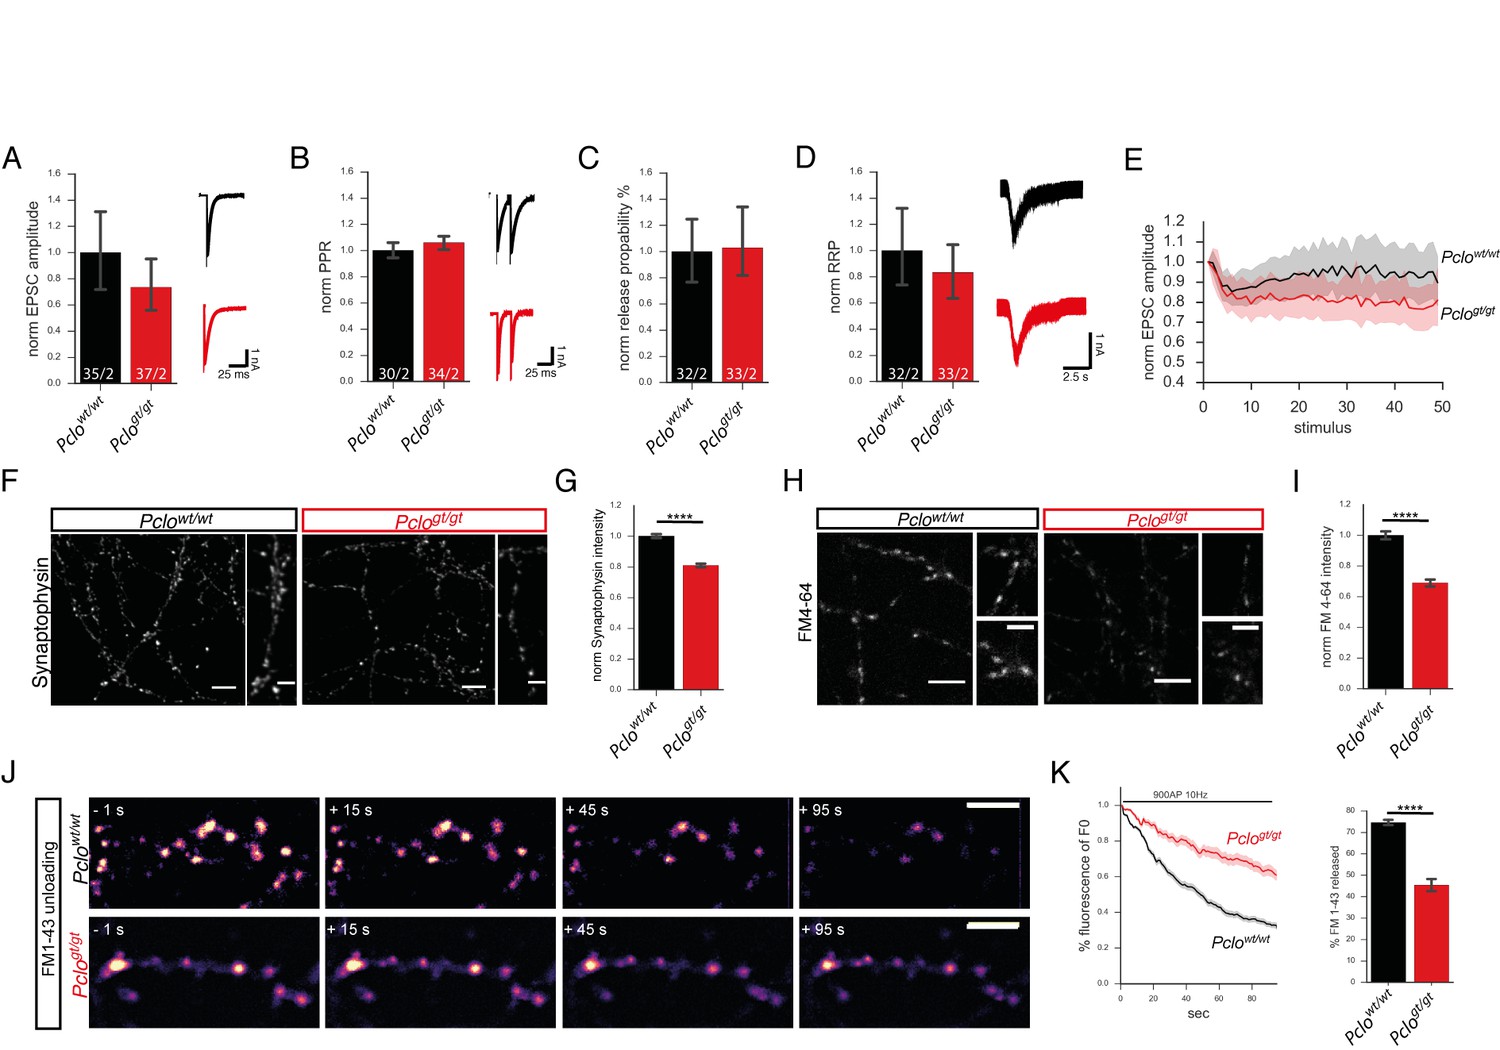
(A–E) Patch clamp recordings on autaptic primary hippocampal neurons. (A) Amplitudes of evoked postsynaptic currents (EPSCs) are slightly but not significantly reduced in Pclogt/gt neurons (Pclowt/wt = 1.0 ± 0.15, Pclogt/gt = 0.73 ± 0.10; two independent experiments). (B) Paired pulse ratio is not altered in Pclogt/gt neurons (Pclowt/wt = 1.00 ± 0.03, Pclogt/gt = 1.06 ± 0.03; two independent experiments). (C) Vesicle release probability is not changed upon Piccolo loss (Pclowt/wt = 1 ± 0.13, Pclogt/gt = 1.03 ± 0.13; two independent experiments). (D) The readily releasable pool of vesicles (RRP) in Pclogt/gt neurons is not altered (Pclowt/wt = 1 ± 0.15, Pclogt/gt = 0.83 ± 0.11; two independent experiments). (E) Loss of Piccolo causes an increase in EPSC amplitude depression during 10 Hz train stimulation (Pclowt/wt : 34 cells, Pclogt/gt : 35 cells; two independent experiments). (F) Images of hippocampal neurons immuno-stained with Synaptophysin antibodies. (G) Quantitation of (F). Synaptophysin intensities/bouton are significantly decreased in Pclogt/gt neurons (Pclowt/wt = 1 ± 0.01, n = 3457 puncta; Pclogt/gt = 0.81 ± 0.01, n = 2916 puncta; 13 independent experiments). (H) Images from FM4-64 dye uptake experiments. (I) Quantification of (H). FM4-64 dye uptake is significantly reduced in Pclogt/gt neurons (Pclowt/wt = 1 ± 0.01, n = 1026 puncta; Pclogt/gt = 0.69 ± 0.01, n = 867 puncta; four independent experiments). (J) Selected images of synaptic boutons releasing loaded FM1-43 dye during a 900 AP 10 Hz stimulation. (K) Quantification of changes in FM1-43 dye intensities per bouton over time. Note, FM1-43 unloading rate is slower in Pclogt/gt versus Pclowt/wt neurons. In Pclowt/wt neurons, about 70% of the initially loaded FM1-43 dye is released within 90 s of stimulation (Pclowt/wt = 74.62 ± 0.6607, n = 244 synapses, three independent experiments), whereas in Pclogt/gt neurons only about 45% is released (Pclogt/gt = 45.47 ± 1.468, n = 155 synapses, three independent experiments). Scale bar in F, H and J 10 μm, scale bar in zoom in F and H 5 μm. Numbers in bar graphs (A–D) represent number of cells/number of cultures. Error bars in bar graph represent 95% confidence intervals. Numbers given represent mean ± SEM, Student`s t –test. **** denotes p<0.0001.
-
Figure 3—source data 1
This spreadsheet contains the normalized values used to generate the bar plots shown in Figure 3C,D,F,G,I and K.
- https://doi.org/10.7554/eLife.46629.008
-
Figure 3—source data 2
This file contains custom-made ImageJ script used to analyze intensities in manually picked ROIs.
- https://doi.org/10.7554/eLife.46629.009
Figure 4 with 2 supplements
Levels of endosome proteins are reduced at synapses lacking Piccolo.
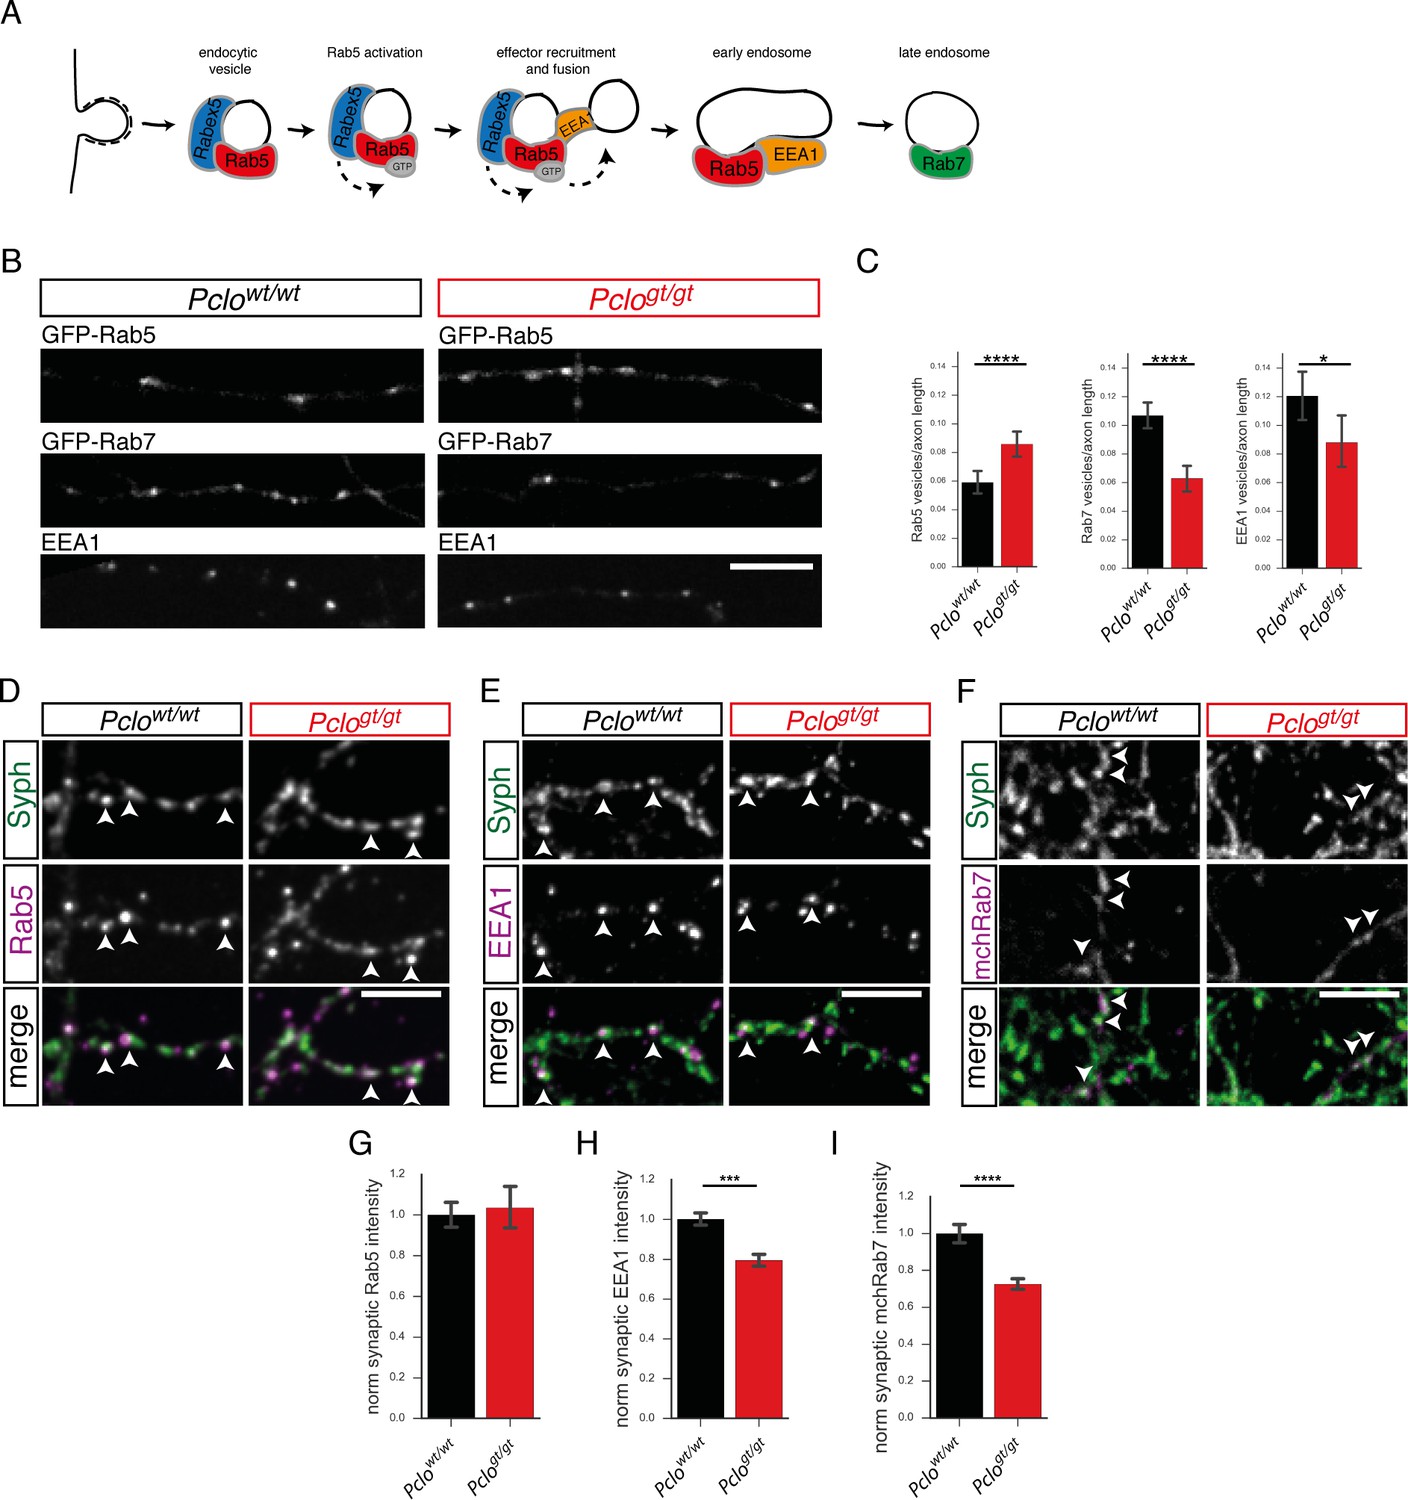
(A) Schematic of SV membrane trafficking, illustrating when Rab5, EEA1 and Rab7 become associated with endosomal membranes. (B) Images of axon segments expressing GFP-Rab5 or GFP-Rab7 or immuno-stained with antibodies against EEA1. (C) Quantification of B. In Pclowt/wt neurons, fewer GFP-Rab5 puncta are present per unit length of axon (Pclowt/wt = 0.06 ± 0.004, n = 139 axon sections; Pclogt/gt = 0.08 ± 0.004, n = 143 axon sections; three independent experiments). In Pclowt/wt neurons, more GFP-Rab7 puncta are present per unit length of axon (Pclowt/wt = 0.11 ± 0.004, n = 139 axon sections; Pclogt/gt = 0.06 ± 0.004, n = 142 axon sections; two independent experiments). In Pclowt/wt neurons, more EEA1 positive puncta are present per unit length of axon compared to Pclogt/gt neurons (Pclowt/wt = 0.12 ± 0.01, n = 29 axon sections; Pclogt/gt = 0.09 ± 0.004, n = 34 axon sections; two independent experiments). (D–F) Immunocytochemical stainings of hippocampal neurons for endosome proteins. (D) Rab5 is present at Pclowt/wt and Pclogt/gt synapses, no differences in intensities are detectable. (E) EEA1 intensities are significantly reduced in Pclogt/gt synapses. (F) mChRab7 intensities are significantly reduced in Pclogt/gt synapses. (G–I) Quantification of (D–F). (G) The levels of Rab5 are not altered between Pclowt/wt and Pclogt/gt synapses (Pclowt/wt = 1 ± 0.03, n = 808 synapses; Pclogt/gt = 1.04 ± 0.05, n = 773 synapses; three independent experiments). (H) EEA1 intensity is significantly reduced in Pclogt/gt synapses (Pclowt/wt = 1 ± 0.02, n = 4323 synapses; Pclogt/gt = 0.79 ± 0.02, n = 3939 synapses; 10 independent experiments). (I) mChRab7 intensity is reduced in Pclogt/gt synapses (Pclowt/wt = 1 ± 0.03, n = 386 synapses; Pclogt/gt = 0.72 ± 0.02, n = 525 synapses; three independent experiments). Scale bar represents 10 μm. Error bars in bar graph represent 95% confidence intervals. Numbers given represent mean ± SEM, Student`s t -test. * denotes p<0.05, *** denotes p<0.001 and **** denotes p<0.0001.
-
Figure 4—source data 1
This spreadsheet contains the normalized values used to generate the bar plots shown in Figure 4C,H,I and J.
- https://doi.org/10.7554/eLife.46629.013
Figure 4—figure supplement 1
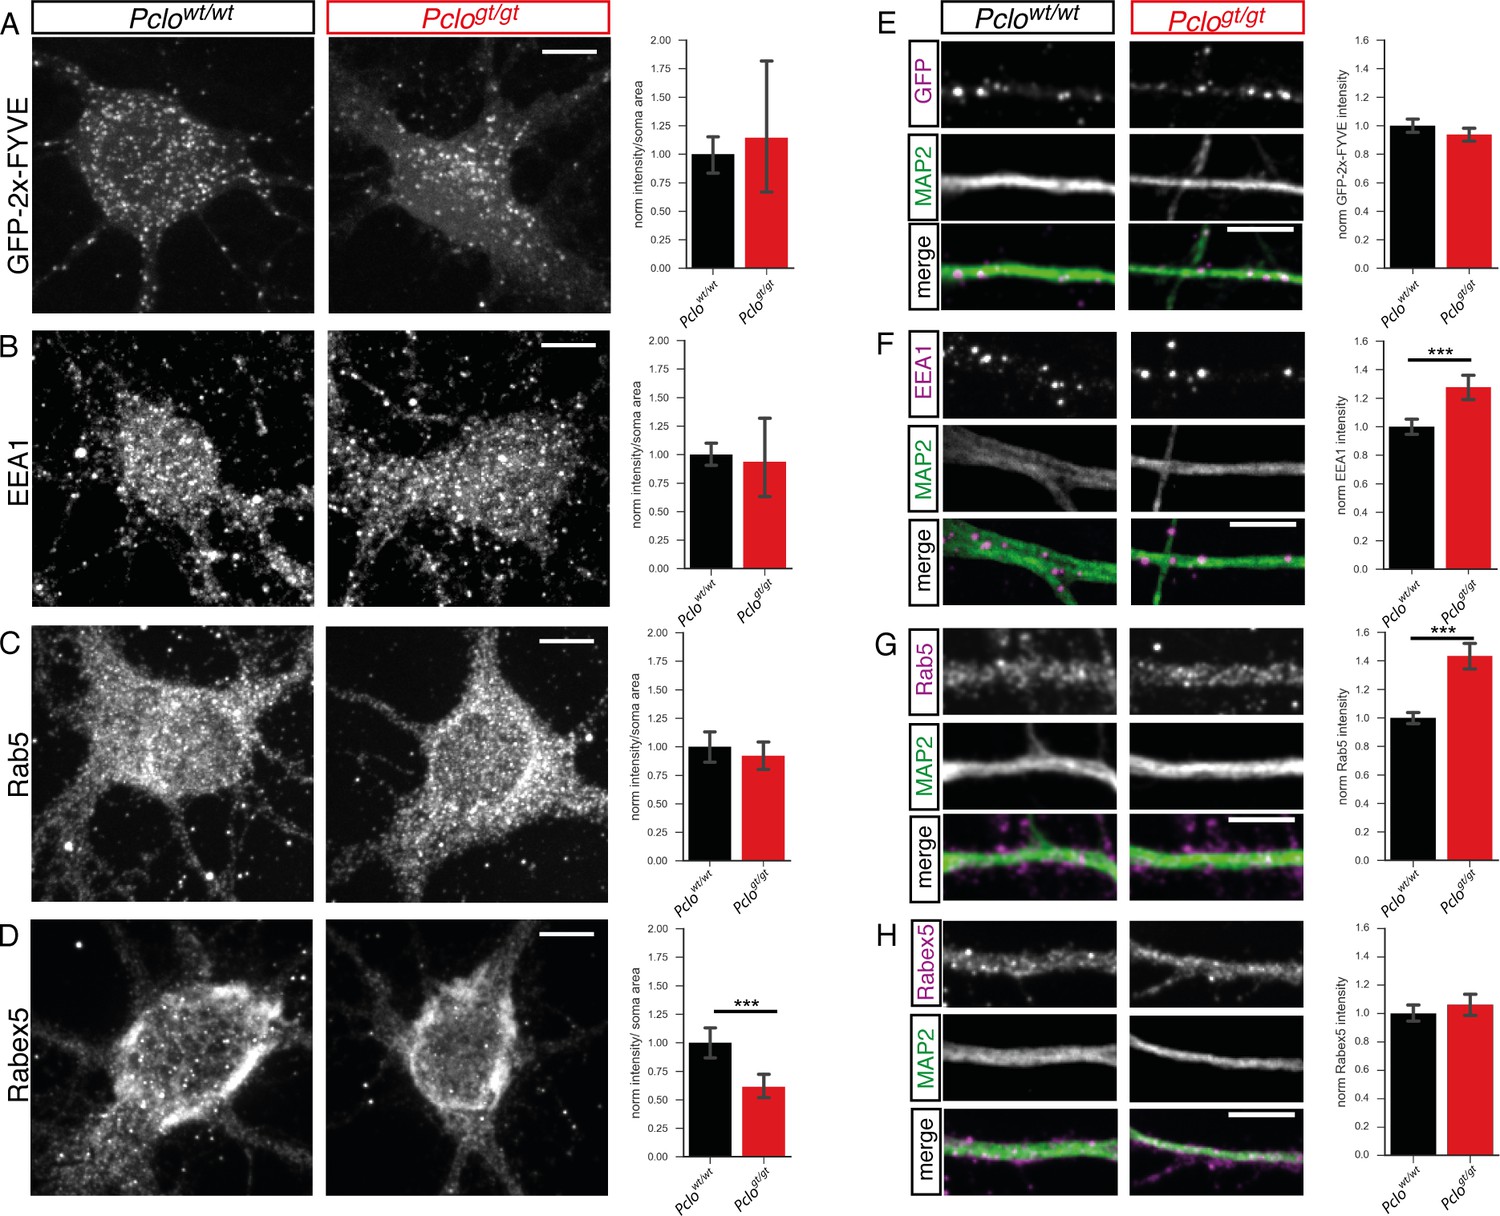
Levels of endosome proteins are not altered in the soma or along dendrites in Pclogt/gt neurons.
Cultured hippocampal Pclowt/wt or Pclogt/gt neurons were stained for different endosome proteins. Subsequently, their intensity was measured in the cell soma (A–D) or along dendrites (E–H) marked by MAP2. No difference in the staining intensity of GFP-2x-FYVE (A), EEA1 (B) or Rab5 (C) is detectable at the somata of Pclowt/wt vs Pclogt/gt neurons (GFP-2x-FYVE: Pclowt/wt = 1 ± 0.08, n = 16 soma; Pclogt/gt = 1.14 ± 0.32, n = 10 soma; three independent experiments; EEA1: Pclowt/wt = 1 ± 0.05, n = 34 soma; Pclogt/gt = 0.94 ± 0.16, n = 19 soma; p=0.6559; five independent experiments; Rab5: Pclowt/wt = 1 ± 0.07, n = 18 soma; Pclogt/gt = 0.92 ± 0.06, n = 18 soma; p=0.4158; three independent experiments). (D ) Rabex5 intensity is decreased at somata of Pclogt/gt neurons (Pclowt/wt = 1 ± 0.07, n = 16 soma; Pclogt/gt = 0.65 ± 0.06, n = 15 soma; two independent experiments). (E) Intensity of GFP-2x-FYVE (GFP) organelles along MAP2 positive dendrites is not different between Pclowt/wt and Pclogt/gt neurons (Pclowt/wt = 1 ± 0.02, n = 451 puncta; Pclogt/gt = 0.94 ± 0.02, n = 400; two independent experiments). (F) In Pclogt/gt neurons, the intensity of EEA1-positive organelles along MAP2 positive dendrites is increased (Pclowt/wt = 1 ± 0.03, n = 462 puncta; Pclogt/gt = 1.28 ± 0.04, n = 358; two independent experiments). (G and H) Intensity of Rab5 (G) along Pclogt/gt dendrites is increased compared to Pclowt/wt dendrites, however intensity of Rabex5 (H) is not different (Rab5: Pclowt/wt = 1 ± 0.02, n = 405 puncta; Pclogt/gt = 1.43 ± 0.05, n = 372; three independent experiments; Rabex5: Pclowt/wt = 1 ± 0.03, n = 232 puncta; Pclogt/gt = 1.06 ± 0.04, n = 278; two independent experiments). Scale bar represents 10 μm. Error bars in bar graph represent 95% confidence intervals. Numbers given represent mean ± SEM. Student`s t –test. *** denotes p<0.001.
Figure 4—figure supplement 2
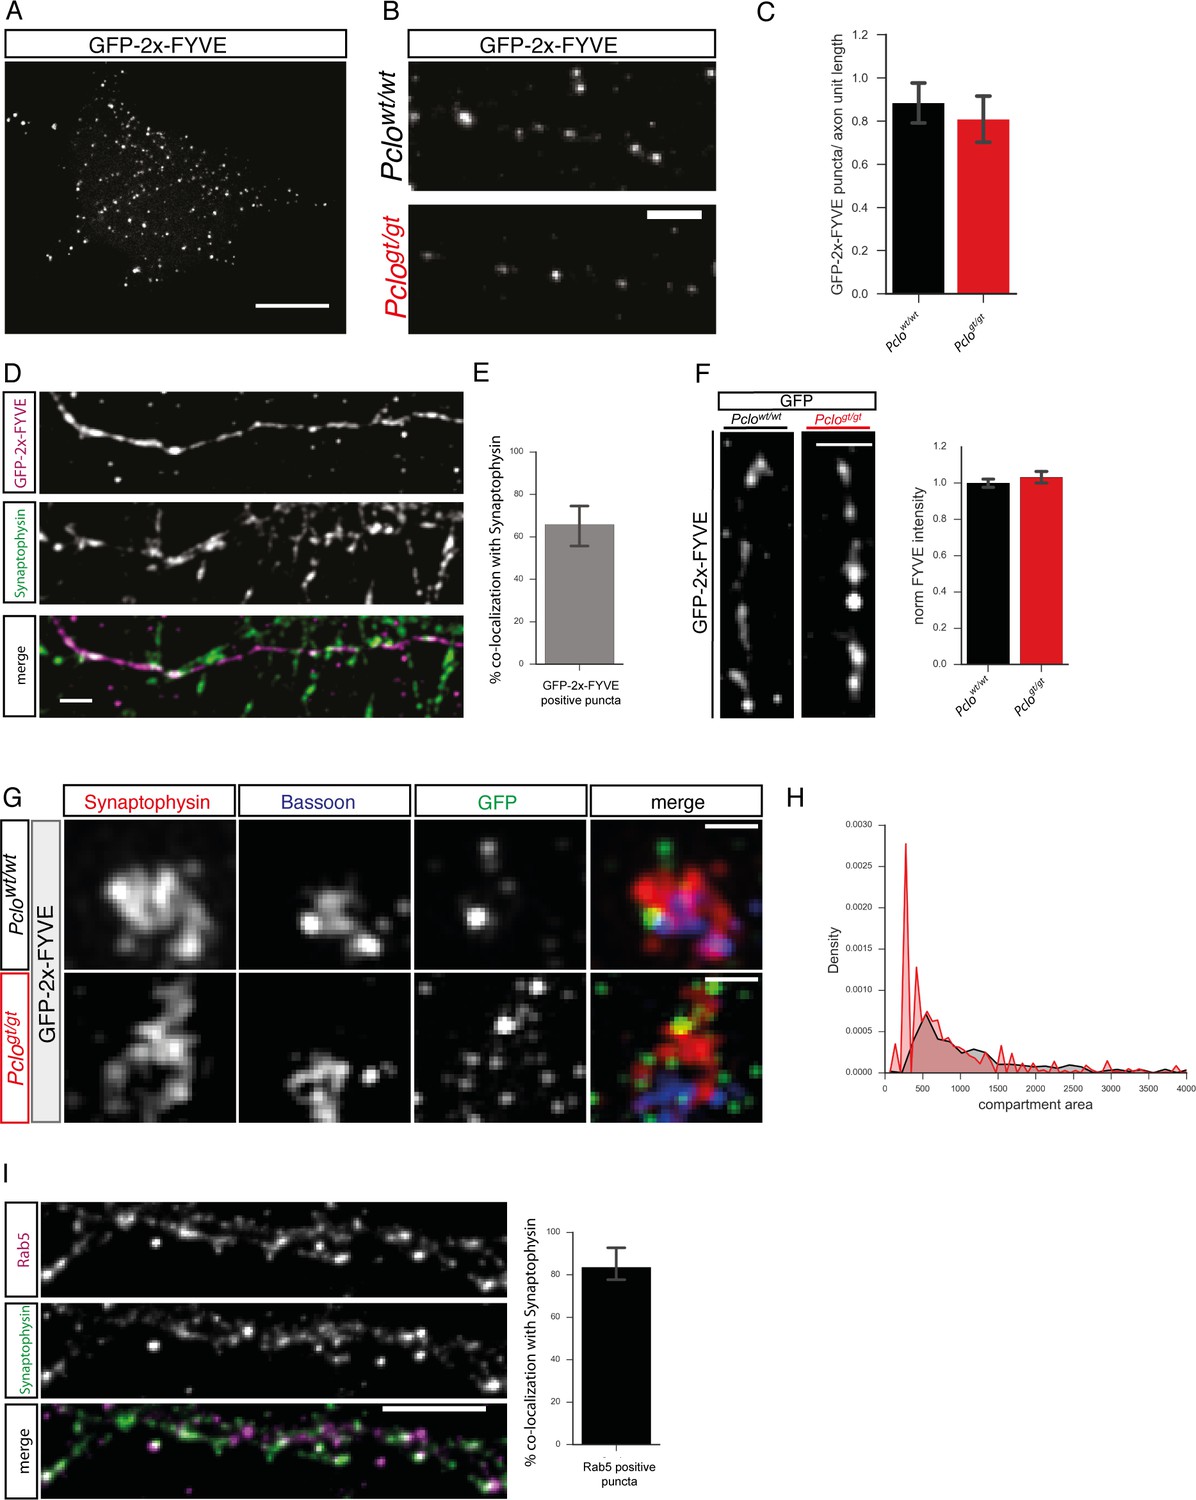
PI3P in Piccolo Pclowt/wt and Pclogt/gt synapses.
(A) GFP-2x-FYVE was used as a reporter for PI3P. In HEK293 cells, GFP-2x-FYVE decorates single vesicular early endosomes. (B) Lentiviral expression of GFP-2x-FYVE in primary hippocampal Pclowt/wt and Pclogt/gt neurons decorates small organelles along axons indicating the presence of PI3P. (C) Quantification of (B). The number of GFP-2x-FYVE-positive organelles along axons is not altered in Pclogt/gt compared to Pclowt/wt neurons (Pclowt/wt = 0.88 ± 0.05, n = 39 axons; Pclogt/gt = 0.80 ± 0.05; three independent experiments). (D) Pclowt/wt neurons expressing GFP-2x-FYVE stained for Synaptophysin. Many of GFP-2x-FYVE positive puncta along axons co-localize with synapses marked by Synaptophysin. (E) Quantification of (D). 65.88 ± 5.46% of GFP-2x-FYVE-positive puncta co-localize with Synaptophysin. (F) Images representing GFP-2x-FYVE puncta along axons in Pclowt/wt as well as Pclogt/gt neurons. GFP-2x-FYVE intensity is slightly but not significantly increased in Pclogt/gt neurons (Pclowt/wt = 1 ± 0.02, n = 1516 synapses; Pclogt/gt = 1.03 ± 0.02, n = 1137 synapses; 11 independent experiments). (G) Super resolution structural illumination microscopy (SIM) of Pclowt/wt and Pclogt/gt neurons expressing GFP-2x-FYVE. Synaptic vesicle clusters marked with Synaptophysin (red) can be spatially separated from the active zone protein Bassoon (blue). The PI3P-positive compartment lies above the active zone within the vesicle cluster. The size of GFP-2x-FYVE organelles appears smaller in Pclogt/gt terminals compared to Pclowt/wt terminals. (H) Histogram of the area of the measured GFP-2x-FYVE compartments reveals that the size of GFP-2x-FYVE organelles, in Pclogt/gt neurons, is shifted towards smaller areas (n = 2 independent experiments). (I) % co-localization of Rab5 positive puncta with Synaptophysin. 83,56 ± 4.67% of Rab5 positive puncta co-localize with Synaptophysin (three independent experiments). Scale bar in A, B and D represents 10 μm. Scale bar in F represents 500 nm. Error bars in bar graph represent 95% confidence intervals. Numbers given represent mean ± SEM, Student`s t-test.
Figure 5 with 1 supplement
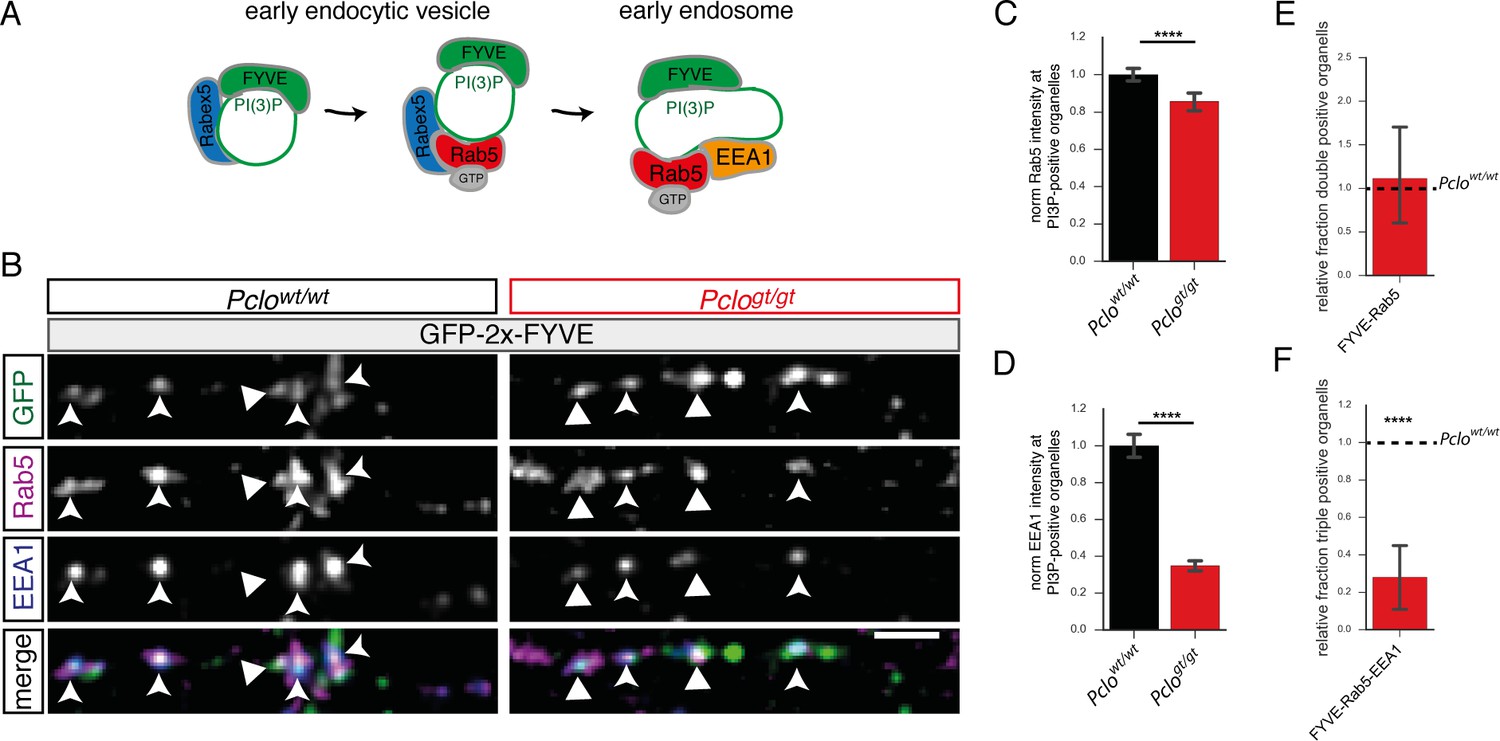
Fewer endosome proteins are recruited towards PI3P-positive organelles along axons lacking Piccolo.
(A) Schematic of early endocytic trafficking steps. After pinching off from the plasma membrane early endocytic vesicles undergo consecutive maturation steps. The lipid PI3P is generated and a stable complex consisting of Rab5 and its GEF Rabex5 is formed creating a pool of active Rab5. This step is necessary to recruit EEA1 and form early endosomes. (B) Images depicting Rab5 and EEA1 intensities at GFP-2x-FYVE organelles along axons in Pclogt/gt vs Pclowt/wt neurons. (C–F) Quantification of B. (C) The levels of Rab5 at PI3P-positive organelles are decreased (Pclowt/wt = 1 ± 0.02, n = 1645 puncta; Pclogt/gt = 0.81 ± 0.02, n = 1233 puncta; six independent experiments). (D) The amount of EEA1 at endosome membranes is reduced (Pclowt/wt = 1 ± 0.04, n = 1634 puncta; Pclogt/gt = 0.37 ± 0.02, n = 1169 puncta; six independent experiments). (E) Quantification of double positive compartments along axons. The fraction of GFP-2x-FYVE/Rab5 is not altered (Pclogt/gt = 0.97 ± 0.33, n = 5 independent experiments). (F) The relative percentage of GFP-2x-FYVE/Rab5/EEA1 positive vesicles is decreased in Pclogt/gt neurons (GFP-2x-FYVE/Rab5/EEA1: Pclogt/gt = 0.28 ± 0.10, n = 6 independent experiments). Scale bars represent 10 μm. Error bars in bar graph represent 95% confidence intervals. Numbers given represent mean ± SEM, Student`s t -test. * denotes p<0.05, ** denotes p<0.01, *** denotes p<0.001 and **** denotes p<0.0001.
-
Figure 5—source data 1
This spreadsheet contains the normalized values used to generate the bar plots shown in Figure 5C,D,E and F.
- https://doi.org/10.7554/eLife.46629.016
Figure 5—figure supplement 1
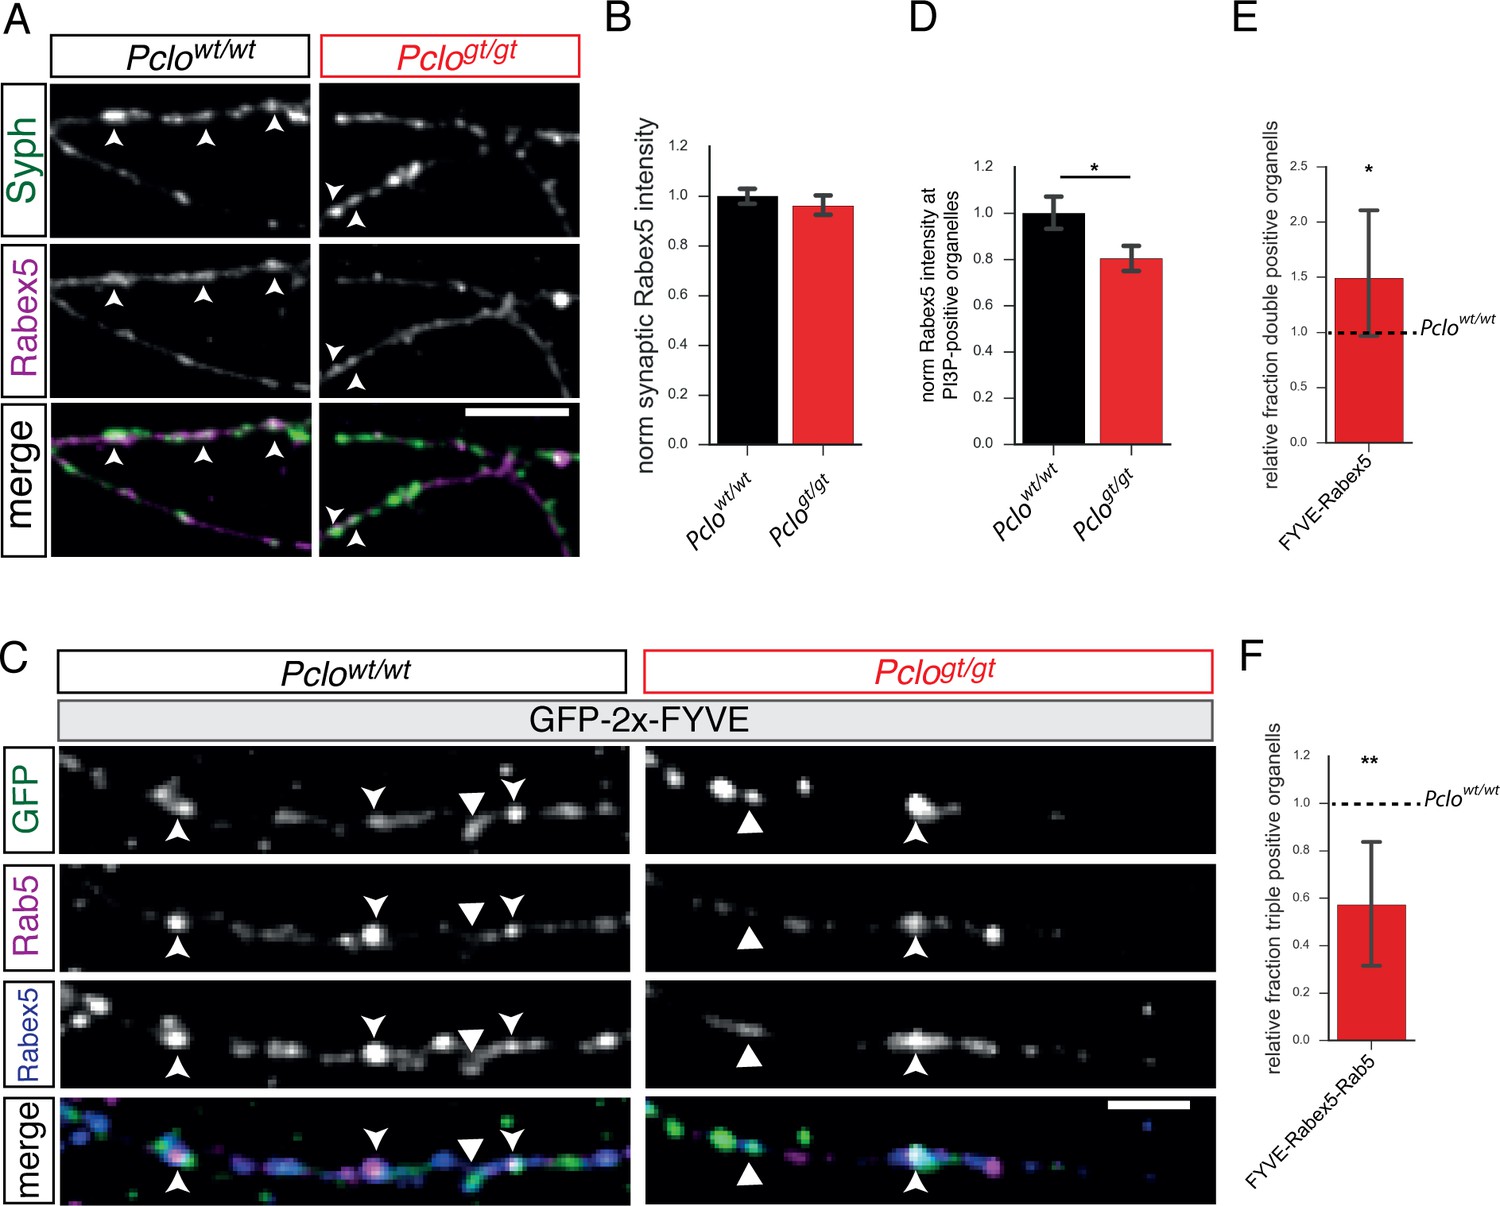
Synaptic Rabex5 levels as well as Rabex5 amounts at PI3P-positive organelles are reduced in neurons lacking Piccolo.
(A) Immunocytochemical staining of hippocampal neurons for Rabex5. (B) Quantification of (A). Rabex5 is present at Pclowt/wt and Pclogt/gt synapses, no difference in the intensities is detectable (Pclowt/wt = 1 ± 0.02, n = 2397 synapses; Pclogt/gt = 0.96 ± 0.02, n = 1802 synapses; seven independent experiments). (C) Images depicting Rabex5 intensities at PI3P-positive organelles. (D) Quantification of (C). Less Rabex5 is present at PI3P-positive membranes in Pclogt/gt neurons (Pclowt/wt = 1 ± 0.04, n = 728 puncta; Pclogt/gt = 0.80 ± 0.03, n = 652 puncta; six independent experiments). (E) Quantification of double positive compartments along axons. The fraction of GFP-2x-FYVE/Rabex5 double positive vesicles is increased in Pclogt/gt neurons (Pclogt/gt = 1.49 ± 0.33, n = 5 independent experiments). (F) The relative percentage of GFP-2x-FYVE-Rabex5-Rab5 triple positive compartments is decreased in Pclogt/gt neurons (Pclogt/gt = 0.57 ± 0.14, n = 5 independent experiments). Scale bar represents 10 μm. Error bars in bar graph represent 95% confidence intervals. Numbers given represent mean ± SEM, Student`s t-test.
Figure 6
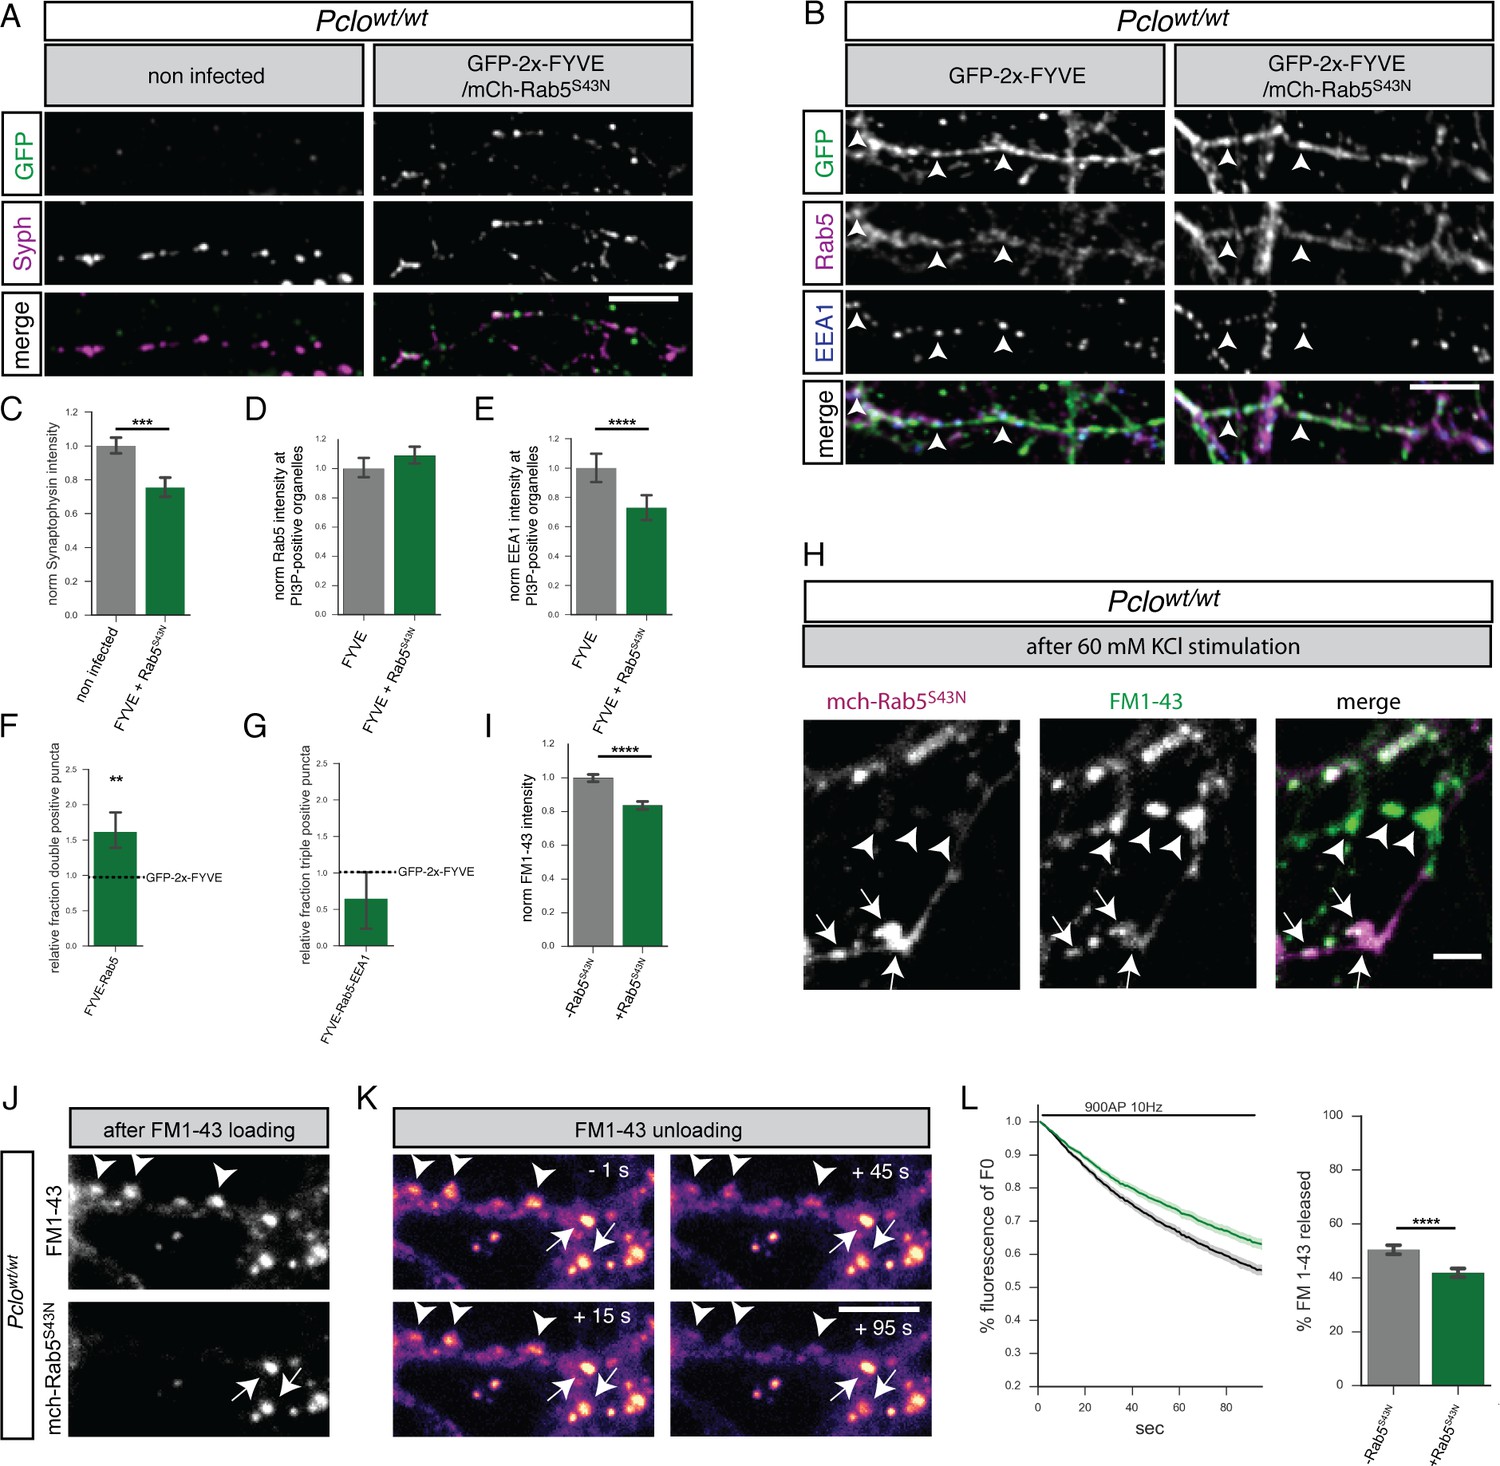
GDP-locked Rab5 (Rab5S34N) expression in Pclowt/wt neurons decreases Synaptophysin levels and the number of early endosomes.
(A) Images of Pclowt/wt neurons expressing GFP-2x-FYVE and mCh-Rab5S34N immuno-stained with Synaptophysin antibodies. (B) Images of Pclowt/wt neurons expressing GFP-2x-FYVE and mCh-Rab5S34N immuno-stained with GFP, Rab5 and EEA1 antibodies. (C) Quantification of (A). Synaptophysin levels are reduced in neurons expressing Rab5S34N (Pclowt/wt = 1 ± 0.02, n = 204 synapses; Pclowt/wt + mCh-Rab5S34N = 0.75 ± 0.03, n = 139 synapses; two independent experiments). (D–G) Quantification of B. (D) mCh-Rab5S34N expression slightly increases Rab5 levels at PI3P-positive organelles (Pclowt/wt = 1 ± 0.03, n = 930 puncta; Pclowt/wt + mCh-Rab5S34N = 1.09 ± 0.03, n = 612 puncta; three independent experiments). (E) EEA1 levels at PI3P-positive organelles decrease upon mCh-Rab5S34N expression (Pclowt/wt = 1 ± 0.05, n = 930 puncta; Pclowt/wt + mCh-Rab5S34N = 0.73 ± 0.04, n = 613; three independent experiments). (F) More FYVE/Rab5 positive organelles are present in mCh-Rab5S34N expressing neurons (Pclowt/wt = 1 ± 0; Pclowt/wt + mCh-Rab5S34N = 1.614 ± 0.15; n = 4 independent experiments). (G) Fewer FYVE/Rab5/EEA1 triple positive organelles are present in mCh-Rab5S34N expressing neurons (Pclowt/wt = 1 ± 0; Pclowt/wt + mCh-Rab5S34N = 0.64 ± 0.22; n = 4 independent experiments). (H) Representative images depicting FM1-43 uptake efficiency after KCl stimulation in boutons either expressing Rab5S34N (arrow) or not (arrowhead). (I) Quantification of (H). Less FM1-43 dye is taken up during KCl stimulation in the presence of mCh-Rab5S34N (Pclowt/wt = 1 ± 0.01, n = 732 puncta; Pclowt/wt + mCh-Rab5S34N = 0.84 ± 0.01, n = 866 puncta; three independent experiments). (J) Images showing FM1-43 levels in Pclowt/wt neurons expressing mCh-Rab5S34N after 900AP 10 Hz field stimulation. (K) Representative images showing FM1-43 unloading kinetics in synapses shown in (J) (note boutons expressing or not expressing mCh-Rab5S34N are labeled with arrows or arrowheads, respectively). (L) Quantification of (K). Neurons expressing mCh-Rab5S34N (green trace) release less FM1-43 dye with slower kinetics compared to Pclowt/wt neurons (black trace) (Pclowt/wt = 50.43 ± 0.8471, n = 293 synapses; Pclowt/wt + mCh-Rab5S34N = 41.79 ± 0.8052, n = 421 synapses, three independen experiments). Scale bars in A and B represent 10 μm, in H and K 5 μm, Error bars in bar graph represent 95% confidence intervals. Numbers given represent mean ± SEM Students`s t - test. * denotes p<0.05, ** denotes p<0.01, *** denotes p<0.001, **** denotes p<0.0001.
-
Figure 6—source data 1
This spreadsheet contains the normalized values used to generate the bar plots shown in Figure 6D,E,F,G,I and L.
- https://doi.org/10.7554/eLife.46629.018
Figure 7
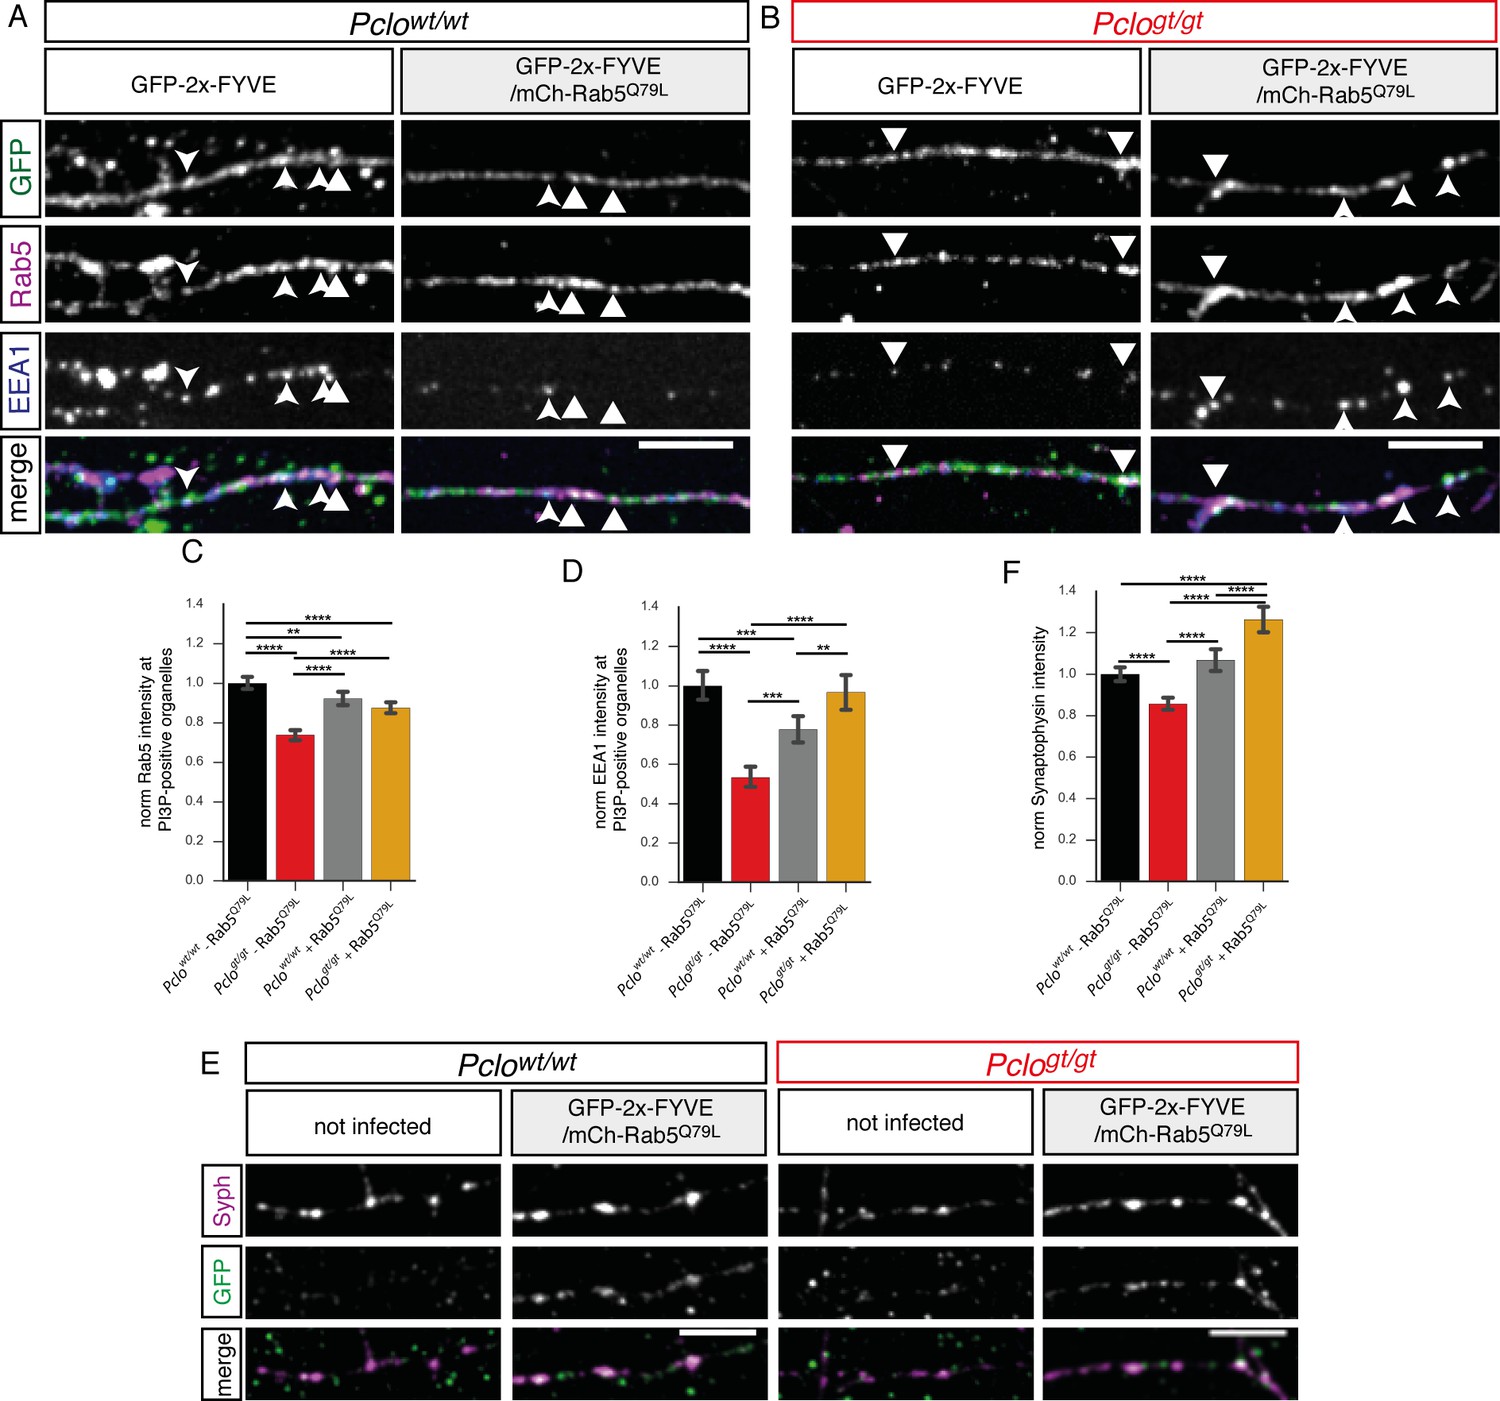
Expression of GTPase deficient Rab5 (Rab5Q79L) in Pclogt/gt neurons rescues EEA1 levels at PI3P containing membranes and Synaptophysin back to Pclowt/wt levels.
(A–B) Rab5 and EEA1 levels at GFP-2x-FYVE organelles along axons in Pclowt/wt (A) and Pclogt/gt (B) neurons and those expressing mCh-Rab5Q79L. (B) In Pclogt/gt neurons, mCh-Rab5Q79L expression increases Rab5 and EEA1 level at GFP-2x-FYVE organelles towards Pclowt/wt levels. (C–D) Quantification of (A and B). (C) mCh-Rab5Q79L expression in Pclowt/wt neurons slightly reduces Rab5 levels at GFP-2x-FYVE membranes (Pclowt/wt = 1 ± 0.02, n = 1066 puncta; Pclowt/wt (mCh-Rab5Q79L)=0.93 ± 0.02, n = 979 puncta; three independent experiments). mCh-Rab5Q79L expression in Pclogt/gt neurons increases Rab5 levels at PI3P-positive organelles (Pclogt/gt = 0.74 ± 0.01, n = 840 puncta; Pclogt/gt (mCh-Rab5Q79L)=0.87 ± 0.01, n = 1185 puncta; three independent experiments). (D) In Pclowt/wt neurons mCh-Rab5Q79L expression causes EEA1 levels to drop (Pclowt/wt = 1 ± 0.04, n = 1066 puncta; Pclowt/wt (mCh-Rab5Q79L)=0.77 ± 0.04, n = 979 puncta; three independent experiments). mCh-Rab5Q79L expression rescues EEA1 levels in Pclogt/gt neurons (Pclogt/gt = 0.53 ± 0.03, n = 840 puncta; Pclogt/gt (mCh-Rab5Q79L)=0.97 ± 0.05, n = 1185 puncta; three independent experiments). (E) mCh-Rab5Q79L expression in Pclowt/wt neurons increases Synaptophysin intensities. (F) Quantification of (E). Synaptophysin puncta intensity slightly increases upon mCh-Rab5Q79L expression in Pclowt/wt neurons. In Pclogt/gt neurons, mCh-Rab5Q79L expression rescues Synaptophysin levels higher than Pclowt/wt levels (Pclowt/wt = 1 ± 0.02, n = 620 synapses; Pclogt/gt = 0.86 ± 0.02, n = 526 synapses; Pclowt/wt (mCh-Rab5Q79L)=1.07 ± 0.03, n = 473 synapses; Pclogt/gt (mCh-Rab5Q79L)=1.26 ± 0.03, n = 446 synapses; three independent experiment). Scale bars represent 10 μm. Error bars in bar graph represent 95% confidence intervals. Numbers given represent mean ± SEM. C, D and H ANOVA with Tukey multi comparison test. ** denotes p<0.01, *** denotes p<0.001 and **** denotes p<0.0001.
-
Figure 7—source data 1
This spreadsheet contains the normalized values used to generate the bar plots shown in Figure 7C,D and F.
- https://doi.org/10.7554/eLife.46629.020
Figure 8 with 2 supplements
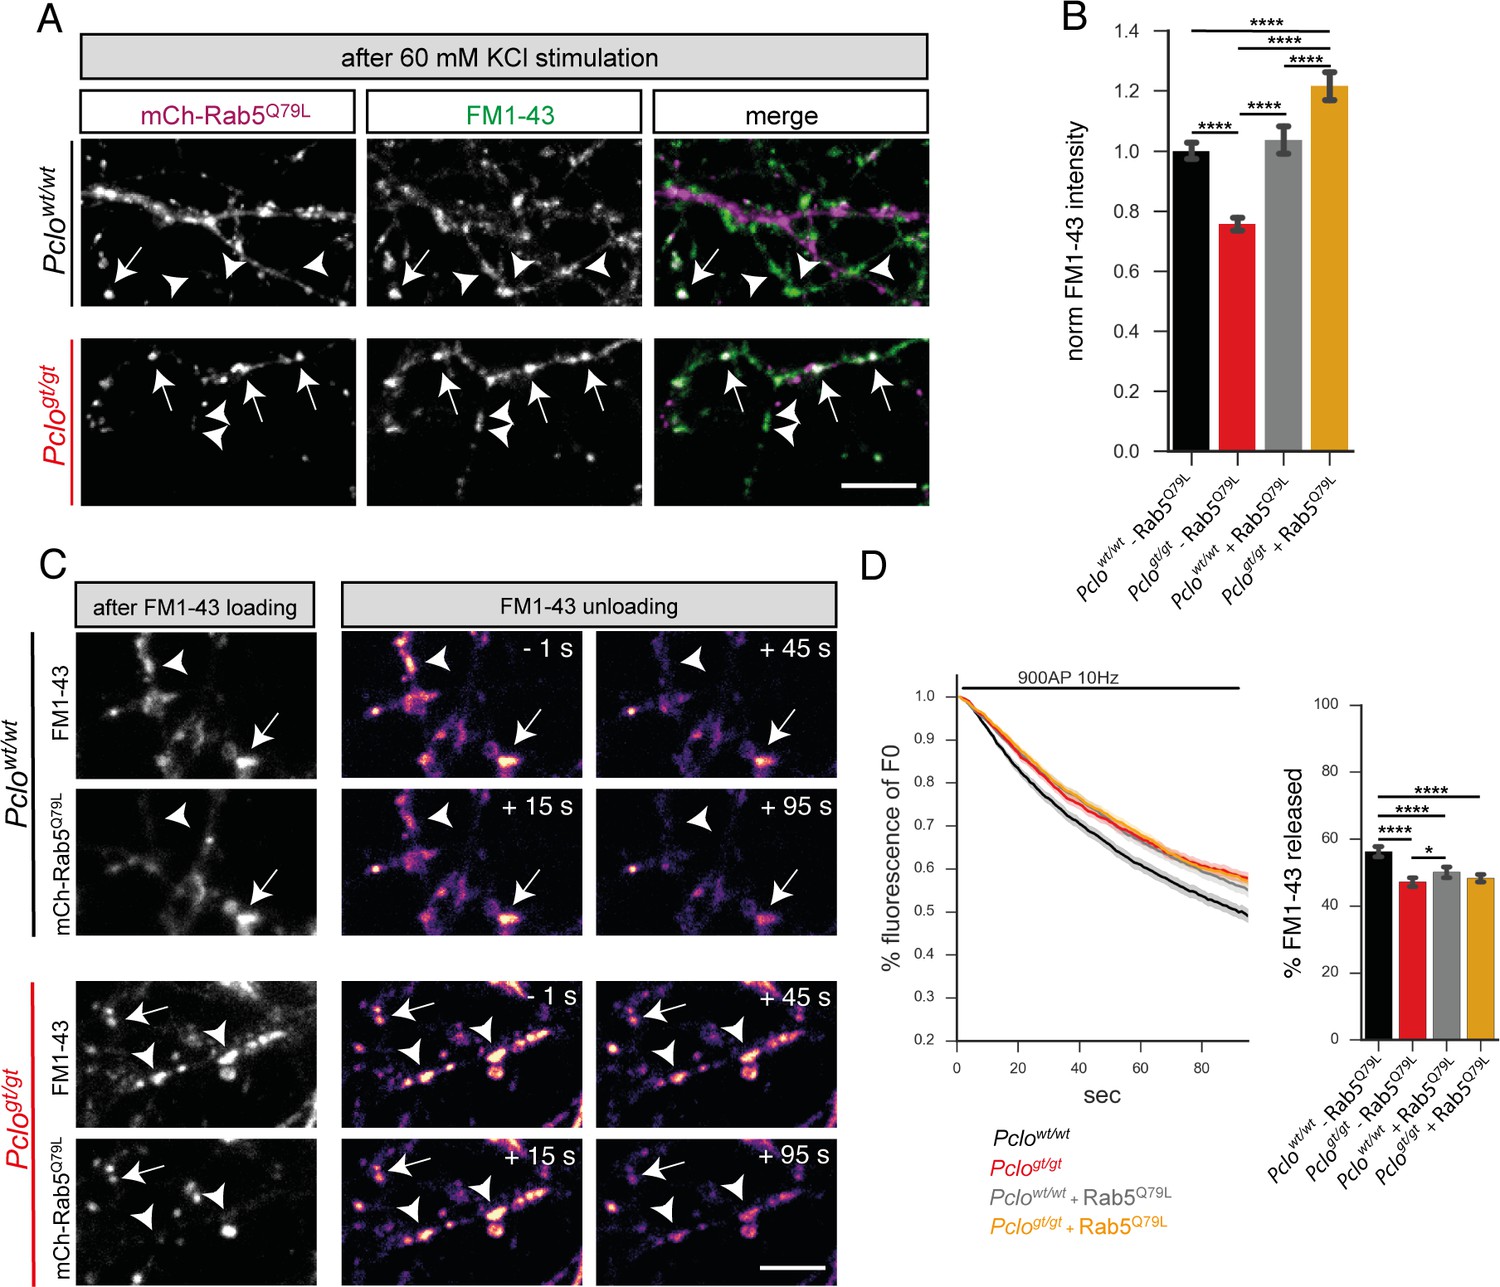
Expression of GTPase deficient Rab5 (Rab5Q79L) in Pclogt/gt neurons rescues the size of the total recycling pool of vesicles but not FM1-43 unloading kinetics.
(A) Representative images showing FM1-43 levels in Pclowt/wt and Pclogt/gt boutons either positive (arrow) or negative (arrowhead) for mCh-Rab5Q79L after 60 mM KCl stimulation. (B) Quantification of (A). (Pclowt/wt = 1 ± 0.01, n = 528 puncta; Pclogt/gt = 0.76 ± 0.01, n = 654 puncta; Pclowt/wt (mCh-Rab5Q79L)=1.04 ± 0.02, n = 304 puncta; Pclogt/gt (mCh-Rab5Q79L)=1.22 ± 0.02, n = 337 puncta; three independent experiments). (C) Left: Images depicting FM1-43 intensities in Pclowt/wt and Pclogt/gt boutons either positive (arrow) or negative (arrowhead) for mCh-Rab5Q79L. Right: Images depicting FM1-43 unloading kinetics in Pclowt/wt and Pclogt/gt boutons either positive (arrow) or negative (arrowhead) for mCh-Rab5Q79L. (D) Quantification of (C). The presence of mCh-Rab5Q79L is not sufficient to rescue slowed FM1-43 unloading kinetics and total amount of FM1-43 dye released in Pclogt/gt boutons (Pclogt/gt = 47.24 ± 0.68, n = 361 synapses; Pclogt/gt(Rab5Q79L)=48.33 ± 0.53, n = 479 synapses; four independent experiments). In Pclowt/wt boutons expressing mCh-Rab5Q79L, FM1-43 unloading kinetics are slowed and total amounts of dye released are reduced similar to what is observed in Pclogt/gt boutons (Pclowt/wt = 56.28 ± 0.81, n = 301 synapses; Pclowt/wt(Rab5Q79L)=50.15 ± 0.85, n = 342 synapses; four independent experiments). Scale bars represent 5 μm. Error bars in bar graph represent 95% confidence intervals. Numbers given represent mean ± SEM. ANOVA with Tukey multi comparison test. * denotes p<0.05, **** denotes p<0.0001.
-
Figure 8—source data 1
This spreadsheet contains the normalized values used to generate the bar plots shown in Figure 8B and D.
- https://doi.org/10.7554/eLife.46629.024
Figure 8—figure supplement 1
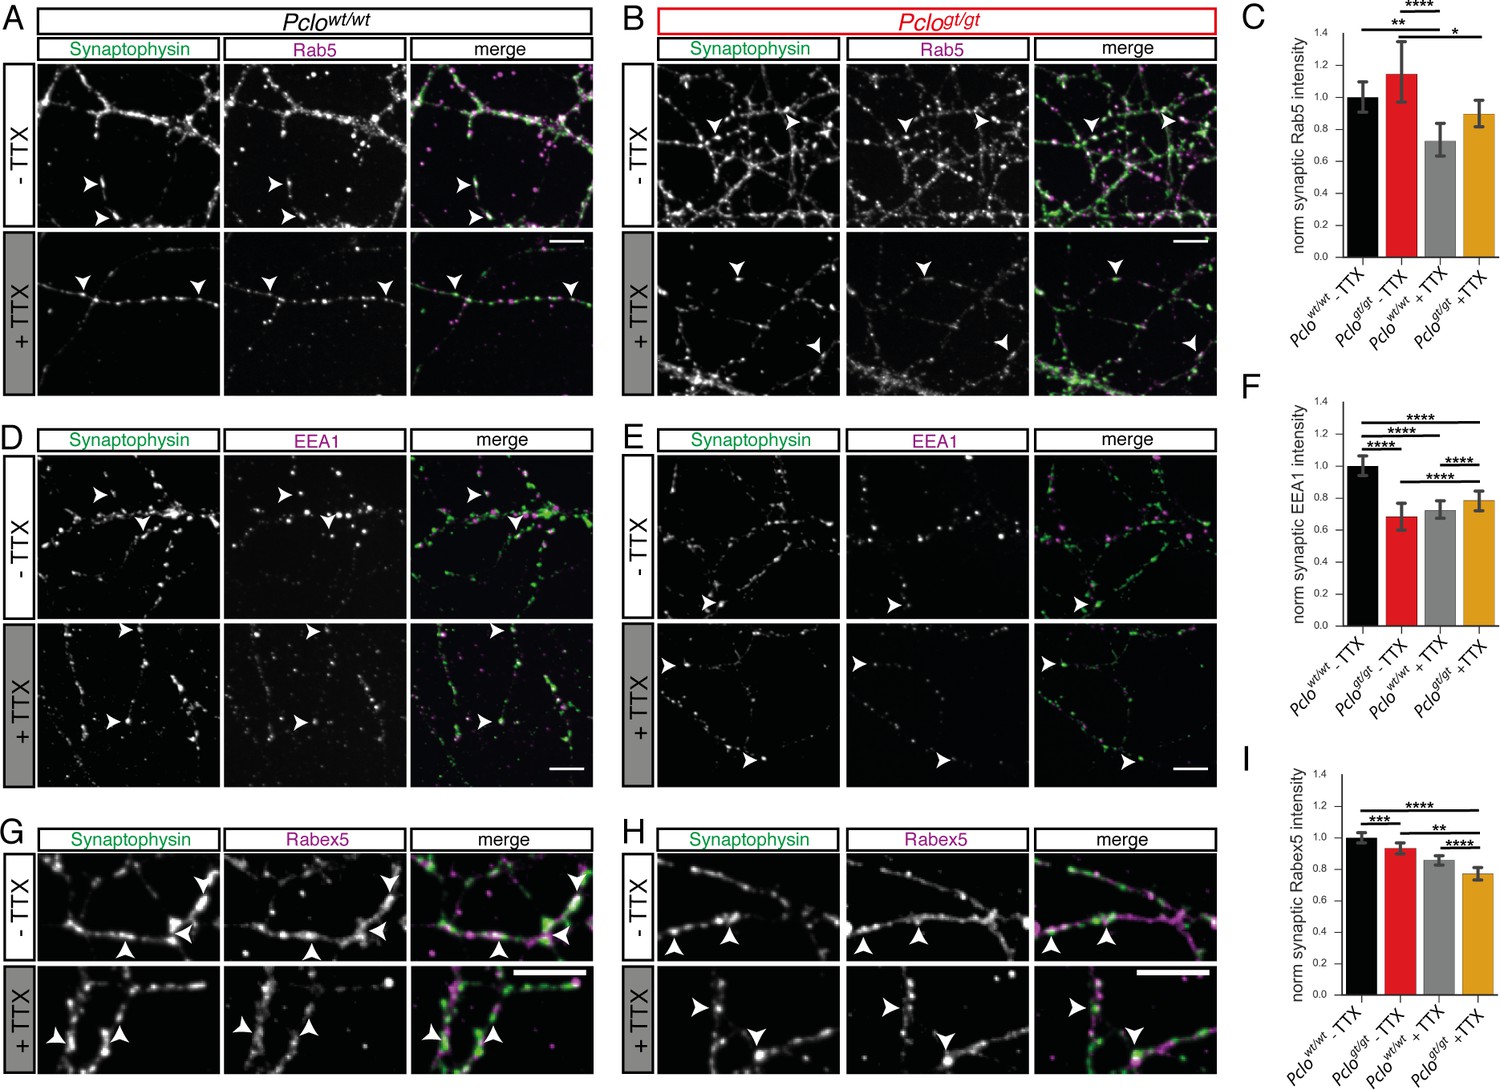
Silencing synaptic activity affects synaptic levels of endosome proteins in Pclowt/wt and Pclogt/gt neurons.
(A and B) Images of Pclowt/wt (A) and Pclogt/gt (B) neurons stained for Synaptophysin and Rab5 with and without TTX treatment. (C) Quantification of (A and B). Synaptic Rab5 levels do not significantly alter in Pclowt/wt and Pclogt/gt synapses upon TTX treatment (Pclowt/wt = 1 ± 0.05, n = 391 synapses; Pclowt/wt (TTX) = 0.73 ± 0.05, n = 482 synapses; Pclogt/gt = 1.14 ± 0.09, n = 400 synapses; Pclogt/gt (TTX) = 0.90 ± 0.04, n = 372 synapses; two independent experiments). (D and E) Images of Pclowt/wt (D) and Pclogt/gt (E) neurons stained for Synaptophysin and EEA1 with and without TTX treatment. (F) Quantification of (D and E). In Pclowt/wt synapses EEA1 levels drop upon TTX treatment (Pclowt/wt = 1 ± 0.03, n = 1653 synapse; Pclowt/wt (TTX) = 0.72 ± 0.03, n = 1887 synapses; four independent experiments). In contrast, EEA1 levels slightly increase in Pclogt/gt synapses due to TTX treatment (Pclogt/gt = 0.68 ± 0.04, n = 918; Pclogt/gt (TTX) = 0.78 ± 0.03, n = 1352; four independent experiments). (G and H) Pclowt/wt (G) and Pclogt/gt (H) neurons stained for Synaptophysin and Rabex5 with and without TTX treatment. (I) Quantification of (G and H). Rabex5 level at synapses slightly decrease in Pclowt/wt and Pclogt/gt neurons upon TTX treatment (Pclowt/wt = 1 ± 0.02, n = 2124 puncta; Pclowt/wt (TTX) = 0.85 ± 0.02, n = 2058 puncta; Pclogt/gt = 0.93 ± 0.02, n = 1889, Pclogt/gt (TTX) = 0.77 ± 0.02, n = 2305; six independent experiments). Scale bars represent 10 μm. Error bars in bar graph represent 95% confidence intervals. Numbers given represent mean ± SEM, ANOVA with Tukey multi comparison test. * denotes p<0.05, ** denotes p<0.01, *** denotes p<0.001 and **** denotes p<0.0001.
Figure 8—figure supplement 2
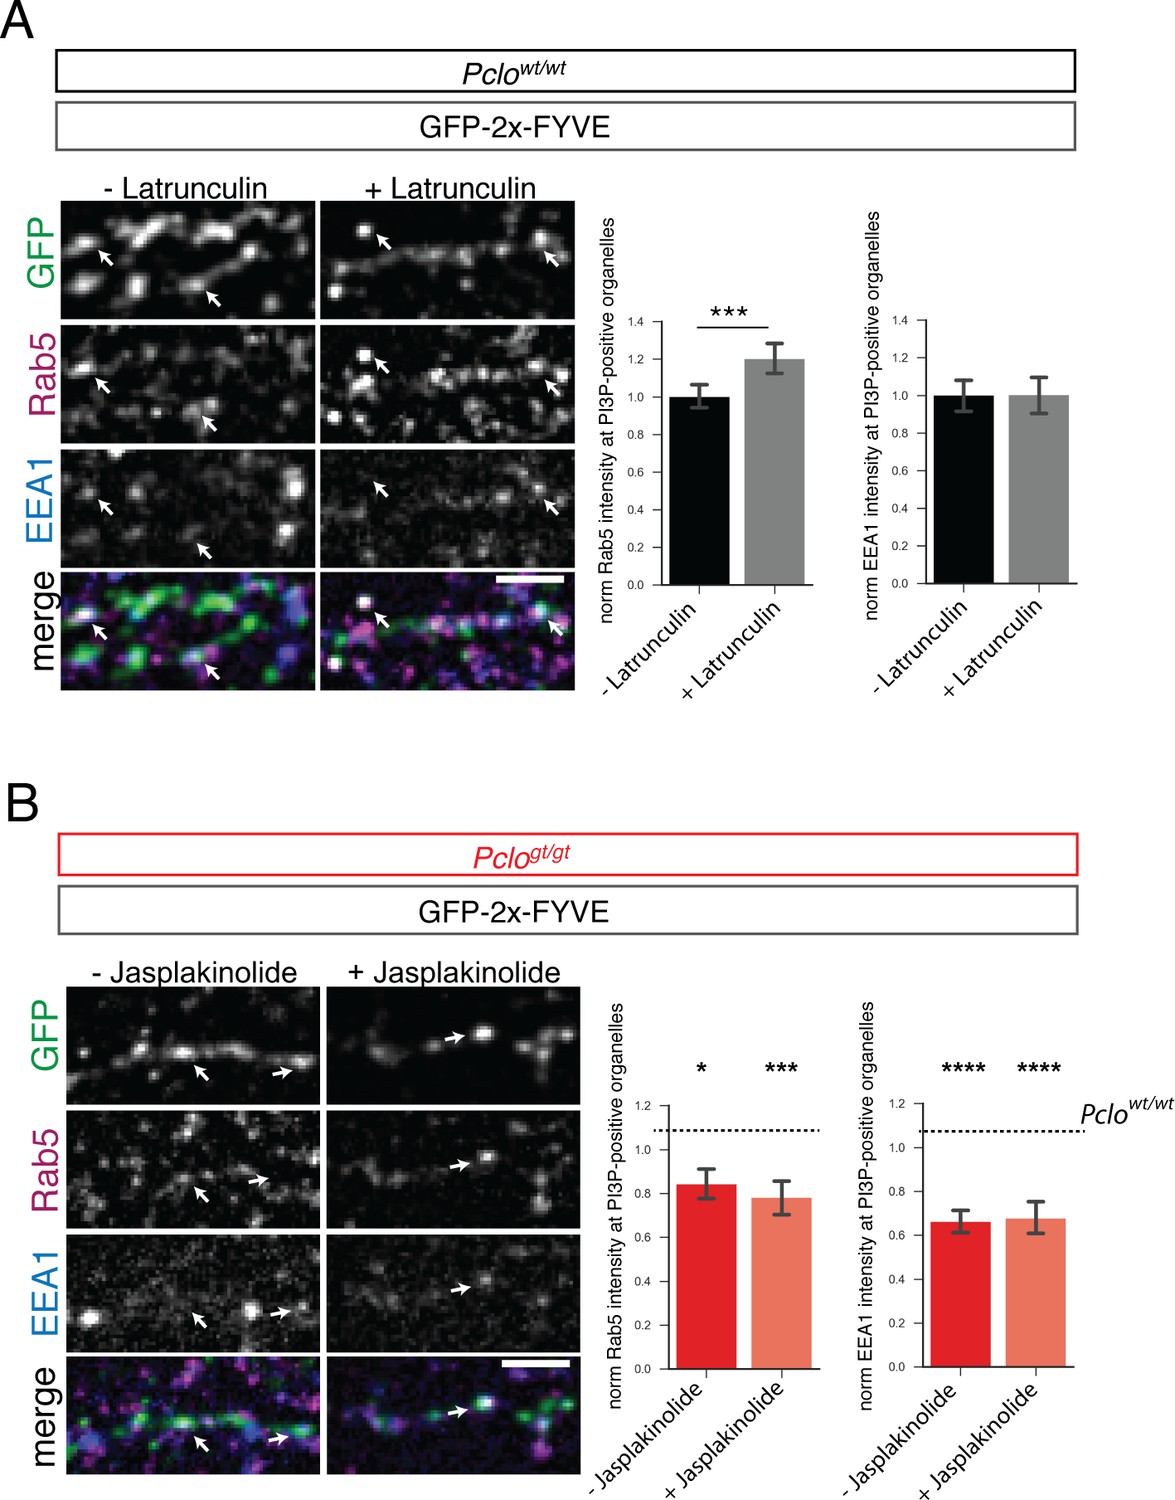
Deficiencies in F-actin assembly do not contribute to the endosome phenotype seen in boutons lacking Piccolo.
(A) Pclowt/wt neurons expressing GFP-2x-FYVE were treated for 30 min with Latrunculin or DMSO as control, fixed and stained for Rab5 and EEA1. Latrunculin treatment leads to increased levels of Rab5 at PI3P-positive organelles (Pclowt/wt - Latrunculin = 1 ± 0.03, n = 518 puncta; Pclowt/wt + Latrunculin = 1.21±0.04, n = 579; three independent experiments). EEA1 levels at endosome membranes are not affected by Latrunculin treatment (Pclowt/wt - Latrunculin = 1 ± 0.04, n = 721 puncta; Pclowt/wt + Latrunculin = 0.91±0.03, n = 535; three independent experiments). (B) Pclogt/gt neurons expressing GFP-2x-FYVE were treated for 30 min with Jasplakinolide or DMSO as control, fixed and stained for Rab5 and EEA1. Jasplakinolide treatment does not alter Rab5 levels at PI3P-positive organelles. (Pclogt/gt - Jasplakinolide = 0.84 ± 0.04, n = 441 puncta; Pclogt/gt + Jasplakinolide = 0.78±0.04, n = 377 puncta; three independent experiments). EEA1 levels at PI3P-positive organelles are also not altered through the treatment with Jasplakinolide (Pclogt/gt - Jasplakinolide = 0.66 ± 0.03, n = 601 puncta; Pclogt/gt + Jasplakinolide = 0.67±0.04, n = 493 puncta; three independent experiments). Scale bar represents 10 μm. Error bars in bar graph represent 95% confidence intervals. Numbers given represent mean ± SEM, Student`s t-test. * denotes p<0.05, *** denotes p<0.001 and **** denotes p<0.0001.
Figure 9 with 1 supplement
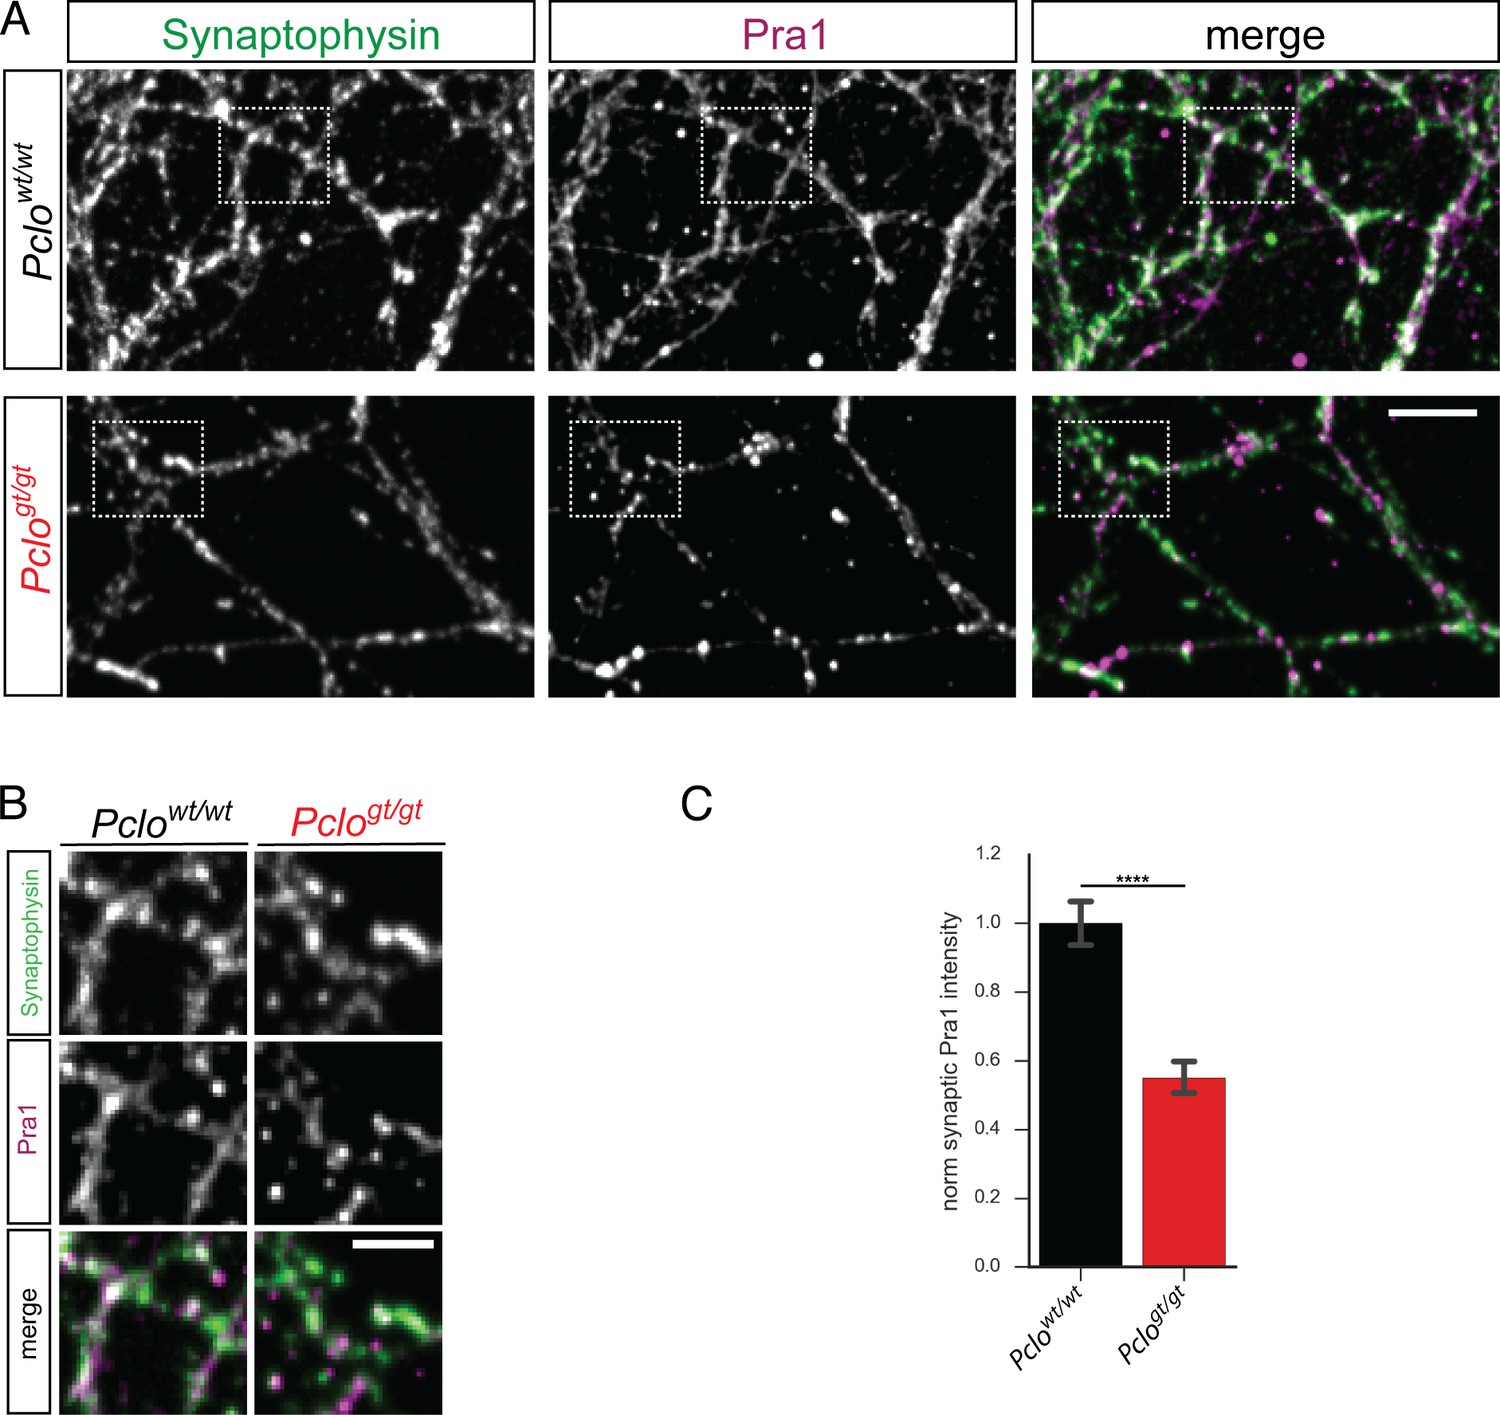
The loss of Piccolo leads to diminished levels of synaptic Pra1.
(A) Images of Pclowt/wt and Pclogt/gt neurons stained with Synaptophysin and Pra1 antibodies. Pra1 is present at Synaptophysin positive synapses in Pclowt/wt synapses but is reduced in Pclogt/gt synapses. (B) Detail images of areas indicated in (A). (C) Quantitation of (A). Loss of Piccolo decreases Pra1 intensity at synapses compared to Pclowt/wt synapses (Pclowt/wt = 1 ± 0.03, n = 474 synapses; Pclogt/gt = 0.55 ± 0.02, n = 723; three independent experiments). Scale bar represents 10 μm and 5 μm in zoom image, Error bars in bar graph represent 95% confidence intervals. Numbers given represent mean ± SEM, Student`s t –test. **** denotes p<0.0001.
-
Figure 9—source data 1
This spreadsheet contains the normalized values used to generate the bar plots shown in Figure 9C.
- https://doi.org/10.7554/eLife.46629.027
Figure 9—figure supplement 1

Pclo-Znf1-mCh is nicely targeted to synapses.
(A) Images depicting co-localization of Pclo-Znf1-mCh with synapses marked by Synaptophysin. (B) Quantification of (A). 83.82 ± 9.475% of Pclo-Znf1-mCh positive puncta co-localize with Synaptophysin. Scale bar represents 10 μm. Error bars in bar graph represent 95% confidence intervals. Numbers given represent mean ± SEM.
Figure 10
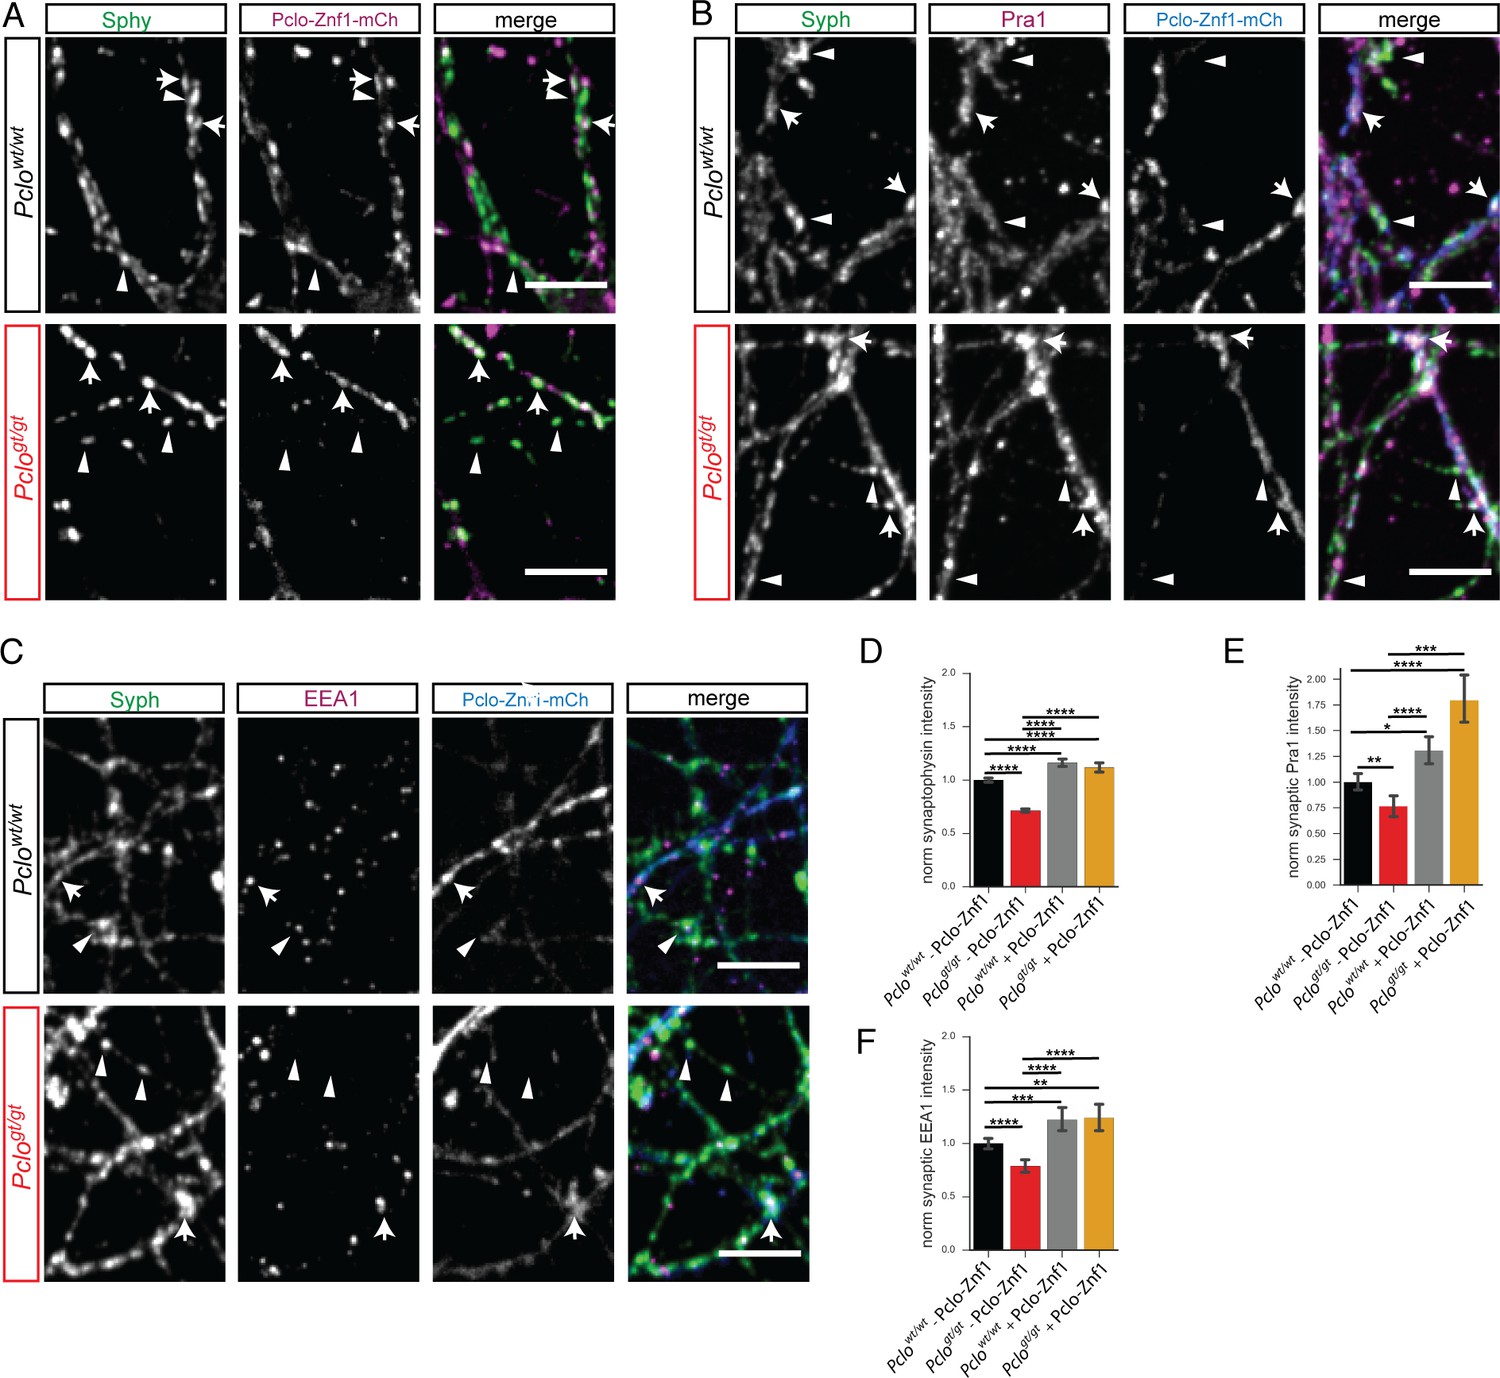
Expressing Pclo-Znf1-mCh rescues Pra1, EEA1 and Synaptophysin levels in Pclogt/gt neurons.
(A–C) Images of Pclowt/wt and Pclogt/gt neurons either expressing or not expressing Pclo-Znf1-mCh (arrows vs arrowheads) that were fixed and stained for Synaptophysin (A) and Pra1 (B) or EEA1 (C). (D) Quantification of (A). Pclo-Znf1-mCh slightly increases Synaptophysin levels in Pclowt/wt neurons (Pclowt/wt = 1 ± 0.01, n = 1497 synapses; Pclowt/wt + Pclo-Znf1-mCh = 1.16 ± 0.02, n = 710; four independent experiments). In Pclogt/gt boutons expressing Pclo-Znf1-mCh (arrows), Synaptophysin levels are increased compared to non-expressing boutons (arrowheads). (Pclogt/gt = 0.71 ± 0.01, n = 1203; Pclogt/gt + Pclo-Znf1-mCh = 1.12 ± 0.02, n = 590; four independent experiments). (E) Quantification of (B). Pclo-Znf1-mCh increases synaptic Pra1 levels in Pclowt/wt neurons (Pclowt/wt = 1 ± 0.04, n = 1136 synapses; Pclowt/wt + Pclo-Znf1-mCh = 1.31 ± 0.07, n = 543; 3–5 independent experiments). Pclo-Znf1-mCh rescues and further increases synaptic Pra1 levels in Pclogt/gt neurons (Pclogt/gt = 0.76 ± 0.05, n = 1064; Pclogt/gt + Pclo-Znf1-mCh = 1.80 ± 0.12, n = 445; 3–5 independent experiments). (F) Quantification of (C). Pclo-Znf1-mCh expression increases synaptic EEA1 levels in Pclowt/wt neurons (Pclowt/wt = 1 ± 0.03, n = 1652 synapses; Pclowt/wt + Pclo-Znf1-mCh = 1.22 ± 0.05, n = 709; 3–5 independent experiments). Pclo-Znf1-mCh rescues and further increases synaptic EEA1 levels in Pclogt/gt neurons (Pclogt/gt = 0.79 ± 0.03, n = 1633; Pclogt/gt + Pclo-Znf1-mCh = 1.24 ± 0.06, n = 464; 3–5 independent experiments). Scale bars represent 10 μm. Error bars in bar graph represent 95% confidence intervals. Numbers given represent mean ± SEM, ANOVA with Tukey multi comparison test. * denotes p<0.05, ** denotes p<0.01, *** denotes p<0.001 and **** denotes p<0.0001.
-
Figure 10—source data 1
This spreadsheet contains the normalized values used to generate the bar plots shown in Figure 10D,E and F.
- https://doi.org/10.7554/eLife.46629.029
Figure 11

Expression of Pclo-Znf1-mCh in Pclogt/gt neurons rescues the size of the total recycling pool of vesicles and FM1-43 unloading kinetics.
(A) Representative images showing FM1-43 levels in Pclowt/wt and Pclogt/gt boutons either positive for Pclo-Znf1-mCh (arrow) or negative (arrowhead) after 60 mM KCl stimulation. (B) Quantification of (A). (Pclowt/wt = 1 ± 0.01, n = 535 puncta; Pclogt/gt = 0.62 ± 0.01, n = 625 puncta; Pclowt/wt + Pclo-Znf1-mCh = 1.50 ± 0.02, n = 682 puncta; Pclogt/gt + Pclo-Znf1-mCh = 1.41 ± 0.01, n = 907 puncta; three independent experiments). (C) Left: Images depicting FM1-43 intensities in Pclowt/wt and Pclogt/gt boutons either positive (arrow) or negative (arrowhead) for Pclo-Znf1-mCh. Right: Images depicting FM1-43 unloading kinetics in Pclowt/wt and Pclogt/gt boutons either positive (arrow) or negative (arrowhead) for Pclo-Znf1-mCh. (D) Quantification of (C). The presence of Pclo-Znf1-mCh is sufficient to partially rescue slowed FM1-43 unloading kinetics and total FM1-43 dye released in Pclogt/gt boutons (Pclowt/wt = 52.64 ± 1.04, n = 213 synapses; Pclogt/gt = 40.23 ± 1.55, n = 144 synapses; Pclowt/wt + Pclo-Znf1-mCh = 48.7 ± 0.96, n = 257 synapses; Pclogt/gt + Pclo-Znf1-mCh = 48.74 ± 0.87, n = 201 synapses; four independent experiments). (E) Model illustrating the contribution of Piccolo in the recycling of synaptic vesicles. Left panel: Piccolo regulates Rab5 function and subsequently early endosome formation through its interaction with Pra1. In the absence of Piccolo (right panel) less Pra1 is localized within the presynaptic terminal. Less synaptic Pra1 negatively impacts Rab5 function, slowing early endosome formation with the consequence that SVs pools and synaptic activity are decreased over time. Scale bars represent 5 μm. Error bars in bar graph represent 95% confidence intervals. Numbers given represent mean ± SEM. ANOVA with Tukey multi comparison test. * denotes p<0.05, *** denotes p<0.001 and **** denotes p<0.0001.
-
Figure 11—source data 1
This spreadsheet contains the normalized values used to generate the bar plots shown in Figure 11B and D.
- https://doi.org/10.7554/eLife.46629.031
Tables
Key resources table
| Reagent type (species) or resource | Designation | Source or reference | Identifiers | Additional information |
|---|---|---|---|---|
| Antibody | anti-synaptophysin (mouse monoclonal) | Synaptic systems | RRID:AB_887824 | (1:1000) |
| Antibody | anti-synaptophysin (guinea pig polyclonal) | Synaptic systems | RRID:AB_1210382 | (1:1000) |
| Antibody | anti-synapsin (rabbit pig polyclonal) | abcam | RRID:AB_1281135 | (1:200) |
| Antibody | anti-VGlut1 (guinea pig polyclonal) | Synaptic systems | RRID:AB_887878 | (1:1000) |
| Antibody | anti-Rab5 (mouse monoclonal) | Synaptic systems | RRID:AB_887773 | (1:500) |
| Antibody | anti-Rab7 (rabbit monoclonal) | abcam | RRID:AB_2629474 | (1:500) |
| Antibody | anti-EEA1 (rabbit monoclonal) | Cell signaling | RRID:AB_2096811 | (1:200) |
| Antibody | anti-GFP (chicken polyclonal) | Thermo scientific | RRID:AB_2534023 | (1:500) |
| Antibody | anti-GFP (mouse monoclonal) | Sigma-Aldrich | RRID:AB_390913 | (1:500) |
| Antibody | anti-Rabex5 (rabbit polyclonal) | Thermo scientific | RRID:AB_11157010 | (1:100) |
| Antibody | anti-MAP2 (chicken polyclonal) | Millipore | RRID:AB_571049 | (1:1000) |
| Antibody | anti-Piccolo (rabbit polyclonal) | synaptic systems | RRID:AB_887759 | (1:500) |
| Antibody | anti-Piccolo (rabbit polyclonal) | abcam | RRID:AB_777267 | (1:1000) |
| Antibody | anti-Piccolo (guinea pig polyclonal) | synapitc system | RRID:AB_2619831 | (1:500) |
| Antibody | anti-Bassoon (rabbit polyclonal) | synapitc systems | RRID:AB_88769 | (1:1000 |
| Antibody | anti-Dynamin (rabbit monoclonal) | abcam | RRID:AB_869531 | (1:1000 |
| Antibody | HRP-conjugated secondary | Thermo scientific | (1:1000 | |
| Antibody | Alexa 488, 555, 642 -conjugated secondaries | Thermo scientific | (1:1000) | |
| Recombinant DNA reagent | pLenti-CMV-Neo-Dest | Adgene | plasmid 17392 | used for subcloning |
| Recombinant DNA reagent | pCDH-EF1a-MCS-(PGK-PURO) | System Bioscience | CD810A-1 | used for subcloning |
| Recombinant DNA reagent | pLenti-CMV-Puro-Dest | abcam | plasmid 17452 | used for subcloning |
| Recombinant DNA reagent | pLenti-CMV-GFP-2x-FYVE-Ne | this paper | ||
| Recombinant DNA reagent | pLenti_CMV_mcherry-Rab5_S34N_Puro | this paper | ||
| Recombinant DNA reagent | pLenti_CMV_mcherry-Rab5_Q79L_Puro | this paper | ||
| Recombinant DNA reagent | FU Znf1_Pclo_mcherry | Waites et al., 2013 | doi: 10.1038/emboj.2013.27 | |
| Recombinant DNA reagent | FU GFP-Rab5 | this paper | ||
| Recombinant DNA reagent | FU GFP-Rab7 | this paper | ||
| Recombinant DNA reagent | pCDH_EF1a_GFP-2xFYVE_IRES_mcherryRab5_Q79L | this paper | ||
| Recombinant DNA reagent | pCDH_EF1a_GFP-2xFYVE_IRES_mcherry-Rab5_S34N | this paper | ||
| Sequence-based reagent | F2-Pclo sequencing primer | this paper | 5`gcaggaacacaaaccaacaa3` | |
| Sequence-based reagent | R1-Pclo sequencing primer | this paper | 5` tgacctttagccggaactgt3` | |
| Sequence-based reagent | SBF2-Pclo sequencing primer | this paper | 5`tcatcaaggaaaccctggac3` | |
| Chemical compound, drug | Tetrodotoxin | abcam | ab120054 | |
| Chemical compound, drug | FM4-64 dye | Thermo scientific | T3166 | |
| Chemical compound, drug | FM1-43 dye | Thermo scientific | T3163 | |
| Chemical compound, drug | Latrunculin | abcam | ab144290 | |
| Chemical compound, drug | Jasplakinolide | Sigma-Aldrich | Sigma-Aldrich | |
| Genetic reagent () | Piccolo KO rat (Pclo rat) | Medrano et al., 2018 | doi: https://doi.org/10.1101/405985 | |
| Strain, strain background () | wistar rat | RRID:RGD_13508588 | femal and male Pclo rats were used for this study |
Additional files
-
Transparent reporting form
- https://doi.org/10.7554/eLife.46629.032
Download links
A two-part list of links to download the article, or parts of the article, in various formats.
Downloads (link to download the article as PDF)
Open citations (links to open the citations from this article in various online reference manager services)
Cite this article (links to download the citations from this article in formats compatible with various reference manager tools)
Critical role for Piccolo in synaptic vesicle retrieval
eLife 8:e46629.
https://doi.org/10.7554/eLife.46629


