Mucosal infection rewires TNFɑ signaling dynamics to skew susceptibility to recurrence
- Washington University School of Medicine, United States
- The Broad Institute of Massachusetts Institute of Technology and Harvard, United States
Figures
Figure 1
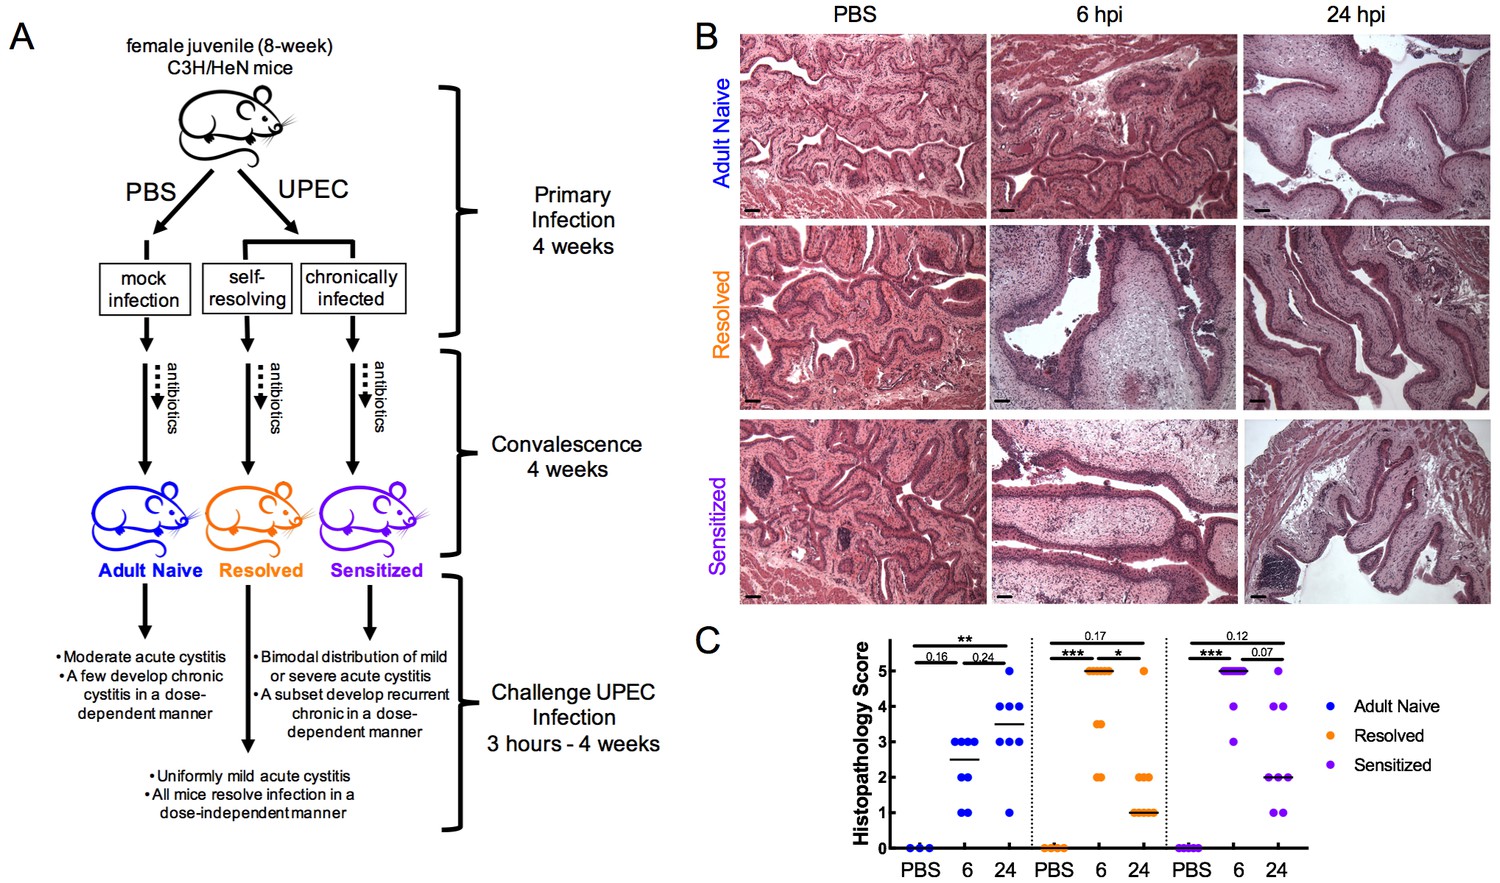
Infection history alters acute bladder inflammation kinetics during recurrent UTI.
(A) An illustration of C3H/HeN recurrent cystitis model. (B) and (C) C3H/HeN Resolved and Sensitized mice, and Adult Naive mice as a control, were infected with 108 cfu UTI89 or PBS and sacrificed at denoted time points. (B) Hematoxylin and eosin-stained bladder sections were assessed in a blinded fashion. Representative images are shown; scale bars = 50 μm. (C) Histopathology scores were determined as described in the Materials and methods and the degree of inflammation was assessed based on levels of immune cell infiltration, edema, and urothelial integrity. N = 2 independent experiments were conducted. Data points represent values for each individual mouse, bars indicate median values. Actual P values are indicated on the graphs if >0.05, or are represented by the following symbols: *p<0.05, **p<0.01, ***p<0.001, Kruskal-Wallis test with Dunn’s correction for multiple comparisons.
-
Figure 1—source data 1
Infection history alters acute bladder inflammation kinetics during recurrent UTI.
- https://doi.org/10.7554/eLife.46677.003
Figure 2

Infection history alters the course of bladder pathophysiology during recurrent UTI.
C3H/HeN Resolved and Sensitized mice, and Adult Naive mice as a control, were infected with 108 cfu UTI89 or PBS and sacrificed at 6 or 24 hpi. (A) Bladder bacterial burdens (cfu/bladder) and (B) bladder edema were assessed in N = 4 independent experiments. Bladder edema was assessed by measuring the wet tissue weight of bladders immediately after sacrifice. (C) Levels of the cytokines CXCL1, IL-6, and CCL2 were assessed by ELISA of bladder homogenate supernatants from samples shown in panel C, which were collected from N = 3 independent experiments and assayed simultaneously in duplicate. Data points represent values for each individual mouse (the ELISA values are the average of two technical replicates), bars indicate median values, negative results are plotted at the limit of detection (dotted line). Actual P values are indicated on the graphs if >0.05, or are represented by the following symbols: *p<0.05, **p<0.01, ***p<0.001, ****p<0.0001, Kruskal-Wallis test with Dunn’s correction for multiple comparisons.
-
Figure 2—source data 1
Infection history alters the course of bladder pathophysiology during recurrent UTI.
- https://doi.org/10.7554/eLife.46677.005
Figure 3 with 1 supplement

Isogenic mice with different infection histories showed distinct bladder transcriptomic profile kinetics.
C3H/HeN Resolved and Sensitized mice, and Adult Naive mice as a control, were infected with 108 cfu UTI89 or mock-infected with PBS. RNA was isolated from whole bladders obtained from mice at 3.5, 6, or 24 hpi (eight mice per group for mock-infected and 3.5 hpi; three mice per group at 6 hpi; at 24 hpi, 4 Adult Naive, 5 Resolved, 6 Sensitized) in N = 4 independent infection experiments and grouped into N = 2 independent sequencing experiments. All mock-infected bladders were harvested at 3.5 hpi for baseline controls. (A) The number of significantly differentially expressed genes at each time point compared to mock-infected mice with the same infection history. (B) Volcano plot of statistically significantly differentially expressed genes (DEGs) of Adult Naive, Resolved, and Sensitized mice (infected vs. mock-infected); the number of DEGs is denoted on each graph. (C) Principal component analysis (PCA) of gene expression in mock-infected mice. See also Figure 3—figure supplement 1. (D) PCA of gene expression in all mouse groups at all time points, with shapes indicating different time points post-infection. Each dot represents the transcriptomic profile of a mouse. The PC1 and PC2 axis labels in C) and D) represent principal components 1 and 2, respectively, followed by the percentage of variance they account for.
-
Figure 3—source data 1
Isogenic mice with different infection histories showed distinct bladder transcriptomic profile kinetics.
- https://doi.org/10.7554/eLife.46677.008
Figure 3—figure supplement 1

Comparison of current RNA-seq analysis to prior similar work.
A previous study performed RNA-seq of whole bladders of Sensitized vs. Resolved mice during convalescence (after antibiotics but prior to challenge infection) (O'Brien et al., 2016). Here we compared the number of significantly differentially expressed genes from that study (‘Previous work’) to the number of significantly differentially expressed genes between Sensitized vs. Resolved mice after a mock infection (bladders harvested 3.5 hr after PBS inoculation) in the present study (‘Current work’). The overlap between (A) significantly differentially expressed genes and (B) enriched pathways is shown.
Figure 4
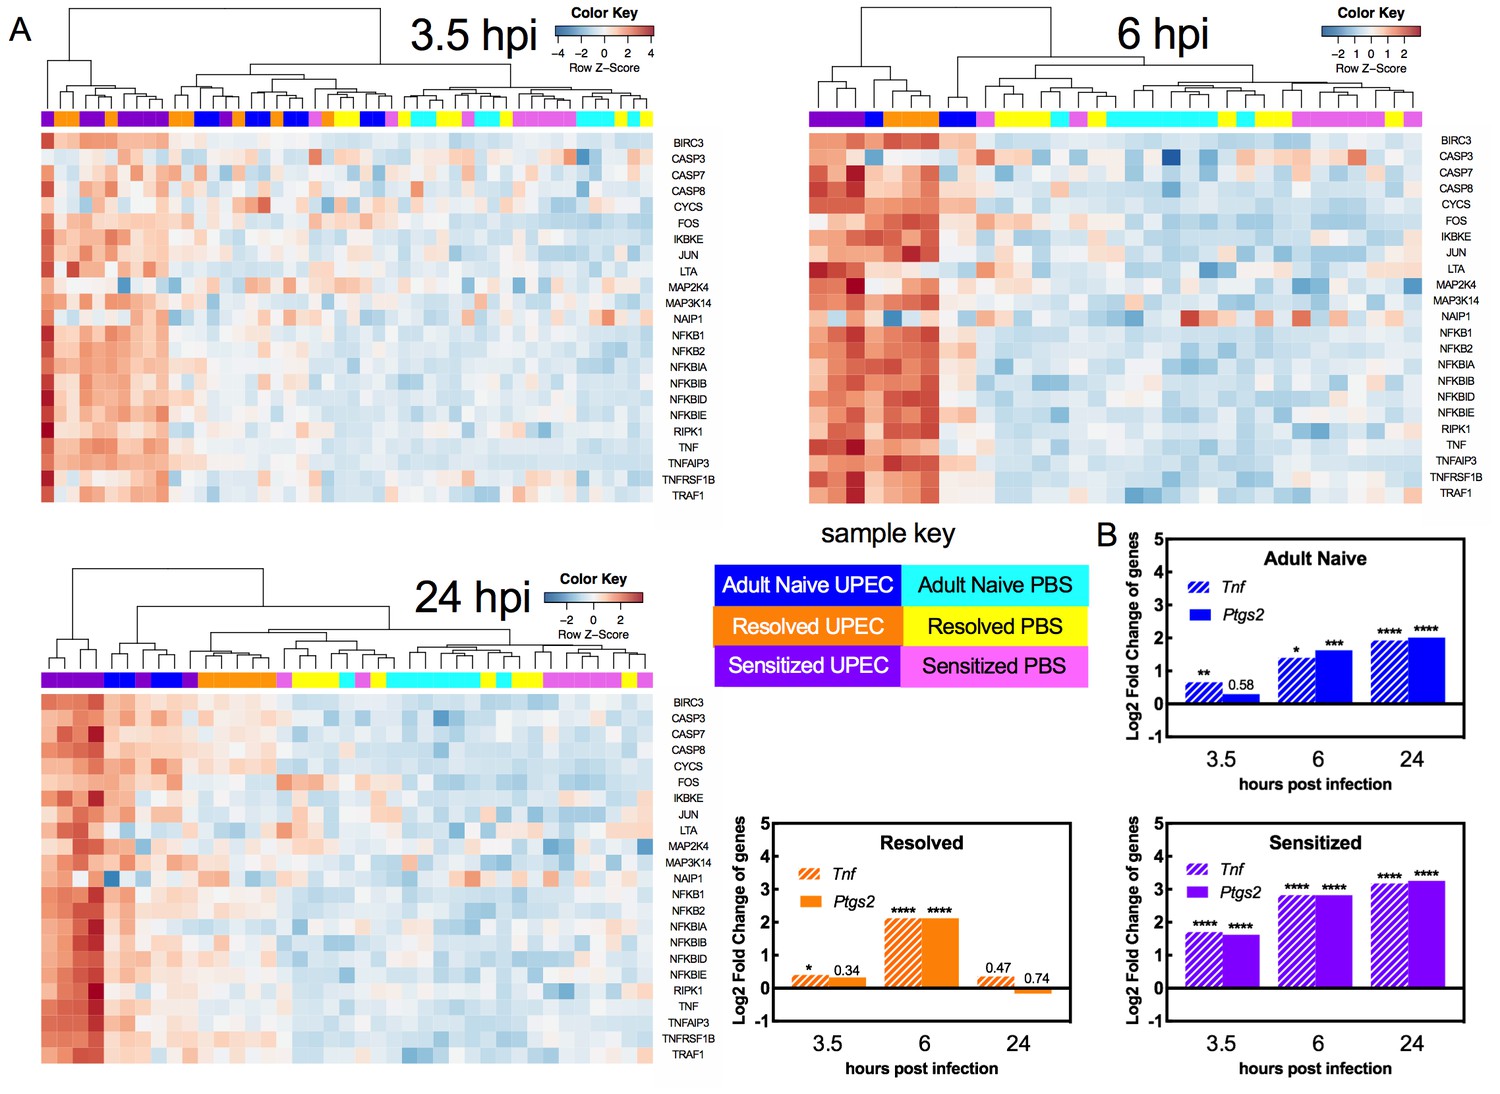
TNFα receptor pathway activation dynamics correlate with host susceptibility to recurrent cystitis.
Pathway enrichment analysis and specific gene analysis was performed on the whole bladder RNA-seq data shown in Figure 3. (A) Heatmaps of expression of up-regulated genes in TNFα signaling pathways from Adult Naive, Resolved, and Sensitized mice at indicated time points. The dendrogram at the top of each heat map was produced by hierarchical clustering of gene expression. The same 3.5 hpi mock-infected controls are included as baseline controls for each heatmap. Specific fold changes and down-regulated genes are listed in Supplementary file 2. (B) Gene expression fold change of Tnf (encodes TNFα) and Ptgs2 (encodes COX-2) in infected Adult Naive, Resolved, and Sensitized mice at indicated time points relative to mock-infected controls. Gene fold changes were estimated based on normalized counts using a shrinkage estimation model by DESeq2. Actual P values are indicated on the graphs if >0.05, or are represented by the following symbols: *p<0.05, **p<0.01, ***p<0.001, ****p<0.0001, Wald test, multiple comparison errors were corrected by Benjamini-Hochberg false-discovery rate correction. See also Supplementary files 1 and 2.
-
Figure 4—source data 1
TNFα receptor pathway activation dynamics correlate with host susceptibility to recurrent cystitis.
- https://doi.org/10.7554/eLife.46677.010
Figure 5
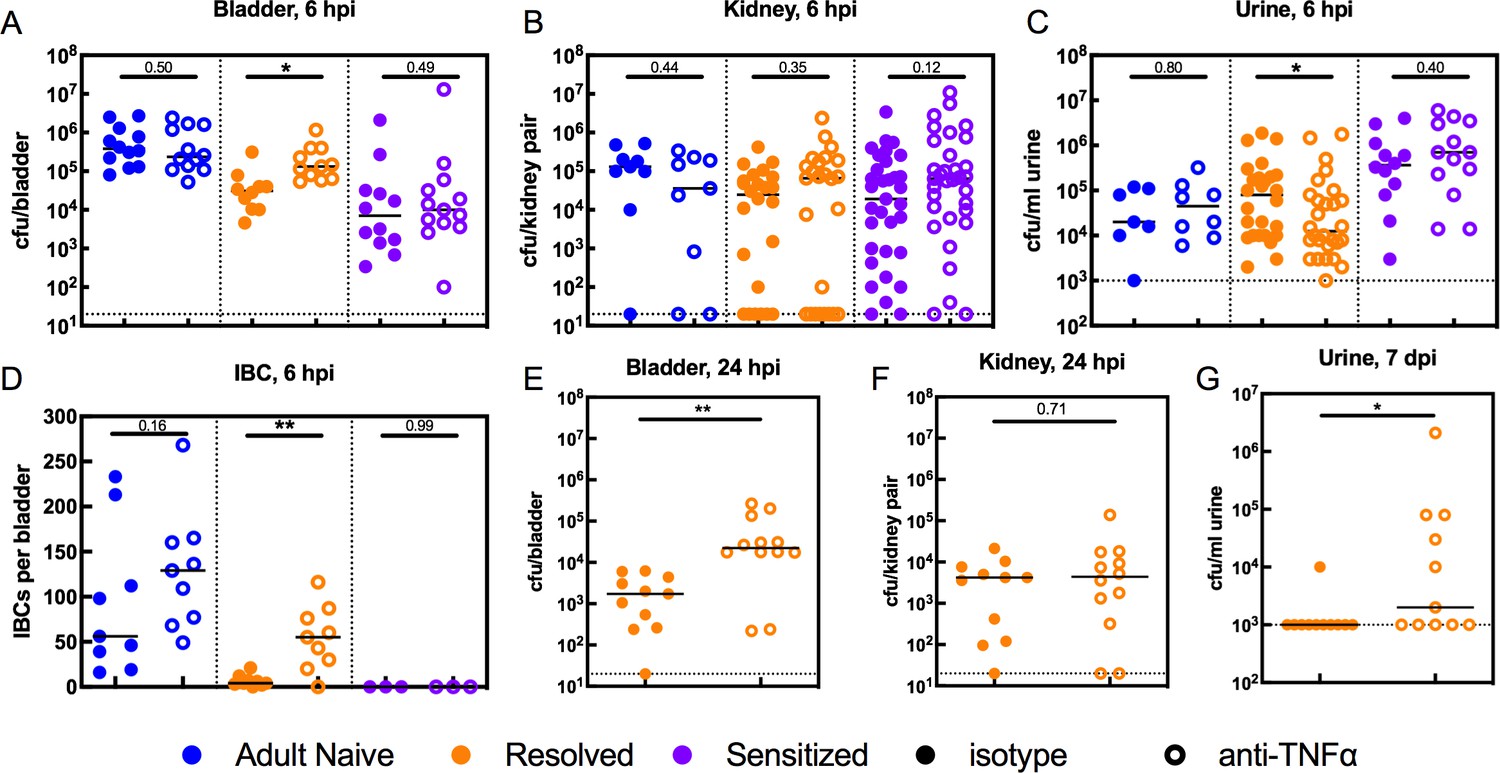
TNFα depletion increases intracellular bladder bacterial burdens in Resolved mice during acute rUTI.
Adult Naive (blue symbols), Resolved (gold symbols), and Sensitized (purple symbols) mice were treated with anti-TNFα (open circles) or isotype control (solid circles) antibody 18 hr prior to infection with 107 cfu UTI89 and sacrificed at indicated time points. Bacterial burdens were assessed at 6 hpi in the (A) bladder (cfu/bladder), (B) kidneys (cfu/kidney pair), and (C) urine (cfu/ml) in N = 5 independent experiments. (D) Intracellular bacterial communities (IBCs) were enumerated in N = 7 independent experiments. Bacterial burdens were enumerated at 24 hpi in Resolved mice for the (E) bladder (cfu/bladder) and (F) kidneys (cfu/kidney pair) in N = 2 independent experiments. (G) Urine bacterial burdens (cfu/ml) were measured in Resolved mice at 7 days post-inoculation (dpi); data from five independent experiments are depicted. Each data point represents the value for an individual mouse, bars indicate median values, negative results are plotted at the limit of detection (dotted line). Actual P values are indicated on the graphs if >0.05, or are represented by the following symbols: *p<0.05, **p<0.01, Mann-Whitney U test.
-
Figure 5—source data 1
TNFα depletion increases intracellular bladder bacterial burdens in Resolved mice during acute rUTI.
- https://doi.org/10.7554/eLife.46677.012
Figure 6 with 1 supplement

TNFα signaling restricts bladder intracellular colonization by UPEC in Resolved mice by promoting the exfoliation of infected bladder epithelial cells.
Resolved mice were treated with anti-TNFα or isotype control antibody 18 hr prior to infection with 107 cfu UTI89 and sacrificed at indicated time points. (A) Bladder intracellular bacterial burdens (cfu/bladder) of Resolved mice as determined by the ex vivo gentamicin protection assay in two independent experiments are shown at the indicated time points. (B) IBCs were enumerated in Resolved mice at 4.5 hpi with or without TNFα depletion from N = 2 experiments. See also Figure 6—figure supplement 1. (C) Scanning electron microscopy was used to assess the bladder luminal surface at 6 hpi in two independent experiments with n = 6 mice per group. Scale bars = 50 μm; white boxes outline areas visualized at a higher magnification to the right. At 6 hpi, (D) bladder edema and (E) pyuria were measured in N = 3 independent experiments. (F) Flow cytometry was performed on bladder single cell suspensions from Resolved mice in N = 2 independent experiments. Neutrophils were defined as CD11b+, Ly6G+, F4/80- cells. Data points represent value for each individual mouse, bars indicate median values, negative results are plotted at the limit of detection (dotted line). Actual P values are indicated on the graphs if >0.05, or are represented by the following symbols: *p<0.05, **p<0.01, Mann-Whitney U test.
-
Figure 6—source data 1
TNFα signaling restricts bladder intracellular colonization by UPEC in Resolved mice by promoting the exfoliation of infected bladder epithelial cells.
- https://doi.org/10.7554/eLife.46677.015
Figure 6—figure supplement 1
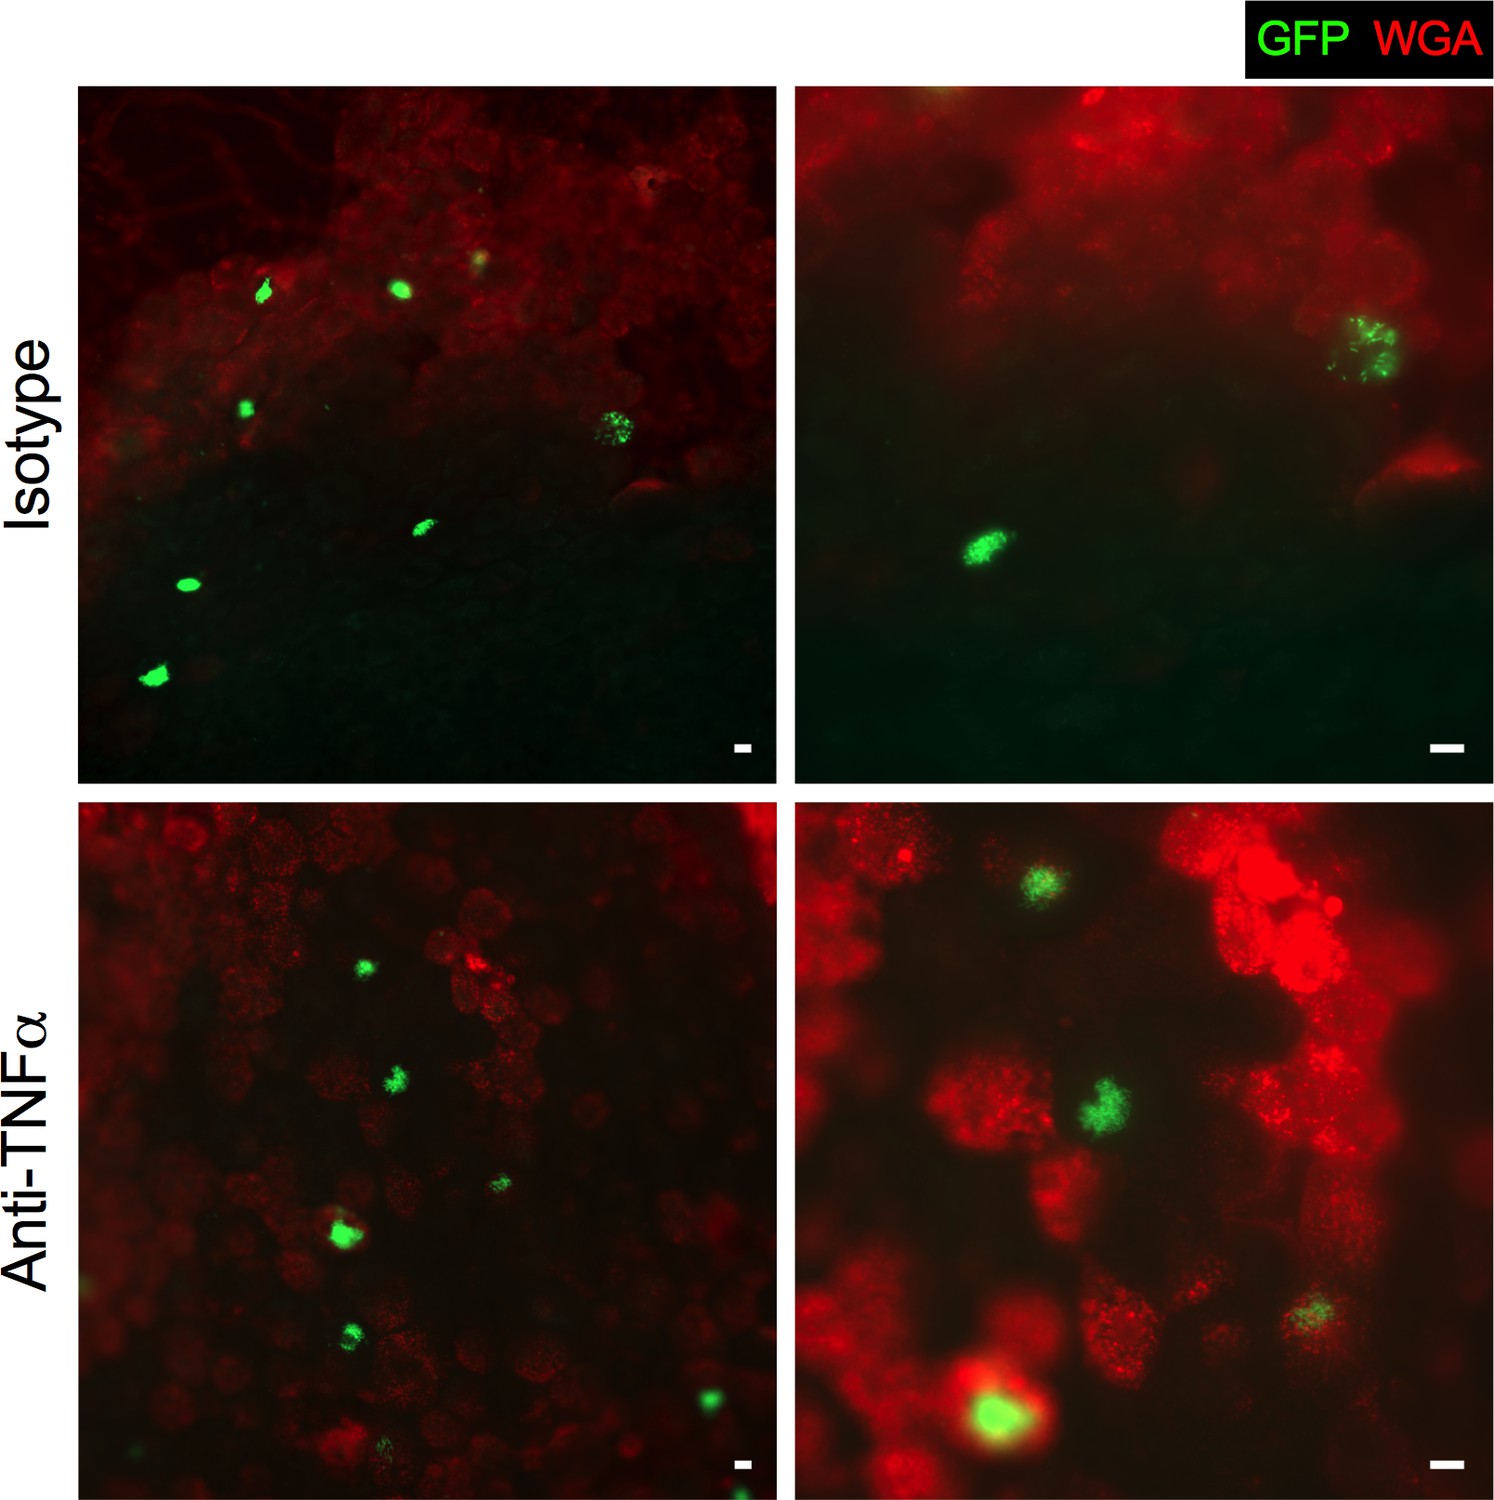
TNFα depletion did not affect IBC morphology in Resolved mice at 4.5 hpi.
Resolved mice were pre-treated with anti-TNF⍺ or isotype control antibody 18 hr prior to infection with 107 cfu GFP-expressing UTI89 (green) and sacrificed at 4.5 hpi. Wheat germ agglutinin (WGA, red) was used to visualize the cell surface. Fluorescent microscopy was performed to detect bladder IBCs and representative images are shown. Scale bar = 20 μm. N = 2 independent experiments were performed with n = 5–6 mice per group.
Figure 7
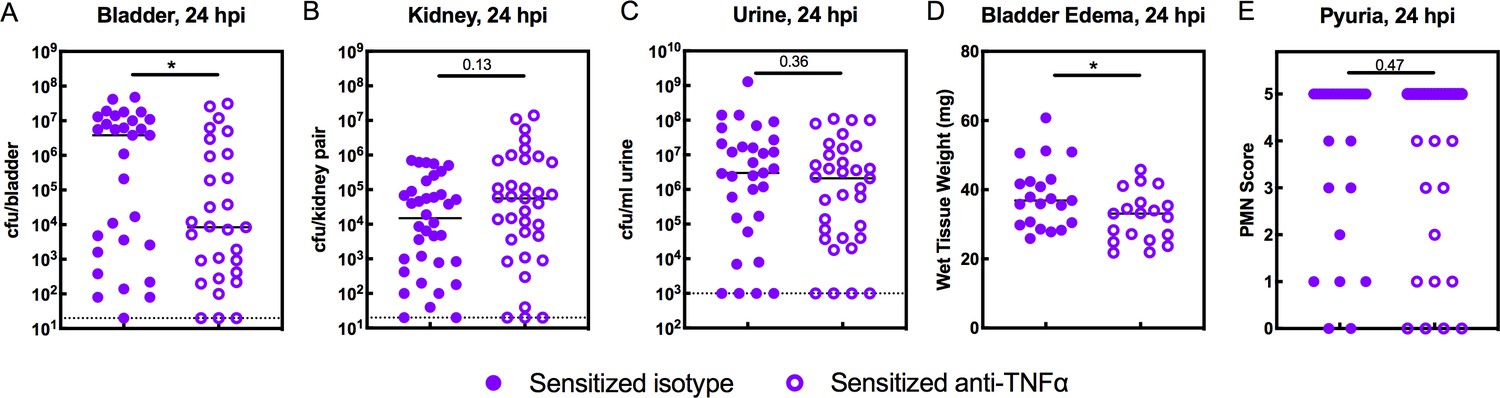
TNFα-depletion decreases the severity of acute rUTI in Sensitized mice.
Sensitized mice were treated with anti-TNFα or isotype control antibody 18 hr prior to infection with 108 cfu UTI89 infection and sacrificed 24 hpi. Bacterial burdens were enumerated in the (A) bladder (cfu/bladder), (B) kidneys (cfu/kidney pair), and (C) urine (cfu/ml urine), and (D) bladder weight and (E) pyuria were assessed in five independent experiments. Data points represent values for each individual mouse, bars indicate median values, negative results are plotted at the limit of detection (dotted line in A, B, and C). Actual P values are indicated on the graphs if >0.05, or are represented by the following symbols: *p<0.05. Mann-Whitney U test.
-
Figure 7—source data 1
TNFα-depletion decreases the severity of acute rUTI in Sensitized mice.
- https://doi.org/10.7554/eLife.46677.017
Figure 8
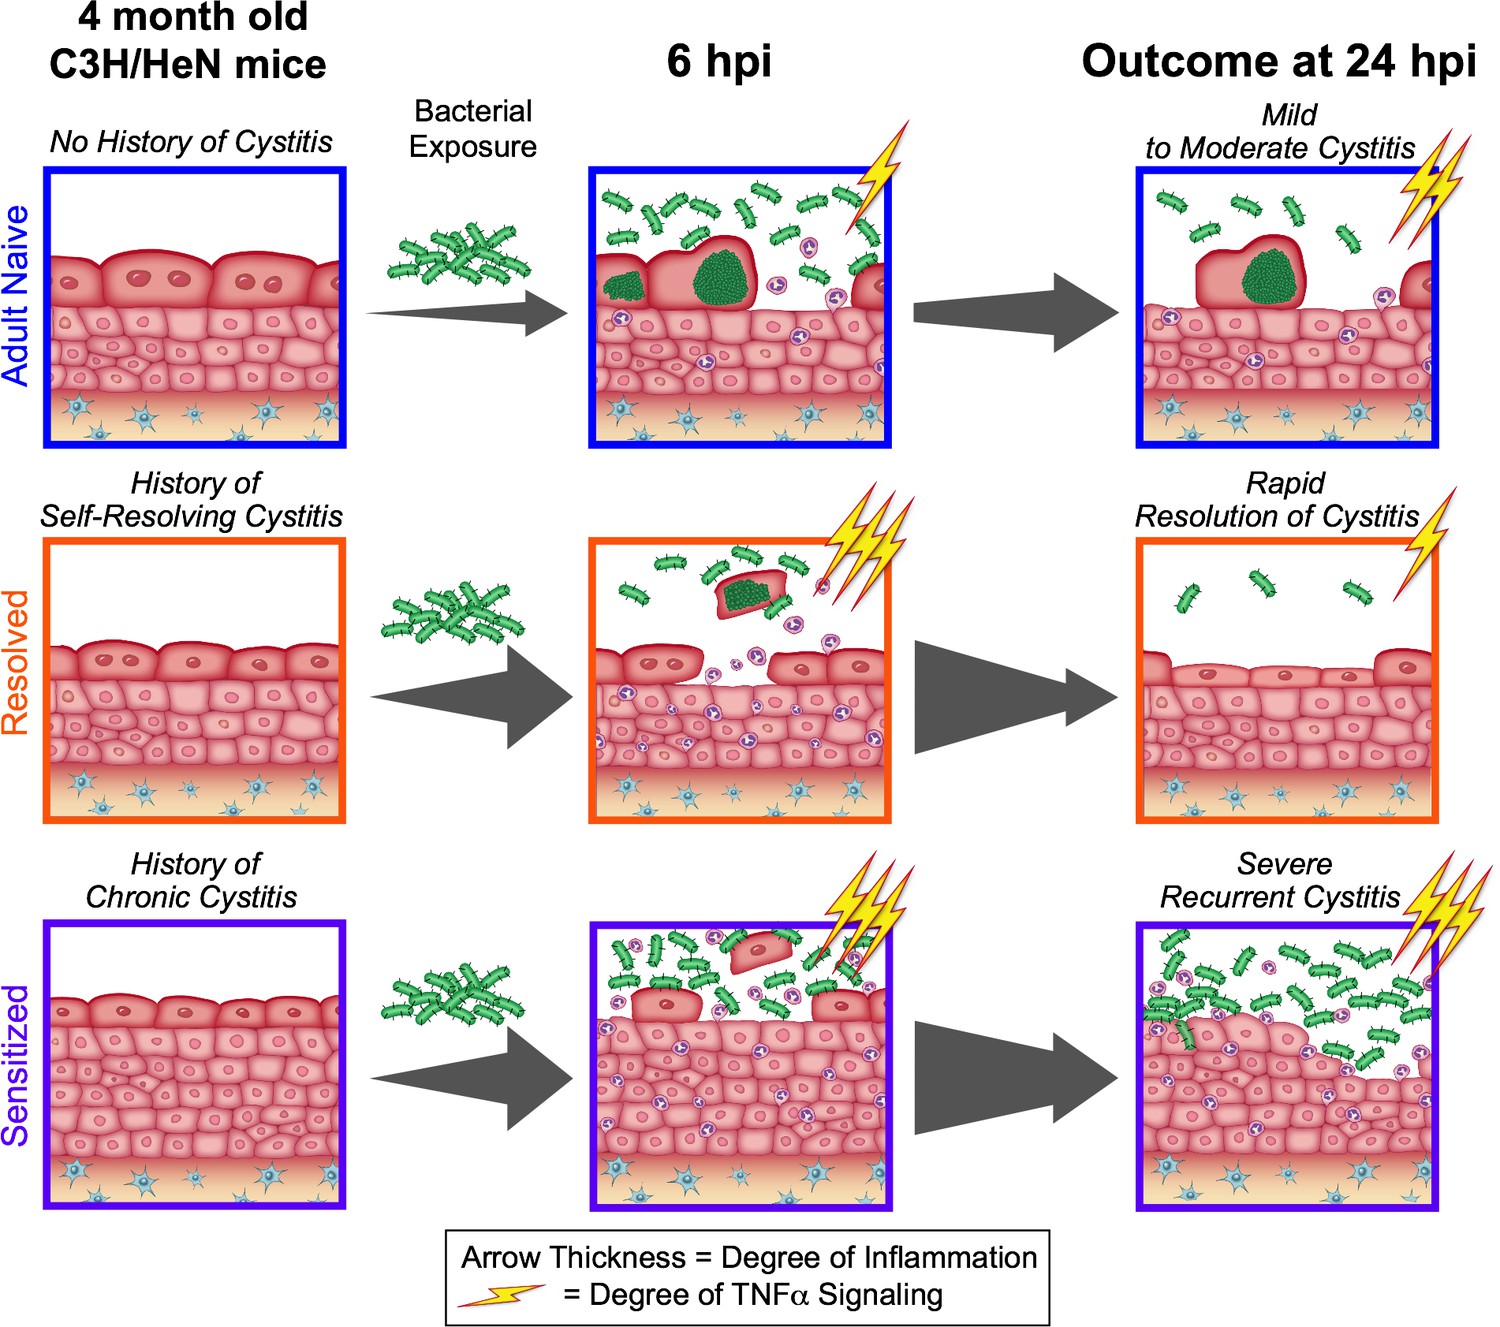
The outcome of a prior infection alters the balance towards either protection or susceptibility to recurrent infection through alterations in the dynamics of TNFα signaling.
Upon bacterial challenge of Resolved mice, TNFα signaling (depicted as lightning bolts) is rapid, but transient (subsiding within the first 24 hr post-challenge), leading to rapid resolution of rUTI due to early exfoliation of infected bladder epithelial cells. However, when TNFα signaling is sustained (lasting 24 hr or more post-challenge), as occurs in Sensitized mice upon challenge, this contributes to mucosal wounding and severe rUTI.
Tables
Key resources table
| Reagent type (species) or resource | Designation | Source or reference | Identifiers | Additional information |
|---|---|---|---|---|
| Strain, strain background (Mus musculus, female) | C3H/HeN | Envigo | C3H/HeN Hsd | |
| Strain, strain background (Escherichia coli) | UTI89 pANT4 | https://doi.org/10.1073/pnas.0308125100 (Justice et al., 2004) | Episomal enhanced GFP; Kanamycin- and ampicillin-resistant | |
| Strain, strain background (Escherichia coli) | UTI89 attHK022::eGFP | https://doi.org/10.1128/IAI.73.11.7657-7668.2005 (Wright et al., 2005) | UTI89-KanR | Chromosomal enhanced GFP; Kanamycin-resistant |
| Strain, strain background (Escherichia coli) | UTI89 attλ::PSSH10-1 | https://doi.org/10.1128/IAI.73.11.7657-7668.2005 (Wright et al., 2005) | UTI89-SpcR | Spectinomycin-resistant |
| Antibody | Anti-TNFα (rat IgG1 monoclonal, clone XT3.11) | BioXCell | BP0058, RRID:AB_1107764 | 10 mg/kg IP |
| Antibody | Anti-HRP isotype control (rat IgG1 monoclonal, clone XT3.11) | BioXCell | BP0088, RRID:AB_1107775 | 10 mg/kg IP |
| Antibody | Anti-mouse CD11b-PE conjugate (rat monoclonal, clone M1/70) | BD Biosciences | 553311, RRID:AB_394775 | (1:200) |
| Antibody | Anti-mouse Ly6G-FITC conjugate (rat monoclonal, clone 1A8) | BioLegend | 127605, RRID:AB_1236488 | (1:200) |
| Antibody | Anti-mouse F4/80-APC conjugate (rat IgG1 monoclonal, clone BM8) | BioLegend | 123115, RRID:AB_893493 | (1:200) |
| Antibody | Anti-mouse CD16/32, FcR block (rat monoclonal) | Biolegend | 101301, RRID:AB_312800 | |
| Commercial assay or kit | Duoset IL-6 ELISA kit | R and D Systems | DY406 | |
| Commercial assay or kit | Duoset CXCL1 ELISA kit | R and D Systems | DY453 | |
| Commercial assay or kit | Duoset CCL2 ELISA kit | R and D Systems | DY479 | |
| Commercial assay or kit | RNeasy Plus kit | Qiagen | 74136 | |
| Commercial assay or kit | RiboZero rRNA depletion kit | Illumina | MRZG12324 | |
| Commercial assay or kit | SMARTScribe reverse transcriptase | Clontech | 639536 | |
| Software, algorithm | Salmon | Salmon | 0.8.2, RRID:SCR_017036 | |
| Software, algorithm | DESeq2 | DESeq2 | 1.14.0, RRID:SCR_015687 | |
| Software, algorithm | Ingenuity Pathway Analysis | Qiagen Bioinformatics | RRID:SCR_008653 | |
| Other | Wheat germ agglutinin, AlexaFluor 594 congugate | ThermoFisher | W11262 | (1:1,000) |
| Other | DAPI stain | ThermoFisher | D1306 | (1:20,000) |
| Other | Prolong Gold Anti-fade | ThermoFisher | P36930 |
Additional files
-
Supplementary file 1
The enriched pathways in Adult Naive, Resolved, and Sensitized mice infected with UPEC for 3.5, 6, or 24 hpi, compared to mock infection.
Gene fold change cut off for use in IPA analysis is 2-fold or greater; cut off for P value of enrichment is 0.05 or -log10(P value) of 1.3; ‘ratio’ is the number of genes differentially expressed in the samples divided by the number of genes in this pathway; and Z-score is a statistical measure of the match between expected relationship direction and observed gene expression: positive z-score predicts activation, negative z-score predicts suppression.
- https://doi.org/10.7554/eLife.46677.019
-
Supplementary file 2
Genes regulated by TNFɑ signaling in Adult Naive, Resolved, and Sensitized mice infected with UPEC for 3.5, 6, or 24 hpi, compared to mock infection.
‘Expr Log Ratio”indicates expression log2 fold change; ‘Expr p-value’ indicates expression-adjusted P value; and the cut off for P value of enrichment is 0.05 or -log10(P value) of 1.3.
- https://doi.org/10.7554/eLife.46677.020
-
Supplementary file 3
Details of library construction and sequencing.
- https://doi.org/10.7554/eLife.46677.021
-
Transparent reporting form
- https://doi.org/10.7554/eLife.46677.022
Download links
A two-part list of links to download the article, or parts of the article, in various formats.
Downloads (link to download the article as PDF)
Open citations (links to open the citations from this article in various online reference manager services)
Cite this article (links to download the citations from this article in formats compatible with various reference manager tools)
Mucosal infection rewires TNFɑ signaling dynamics to skew susceptibility to recurrence
eLife 8:e46677.
https://doi.org/10.7554/eLife.46677


