Noroviruses subvert the core stress granule component G3BP1 to promote viral VPg-dependent translation
- University of Cambridge, United Kingdom
- Washington University School of Medicine, United States
- Harvard Medical School, United States
- South China Normal University, China
- Northeastern University, United States
- Karolinska Institute, Sweden
- University of Surrey, United Kingdom
- Yale School of Medicine, United States
Figures
Figure 1 with 1 supplement

The norovirus VPg proteins interacts with ribosome associated translation initiation factors.
(A) Amino acid sequence alignment of the GV murine norovirus VPg sequences with VPg from representative human noroviruses from GI Norwalk virus (NV), GII, and GIV. The position of the site of RNA linkage to the highly conserved tyrosine residue is highlighted in green. The eIF4G binding motif is boxed and the position of the C-terminal single amino acid change known to interfere with eIF4G binding highlighted in orange. (B) m7-GTP sepharose was used to affinity purify eIF4F containing complexes from either wild-type BHK cells (BHK) or BHK cells containing the Norwalk virus (NV) replicon (BHK-NV). Samples of the lysate (L) or the affinity purified complexes (m7) were separated by SDS-PAGE then analysed by western blot for the indicate proteins. Molecular mass shown on the left of the gels represent the positions of molecular weight markers. (C) GFP fusion proteins to either the wild type (WT) or C-terminal eIF4G binding domain mutants of the MNV and NV VPg proteins (F123A, F137A) were transfected into human 293 T cells and subjected to immunoaffinity purification using anti-GFP. Samples of the input lysates (Input) and the purified complexes (GFP-IP) were then separated by SDS-PAGE and analysed by western blot analysis for the indicated proteins. Mock transfected cells served as a specificity control. The approximate expected molecular mass of each protein is shown to the left. (D) Quantitative proteomics was used as described in the text to identify host factors that were affinity purified following transfection of GFP-tagged derivative of either the NV or MNV VPg proteins. Proteins specifically enriched in comparison to the GFP control are shown. Data visualisation was performed using Cystoscape (Shannon et al., 2003). (E) Western blot analysis of cell extracts (Input) or immunoprecipitated (GFP IP) complexes isolated from cells transfected as described in panel C. For clarity, the molecular masses shown in this panel refer to the expected mass of the protein being examined.
Figure 1—figure supplement 1
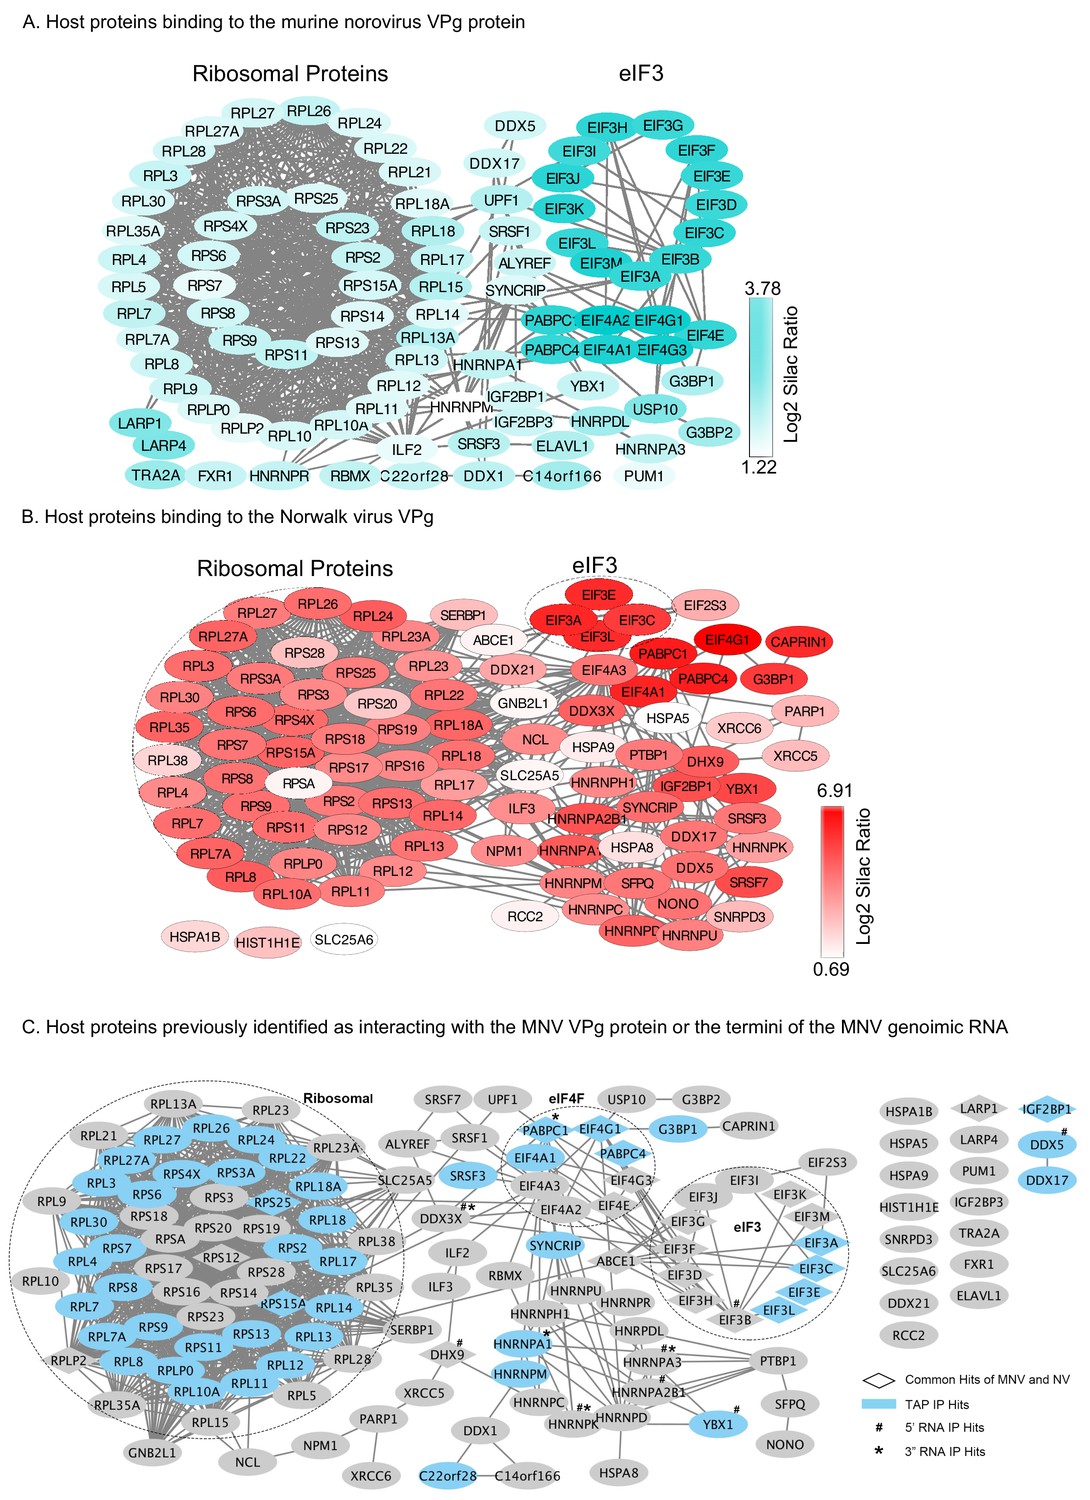
Host factors binding to the norovirus VPg.
Quantitative proteomics was used as described in the text to identify host factors that were affinity purified following transfection of GFP-tagged derivative of either the NV or MNV VPg proteins. Proteins specifically enriched on the murine norovirus or human norovirus (Norwalk) VPg proteins in comparison to the GFP control are shown in panels A and B respectively. Proteins that were identified as enriched in at least two of the three biological repeats were counted as potential binding proteins and the SILAC ratios were computed as the average of the two or three biological repeats. The raw values used to compute this figure are presented in Supplementary file 1. Panel C illustrates the proteins previously found to interact with the 5’ or 3’ termini of the MNV genome (Bailey et al., 2010; Vashist et al., 2012a) or to associate with MNV VPg using tandem affinity purification (Chung et al., 2014). Data visualisation was performed using Cystoscape (Shannon et al., 2003).
Figure 2 with 2 supplements
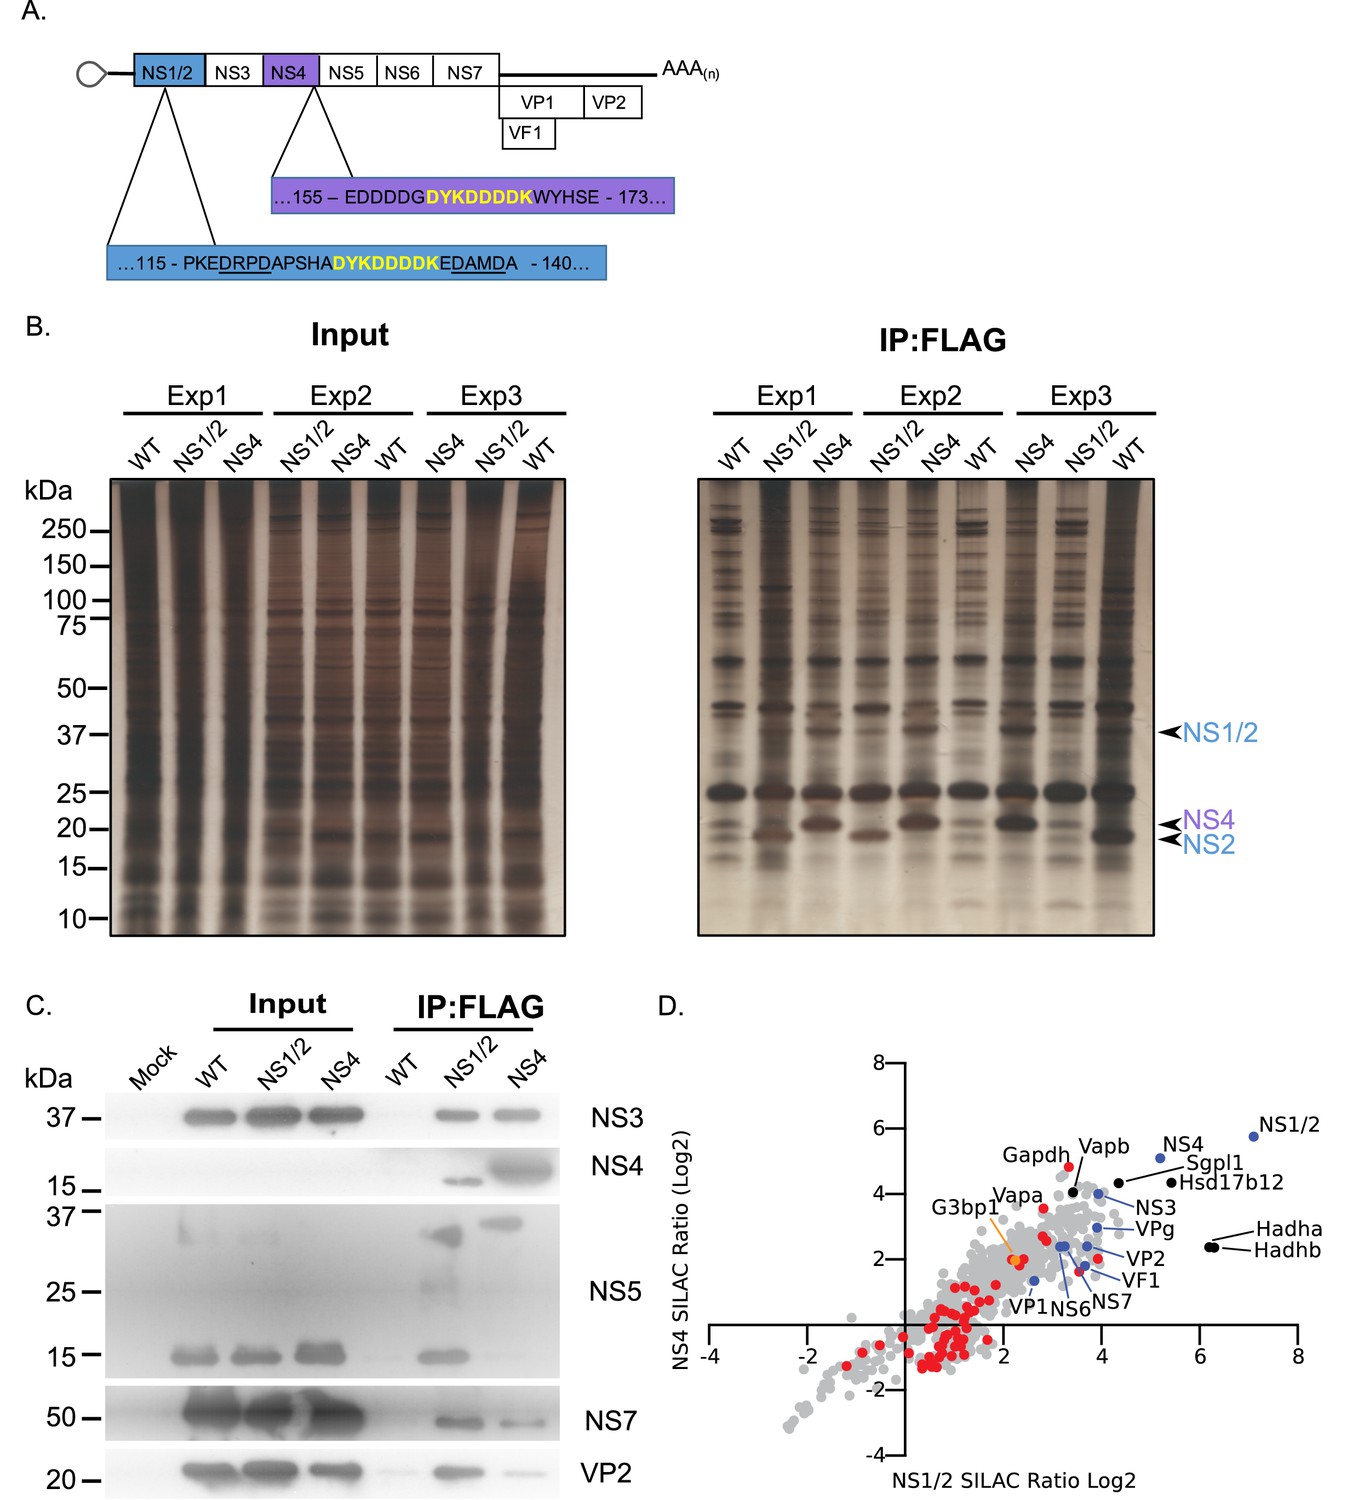
Proteomic characterisation of the norovirus replication complex using infectious epitope tagged MNV.
(A) Schematic representation of NS1/2-FLAG and NS4-FLAG viruses contain insertions of nucleotide sequences encoding the FLAG peptide DYKDDDDK (in yellow) in their coding sequences. The NS1/2-FLAG virus FLAG peptide was inserted between 2 of the three caspase-3 cleavage sites present in NS1/2 (underlined). (B) BV2 cells labelled with stable derivatives of arginine and lysine were infected with either wild type MNV (WT) or recombinant epitope-tagged MNV as described in the Materials and methods. 12 hr post infection samples were lysed, samples pooled and immunoaffinity purifications performed as described in the text. Samples of the cell lysates (Input) and the affinity purified complexes (IP:Flag) were analysed by SDS-PAGE on a 4–12% gradient gel prior to silver staining. The positions of the NS1/2, NS2 and NS4 proteins is shown. (C) Western blot analysis of lysates purified from cells infected as described in panel B, for various viral proteins, confirming the specific enrichment of viral replicase components. (D) Plot comparing the proteins identified in the complexes purified from cells infected with the NS1/2 and NS4 Flag expressing viruses. The raw data associated with this figure is presented in Supplementary file 2. Proteins identified in at least two of the three biological repeats are shown. SILAC ratios were calculated as an average of the two or three biological samples. All MNV proteins were identified in association with NS1/2 and NS4 (light blue) including the viral polymerase NS7, demonstrating enrichment of the MNV replication complex. Proteins previously identified as host factors potentially involved in some aspect of the norovirus life cycle through various biochemical or genetic screens are shown in red. Selected highly enriched proteins are highlighted in black. The NS1/2 binding partner VapA (McCune et al., 2017) and paralog VapB were both enriched by NS1/2 and NS4.
Figure 2—figure supplement 1

Additional analyses of NS1/2 and NS4-associated proteins.
MNV proteins highlighted in light blue, and G3BP1 in gold. (A) Gene ontology using PANTHER overrepresentation analysis of proteins copurifying with NS1/2 or NS4 (Log2 SILAC ratio >2 for either protein). Proteins in selected, mutually exclusive gene ontology categories are plotted in different colours as depicted. (B) A number of factors previously identified as MNV host factors using proteomics or CRISPR approaches (Orchard et al., 2019; Chung et al., 2014; Vashist et al., 2012b) copurified in pulldowns of NS1/2 and NS4 (highlighted red). (C) Novel putative MNV host factors highly enriched (Log2 SILAC ratio >4 for either protein) by NS1/2 and NS4 are plotted in black. (D) Proteins identified in pulldowns of NS1/2 and NS4 which were also identified in pulldowns of MNV VPg are plotted in red. (E) Proteins enriched in pulldowns of NS1/2 and NS4 which were also identified using CRISPR screening as MNV host factors are plotted in red (positive host factors) and yellow (negative host factors), along with G3BP1 in gold.
Figure 2—figure supplement 2
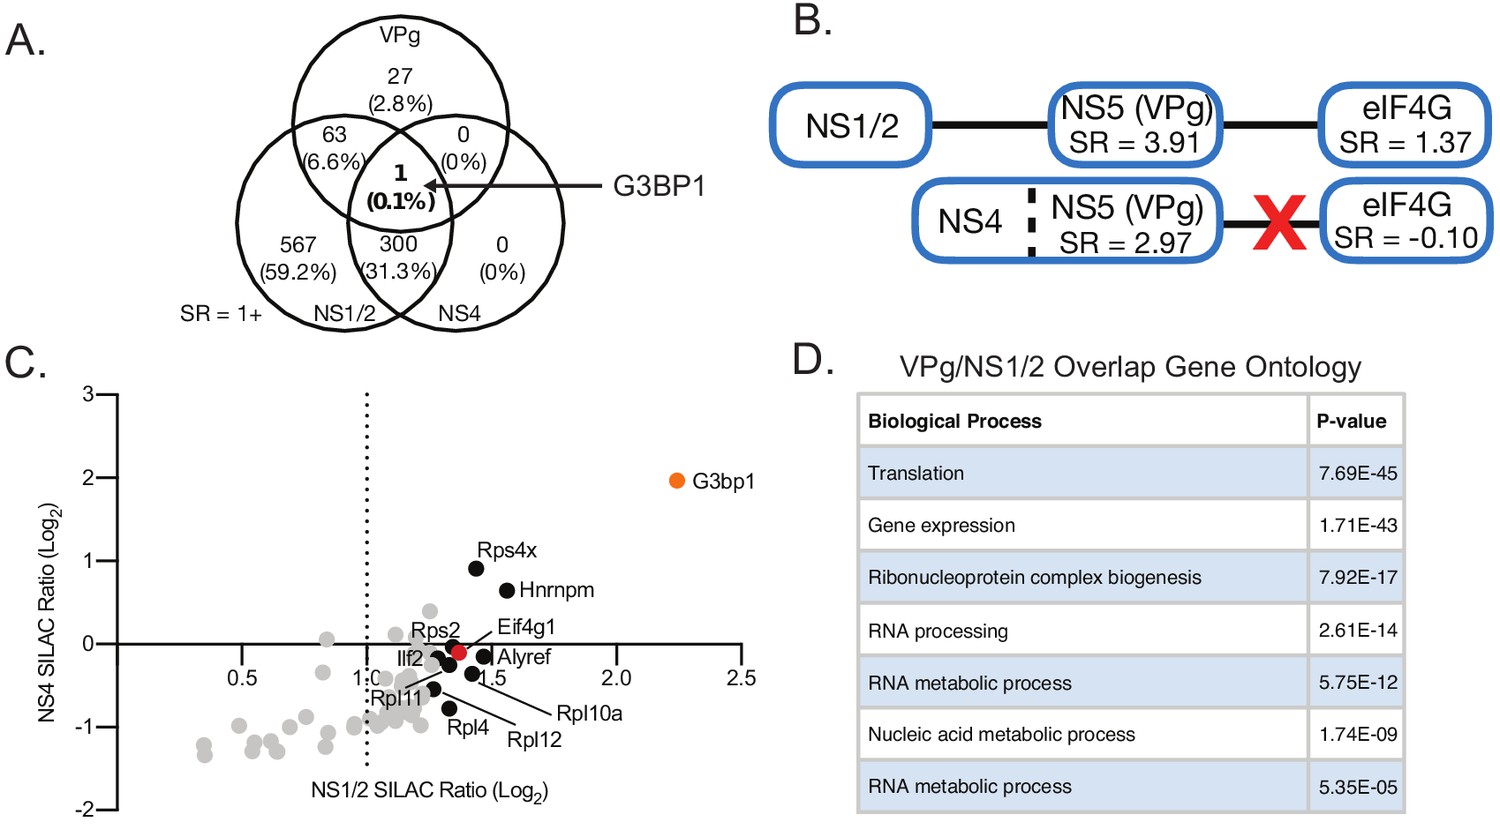
Further analysis of proteins enriched through MNV VPg proteomics and FLAG-tagged virus replication complex proteome data (Log2 SILAC ratio >1).
(A) Venn diagram illustrating the degree of overlap between the proteins identified in the three proteomics approaches. The greatest overlap between VPg and the replication complex proteome data was observed between VPg and NS1/2. G3BP1 was enriched in pulldowns of all three bait proteins (VPg, NS1/2 and NS4). (B) The baits NS1/2 and NS4 both enriched VPg during replication complex pulldowns, but NS1/2 also enriched the VPg binding partner eIF4G, while NS4 did not. Immunoblot analysis revealed that NS4 enriched primarily the NS4/5 (VPg) polyprotein precursor, and not mature VPg, while NS1/2 enriched primarily the mature form of VPg (Figure 2C). (C) Plot of all MNV VPg binding partners identified in Figure 1 which overlapped with proteins associated with the replication complex through NS1/2 and NS4 purification. Most VPg interaction partners were better enriched by NS1/2 than NS4, except G3BP1. (D) Table showing Gene Ontology analysis of proteins enriched by VPg and NS1/2 during infection using PANTHER overrepresentation analysis, revealing a subset of the replication complex dedicated to translation and RNA metabolism.
Figure 3
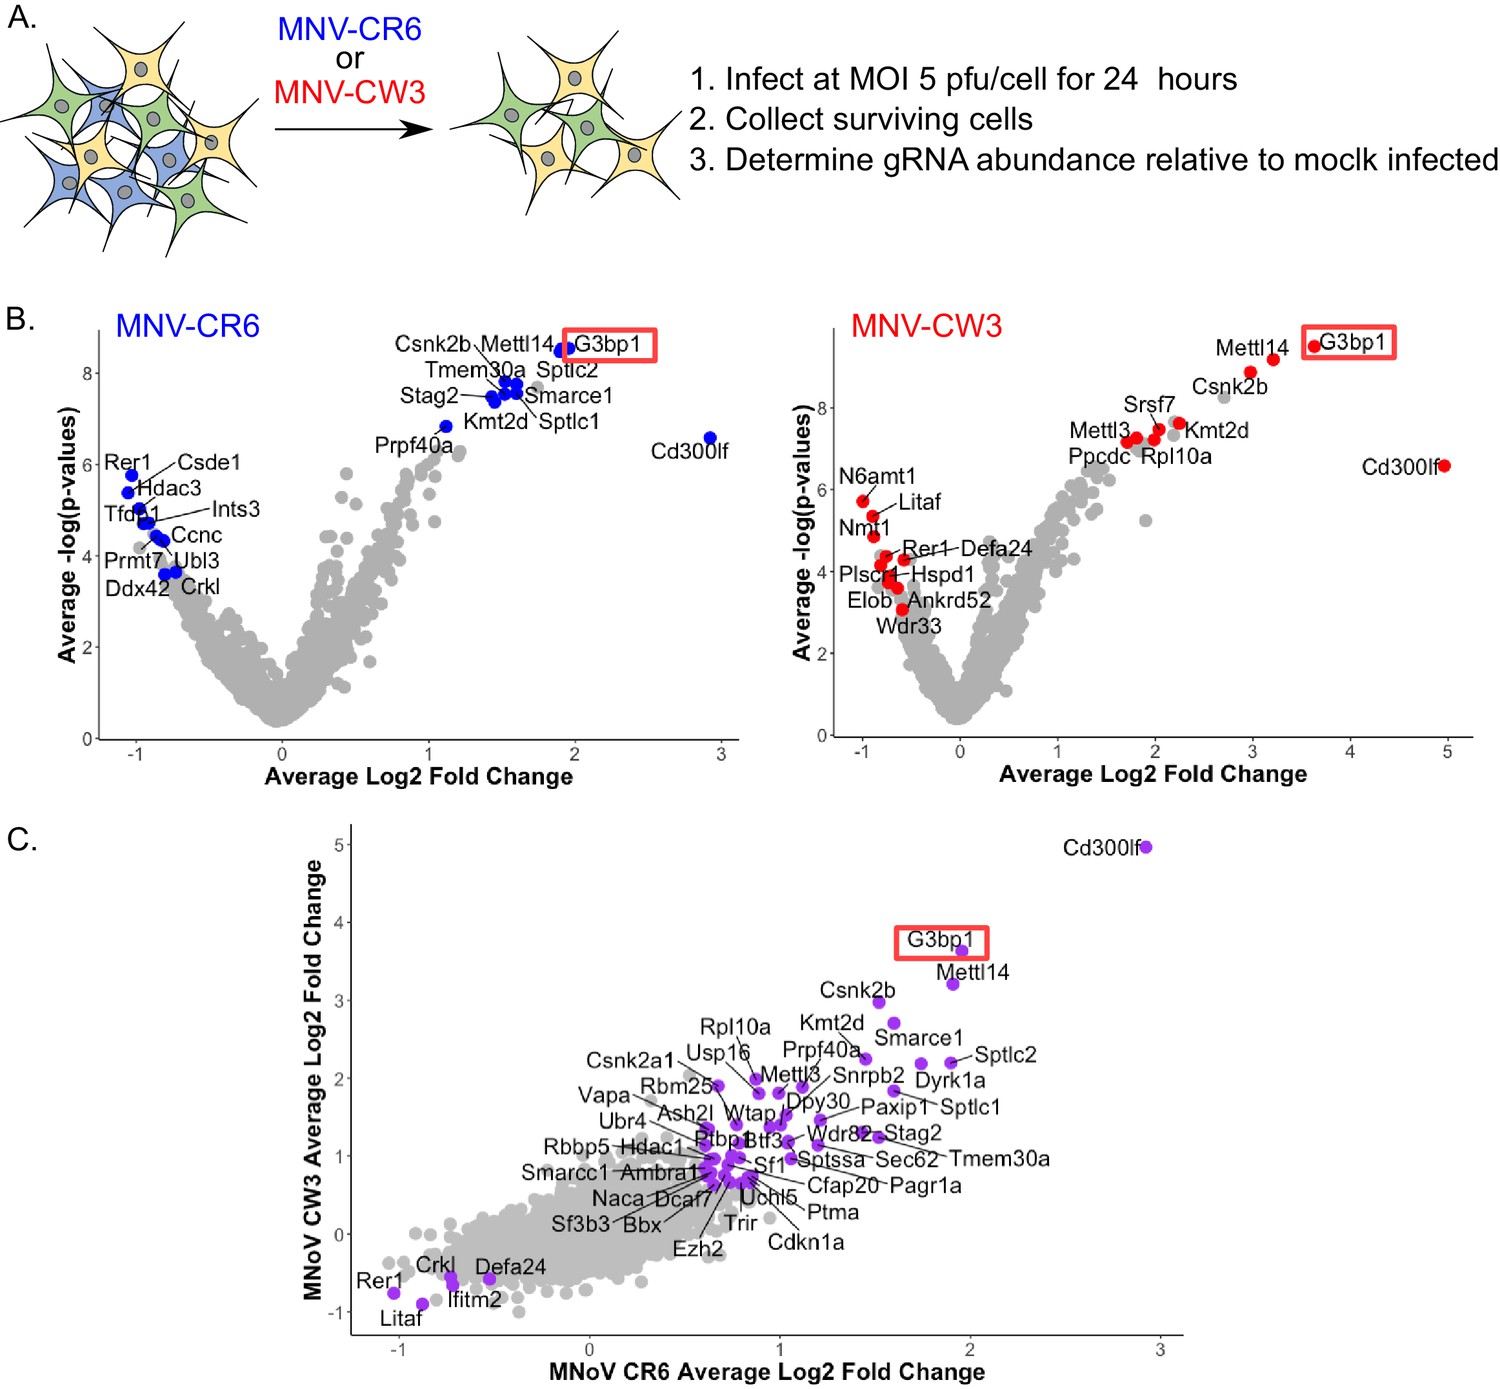
CRISPR screen identifies host genes positively and negatively selected upon MNV infection.
(A) Schematic overview of the infection CRISPR screen workflow. BV2 cells expressing Cas9 were transduced with a CRISPR library then subsequently infected with either MNV CR6 or CW3 for 24 hr. Cells remaining after 24 hr were harvested and used for guide RNA abundance analysis as described in the text. (B) Volcano plot identifying candidate genes enriched upon MNV-CW3 (red) or MNV-CR6 (blue); red or blue labelled genes correspond to the top-ten positive or negatively selected genes ranked by the STARS algorithm. (C) Plot comparing the Log2 fold change in guide RNA abundance in the CRISPR library transduced BV2 cells following infection with either CR6 or CW3 MNV.
Figure 4
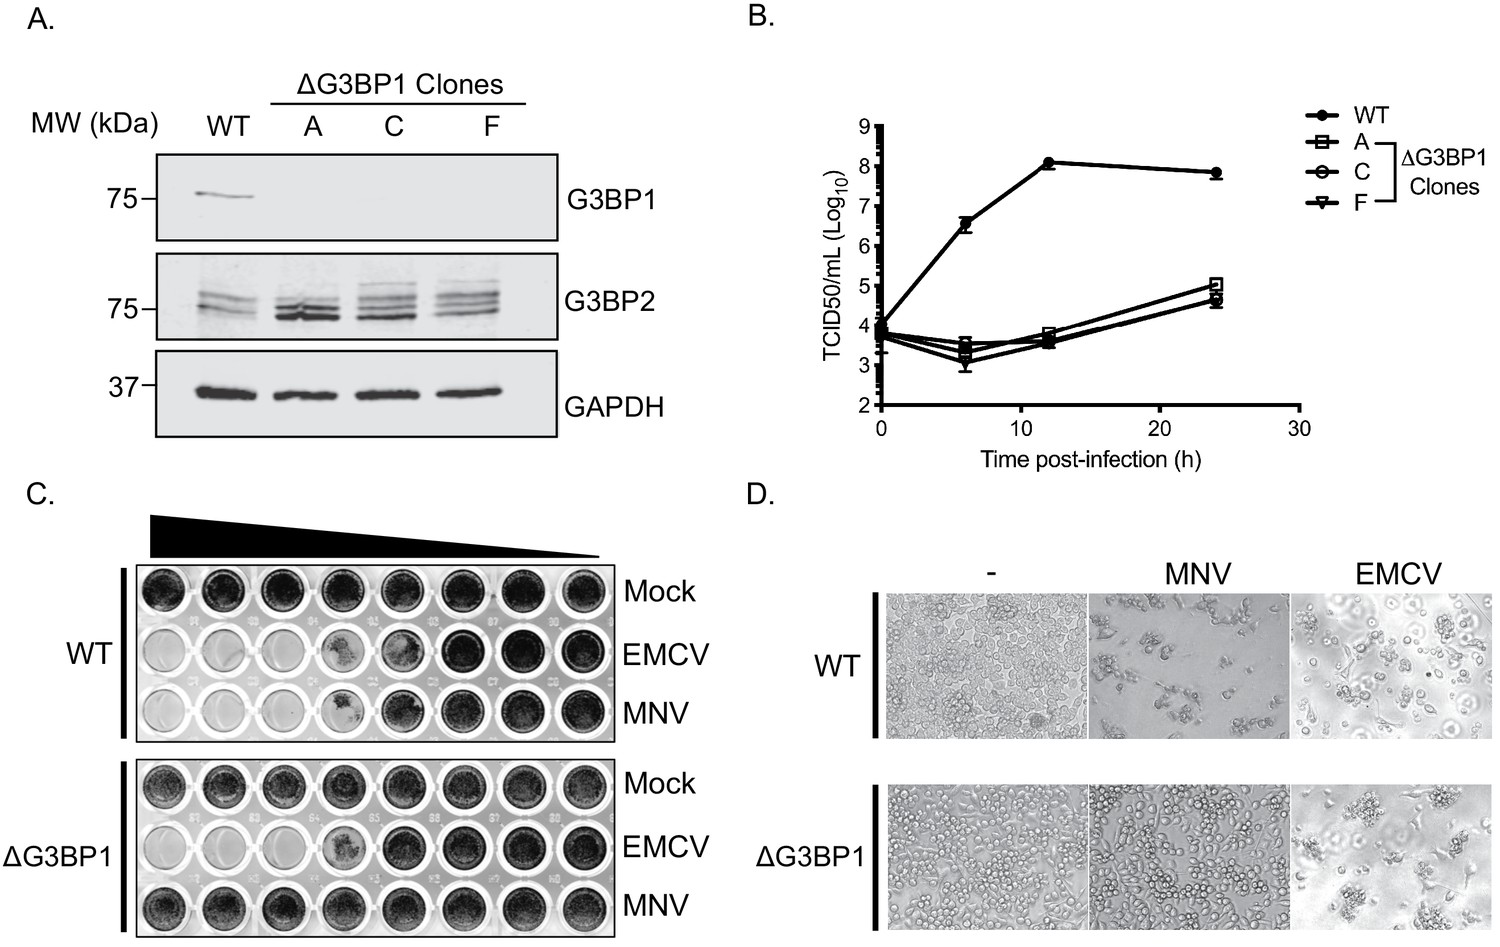
CRISPR knockout of G3BP1 renders cells non permissive for MNV replication.
(A) Western blot analysis of three independent ΔG3BP1 clones for GAPDH, G3BP1 and G3BP2. (B) High multiplicity, single cycle growth curve analysis of the impact of G3BP1 ablation on MNV replication. BV2 ΔG3BP1 clone C cells were infected at a MOI of 10 TCID50/cell, samples were collected at the time points illustrated, the samples then processed and titrated by TCID50 as described in the text. The error bars represent standard errors of three biological repeats and the data are representative of at least three independent experiments. (C) Wild type (WT) or ΔG3BP1 clone C BV2 cells were plated in a 96 well plate and subsequently infected using a serial dilution of either EMCV or MNV. Cells were fixed in paraformaldehyde and stained with crystal violet 5 days post infection. (D) Light micrographs of WT or ΔG3BP1 cells either mock infected (-) or infected with EMCV or MNV and visualised 5 days post infection.
Figure 5
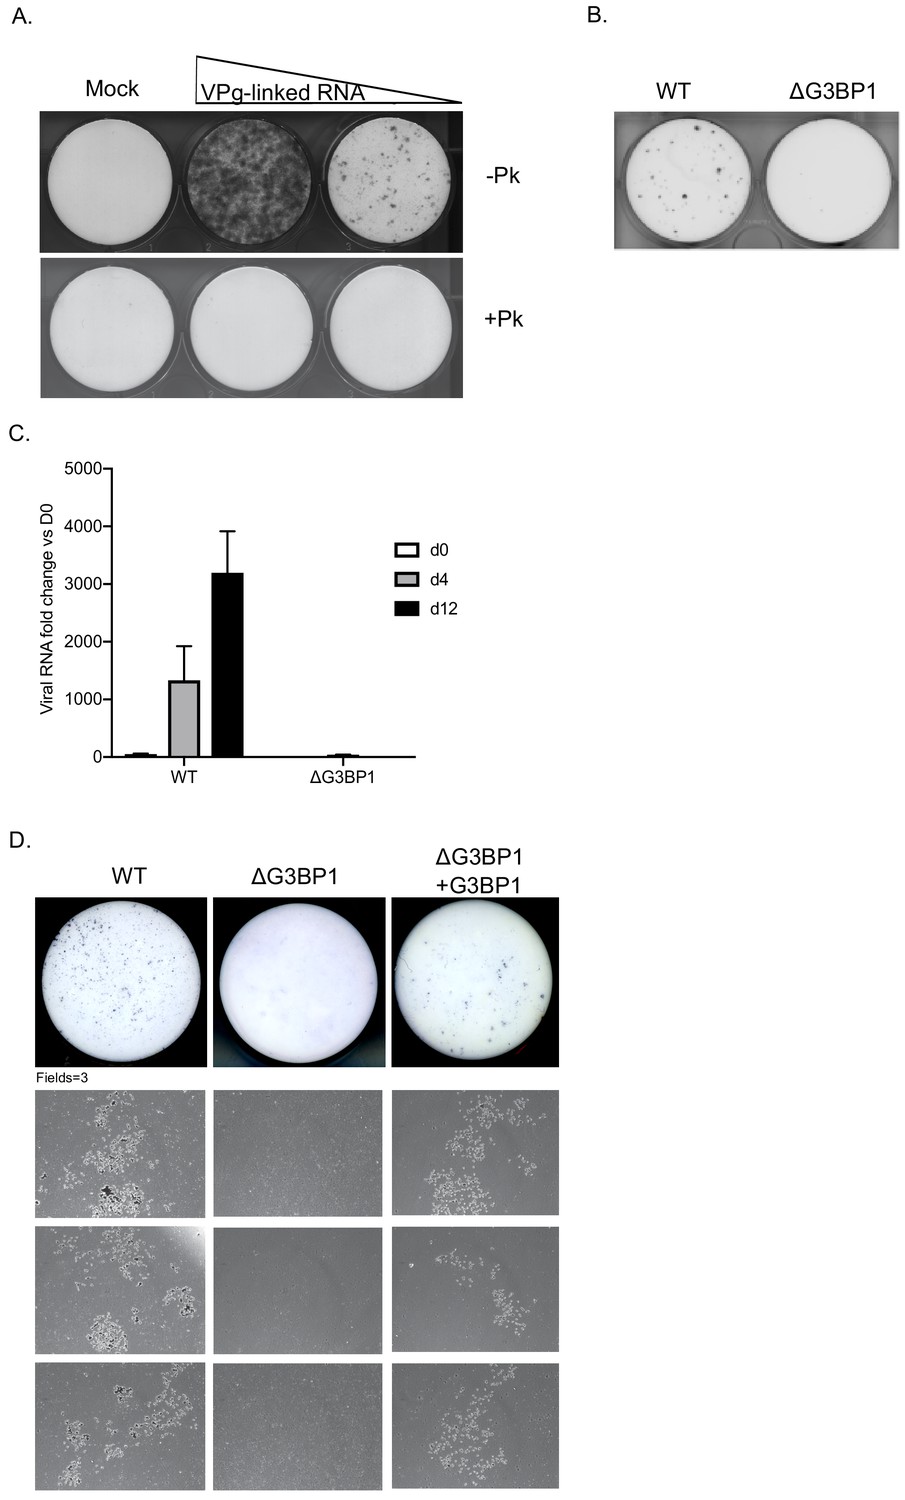
G3BP1 is required for human Norwalk virus replication in cell culture.
(A) Colony formation ability of human norovirus VPg-linked RNA isolated from BHK-NV replicon containing cells is dependent on the presence of VPg. NV VPg-linked RNA isolated from BHK-NV cells was either mock treated or treated with proteinase K prior to transfection into BHK cells. Wells were transfected with either 1.5 μg or 0.75 μg of total RNA isolated from NV replicon containing BHK cells. Following 2 weeks of antibiotic selection with G418, surviving replicon containing colonies were fixed and stained with crystal violet in paraformaldehyde. (B) NV replicon colony forming assay in WT and G3BP1-/- U2OS cells performed as described in panel A, with the exception that colonies were stained 12 days post transfection. (C) Quantification of NV replication in WT or ΔG3BP1 U2OS cells following transfection of viral VPg-linked RNA. Viral RNA was quantified by RT-qPCR following transfection and antibiotic selection. The error bars represent the standard error of three biological repeats and are representative of three independent experiments. (D) Analysis of the impact of loss of G3BP1 on NV replication in BV2 cells. Wild type BV2 cells, ΔG3BP1 BV2 cells or ΔG3BP1 BV2 cells reconstituted with wild type full length G3BP1 were transfected with NV replicon VPg-linked RNA. Following selection with G418 for 3 weeks, the cells were fixed and stained with toluidine blue to facilitate the visualisation of microcolonies. Pictures of the entire well and three independent fields of view are shown.
Figure 6
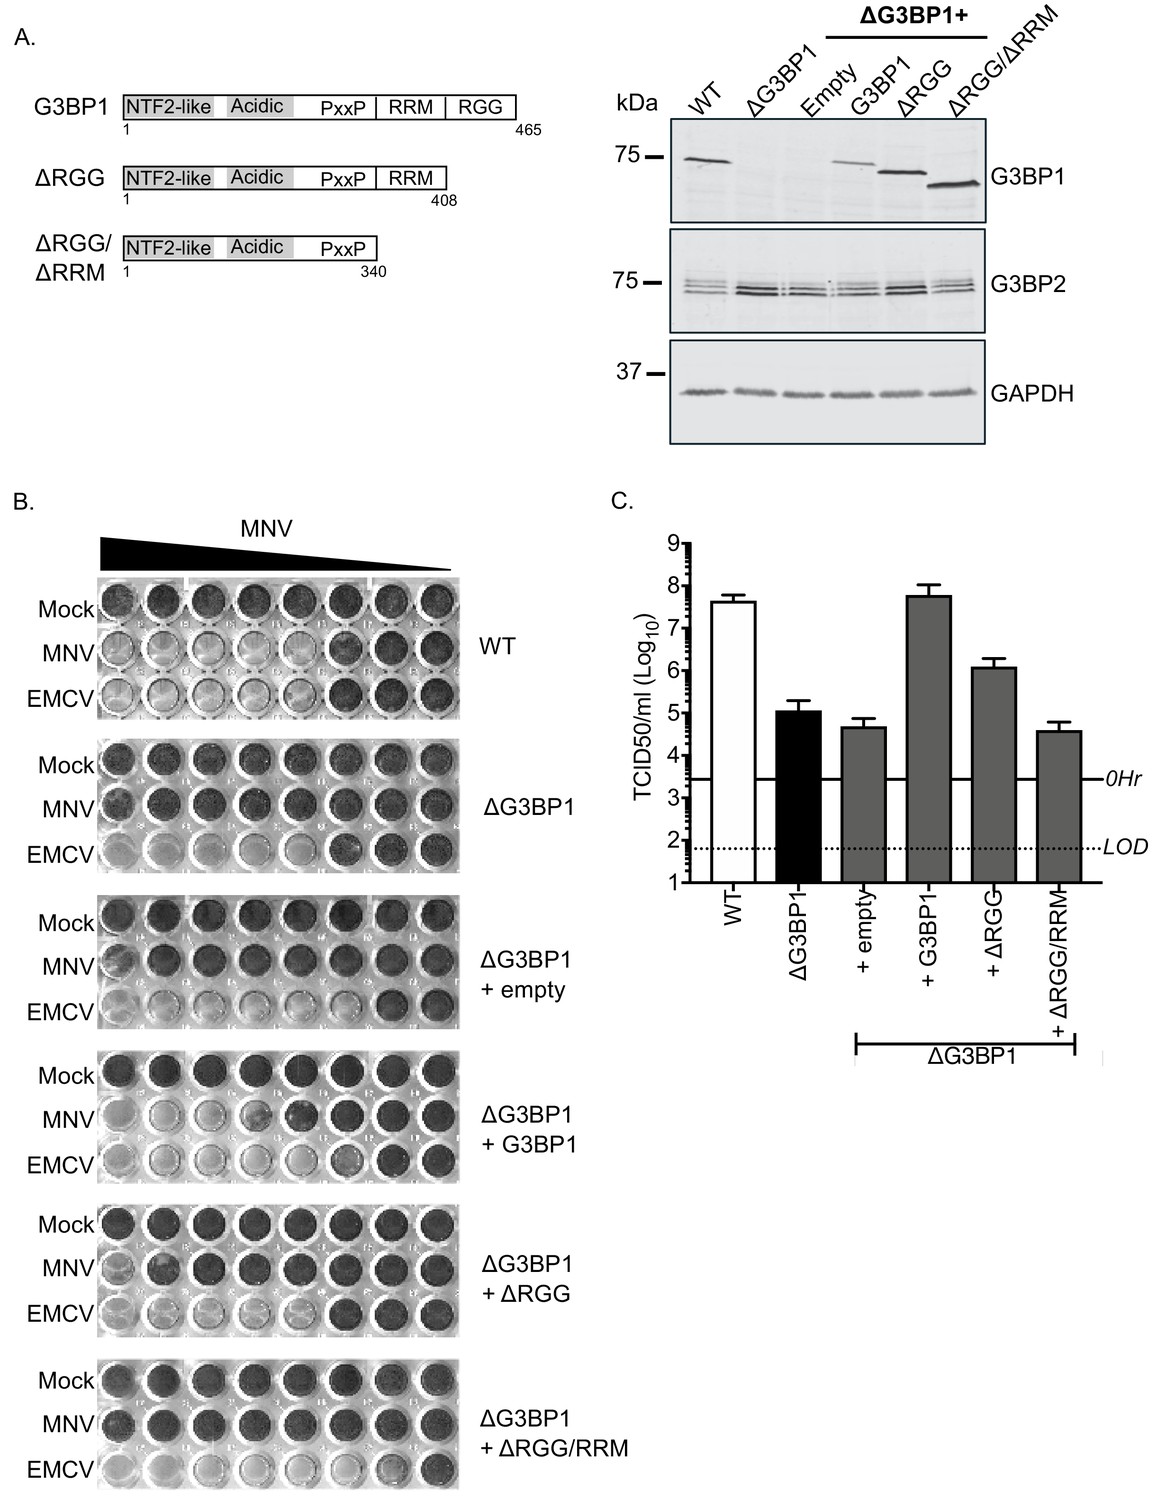
MNV replication in BV2 cells requires the RNA binding activity of G3BP1.
(A) Schematic illustration of the G3BP1 truncations used to identify the domains involved in the norovirus life cycle. The positions of the various domains including the RRM and RGG domains deleted in the ΔRGG and ΔRGG/ΔRRM mutants are also shown. Western blot analysis of wild type BV2 cells (WT) or a ΔG3BP1 cells (clone 1B2) and the respective complemented lines expressing either WT or the various G3BP1 truncations. Cells were lysed prior to separation by 12% SDS-PAGE. (B) WT or ΔG3BP1 cells complemented with the indicated constructs were plated in a 96 well plate then infected with a serial dilution of MNV, before being fixed and stained 5 days post infection as described in the text. (C) WT or ΔG3BP1 cells complemented with the indicated constructs were infected with MNV at an MOI of 10 TCID50 per cell. After 24 hr the virus yield was determined by TCID50. The error bars represent the standard error of three independent repeats. The data are representative of at least two independently repeated experiments.
Figure 7
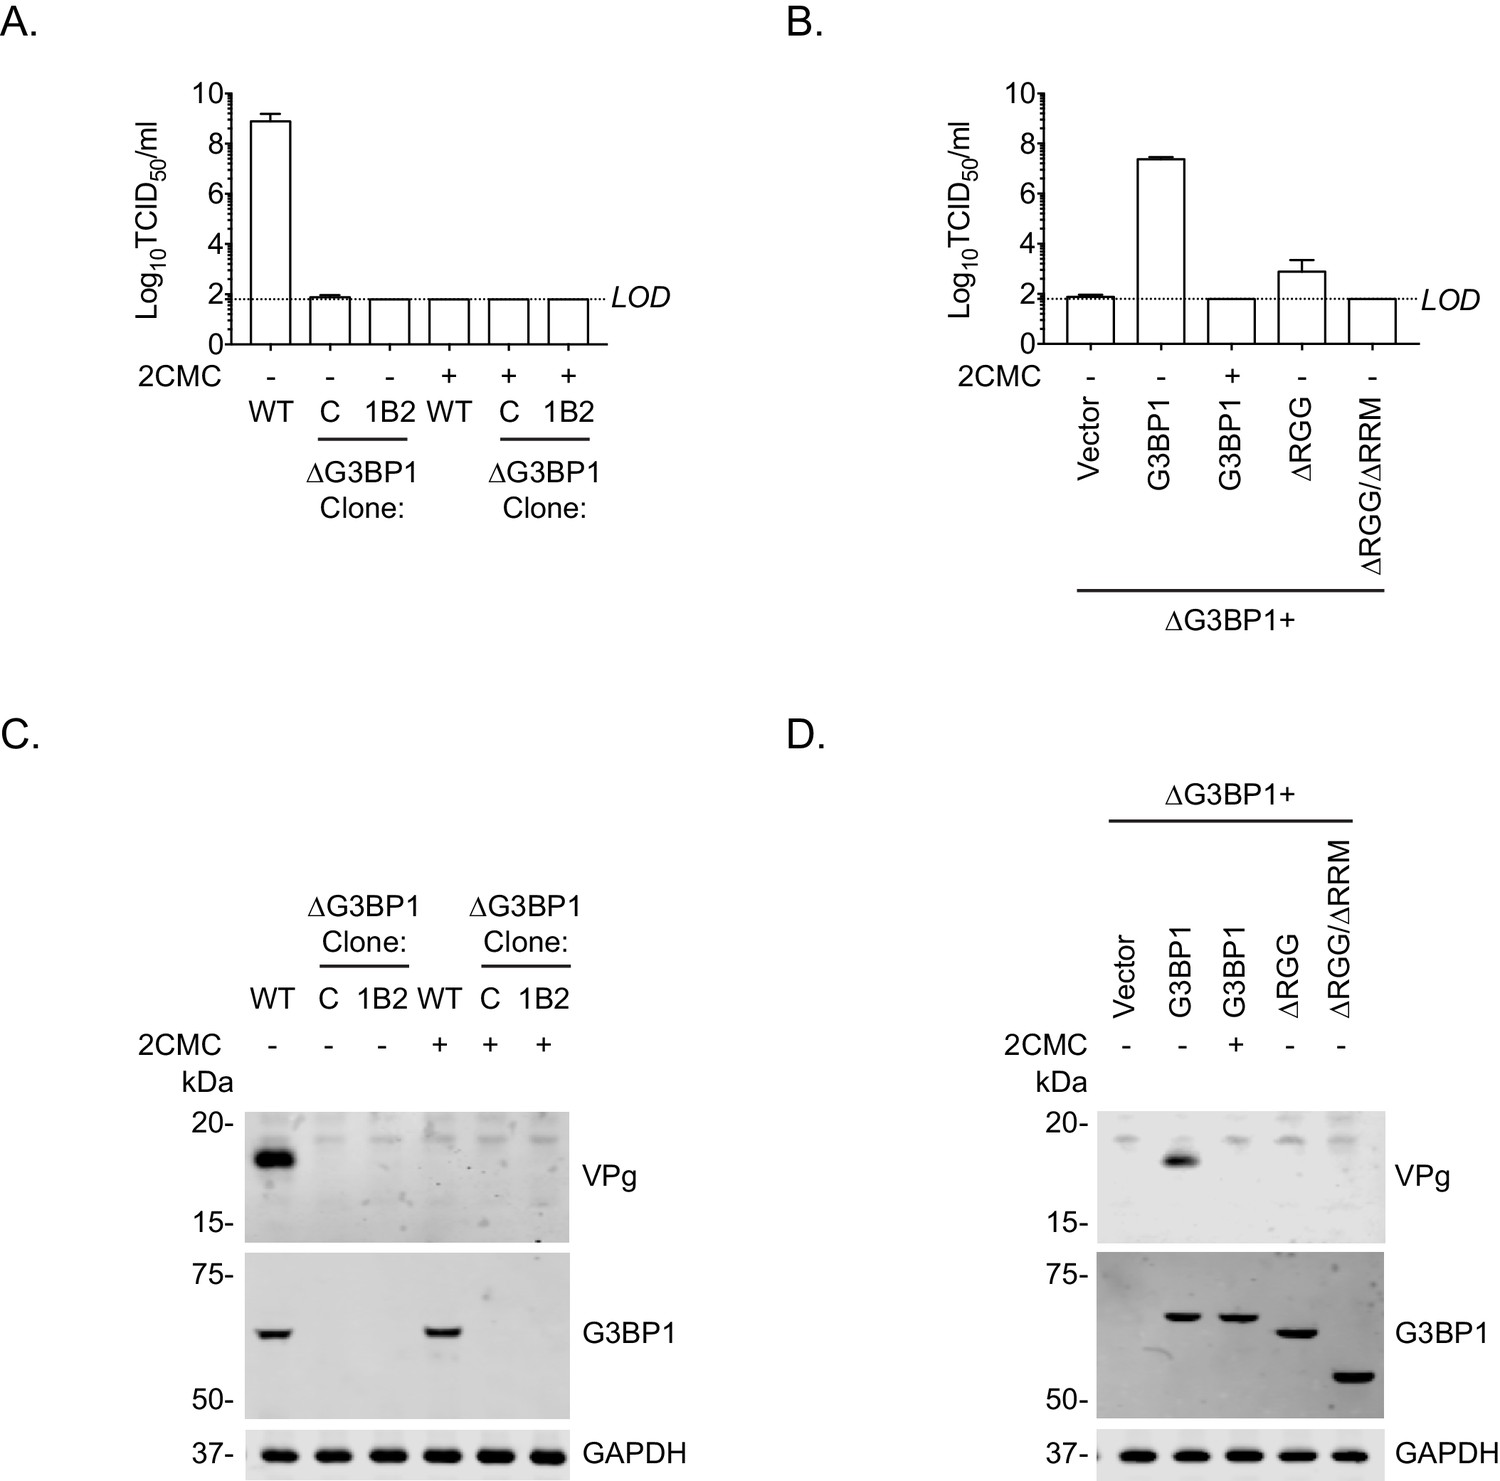
Loss of G3BP1 results in a defect following transfection of viral VPg-linked RNA into ΔG3BP1 cells.
(A) The indicated cell lines were transfected with MNV viral RNA and harvested at 9 hr post transfection for TCID50 to assess the virus yield. In some instances, the nucleoside analogue 2CMC was included to inhibit viral replication. The dotted line indicates the limit of detection (LOD) and the error bars represent the standard error from three biological repeats. (B) Infectious virus yield from ΔG3BP1 and reconstituted cell lines performed as described in panel A. (C) and (D) illustrate the accompanying western blots for samples prepared in panel A and B respectively. Samples were prepared at 24 hr post transfection, prior to harvesting, separation by SDS-PAGE on a 4–12% gradient gel prior to western blotting for the indicated proteins.
Figure 8
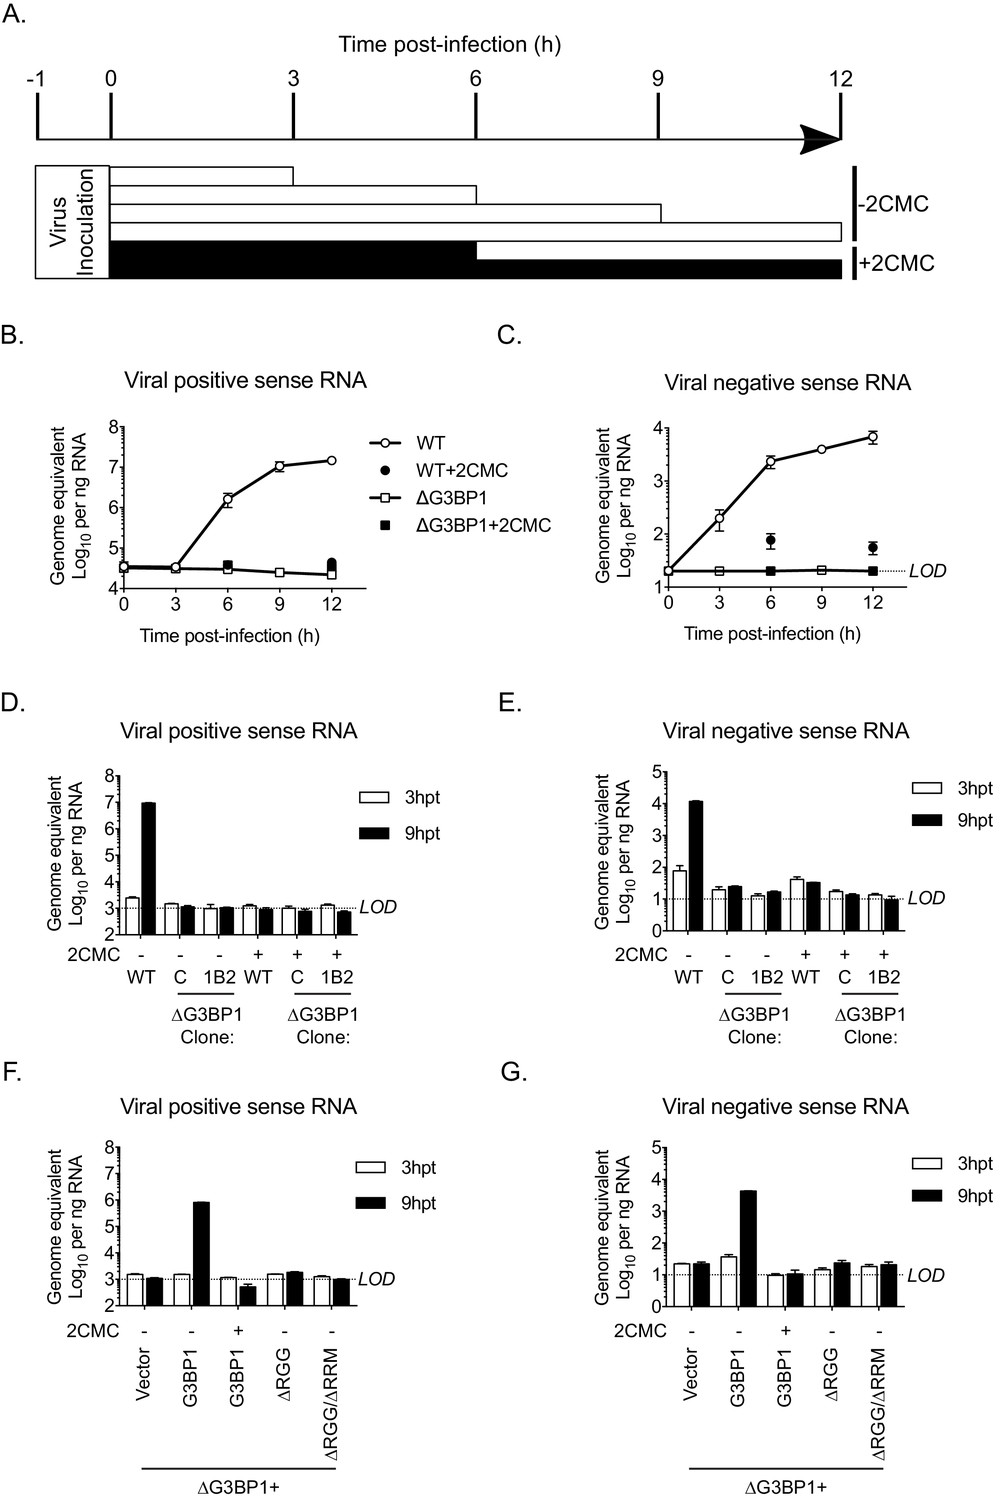
The Lack of G3BP1 results in a failure to produce viral negative sense RNA.
The experimental design is illustrated in (A). Wild type or ΔG3BP1 (1B2) cells were infected prior to the addition of the nucleoside analogue 2CMC to prevent viral RNA synthesis. Samples were harvest at the indicated time post infection and viral positive (B) and negative sense RNA quantified by stand specific RT-qPCR (C). Error bars represent standard error of three biological repeats. LOD refers to the limit of detection of the assay. (D) and (E) Viral RNA synthesis following transfection of viral VPg-linked RNA into WT or two ΔG3BP1 cell lines. (F) and (G) Viral RNA synthesis following transfection of viral VPg-linked RNA into ΔG3BP1 (1B2) complemented with full length G3BP1 or truncated derivatives. Error bars represent standard error of three biological repeats.
Figure 9 with 1 supplement
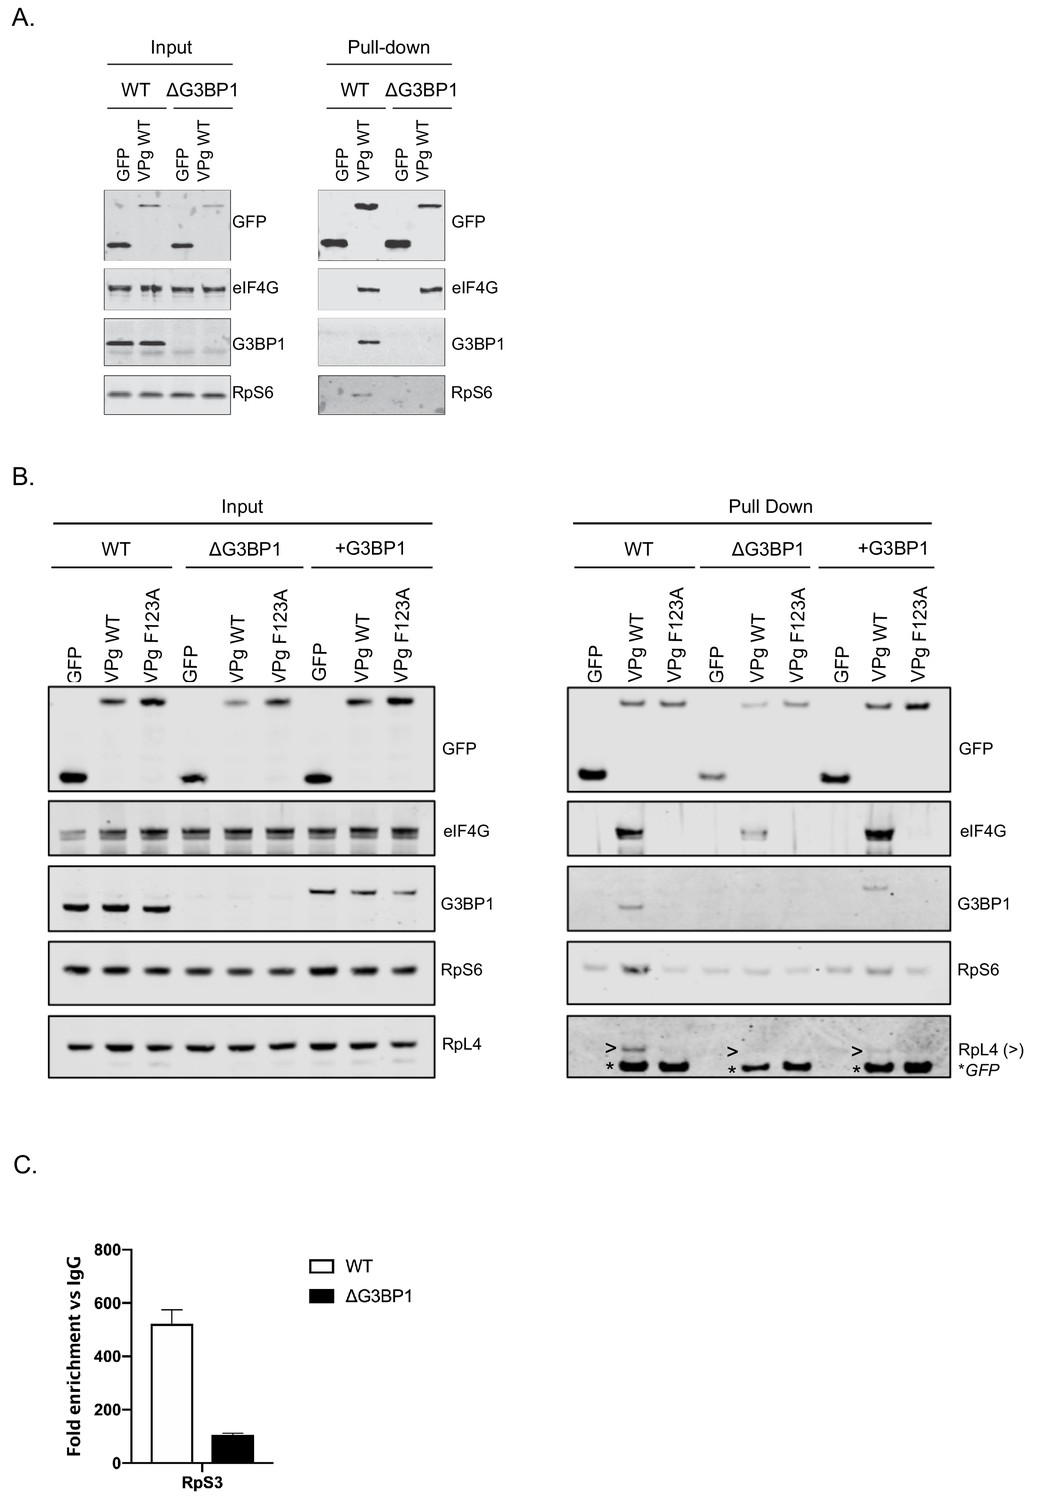
G3BP1 is required for the association of VPg and norovirus VPg-linked RNA with ribosomal subunits.
(A) GFP-Trap immunoprecipitation of complexes isolated on with GFP alone or GFP tagged wild type MNV-VPg demonstrating the pull down of eIF4G1, G3BP1 and 40S subunits (RpS6). BV2 cells were transfected with the relevant constructs, lysates prepared and GFP-Trap pull downs performed as detailed in the text. Samples were separated by SDS-PAGE and western blotted for the proteins as shown. (B) Mutations in the eIF4G binding domain ablate the association of VPg with G3BP1 and ribosomal subunits and the reconstitution of G3BP1 expression in ΔG3BP1 BV2 cells restores the interaction. GFP-Trap pull downs were performed as described in panel A with the addition of the MNV VPg F123A mutation known to reduce the association with eIF4G and the inclusion of the in ΔG3BP1 1B2 cell line engineered to express a Flag-tagged derivative of G3BP1. Following the pull down samples were analysed by western blot for presence of the ribosomal subunits using RpS6 and RpL4 as markers for the small and large ribosomal subunits respectively. >denoted the RpL4 proteins; whereas, * indicated the presence of GFP-VPg fusion proteins, present on the same membrane due to the sequential probing of the membrane. (C) Loss of G3BP1 results in decreased association between norovirus RNA and ribosomal proteins. WT or cells lacking G3BP1 were infected with MNV in the presence of the RNA polymerase inhibitor 2CMC and the amount of viral RNA found associated with RpS3 determined by RNA-IP. Error bars represent SEM of duplicate samples and the values are expressed as fold enrichment with respect to the IgG control antibody.
Figure 9—figure supplement 1
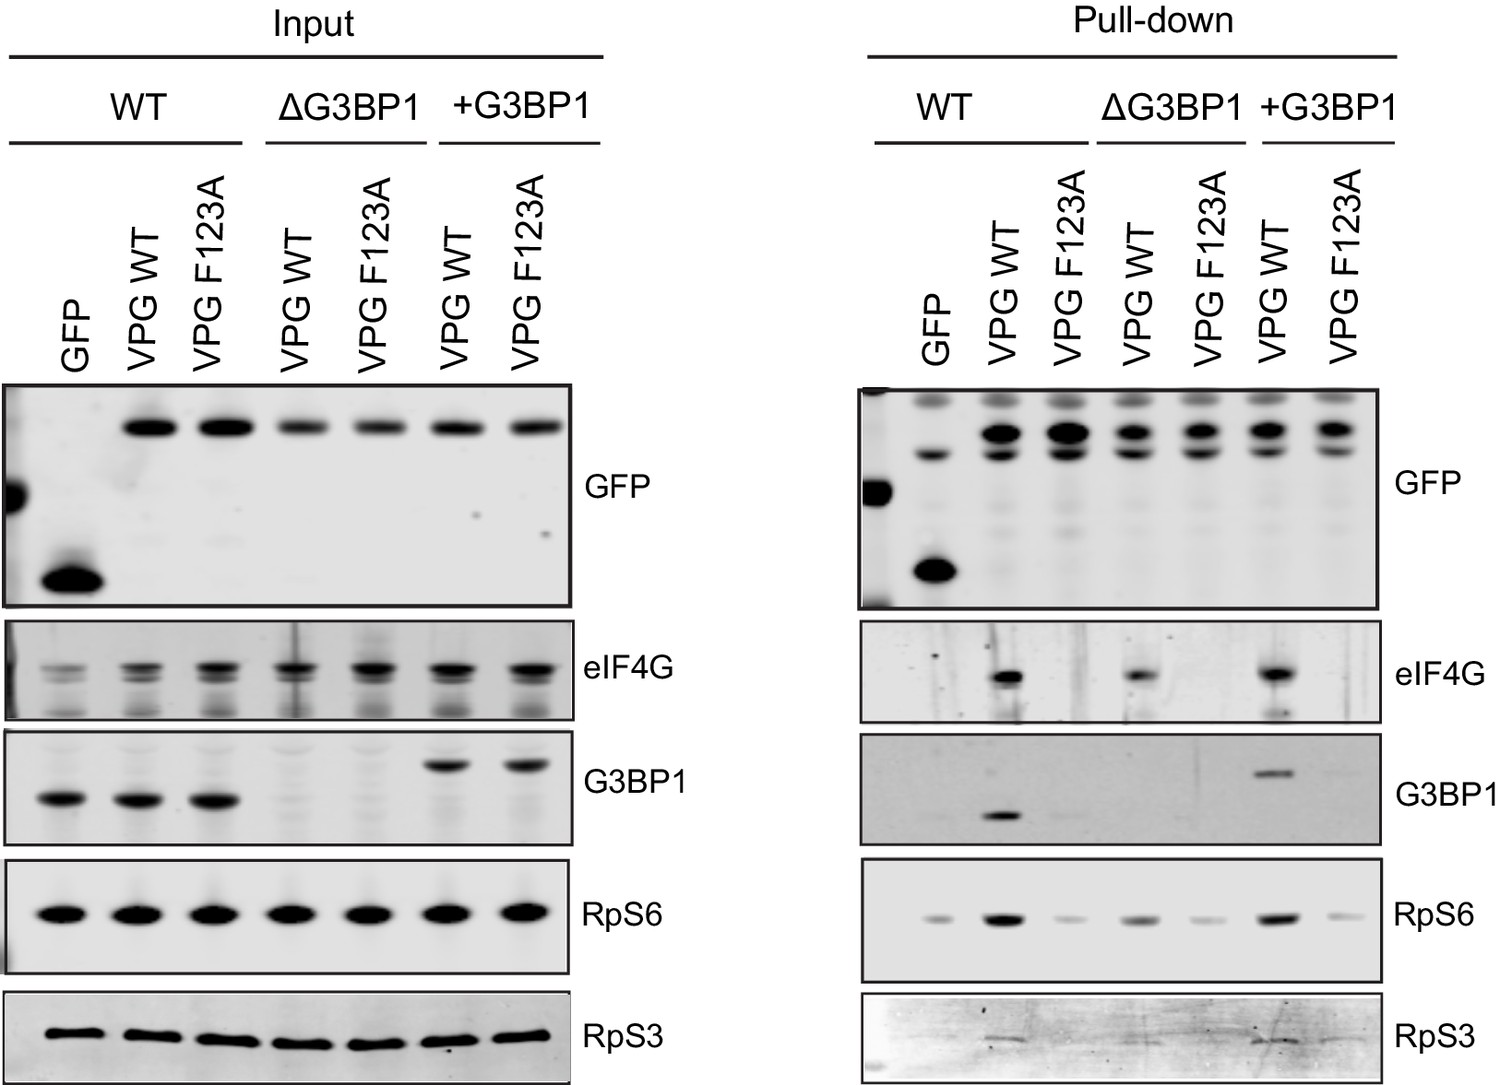
G3BP1 is required for the association of VPg with ribosomal subunits.
GFP-Trap pull down was performed as described in Figure 9 following transfection of GFP tagged derivatives of either a WT or a F123 MNV VPg proteins into WT BV2 cells, ΔG3BP1 BV2 cells or ΔG3BP1 BV2 cells engineered to express Flag tagged derivative of WT G3BP1. Following the GFP-Trap pull down, samples of the input and purified complexes were analysed by western blot for the proteins as shown.
Figure 10

G3BP1 is required for polysome association of viral RNA association.
(A) Polysome profiles of the ribosome containing fractions from mock or MNV infected wild type (WT) or ΔG3BP1 (1B2) BV2 cells at 4 and 9 hr post infection (moi 3 TCID50/cell). (B) Relative viral RNA levels present in ribosome containing fractions expressed relative to WT infected BV2 cells. (C) Extended gradient fractionation of WT or ΔG3BP1 cells infected with MNV and harvested 9 hr post infection. Viral RNA levels across the gradient are expressed as described in panel B. Error bars represent standard error of three technical repeats from each biological samples, defined as a single fraction from a single experiment. The data shown in panels A-C are representative of at least three experimental repeats.
Figure 11 with 1 supplement
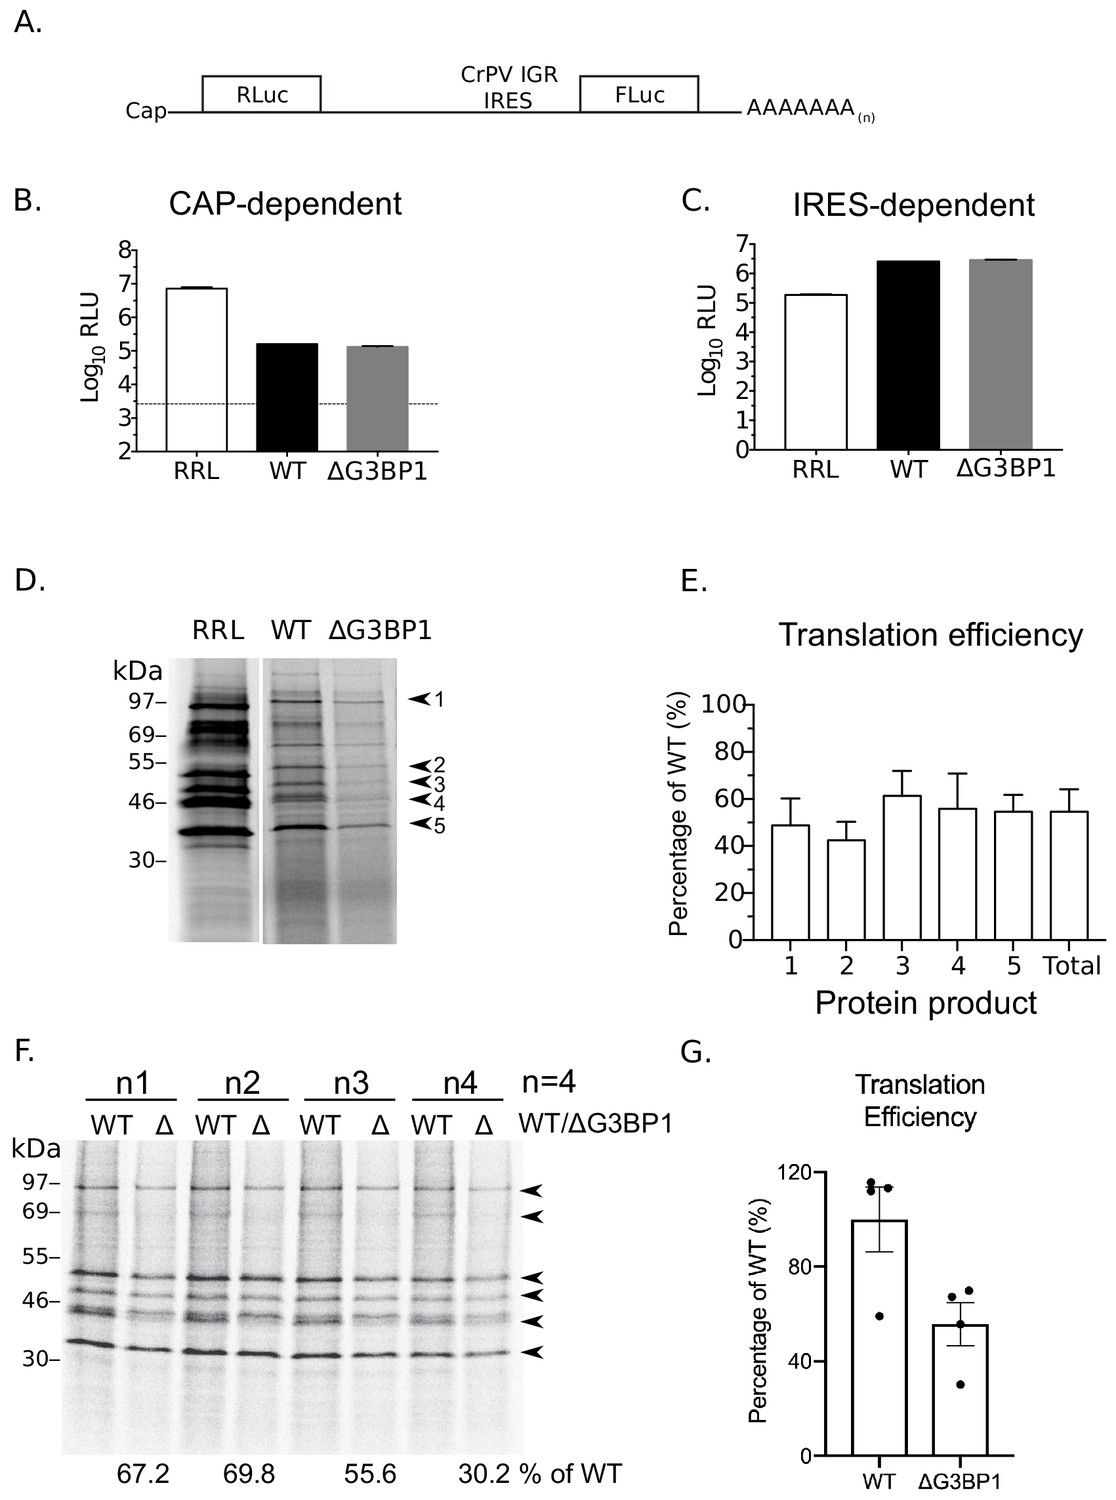
G3BP1 is required for efficient norovirus VPg-dependent translation.
(A) Illustration of the bicistronic construct used to assess the in vitro translation efficiency of the extracts prepared from WT BV2 cells or cells lacking G3BP1. The location of the 5’ cap and the 3’ poly (A) tails are highlighted in relation to the renilla and firefly luciferase coding regions, along with with the CrPV IRES. Comparsion of cap (B) and CrPV-IRES dependent translation (C) in translation competent extracts prepared from WT BV2 cells or BV2 cells lacking ΔG3BP1. Extracts were programmed with in vitro transcribed RNA as described in the text and the levels of luciferase compared to those obtained using rabbit reticulocyte lysate (RRL). (D) Translation of MNV VPg-linked viral RNA is diminished in nuclease treated extracts prepared from ΔG3BP1 cells. Translation of viral RNA in rabbit reticulocyte lysates (RRL) was used as a side by side comparison. The positions of the viral proteins quantified by phosphor imaging are indicated with arrow heads (1-5). (E) Quantification of norovirus protein synthesis for each of the identified protein products in panel D and total translation levels across multiple experiments. The levels of viral translation is expressed as a percentage relative to the same protein product translated in extracts prepared from WT cells. The error bars represent the standard error of three independent experiments. (F) Norovirus VPg-dependent translation in non-nuclease treated extracts prepared from WT or ΔG3BP1 cells. The total translation efficiency for the viral proteins, highlighted by arrowheads, is shown below the respective lane. Translation efficiency is expressed as a percentage in comparison to the average of translation seen in extracts prepared from WT cells across all biological repeats. E) Quantification of viral proteins produced in panel (D) plotted as % translation efficiency with respect to the translation levels observed in non-nuclease treated extracts from WT BV2 cells.
Figure 11—figure supplement 1
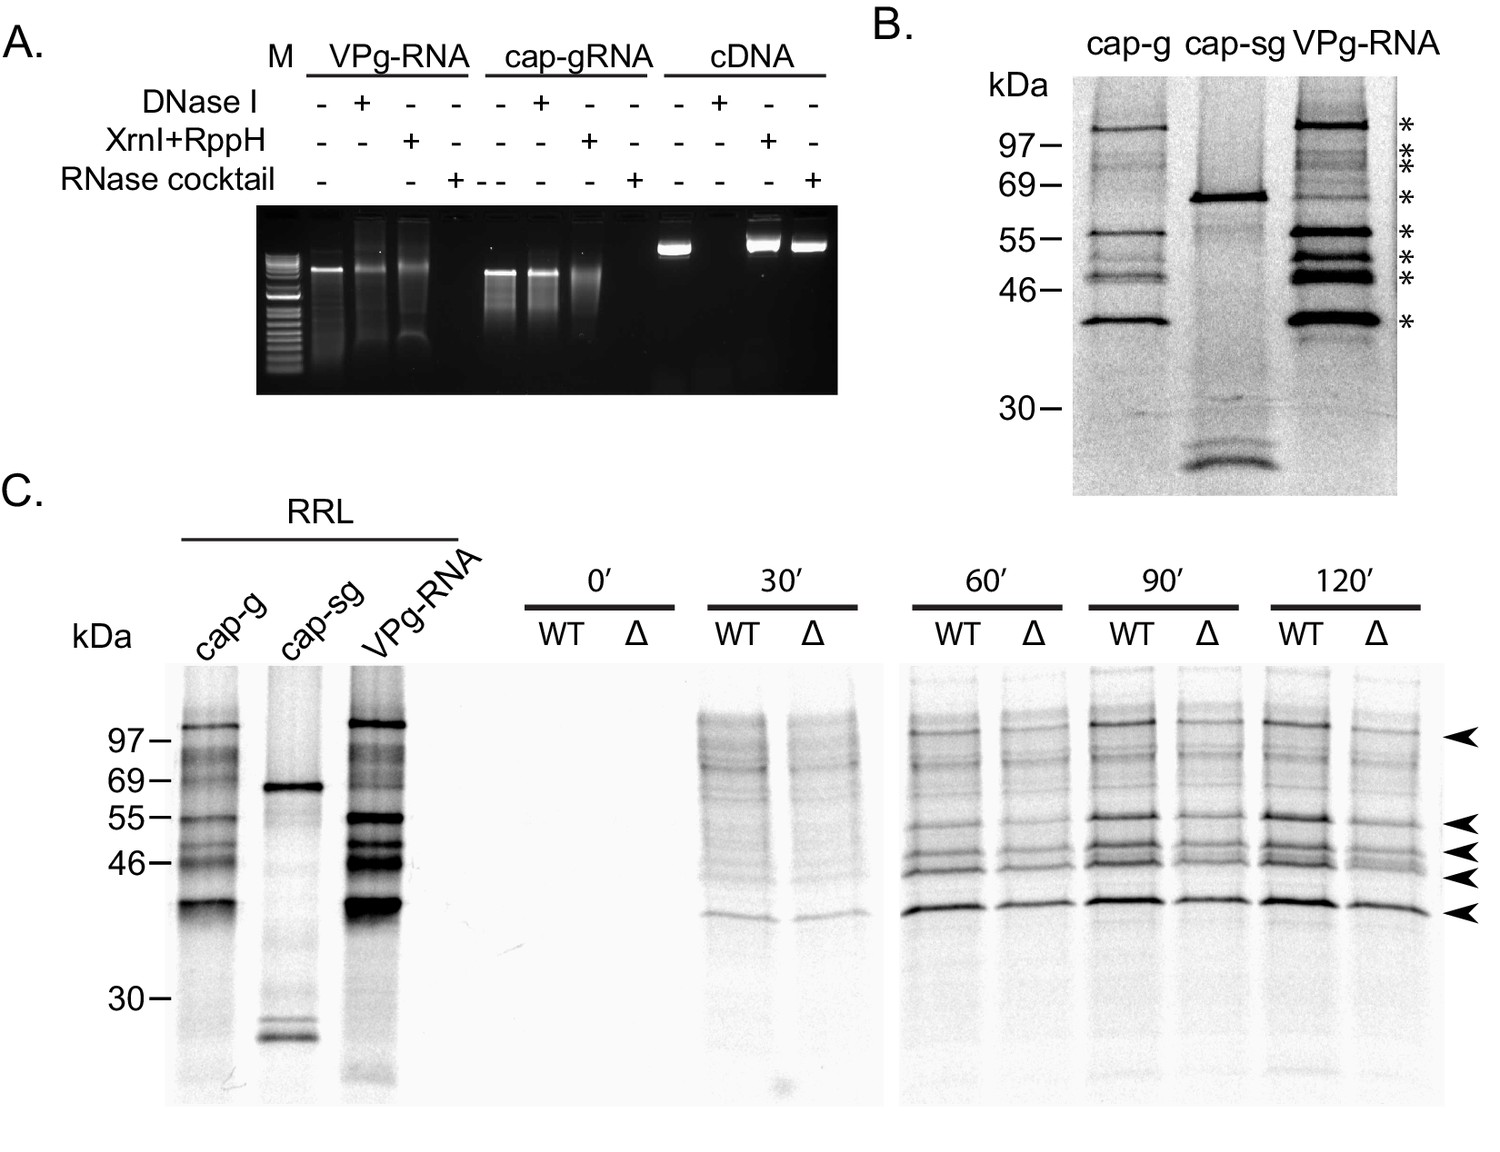
Lack of G3BP-1 results in reduced Norovirus VPg-dependent translation efficiency in vitro.
(A) Characterisation of viral VPg-linked RNA. The sensitivity of purified MNV VPg-linked RNA to various nucleases was compared to in vitro transcribed capped MNV gRNA (cap-gRNA) and the MNV1 full length cDNA construct. RppH was included as a decapping enzyme require for Xrn1-mediated cleavage of capped RNAs. Following digestion, the samples were analysed on a 1% native agarose gel. (B) In vitro translation of viral VPg linked RNA in rabbit reticulocyte lysates demonstrated robust translation and the production of a protein profile indistinguishable from in vitro transcribed capped genomic RNA (cap-g). Capped sub-genomic (cap-sg) RNA was included to demonstrate the location of the VP1 and VP2 proteins. (C) The translation of MNV VPg-linked RNA in extracts prepared from ΔG3BP1 cells is reduced across multiple time points. In vitro translations prepared in rabbit reticulocyte lysates (RRL) using in vitro transcribed capped genomic RNA (cap-g) or capped sub-genomic (cap-sg), along with viral VPg-linked RNA, was used as a reference for the expected mass of the viral proteins.
Additional files
-
Supplementary file 1
Raw data associated with Figure 1.
(A) Log2 SILAC ratio of proteins identified in Norwalk virus (NV) VPg GFP Trap pull downs. The experimental details are provided in the Materials and methods. SILAC ratios were computed by comparing the ratio of the peptides for each protein in the GFP control pull down to that obtained with the NV-GFP fusion protein. As described in the text each experiment was performed in three independent conditions varying the label in each biological sample. M/L – medium vs light sample, H/L – heavy vs light labelled sample and M/L – medium vs light sample. (B) As described in panel A but as obtained using the MNV VPg-GFP fusion protein as the bait.
- https://doi.org/10.7554/eLife.46681.019
-
Supplementary file 2
Raw data associated with Figure 2.
(A) Log2 SILAC ratio of proteins identified anti-FLAG immunoprecipitations from cells infected with the NS1/2 tagged MNV. The experimental details are provided in the Materials and methods. SILAC ratios were computed by comparing the ratio of the peptides for each protein in the anti-Flag immunoprecipitations performed on cells infected with wild type MNV. As described in the text each experiment was performed in three independent conditions varying the label in each biological sample. M/L – medium vs light sample, H/L – heavy vs light labelled sample and M/L – medium vs light sample. The Log2 transformed values and the average values are shown. (B) As described in panel A but as obtained using the NS4-FLAG tagged MNV. C) Combined dataset obtained using NS1/2 and NS4 tagged viruses showing the average Log2 SILAC ratios.
- https://doi.org/10.7554/eLife.46681.020
-
Supplementary file 3
Gene ontology and cross comparison analysis of the data obtained in Figure 2.
(A) Gene ontology of the host proteins found to be enriched by both NS1/2 and NS4. (B) PANTHER overexpression analysis of host proteins found to be enriched by both NS1/2 and NS4. (C) Raw data used for PANTHER analysis shown in panel B. (D) Colour code for data shown in panel C. (E) List of host proteins identified in previous studies as having (potential) roles in the norovirus life cycle along with their degree of overlap with the host proteins identified using NS1/2 and NS4. (F) Gene ontology analysis of host proteins identified as binding to the MNV NS1/2 protein and enriched using GFP-tagged MNV VPg.
- https://doi.org/10.7554/eLife.46681.021
-
Supplementary file 4
Raw data and further analysis of the data obtained in Figure 3.
(A) List of genes ranked with a positive STARS obtained with the Brie CRISPR screen against MNV CW3. (B) List of genes ranked with a negative STARS obtained with the Brie CRISPR screen against MNV CW3. (C) As in panel A except using the MNV strain CR6. (D) As in panel B except using the MNV strain CR6. (E) Combined STARS ranking for the genes in both MNV CW3 and CR6 data sets. (F) Comparison of genes with positive and negative STARS values in the data sets obtained using MNV CW3 and CR6. (G) Comparison of data from panel A and C with the previous MNV CRISPR screens. (H) Gene ontology overexpression analysis of genes identified in this study as having positive STARS values for both MNV CW3 and CR6.
- https://doi.org/10.7554/eLife.46681.022
-
Supplementary file 5
Comparison of data obtained from three screens to identify host factors involved in the norovirus life cycle.
(A) Comparison of the data obtained using MNV VPg-GFP trap with the MNV NS1/2 and NS4-FLAG tagged purifications. (B) Comparison of the data obtained using the CRISPR screen and the MNV NS1/2 and NS4-FLAG tagged purifications. (C) Comparison of the data obtained from all three screens.
- https://doi.org/10.7554/eLife.46681.023
-
Transparent reporting form
- https://doi.org/10.7554/eLife.46681.024
Download links
A two-part list of links to download the article, or parts of the article, in various formats.
Downloads (link to download the article as PDF)
Open citations (links to open the citations from this article in various online reference manager services)
Cite this article (links to download the citations from this article in formats compatible with various reference manager tools)
Noroviruses subvert the core stress granule component G3BP1 to promote viral VPg-dependent translation
eLife 8:e46681.
https://doi.org/10.7554/eLife.46681


