Structural and functional characterization of an otopetrin family proton channel
- University of Texas Southwestern Medical Center, United States
- Howard Hughes Medical Institute, University of Texas Southwestern Medical Center, United States
Figures
Figure 1 with 1 supplement
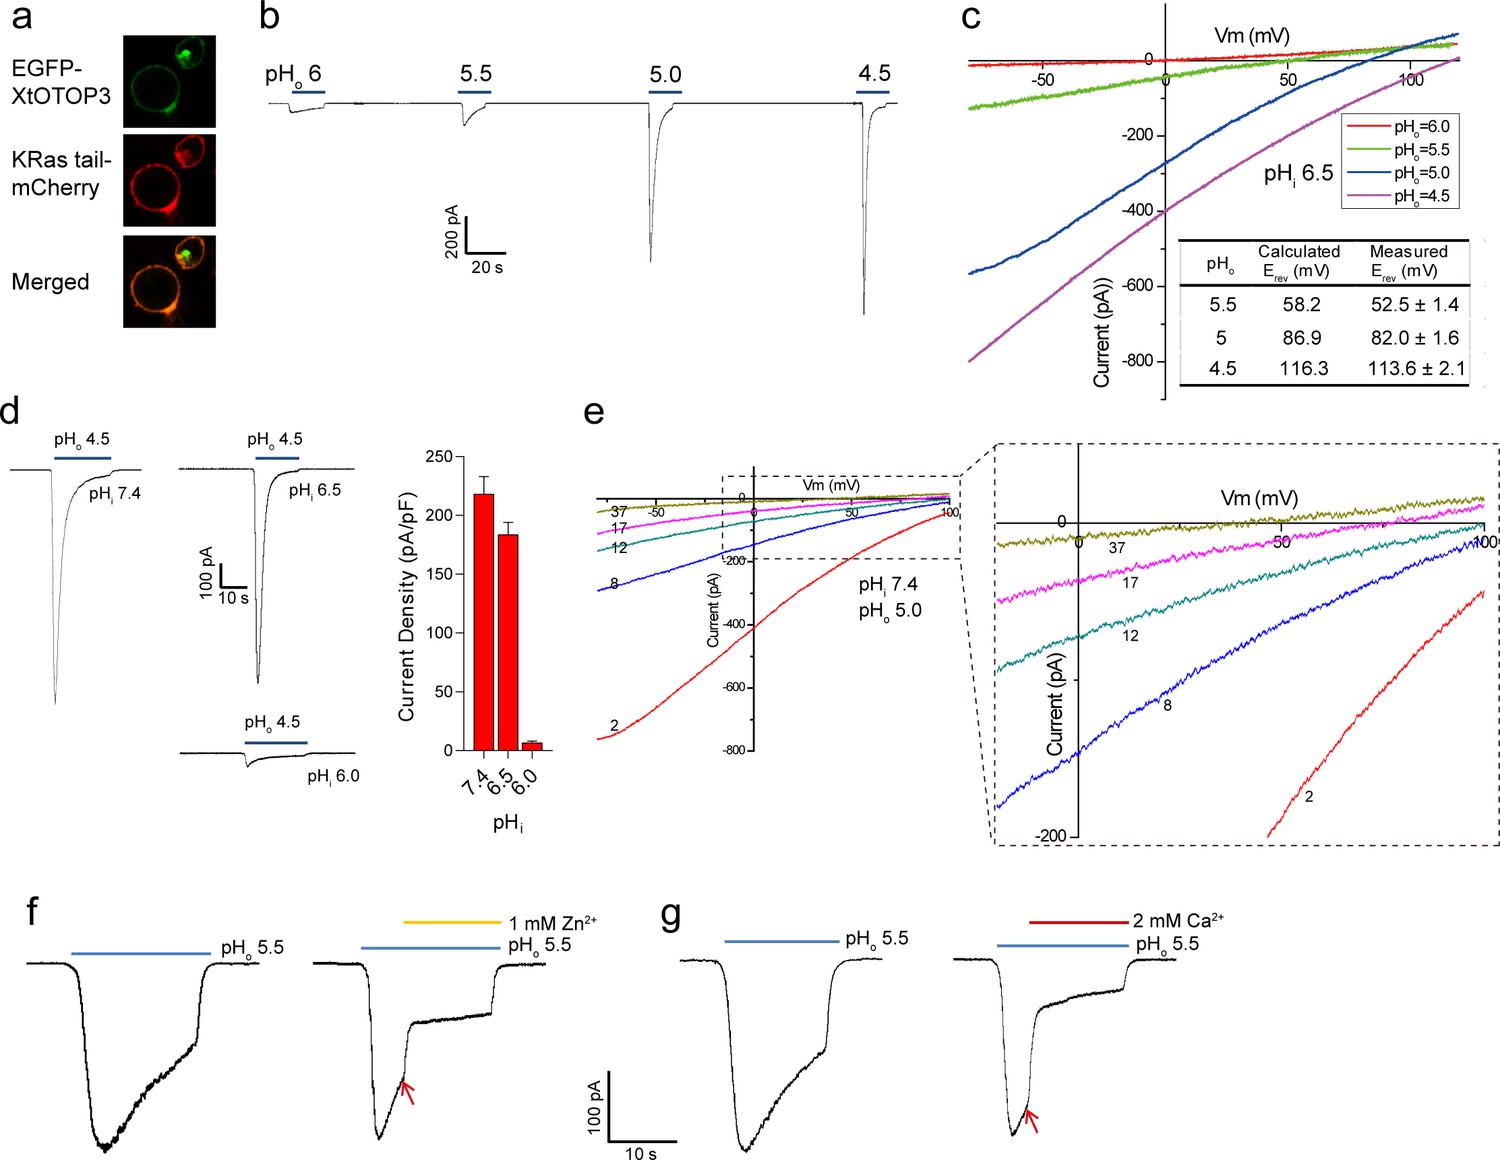
Functional characterization of XtOTOP3.
(a) Plasma membrane localization of XtOTOP3 expressed in HEK293 cells. (b) Sample traces of whole-cell currents measured at −100 mV in HEK-293 cell expressing XtOTOP3 in Na+-free extracellular solution. Currents were elicited by changing the extracellular pH (pHo) from 7.4 to various acidic pH. Intracellular pH (pHi) was set at 7.4. (c) Sample I-V curves of XtOTOP3 with varying extracellular pH. The intracellular pH is set at 6.5. Inset shows the calculated and measured reversal potentials at pHo = 4.5–5.5. (d) Sample traces of the whole-cell currents measured at −100 mV with pHo = 4.5 and pHi = 6.0, 6.5 and 7.4 (left), and the current density at various pHi (right). (e) Sample I-V curves obtained by repetitive voltage ramps from −100 mV to 100 mV over a 150 ms duration with 90 ms intervals at pHi = 7.4 and pHo = 5.0. We used short ramp duration for I-V curves to reduce the total proton influx during each ramp and thereby slow down the current decay, allowing us to observe the progressive change in channel currents and the reversal potentials. Only representative I-V curves indicated by the voltage ramp numbers are shown. The expanded view (inset) highlights the progressive decrease in reversal potentials. (f) Sample traces of whole-cell currents recorded in the absence (left) and presence (right) of 1 mM extracellular Zn2+. pHi is set to 7.4 and the currents were elicited by changing pHo to 5.5 to reduce the rate of desensitization. (g) Sample traces of whole-cell currents recorded in the absence (left) and presence (right) of 2 mM extracellular Ca2+. Arrows indicate the time when divalent cations were introduced. Data in c and d are shown as mean ± s.e.m. (n = 5 independent experiments). All recordings shown here were performed using patch clamp in the whole-cell configuration.
-
Figure 1—source data 1
Source data for Figure 1d.
- https://doi.org/10.7554/eLife.46710.004
Figure 1—figure supplement 1
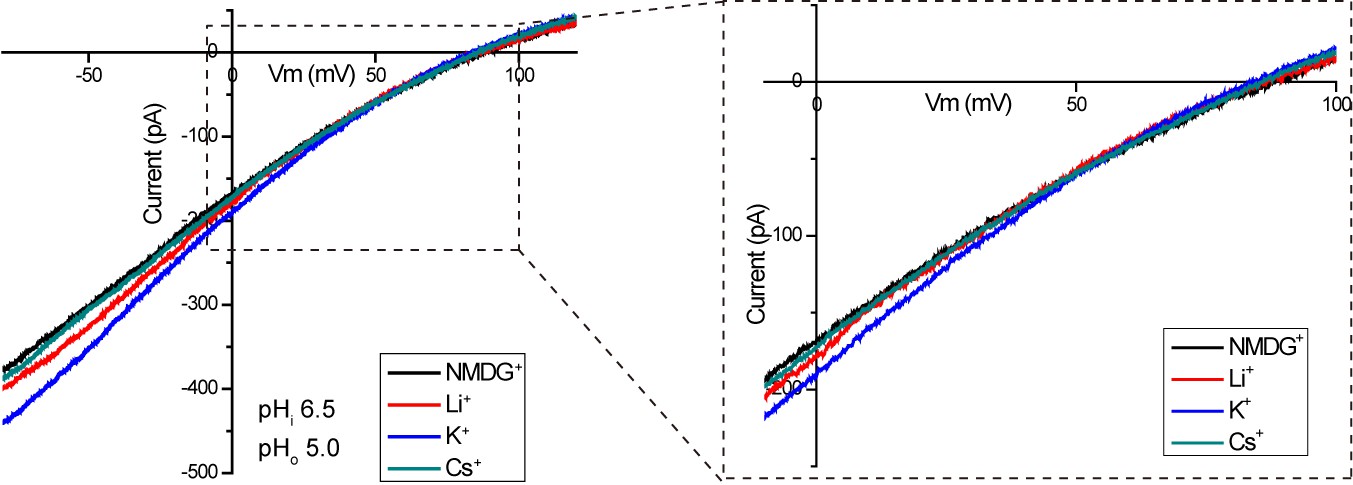
Proton selectivity of XtOTOP3.
Sample I-V curves of XtOTOP3 measured in the presence of 150 mM NMDG-MS (control), Li-MS, K-MS or Cs-MS in the extracellular solution. The data demonstrated that the reversal potential was not affected by the presence of various monovalent cations.
Figure 2 with 4 supplements
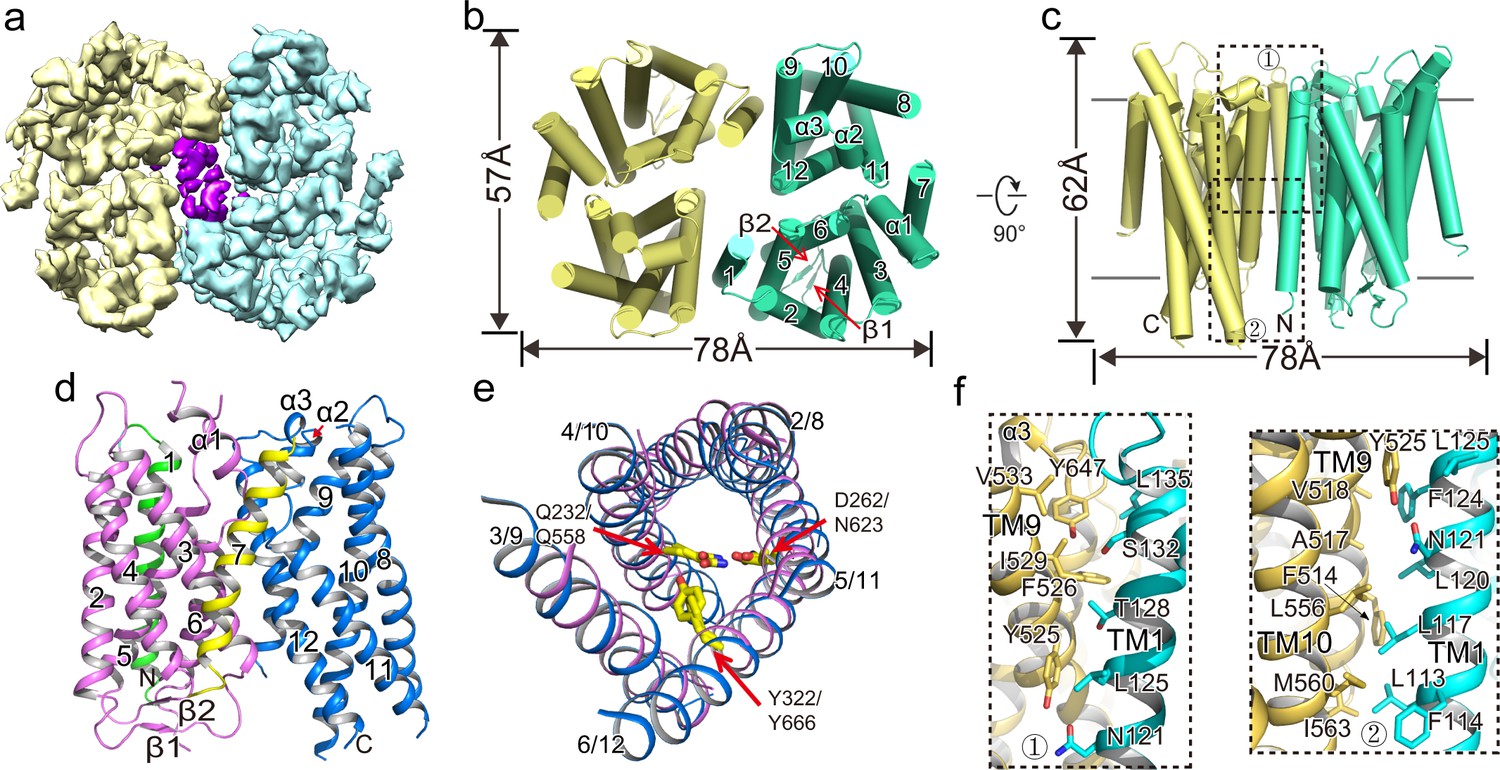
Overall structure of XtOTOP3.
(a) Top view of a 3D reconstruction of XtOTOP3 with each subunit individually colored and lipid density shown in purple. (b) Top view of a cylinder representation of the XtOTOP3 structure, with the secondary structural elements labeled in one subunit. (c) Side view of a cylinder representation of the XtOTOP3 structure. (d) Cartoon representation of a single subunit of the XtOTOP3 structure with secondary structural elements labeled. The two α-barrels from the N- and C-halves are colored purple and blue, respectively. (e) Superimposition of the two α-barrels within each subunit, with the TM numbers labeled and the two sets of constriction triads shown as yellow sticks. Loops are removed for the superimposition. (f) Zoomed-in view of the inter-subunit dimerization contacts at the two regions marked by the dotted boxes in c.
-
Figure 2—source data 1
Cryo-EM data collection, refinement and validation statistics.
- https://doi.org/10.7554/eLife.46710.010
Figure 2—figure supplement 1
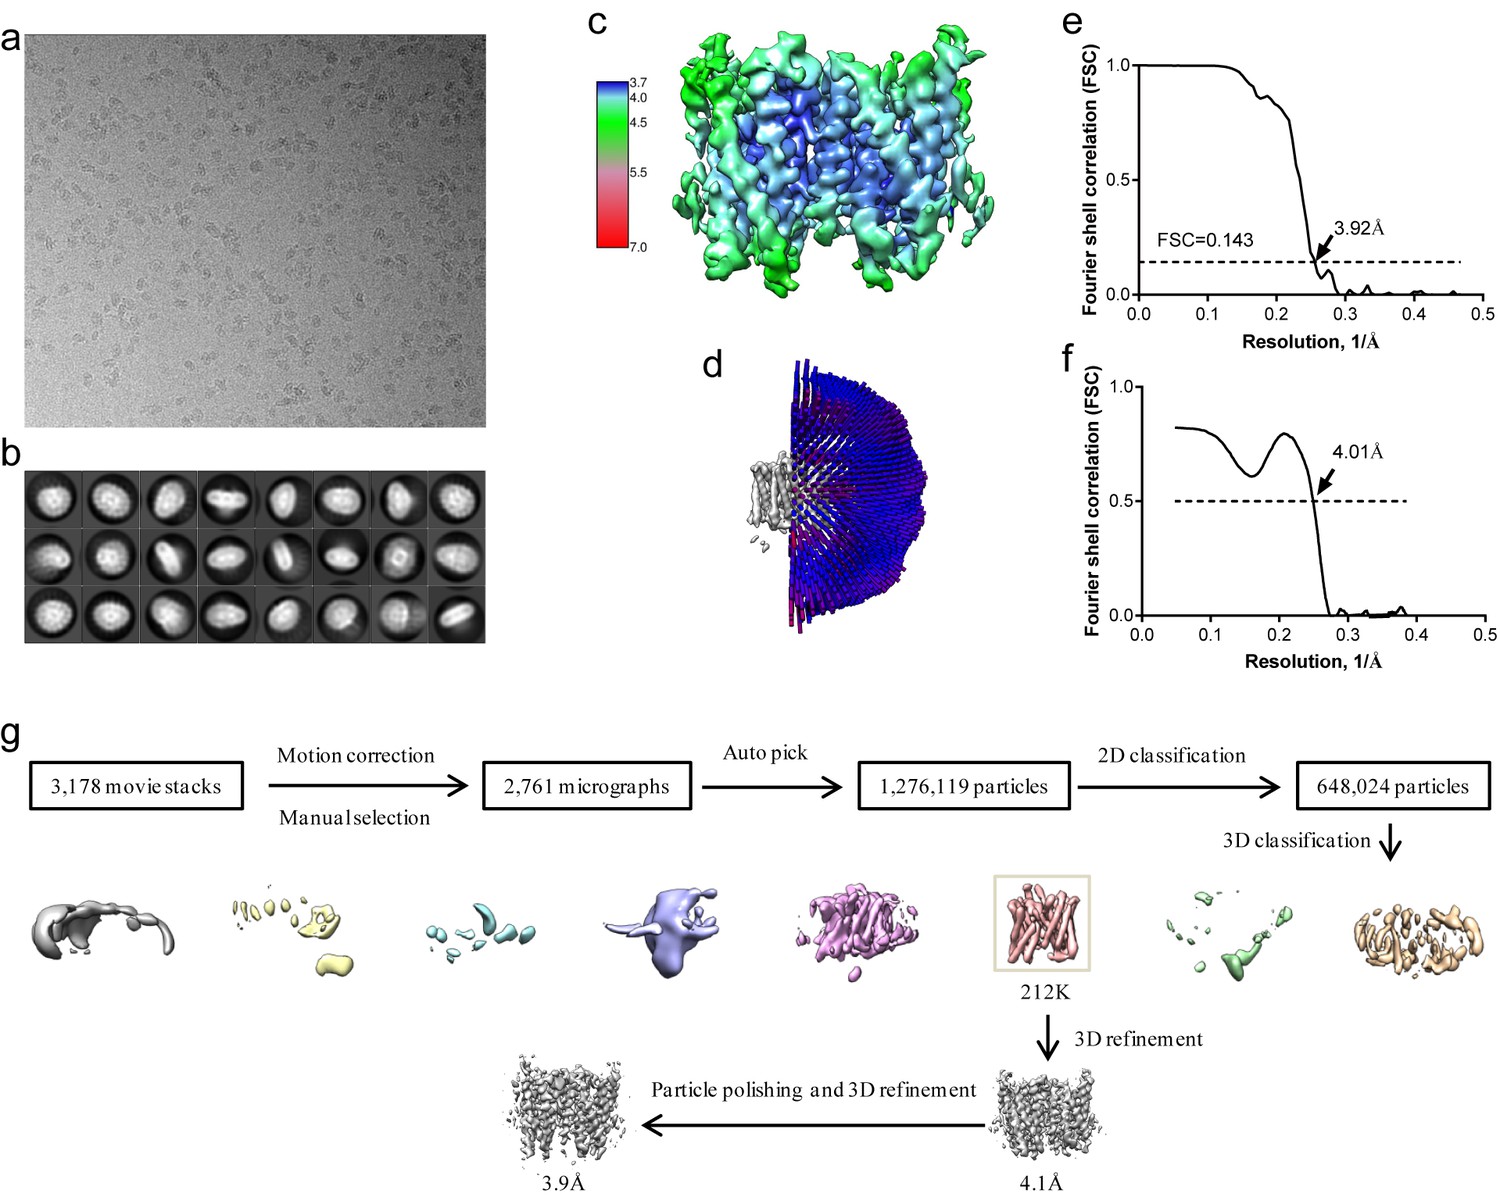
Structure determination of XtOTOP3.
(a) Representative micrograph of XtOTOP3 in DDM. (b) Two-dimensional class averages. (c) Final density maps colored by local resolution. (d) Euler angle distribution of particles used in the final three-dimensional reconstruction, with the heights of the cylinders corresponding to the number of particles. (e) Gold-standard FSC curves of the final 3D reconstructions. (f) FSC curves for cross-validation between the maps and the model. (g) Flowchart of image processing.
Figure 2—figure supplement 2
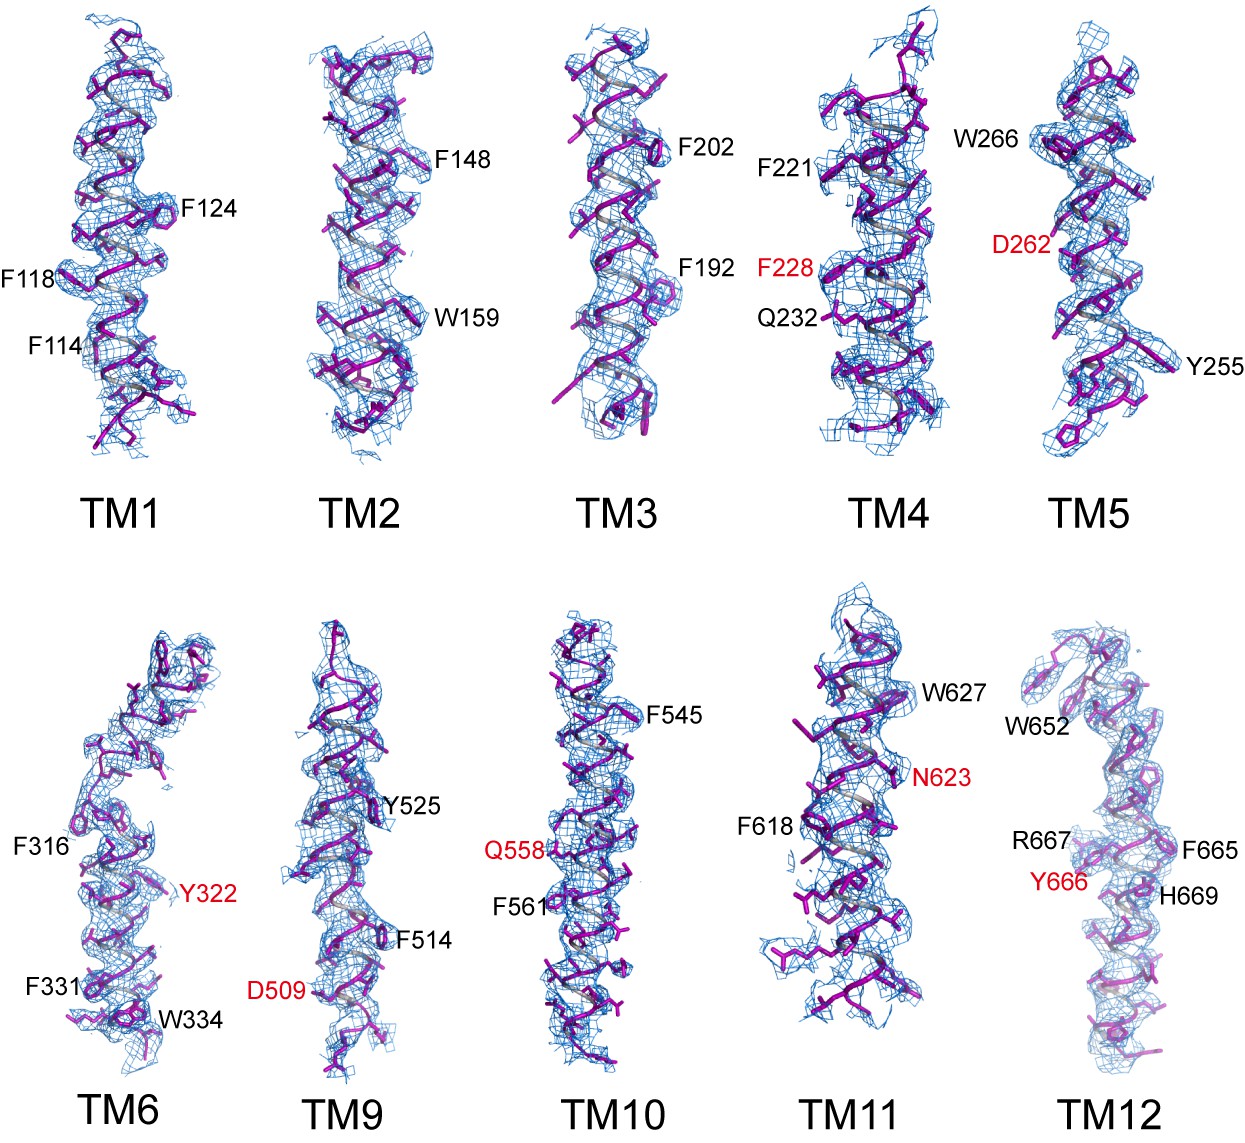
Sample EM density maps (blue mesh) for various parts of the channel.
The maps are low-pass filtered to 3.9 Å and sharpened with a temperature factor of −197 Å2. Residues with bulky side chains and residues from Gln-Asp/Asn-Tyr constriction triads are labeled in black and red, respectively.
Figure 2—figure supplement 3
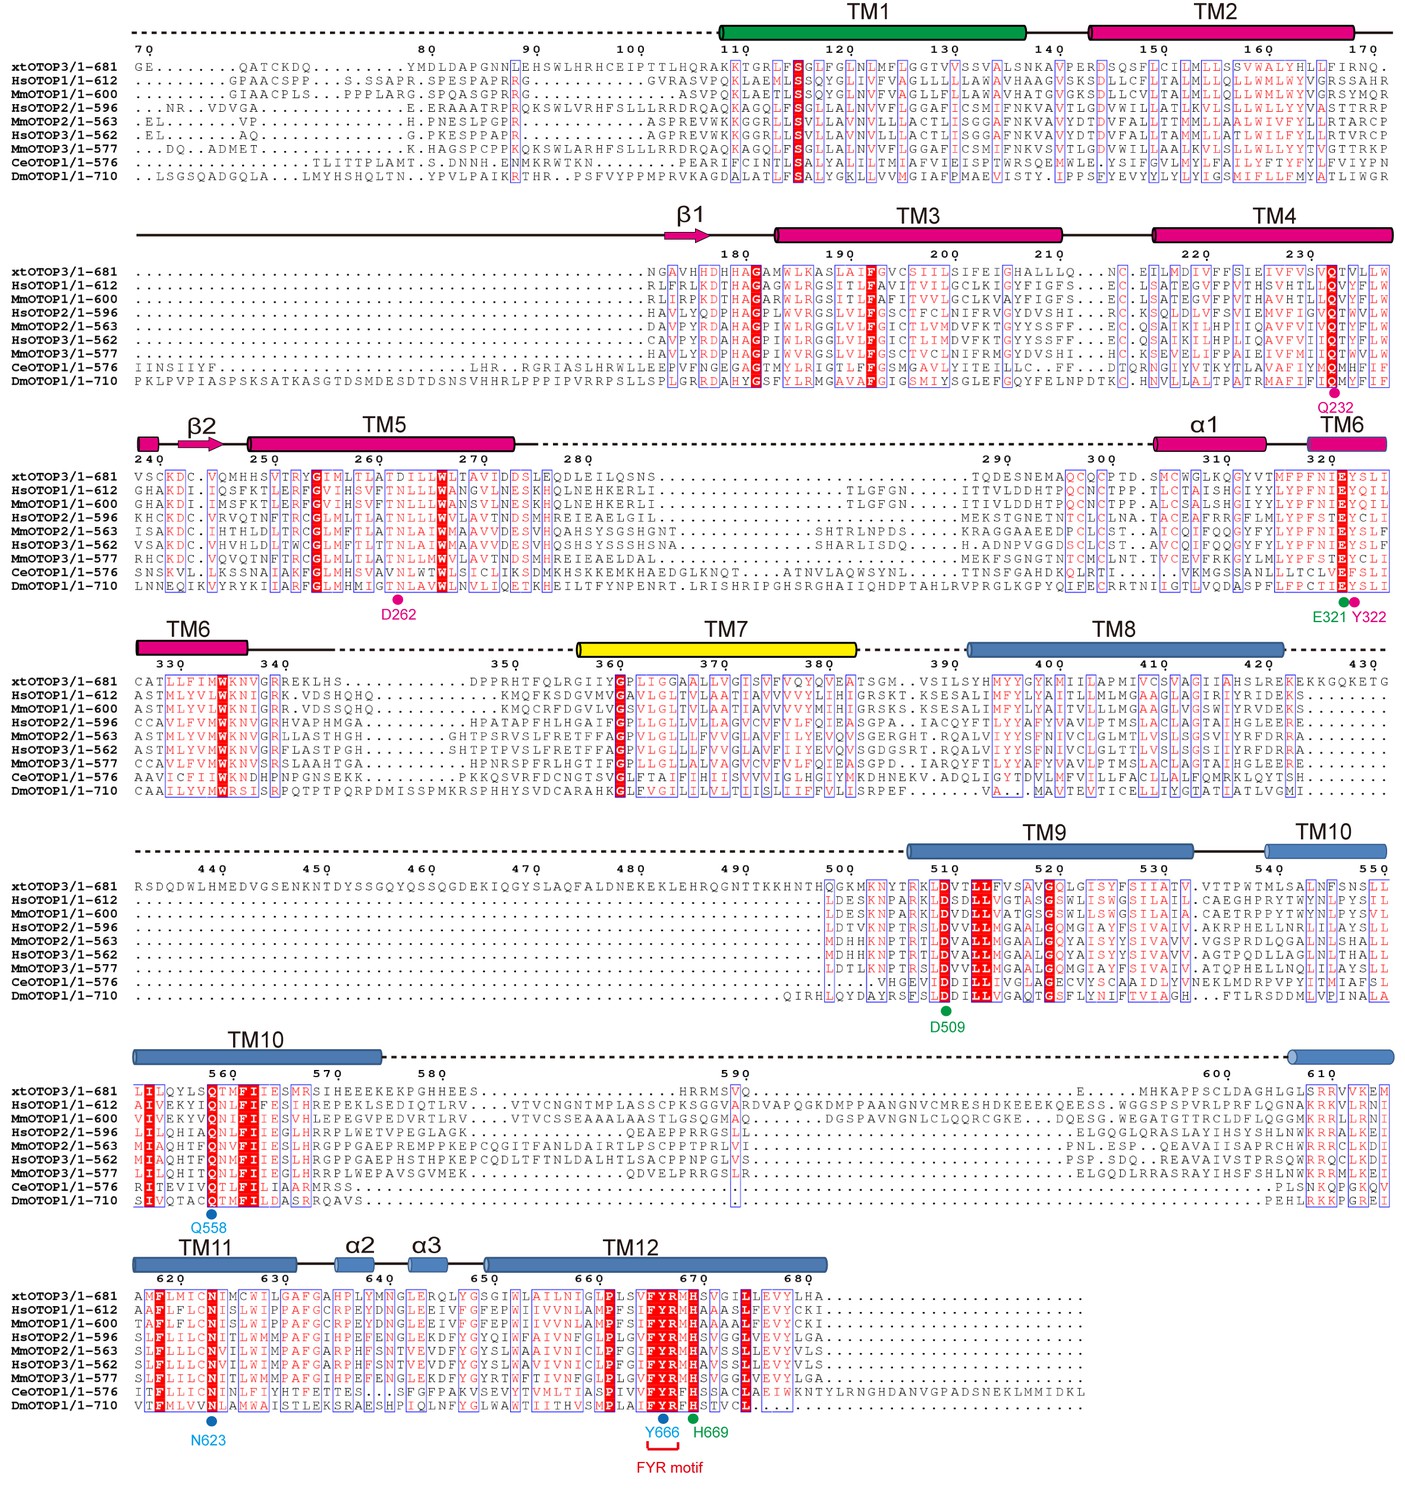
Multiple sequence alignment of otopetrin proton channels.
Secondary structure assignments are based on the XtOTOP3 structure (Xt, Xenopus tropicalis; Hs, Homo sapiens; Mm, Mus musculus; Ce, Caenorhabditis elegans; Dm, Drosophila melanogaster). Dashed lines indicate disordered regions. Pink dots mark the residues of the Gln232-Asp262-Tyr322 triad in the N-pore and blue dots mark the residues of the Gln558-Asn623-Tyr666 triad in the C-pore. Green dots mark the functionally important residues at the inter-pore interface. The FYR motif is highlighted and labeled in red.
Figure 2—figure supplement 4
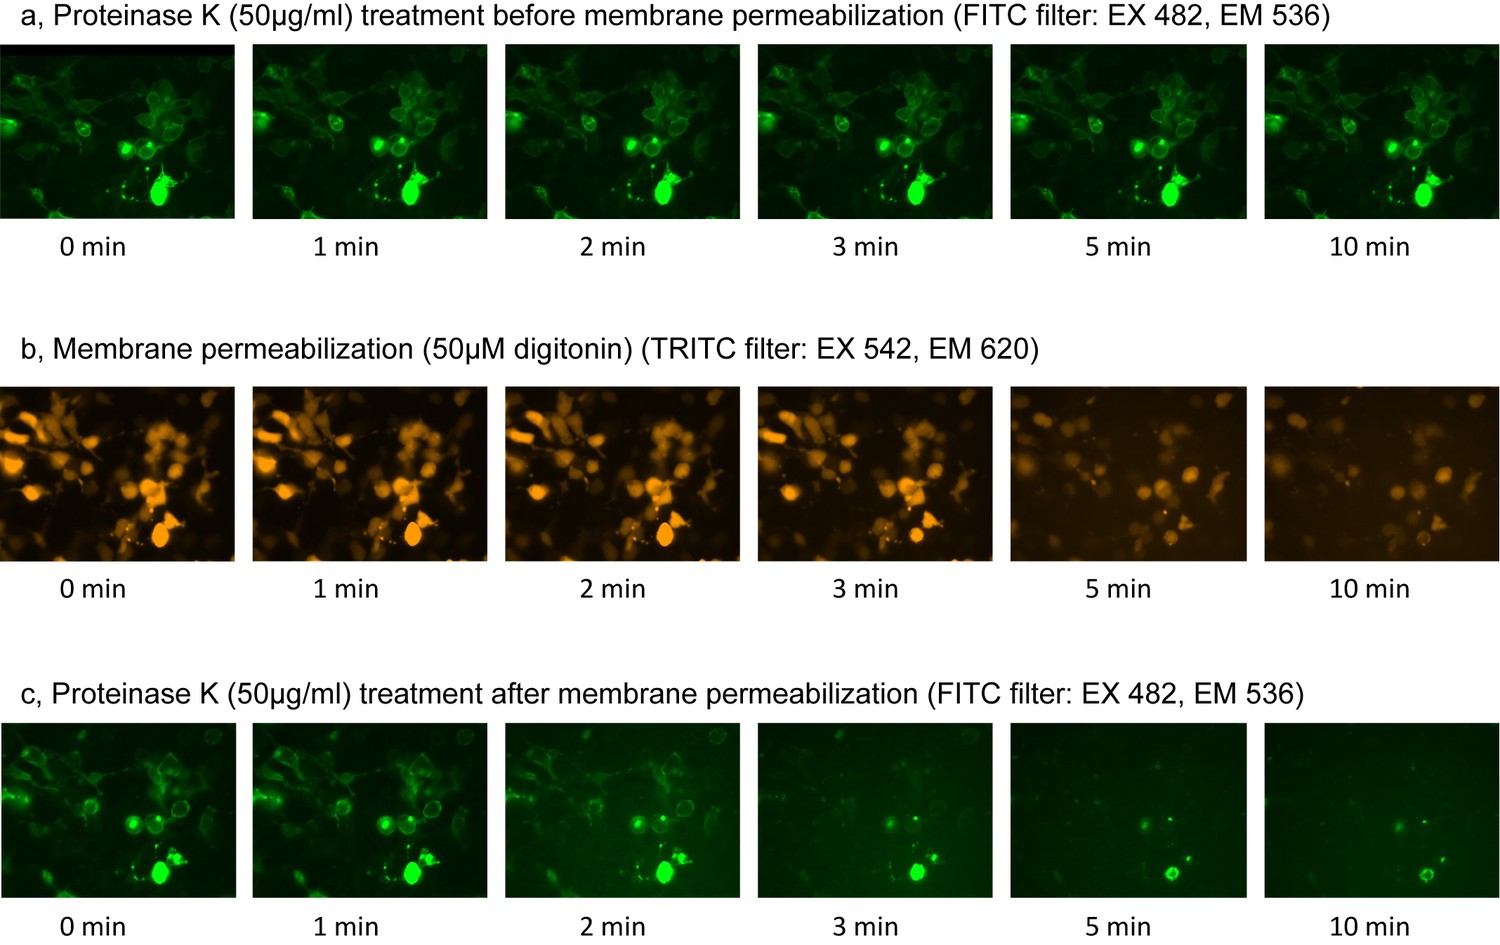
Fluorescence Protease Protection (FPP) assay.
(a) Green fluorescence images during proteinase K treatment before membrane permeabilization. (b) Orange fluorescence images during membrane permeabilization by digitonin. (c) Green fluorescence images during proteinase K treatment after membrane permeabilization.
Figure 3
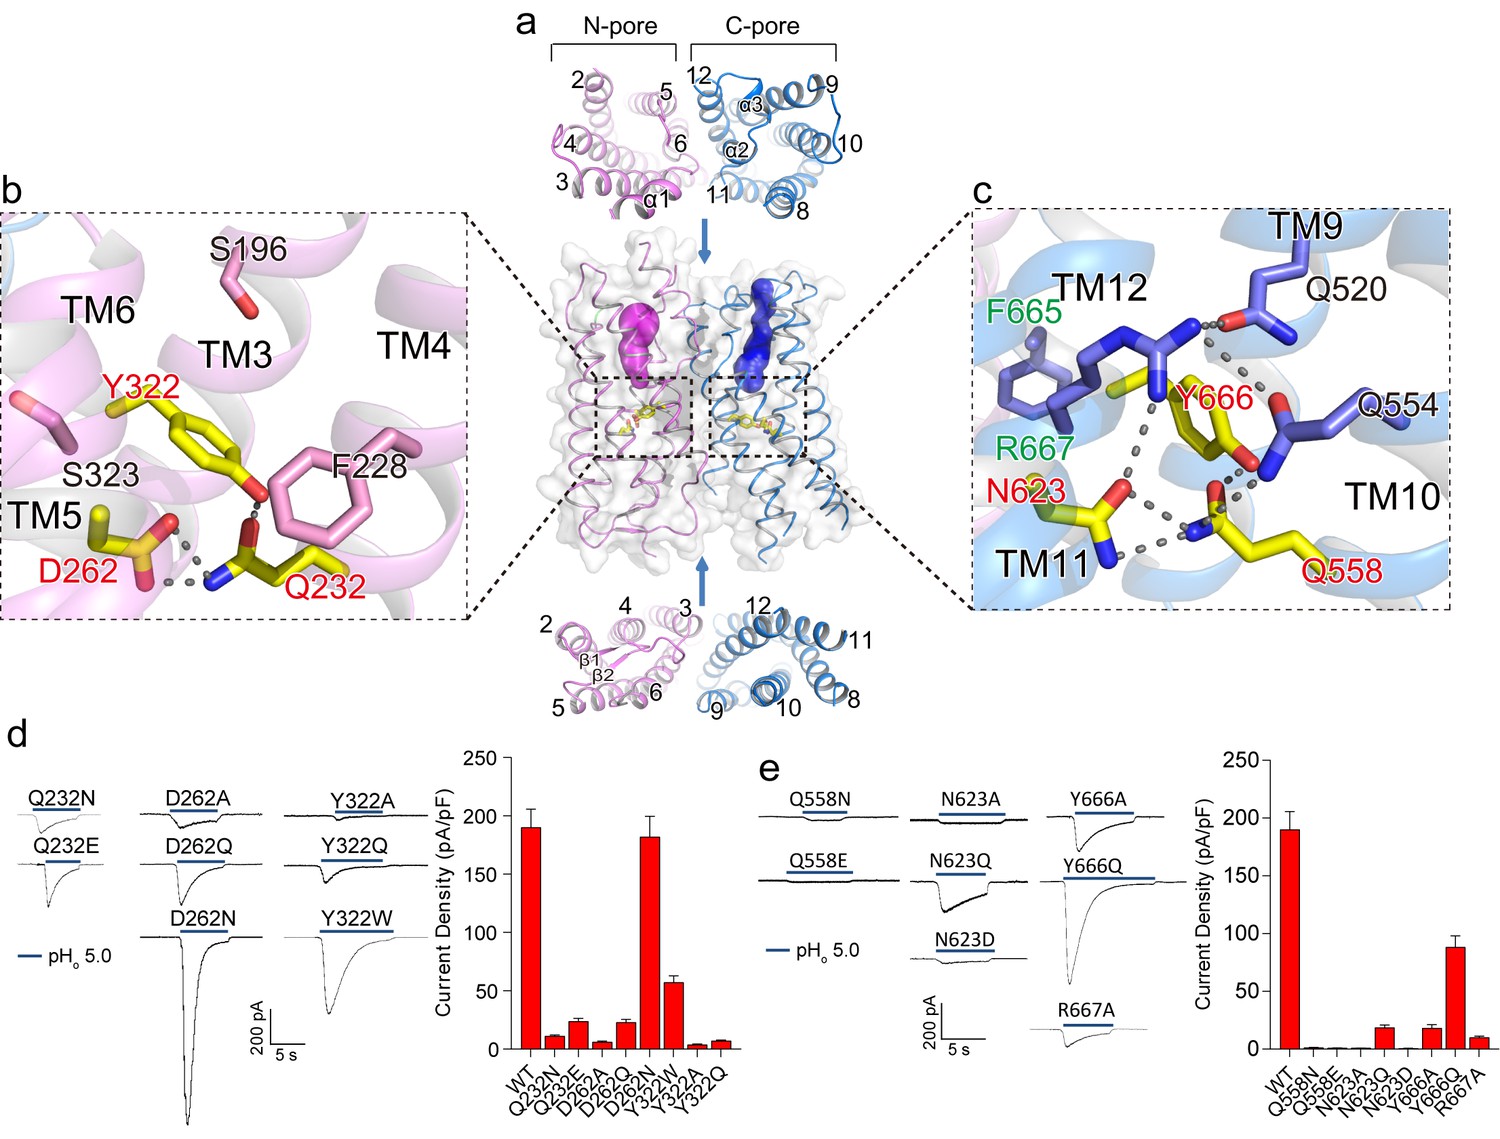
Putative proton conduction pores.
(a) The surface-rendered XtOTOP3 structure shows two solvent accessible openings (magenta and blue) from the extracellular side. Upper and lower insets show membrane-spanning barrels viewed from the extracellular and intracellular side, respectively. (b) Zoomed-in view of the Gln-Asp-Tyr constriction triad (yellow) and surrounding residues (pink) in the N-pore. Hydrogen-bonds are shown as dashed lines. (c) Zoomed-in view of the Gln-Asn-Tyr constriction triad (yellow) and surrounding residues (blue) in the C-pore. Dashed lines mark the hydrogen-bonding network. (d) Sample traces of whole-cell currents of the N-pore triad mutants measured at −100 mV (left) and their current densities (right). The currents were elicited by changing pHo from 7.4 to 5.0 with pHi = 7.4. (e) Sample traces of the C-pore triad mutants (left) and their current densities (right) using the same recording conditions as d. Data in d and e are shown as mean ± s.e.m. (n = 5 independent experiments).
-
Figure 3—source data 1
Source data for Figure 3d and e
- https://doi.org/10.7554/eLife.46710.012
Figure 4 with 2 supplements
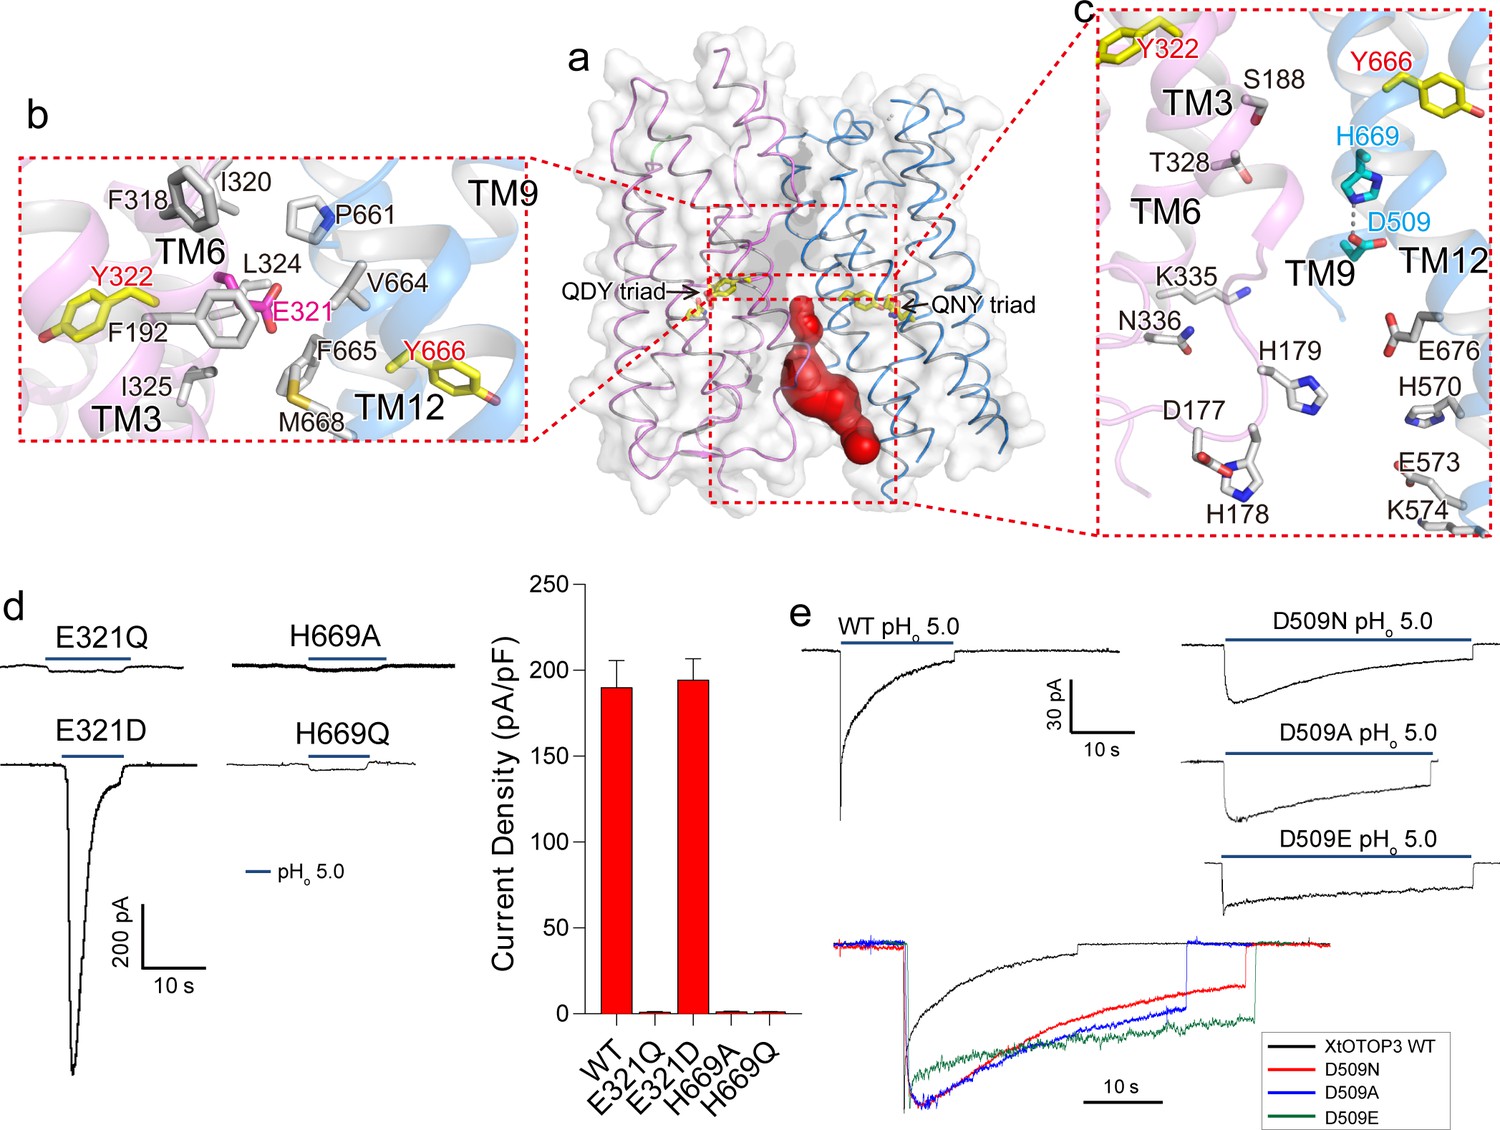
Inter-pore interface.
(a) The surface-rendered XtOTOP3 structure shows a solvent accessible cavity (red) from the intracellular side at the interface between the two pores. The Gln-Asp/Asn-Tyr constriction triads are shown as yellow sticks. (b) Zoomed-in view of the inter-pore protein contacts on the extracellular half of the membrane, highlighting the conserved glutamate (Glu321, magenta sticks) buried within an interface formed mostly by hydrophobic residues (grey sticks). (c) Zoomed-in view of the surrounding residues of the intracellular cavity. The two hydrogen-bonded residues, Glu509 and His669, are shown as cyan sticks. (d) Sample traces of whole cell recordings (left) of mutations at Glu321 and His669, and their current densities (right). (e) The Asp509 neutralization mutants exhibit reduced desensitization rate. Top, Sample traces of patch clamp recordings in the outside-out configuration of the wild type XtOTOP3 and the Asp509 mutants. Bottom, Overlaid sample traces with mutant traces scaled to that of the wild-type. Data in d are shown as mean ± s.e.m. (n = 5 independent experiments). All recordings were measured at −100 mV with pHi = 7.4. The currents were elicited by changing pHo from 7.4 to 5.0.
-
Figure 4—source data 1
Source data for Figure 4d.
- https://doi.org/10.7554/eLife.46710.016
Figure 4—figure supplement 1
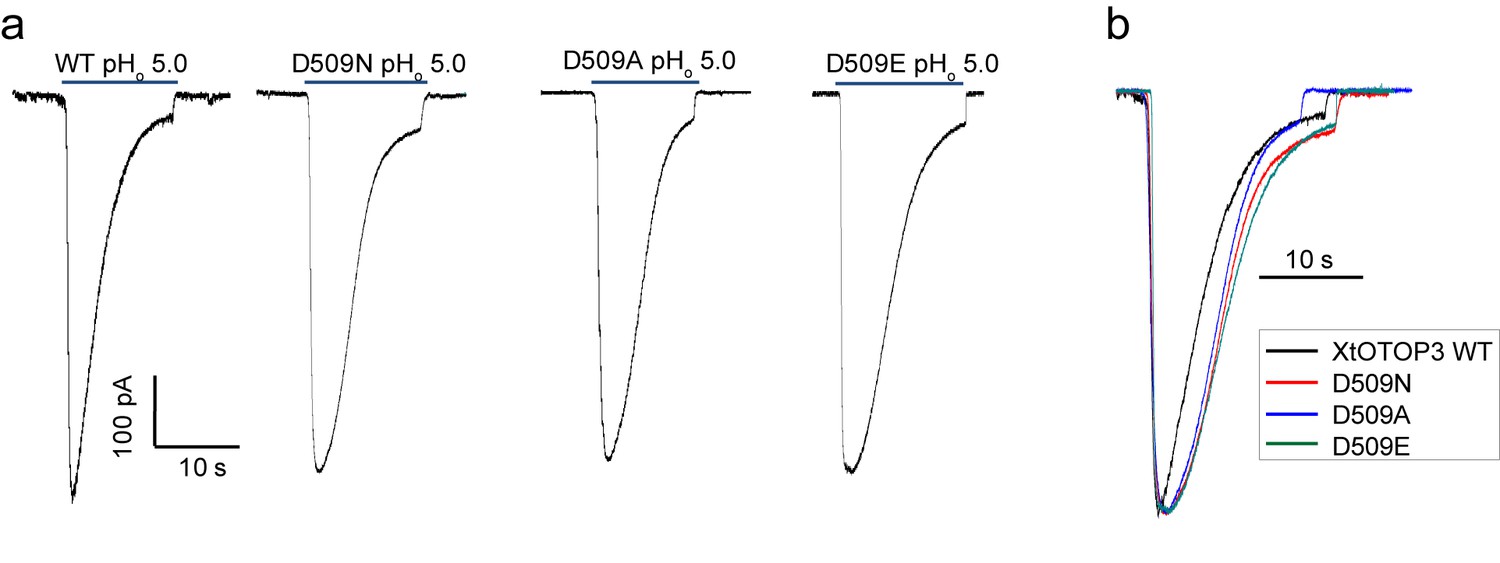
The Asp509 mutations of XtOTOP3 reduce the rate of desensitization.
(a) Sample traces of whole-cell currents of the wild type XtOTOP3, Asp509Asn, Asp509Glu and Asp509Ala mutant channels measured at −100 mV. The currents were elicited by changing pHo from 7.4 to 5.0 with pHi = 7.4. (b) Overlaid sample traces with mutant traces scaled to that of the wild-type.
Figure 4—figure supplement 2
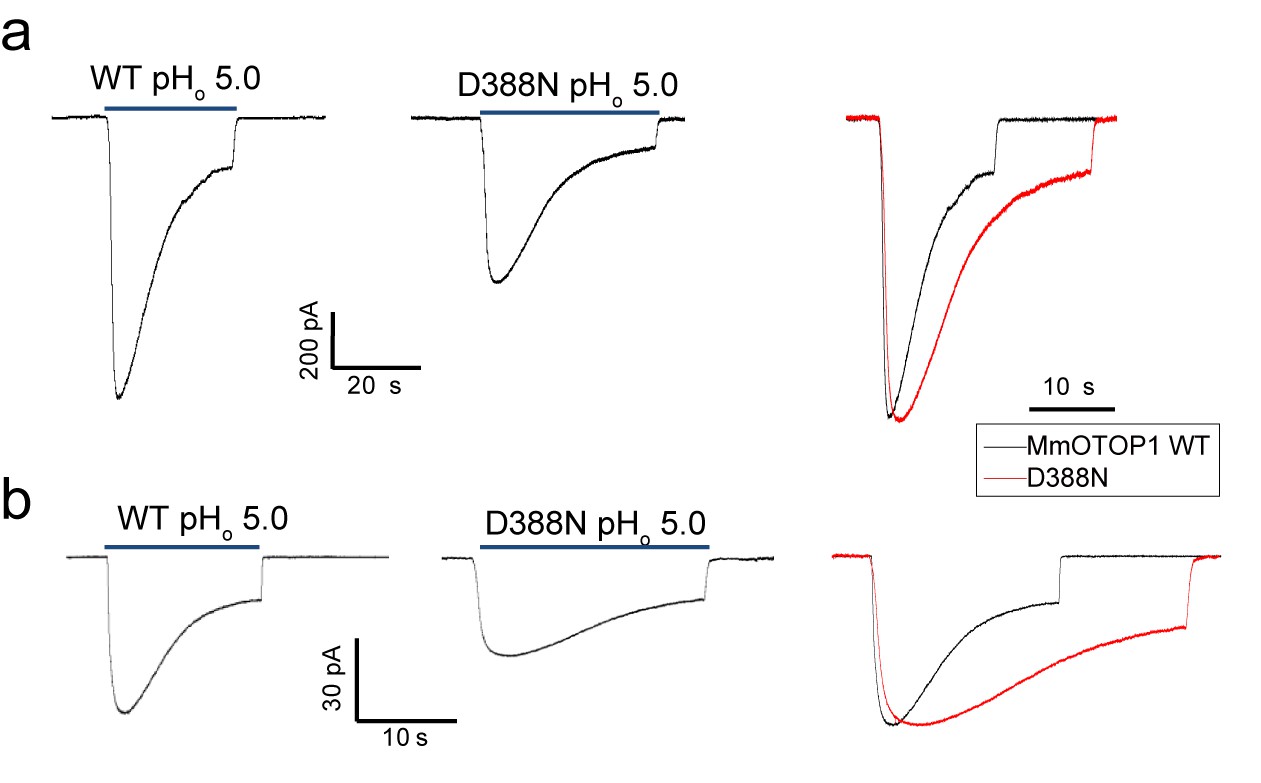
The Asp388 neutralization mutation of MmOTOP1 also reduces the channel’s rate of desensitization.
(a) Sample traces of whole-cell currents of the wild type MmOTOP1 and Asp388Asn mutant (left), and the overlay of traces with the mutant trace scaled to that of the wild-type. (b) Sample traces of patch clamp recordings in the outside-out configuration of the wild type MmOTOP1 and Asp388Asn mutant (left), and the overlay of traces with the mutant trace scaled to that of the wild-type. All recordings were performed at −100 mV with pHi = 7.4. The currents were elicited by changing pHo from 7.4 to 5.0.
Tables
Key resources table
| Reagent type (species) or resource | Designation | Source or reference | Identifiers | Additional information |
|---|---|---|---|---|
| Gene (Xenopus Tropicalis) | OTOP3 | Tranomic technologies | NCBI: NP_001106584.1 | |
| Cell line (Homo sapiens) | Freestyle 293 F | Thermo Fisher Scientific | RRID:CVCL_D603 | |
| Cell line (Spodoptera frugiperda) | Sf9 | Thermo Fisher Scientific | RRID:CVCL_0549 | |
| Recombinant DNA reagent | pEZT-BM | DOI: 10.1016/j.str.2016.03.004 | Addgene: 74099 | |
| Software, algorithm | MotionCor2 | DOI: 10.1038/nmeth.4193 | ||
| Software, algorithm | GCTF | DOI: 10.1016/j.jsb.2015.11.003 | ||
| Software, algorithm | RELION2 | DOI: 10.7554/eLife.18722 | ||
| Software, algorithm | Coot | DOI: 10.1107/S0907444910007493 | RRID:SCR_014222 | |
| Software, algorithm | PyMOL | Schrödinger | RRID:SCR_000305 | |
| Software, algorithm | Chimera | UCSF | RRID:SCR_004097 |
Additional files
-
Transparent reporting form
- https://doi.org/10.7554/eLife.46710.017
Download links
A two-part list of links to download the article, or parts of the article, in various formats.
Downloads (link to download the article as PDF)
Open citations (links to open the citations from this article in various online reference manager services)
Cite this article (links to download the citations from this article in formats compatible with various reference manager tools)
Structural and functional characterization of an otopetrin family proton channel
eLife 8:e46710.
https://doi.org/10.7554/eLife.46710


