Misfolded GPI-anchored proteins are escorted through the secretory pathway by ER-derived factors
- MRC Laboratory of Molecular Biology, United Kingdom
Figures
Figure 1 with 1 supplement
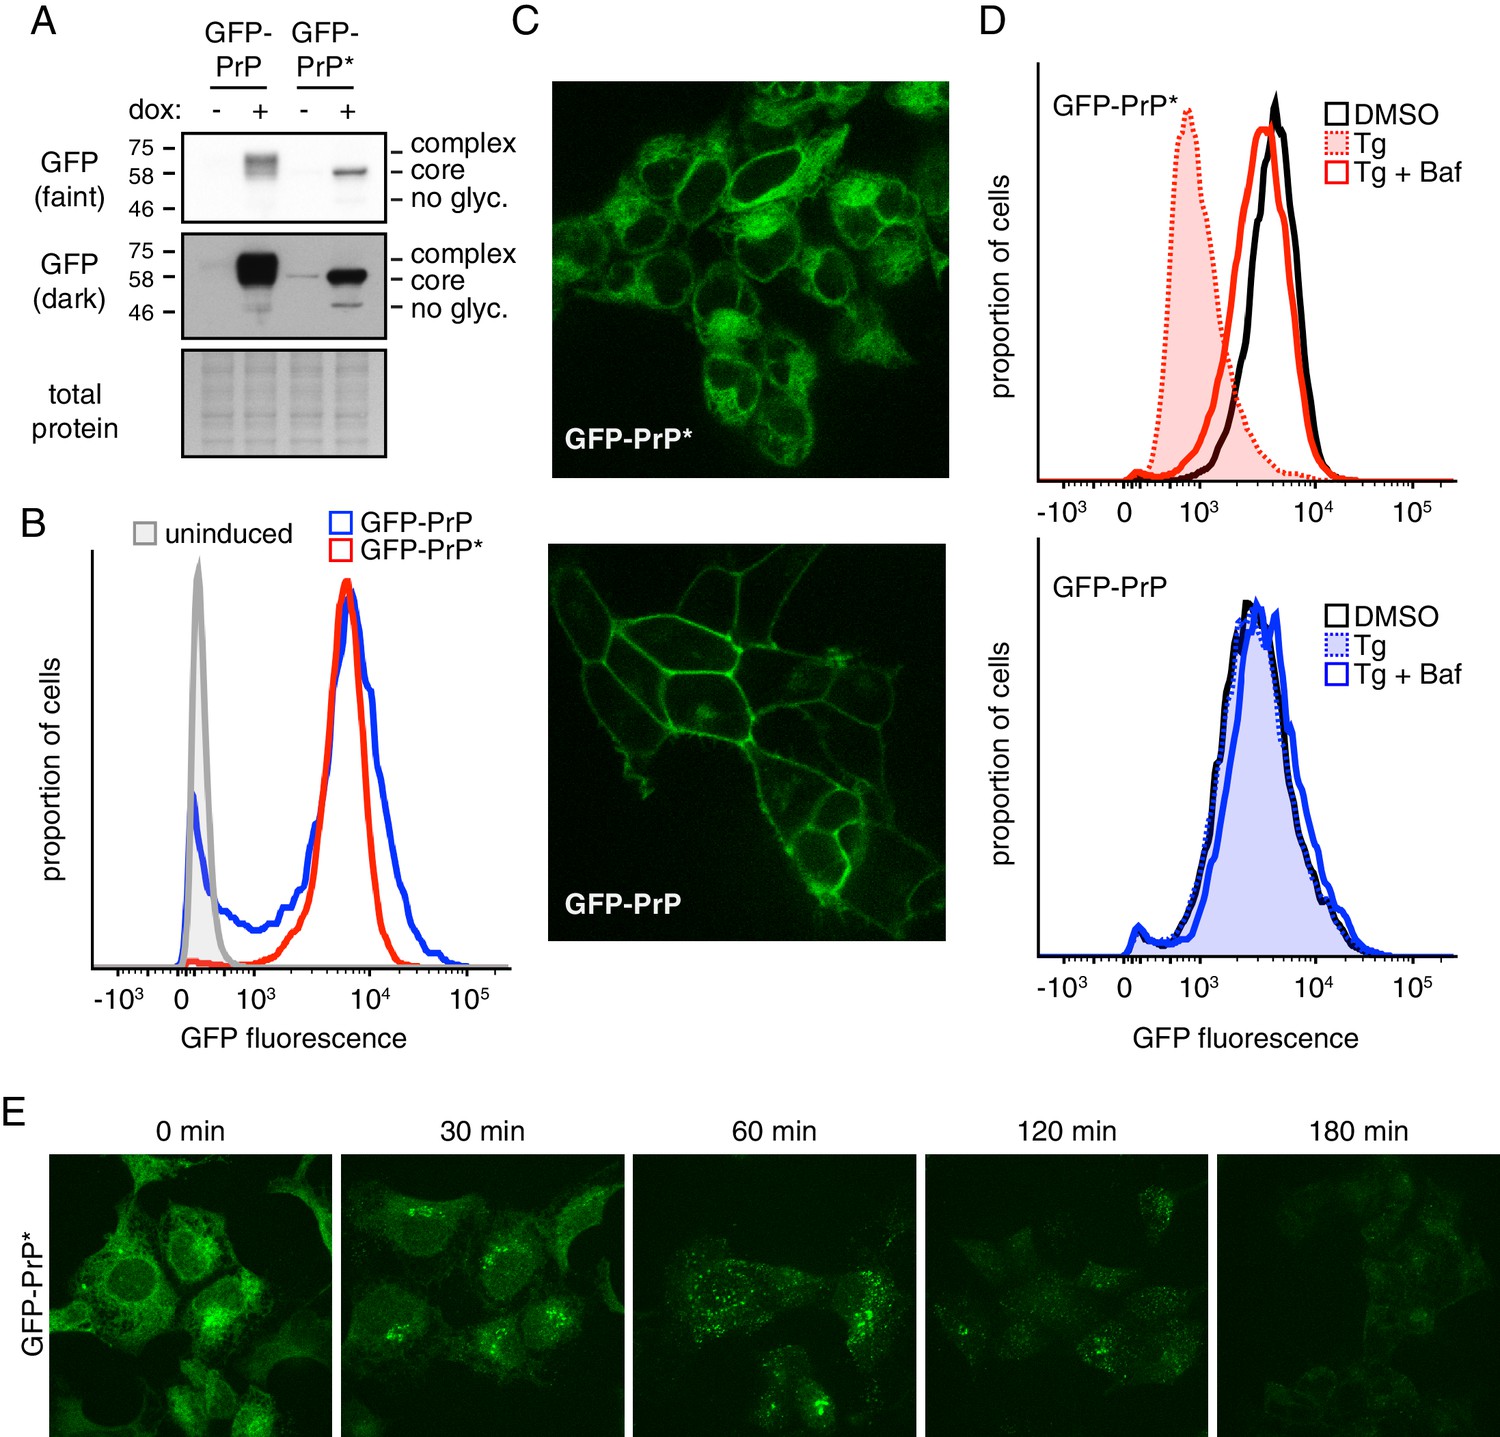
A stable-inducible cell line to study GPI-anchored protein quality control.
(A) HEK293-TRex cells containing either GFP-PrP or GFP-PrP* stably integrated at the same locus were induced to express the proteins with doxycycline for 48 hr prior to analysis by immunoblotting using anti-GFP antibody. Cultures without doxycycline induction were analyzed in parallel. Two exposures of the immunoblot are shown, along with a portion of the stained blot verifying equal loading. Unglycosylated (‘no glyc.”), core-glycosylated (‘core’), and complex-glycosylated (‘complex’) species of GFP-PrP are indicated. (B) Cells expressing GFP-PrP or GFP-PrP* were induced with doxycycline for 96 hr prior to analysis of GFP fluorescence by flow cytometry. The normalized histograms are shown. (C) Cells expressing GFP-PrP or GFP-PrP* were induced for 48 hr with doxycycline, washed to remove doxycycline, then analyzed 24 hr later by fluorescent microscopy. Doxycycline withdrawal for 24 hr limited the amount of reporter mRNA in cells to relatively moderate levels, and was employed in most of the experiments in this study. This minimized over-expression artifacts and improved reproducibility. (D) Cells expressing GFP-PrP or GFP-PrP* were treated with vehicle (DMSO) or the ER stressor thapsigargin (Tg, at 100 nM) for 3 hr in the presence of 100 µg/ml cycloheximide to suppress new protein synthesis. 250 nM bafilomycin A1 (BafA1) was included in one set of samples. Total GFP fluorescence was measured by flow cytometry. (E) Cells expressing GFP-PrP* were treated with 100 nM thapsigargin (Tg) and 100 µg/ml cycloheximide and imaged at the indicated times.
Figure 1—figure supplement 1
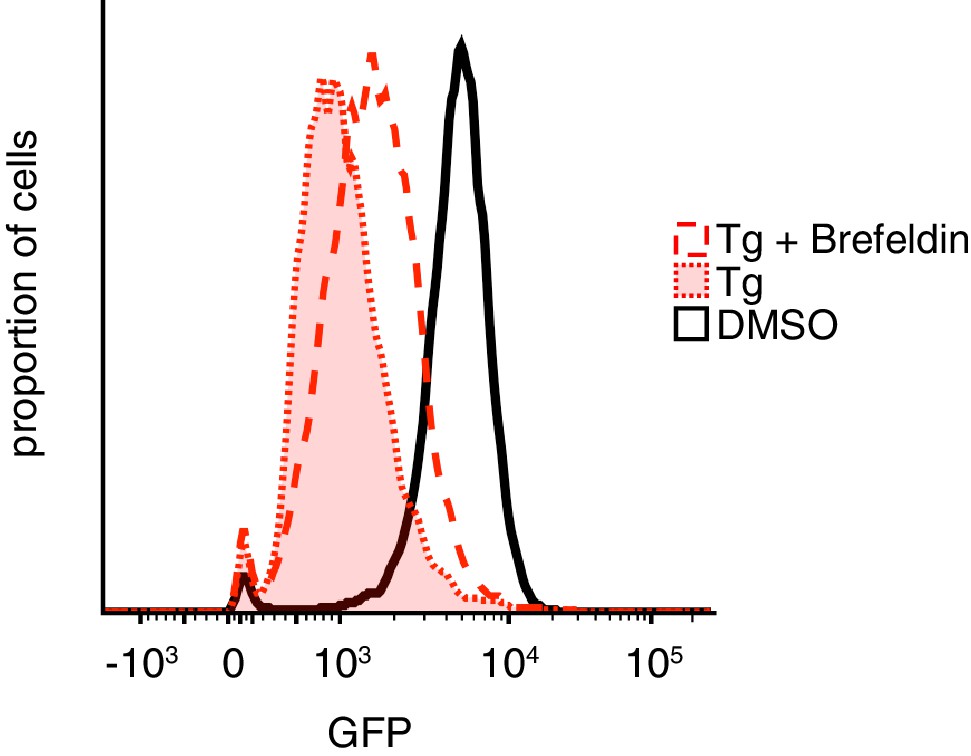
Effect of Brefeldin A on GFP-PrP* degradation.
Cells expressing GFP-PrP* were treated for 3 hr with vehicle (DMSO) or 100 nM thapsigargin (Tg) without or with 2.5 µg/ml Brefeldin A. 100 µg/ml cycloheximide was included in all samples during the 3 hr treatment to suppress new protein synthesis. Total GFP fluorescence was measured by flow cytometry.
Figure 2 with 1 supplement

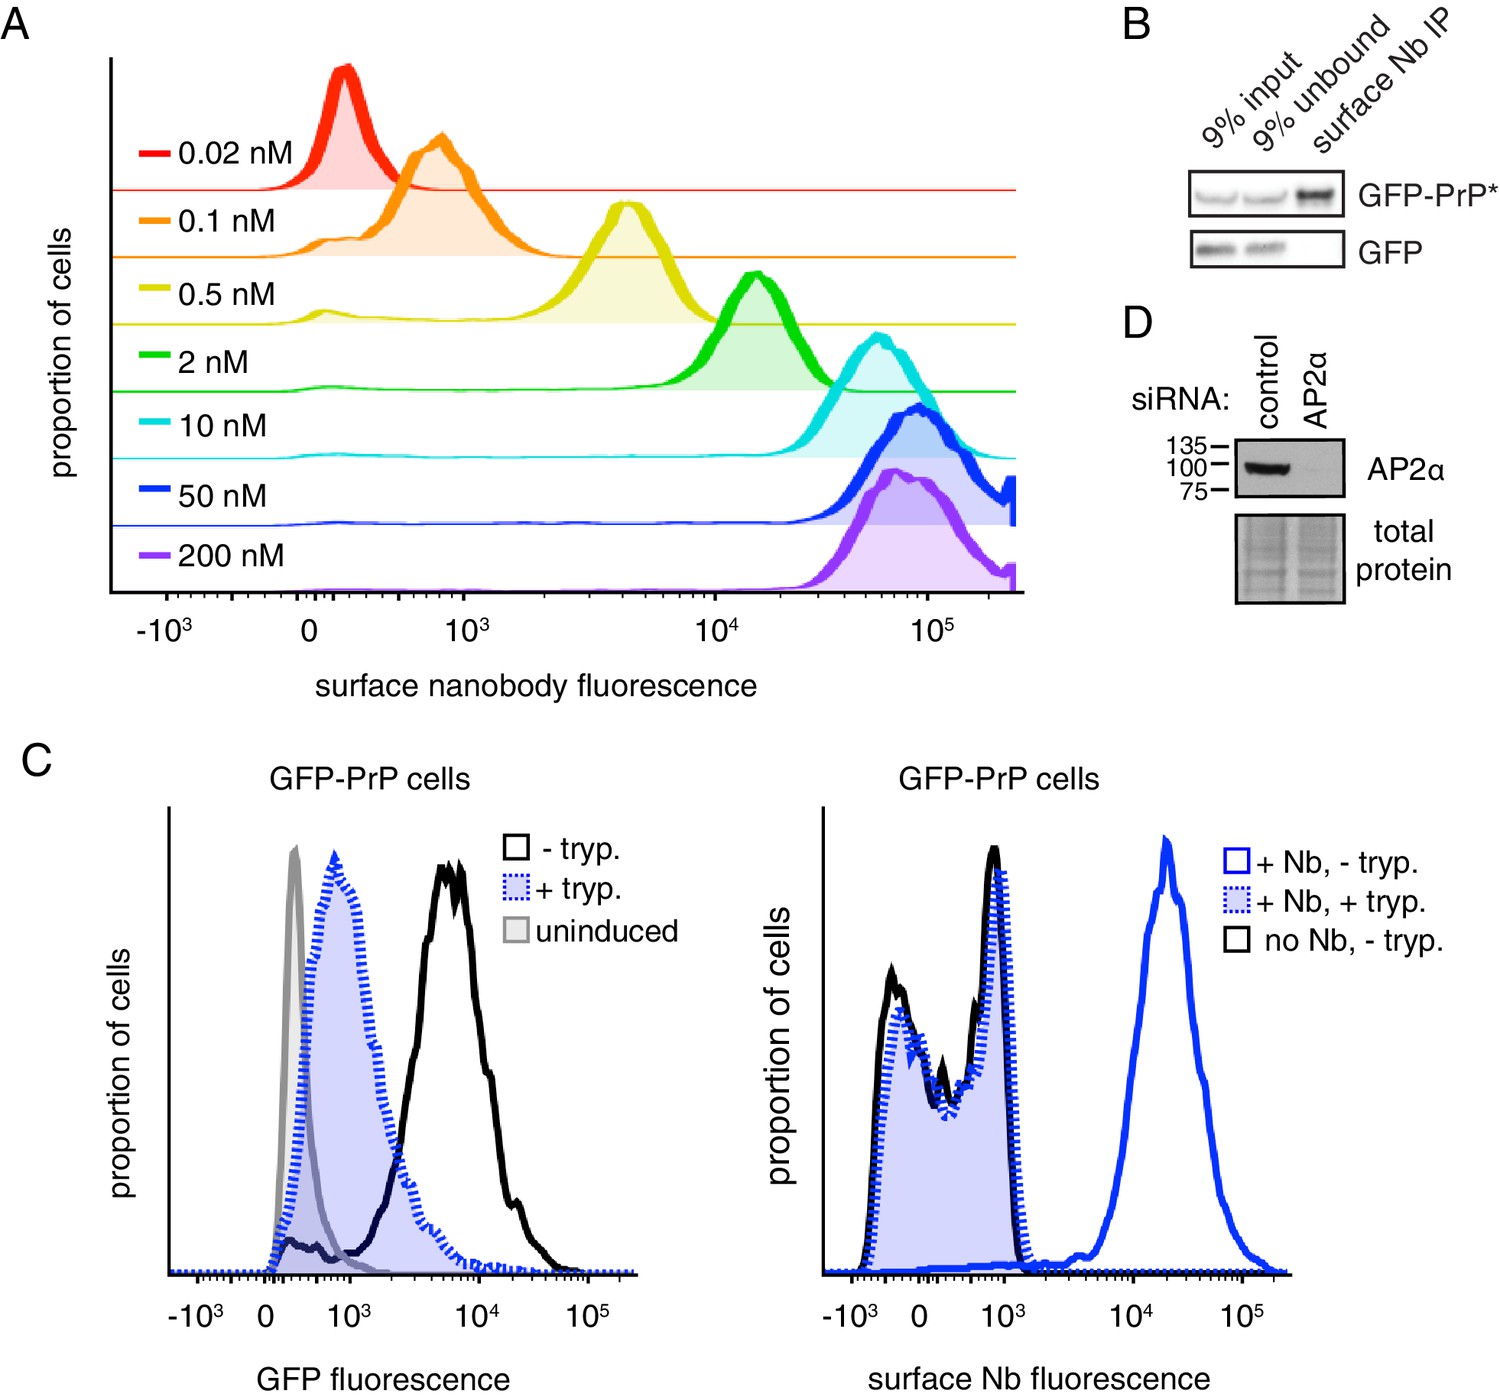
Misfolded PrP is detectable at the cell surface prior to lysosomal degradation.
(A) Cells expressing GFP-PrP and GFP-PrP* were incubated on ice with 200 nM extracellular Alexa647-conjugated Nb and Alexa647 fluorescence was measured by flow cytometry. Uninduced cells were analyzed in parallel and are shown in gray. (B) Diagram of experimental strategy to compare relative surface levels of GFP-PrP* and GFP-PrP. (C) Cells expressing GFP-PrP and GFP-PrP* were labeled with saturating amounts of anti-GFP Nb on ice, washed, and lysed under denaturing (SDS) or non-denaturing (CHAPS) conditions. Bound Nb was analyzed by immunoblotting relative to serial dilutions of purified recombinant Nb. (D) The indicated relative amounts of surface-derived complexes purified under non-denaturing conditions were analyzed by immunoblotting for GFP and FLAG. (E) GFP-PrP*-expressing cells treated for 96 hr with control or AP2-targeting siRNAs were surface-labeled with Alexa647-Nb and analyzed by flow cytometry. HEK293T cells without GFP-PrP* were analyzed for comparison (gray). (F) GFP-PrP*-expressing cells were transiently transfected with FusionRed-Dynamin S45N (Almeida-Souza et al., 2018) or empty vector for 24 hr prior to surface staining with Alexa647-Nb and analysis by flow cytometry. (G) GFP-PrP*-expressing cells were treated with 2.5 µg/ml Brefeldin A (BFA) for two hours prior to surface staining with Alexa647-Nb and analysis by flow cytometry.
Figure 2—figure supplement 1
Characterization of Nb surface staining and isolation.
(A) Cells expressing GFP-PrP were incubated on ice with varying concentrations of Alexa647-Nb, washed, and analyzed for Alexa647 fluorescence by flow cytometry. (B) GFP-PrP* on the cell surface was labeled on ice with Nb-FLAG, washed, and lysed under non-denaturing conditions. The lysate was then mixed with lysate from cells transfected with cytosolic GFP. The nanobody was subsequently immunoprecipitated (IP) via its FLAG epitope tag. The input, unbound and IP samples were analyzed by SDS-PAGE and immunoblotting using anti-GFP antibodies. No cytosolic GFP was recovered in the IP, illustrating that the Nb bound to surface GFP-PrP* does not exchange antigens after solubilization and during the IP. (C) GFP-PrP-expressing cells were incubated without or with extracellular trypsin to digest surface-localized proteins. The left panel shows the level of total GFP fluorescence analyzed by flow cytometry relative to uninduced cells. In the right panel, the trypsin-digested or undigested samples were surface labeled with fluorescent Nb and analyzed by flow cytometry. Note that surface GFP-PrP was quantitatively digested by trypsin as indicated by the fact that these cells show no detectable Nb fluorescence relative to cells that were not labeled with Nb. Thus, we can deduce that the remaining GFP fluorescence in the trypsin-digested cells seen in the left panel is due to the intracellular population of GFP-PrP. (D) Verification of AP2 knockdown after siRNA treatment, as part of the experiment in Figure 2E.
Figure 3 with 1 supplement

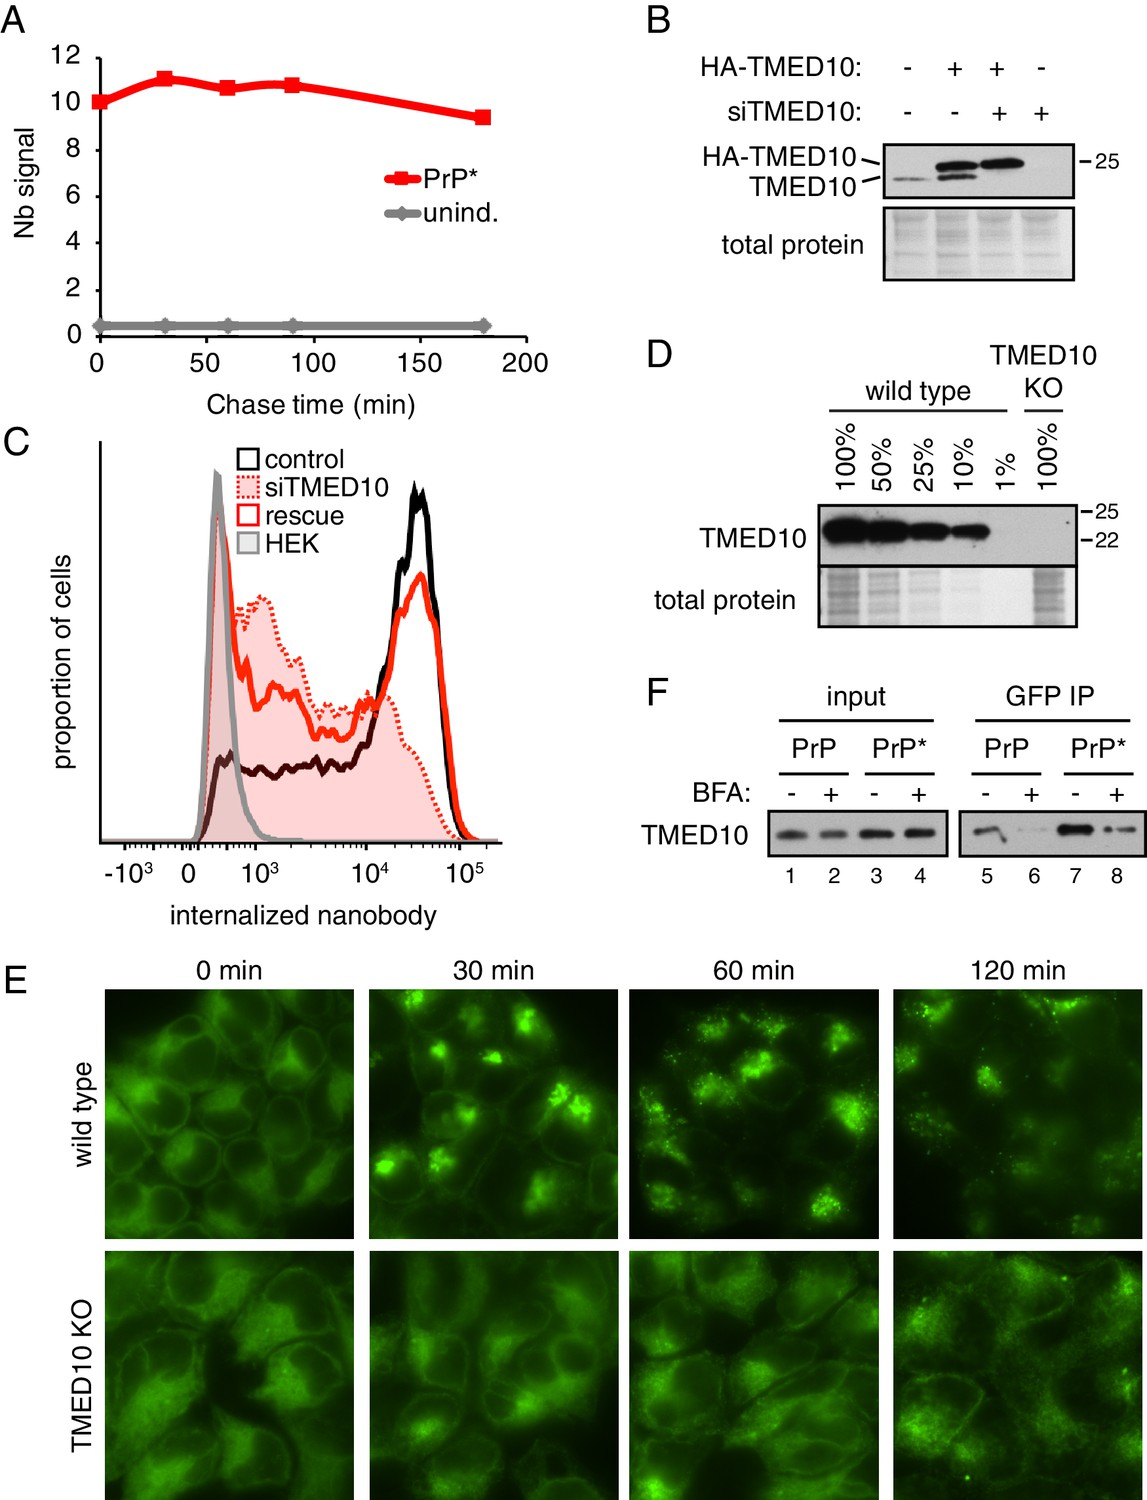
The majority of misfolded PrP transits the cell surface en route to lysosomes.
(A) Experimental strategy to measure GFP-PrP* transit through the cell surface (top) relative to a known standard generated by saturating surface labeling of GFP-PrP cells. (B) Cells expressing GFP-PrP* were incubated for 3 hr at 37°C with 100 nM Tg and 10 nM extracellular Alexa546-Nb prior to washing and analysis by flow cytometry. This sample was compared to GFP-PrP cells surface-labeled with Alexa546-Nb. (C) GFP-PrP*-expressing cells and uninduced controls were incubated for various times in the presence of 10 nM Alexa546-Nb in the culture medium. Half the cells contained 100 nM thapsigargin (Tg) while the other half were untreated. The cells at each time point were analyzed by flow cytometry. The graph depicts the median fluorescence intensity of internalized nanobody relative to time 0. (D) Wild type (WT) and TMED10 knockout (KO) cells expressing GFP-PrP* were allowed to internalize Alexa647-Nb from the extracellular medium for 2 hr during treatment with 100 nM thapsigargin. Fluorescent Nb levels were measured by flow cytometry. KO cells transiently transfected with HA-tagged TMED10 (rescue) were analyzed in parallel. (E) The amount of extracellular Nb uptake was measured over the course of 2 hr in unstressed cells expressing GFP-PrP*. Wild type (WT) cells were compared to TMED10 knockout cells (KO). Cells lacking GFP-PrP* (HEK) were analyzed as a negative control. (F) GFP-PrP-expressing cells were treated with 1 µM Brefeldin A (BFA) for 2.5 hr to retain GFP-PrP in the ER. The media was then changed to remove BFA while adding Alexa647-Nb, and incubated for 2 hr before analysis by flow cytometry.
Figure 3—figure supplement 1
Additional characterization of GFP-PrP* trafficking.
(A) Cells expressing GFP-PrP* (or uninduced controls) were allowed to internalize Alexa546-Nb for 3 hr, after which the cells were washed, put into Nb-free medium, and further cultured for the indicated times. Nb fluorescence was measured by flow cytometry at each time point and the median fluorescence intensity is plotted. Note that no appreciable Nb uptake is seen in uninduced cells expressing minimal amounts of GFP-PrP*, and that the fluorescence of internalized Nb does not change appreciably over the course of 3 hr. (B) GFP-PrP*-expressing cells were treated without or with siRNAs targeting TMED10 (siTMED10), and transfected with a control vector or one expressing siRNA-resistant HA-TMED10. After allowing 96 hr to fully deplete endogenous TMED10, the cells were harvested and analyzed by immunoblotting for TMED10, which reveals both endogenous and exogenous TMED10. (C) GFP-PrP*-expressing cells were treated without (control) or with siRNAs targeting TMED10 (siTMED10) for 96 hr as in panel B. A subset of knockdown cells was also transfected with siRNA-resistant HA-TMED10 (rescue). Each of these cells, along with untreated HEK293T cells (HEK) were treated for 2 hr with 100 nM thapsigargin in the presence of extracellular Alexa546-Nb. Fluorescent nanobody uptake was measured by flow cytometry. (D) The levels of TMED10 in unedited (wild type) and CRISPR-edited TMED10-knockout (TMED10 KO) cells was assessed by immunoblotting (using an antibody against the lumenal domain). The KO lysate was compared to serial dilutions of control lysate to verify that no TMED10 was detectable in the KO cells even with over-exposure of the blot. (E) WT and ∆TMED10 cells (see panel D) expressing GFP-PrP* were imaged by fluorescence microscopy at the indicated times after treatment with 100 nM thapsigargin to induce acute ER stress. Unlike in wild type cells, GFP-PrP* in ∆TMED10 cells remains in the ER over this time frame. (F) Cells expressing GFP-PrP and GFP-PrP* were lysed under non-denaturing conditions and immunoprecipitated using sepharose-conjugated anti-GFP Nb. Input lysates and elutions were immunoblotted for TMED10.
Figure 4 with 1 supplement
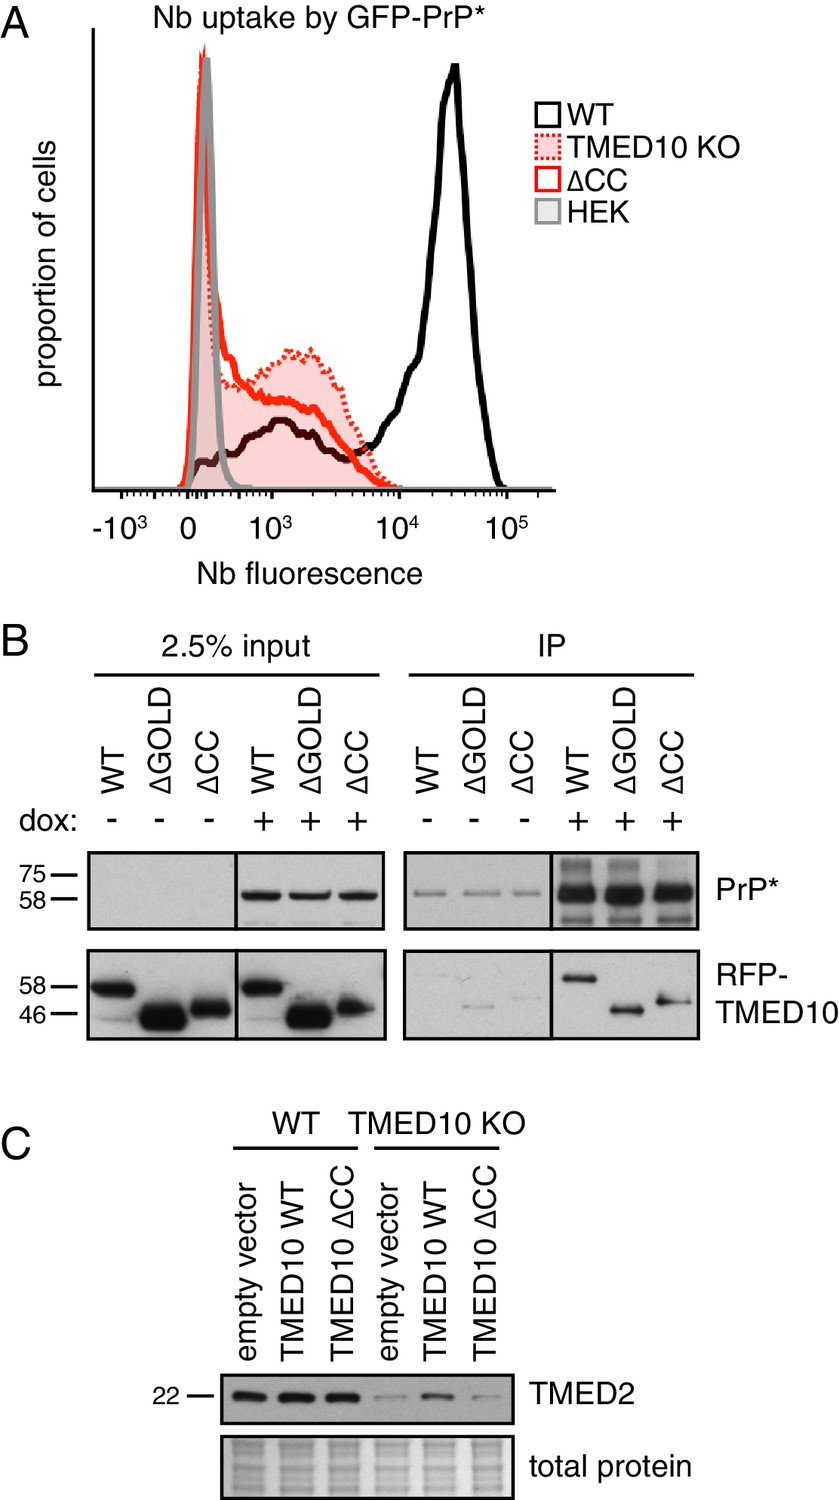
A complex of several TMED proteins facilitates GFP-PrP* degradation.
(A) Wild type (WT) or TMED10 knockout (KO) cells expressing GFP-PrP* were assayed for thapsigargin-stimulated extracellular Nb uptake as in Figure 3D. In addition, the KO cells were transiently transfected with HA-tagged TMED10 lacking its coiled-coil domain (∆CC) and the transfected cells were analyzed in parallel. (B) RFP-tagged wild type (WT) TMED10, or constructs lacking the GOLD domain (residues 41–129; ∆GOLD) or coiled-coil domain (residues 130–183; ∆CC) were transiently transfected into ∆TMED10 cells inducibly expressing GFP-PrP*. GFP-PrP* was either left uninduced or induced for 48 hr prior to analysis. GFP-PrP* was immunoprecipitated using sepharose-conjugated anti-GFP Nb and analyzed by immunoblotting for GFP and RFP relative to input lysates. All input samples are from the same blot and exposure, with the vertical line indicating where intervening lanes were removed. All of the IP samples are also from the same blot and exposure. (C) Wild type or TMED10 knockout cells were transiently transfected with RFP-tagged WT or ∆CC TMED10. Two days post-transfection, cells containing moderate levels of RFP were isolated by flow cytometry, lysed, and immunoblotted against TMED2.
Figure 4—figure supplement 1
Additional characterization of TMED family members.
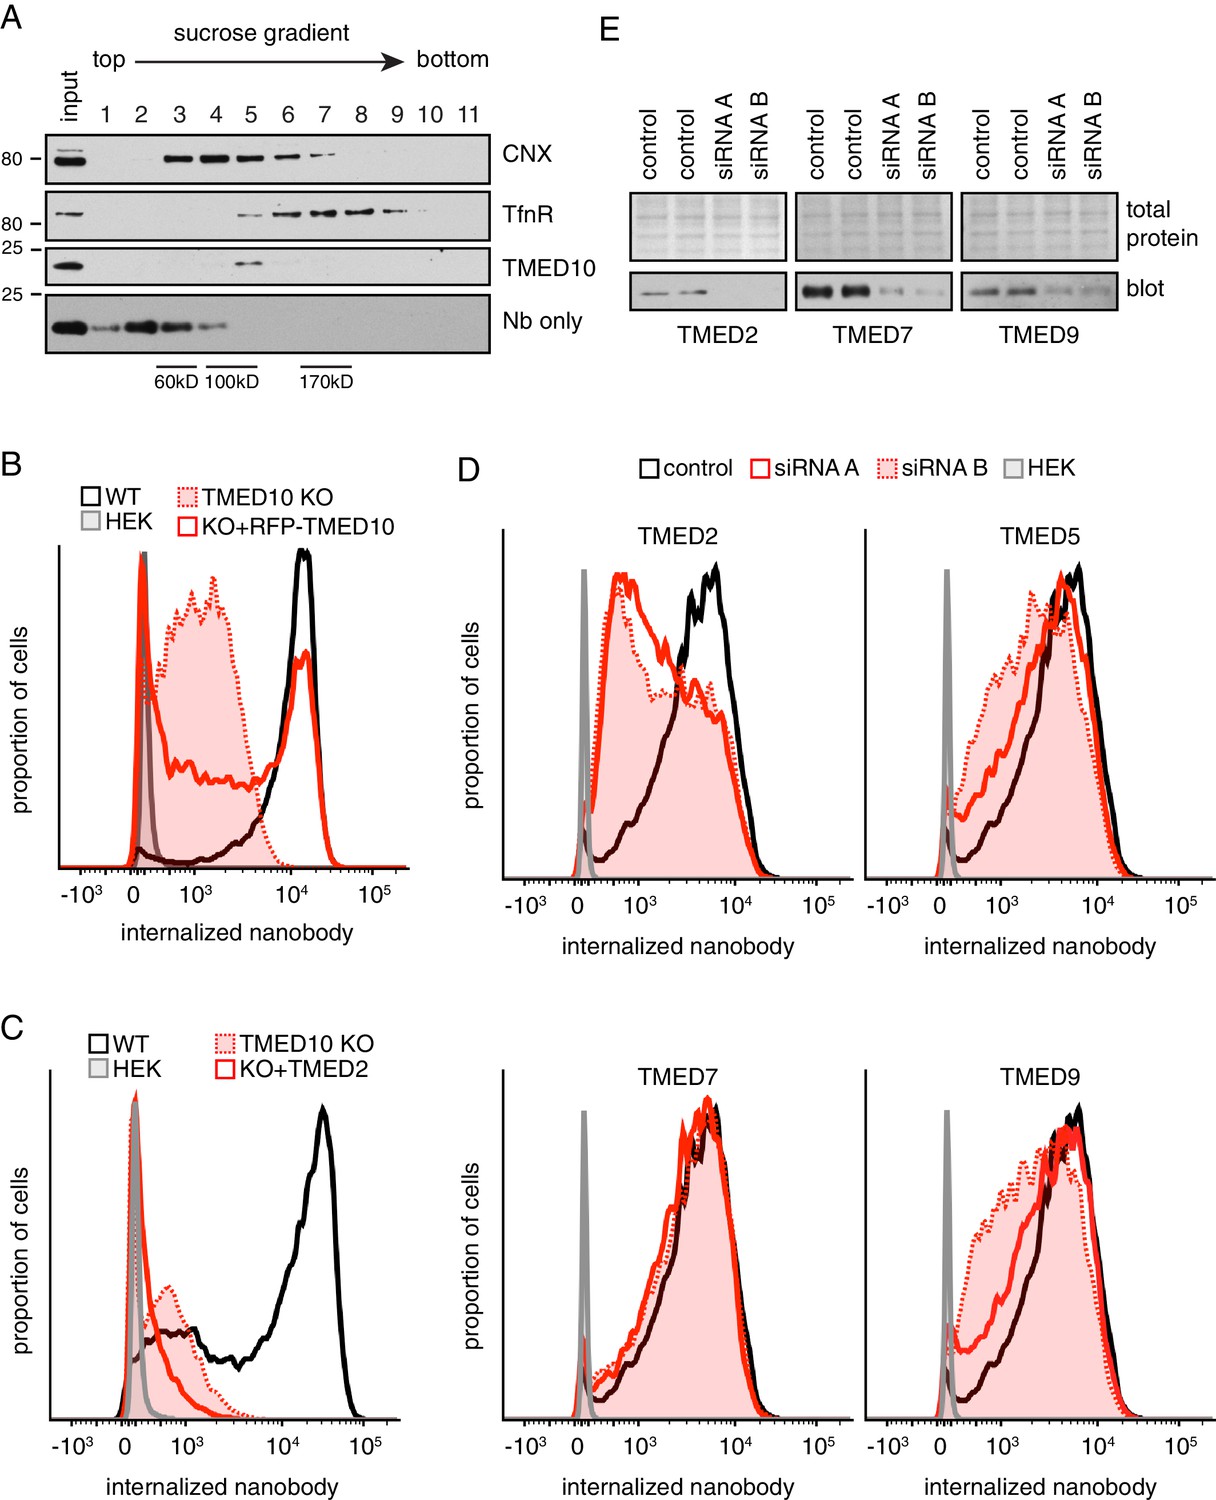
(A) Cell lysates prepared under non-denaturing conditions were separated by size on a 5–25% sucrose gradient, and analyzed by immunoblotting. Purified recombinant nanobody (18 kDa) peaks in fraction 2, as expected for a small monomeric protein. Despite a similar molecular weight, native TMED10 peaks in fraction five indicating its constitutive engagement in a higher molecular weight complex. For comparison, CNX (~90 kDa monomer) peaks in fraction 4, while the transferrin receptor (TfnR, dimer of two 85 kDa polypeptides) peaks in fractions 6–8. This suggests that native TMED10 is part of a ~ 100–125 kD complex. (B) Wild type (WT) cells, TMED10 knockout (KO) cells, KO cells transiently transfected with RFP-tagged TMED10, and HEK293 cells were assayed for their ability to internalize fluorescent nanobody for 1 hr in the presence of thapsigargin-induced ER stress. Nanobody fluorescence was measured by flow cytometry. RFP-tagged TMED10 is able to partially rescue nanobody internalization in ∆TMED10 cells. (C) GFP-PrP*-expressing cells lacking endogenous TMED10 (KO) were transiently transfected with myc-tagged TMED2 and assayed for their ability to internalize fluorescent nanobody for 2 hr in the presence of thapsigargin-induced ER stress. TMED2 cannot rescue the Nb-uptake deficiency of ∆TMED10 cells, and seems to even have a slight dominant-negative effect (i.e., further reduced Nb uptake). (D) Cells expressing GFP-PrP* were depleted of the indicated TMED family members using two independent siRNA oligonucleotides for 72 hr, and subsequently assayed for their ability to internalize fluorescent nanobody from the medium over a 100 min time period under non-stressed conditions. Although not shown here, no effect was seen for siRNA-treated TMED1, TMED3, TMED4, and TMED6. (E) Knockdown efficiencies for panel D were checked by immunoblotting for TMED2, TMED7, and TMED9. We were unable to obtain a suitable antibody for TMED5.
Figure 5 with 1 supplement
Proteomic analysis of PrP* interactions during its trafficking to lysosomes.
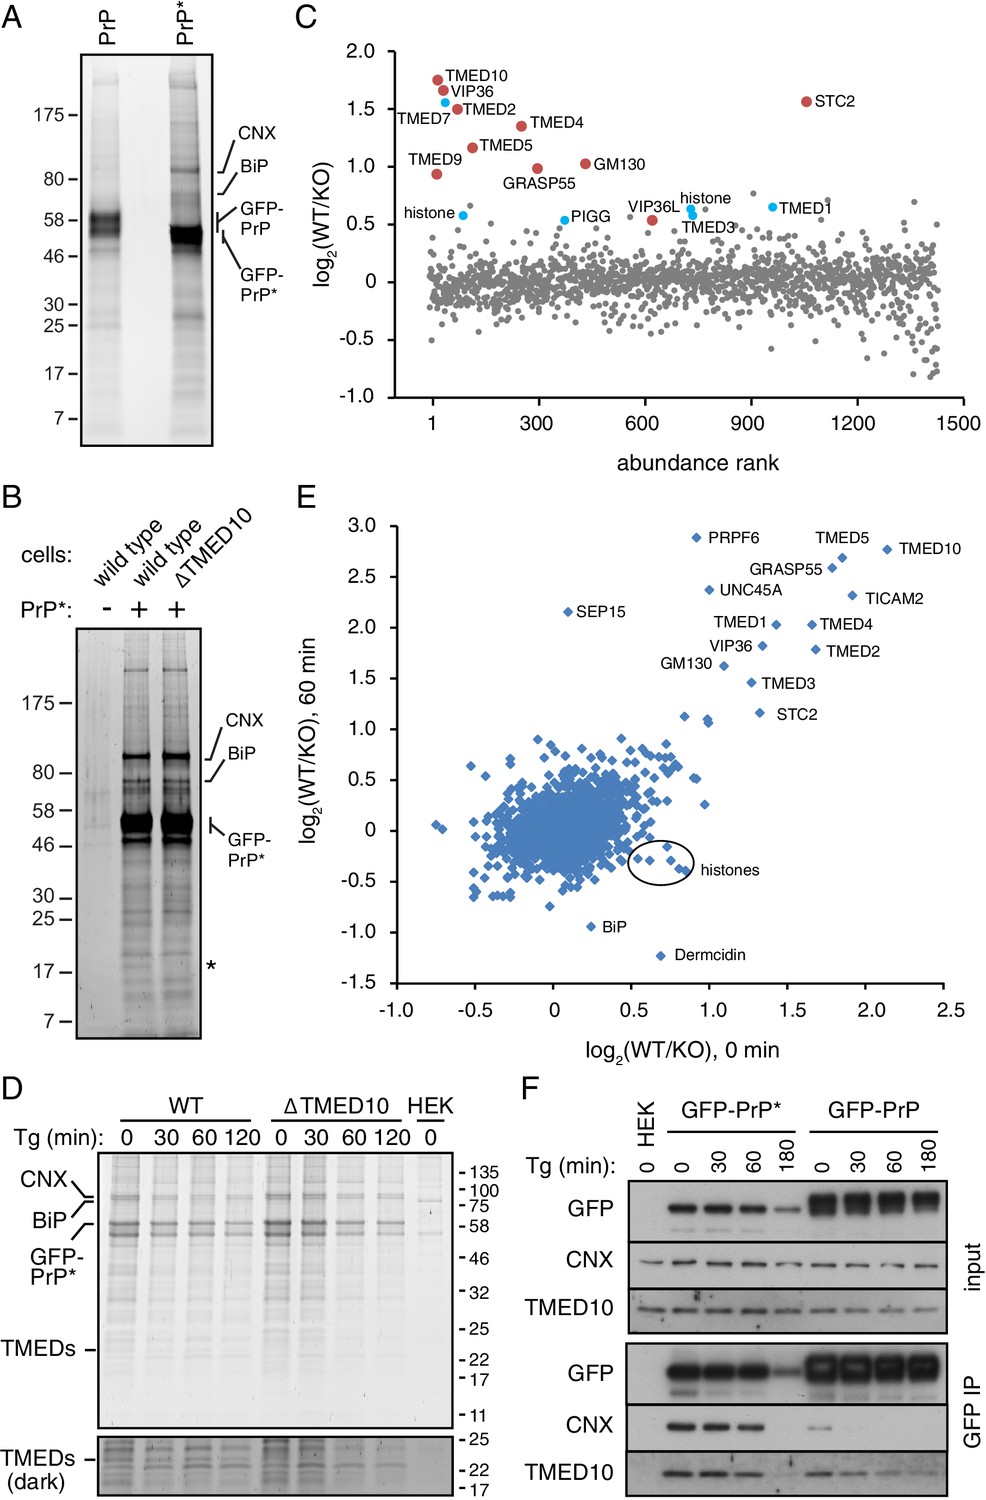
(A) Cells expressing GFP-PrP and GFP-PrP* were lysed under non-denaturing conditions, affinity purified via immobilized anti-GFP Nb, separated by SDS-PAGE, and stained with SYPRO-Ruby. The positions of key proteins (verified by mass spectrometry) are shown. (B) GFP-PrP* from wild type and ∆TMED10 cells was affinity purified under non-denaturing conditions, separated by SDS-PAGE, and stained with SYPRO-Ruby. The asterisk indicates the only band obviously absent in the ∆TMED10 sample, presumably corresponding to TMED10 itself. (C) GFP-PrP* was immunoprecipitated from wild type (WT) and ∆TMED10 (KO) cells as in panel B and analyzed by quantitative mass spectrometry. The x-axis orders proteins by relative abundance in the immunoprecipitation (one being the most abundant), and the y-axis plots the Log2 value of the WT/KO ratio of abundances. Proteins whose Log2 ratios are >0.5 in all three independent experiments are highlighted in red, and those >0.5 in 2 of 3 independent experiments are highlighted in blue. (D) GFP-PrP* was immunoprecipitated as in panel B from wild type (WT) and ∆TMED10 (KO) cells at different times after thapsigargin-induced acute ER stress. HEK293T cells lacking GFP-PrP* were used as a specificity control (HEK). The positions of several abundant proteins identified by mass spectrometry are indicated. The portion of the gel showing the TMED family members is also shown at higher contrast. All eight IP samples (not including the HEK control) were subjected to quantitative tandem mass tagging (TMT) mass spectrometry (Figure 5—source data 1). (E) The quantitative mass spectrometry results from the ‘0’ time point and the ‘60 min’ time point from the experiment in panel D are plotted as Log2 values of the WT/KO ratio. Various proteins discussed in the text are indicated. (F) GFP-PrP and GFP-PrP* were immunoprecipitated under non-denaturing conditions following thapsigargin-induced ER stress for the indicated time periods. Input and immunoprecipitated samples were separated by SDS-PAGE and analyzed by immunoblotting against CNX, TMED10, and GFP.
-
Figure 5—source data 1
Complete tandem mass tagging mass spectrometry data.
The eight samples corresponding to the four time points each for WT and ∆TMED10 cells from Figure 5D were analyzed by tandem mass tagging (TMT) quantitative proteomics and the data tabulated in the Excel table. Each tab of the Excel table illustrates the sequential steps in the normalization and analysis of the raw data, ending in the graph depicted in Figure 5E.
- https://doi.org/10.7554/eLife.46740.012
Figure 5—figure supplement 1
Additional analysis of GFP-PrP* interaction partners.
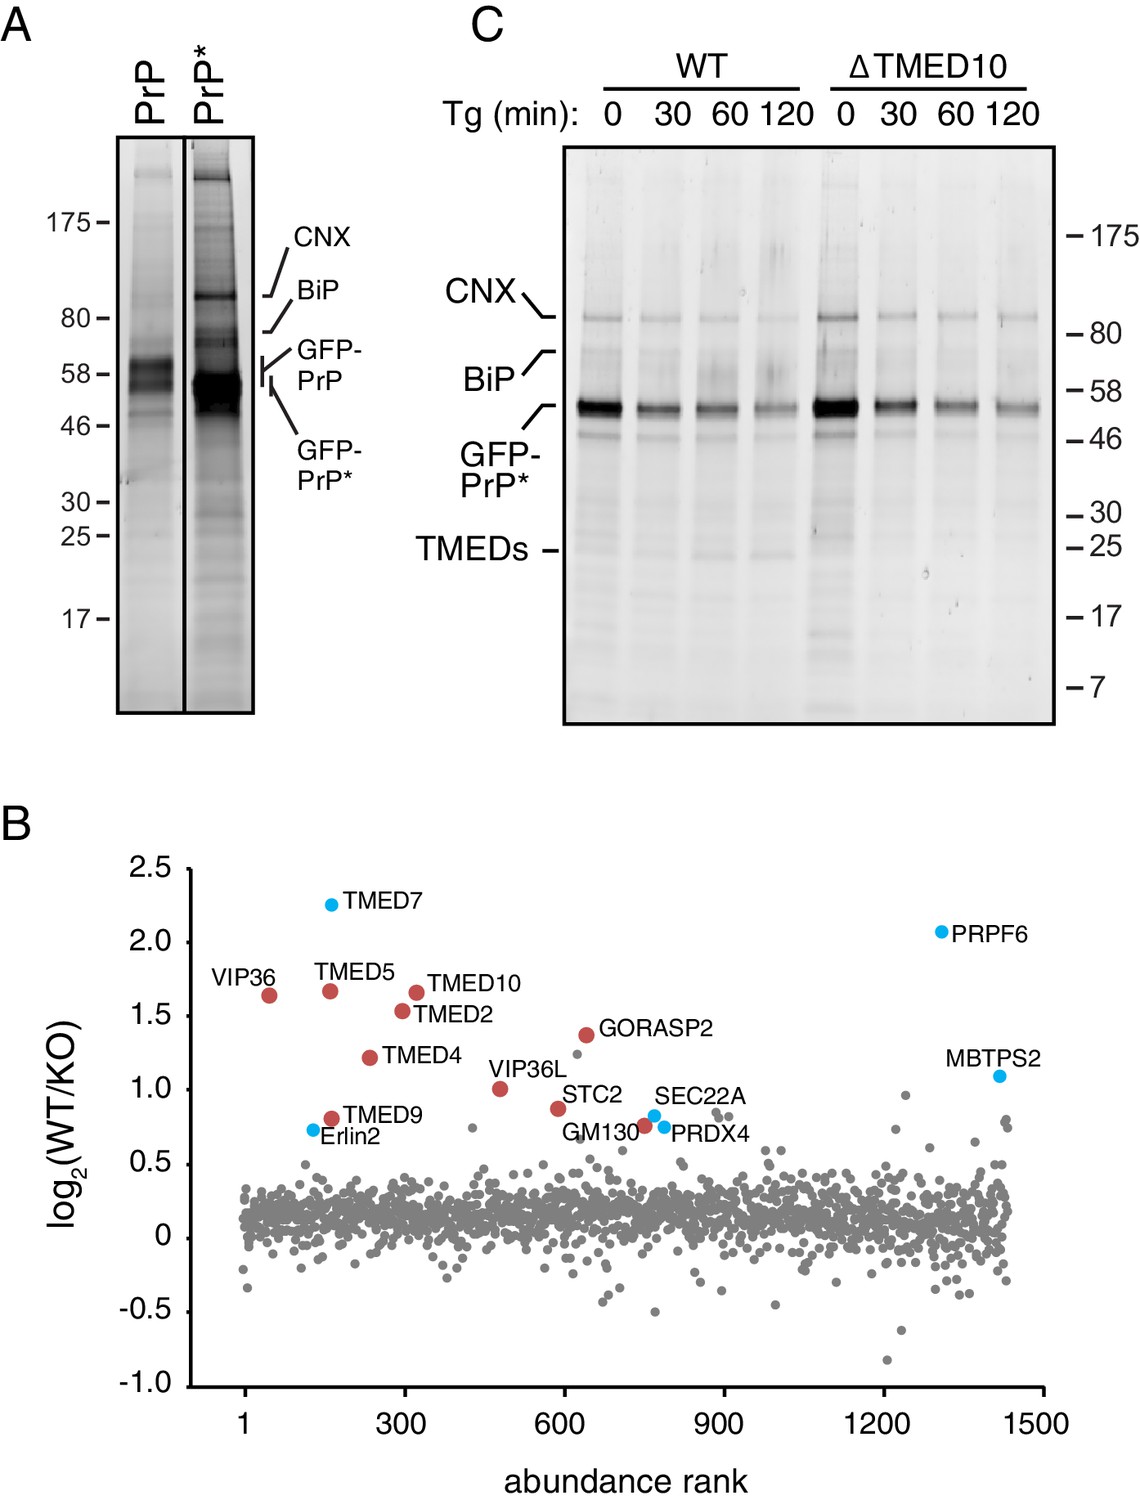
(A) Independent replicate of the affinity purification experiment shown in Figure 5A. The two lanes corresponding to GFP-PrP and GFP-PrP* are from the same gel and exposure, with the vertical line indicating where intervening lanes removed. (B) Independent replicate of the GFP-PrP* interactome in WT and ∆TMED10 cells as shown in Figure 5C. (C) Independent replicate of the time course of GFP-PrP* interactions in WT and ∆TMED10 cells shown in Figure 5D.
Figure 6 with 2 supplements
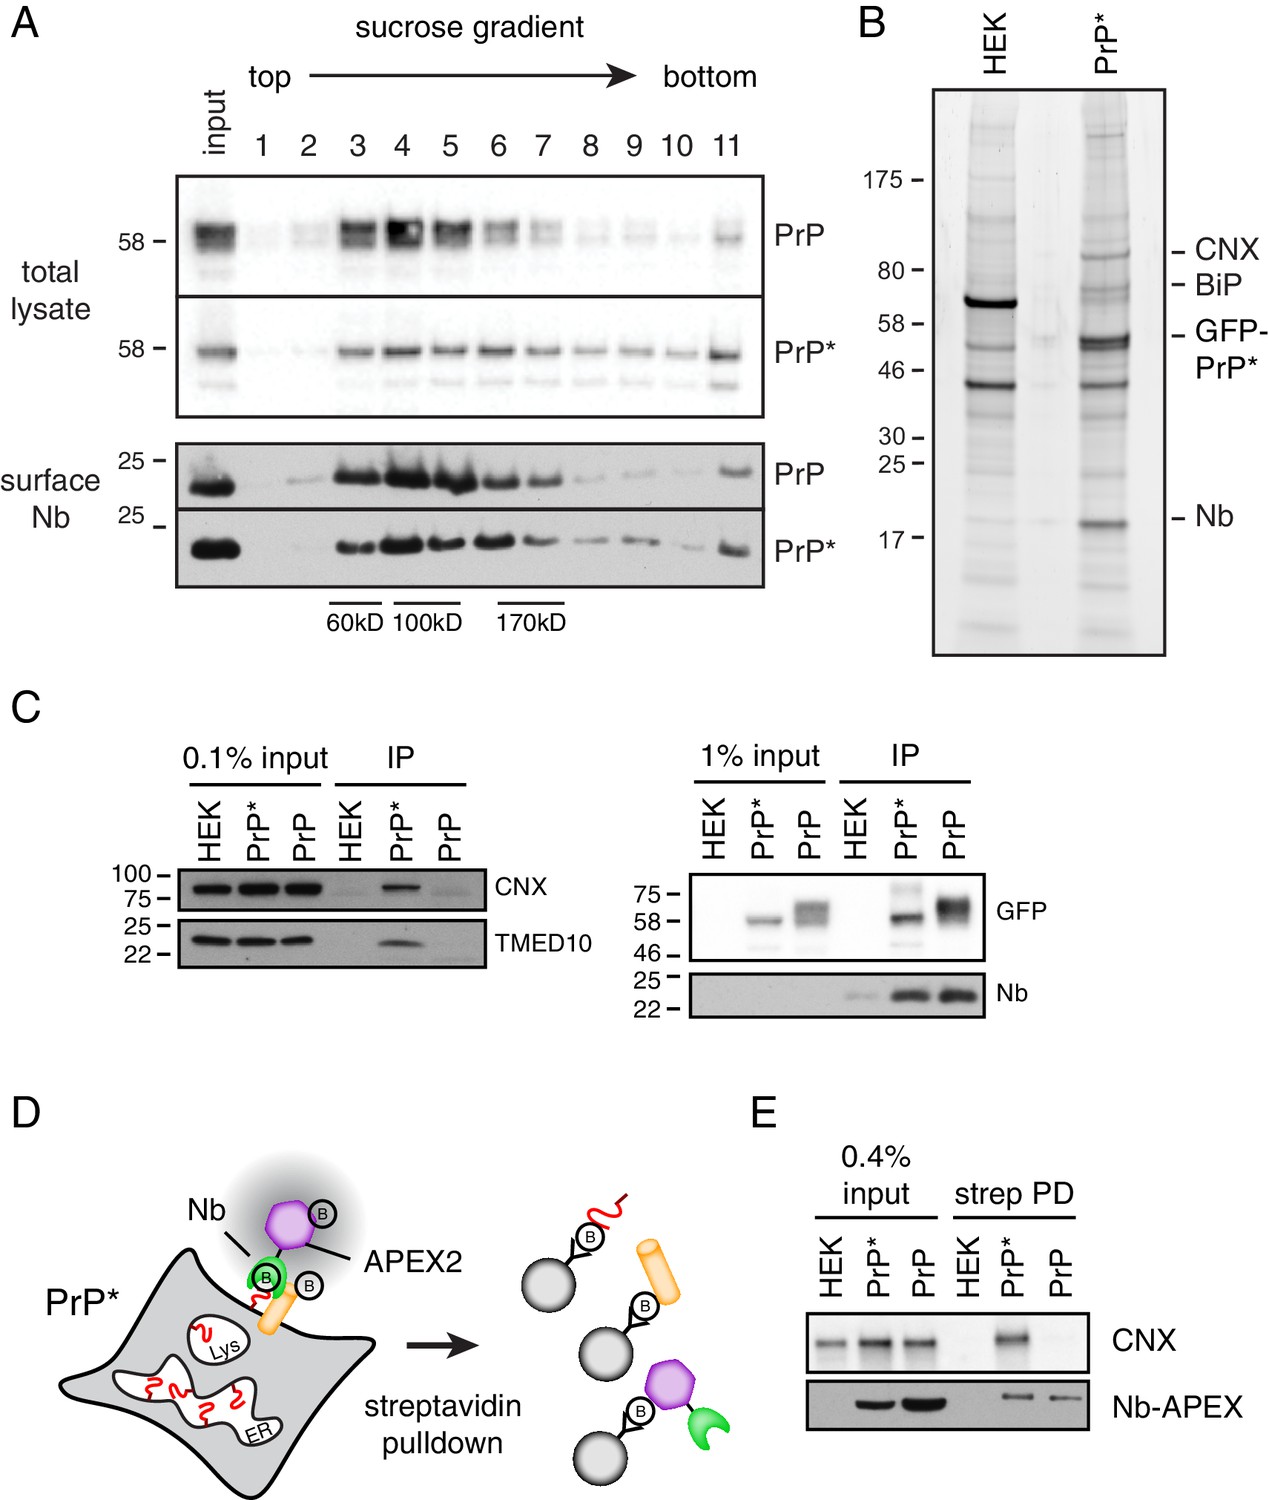
Cell surface PrP* is associated with ER-derived factors.
(A) Cells expressing GFP-PrP and GFP-PrP* were labeled on ice with saturating levels of extracellular Nb-FLAG, lysed under non-denaturing conditions, and separated by size on a 5–25% sucrose gradient. Fractions were immunoblotted with anti-GFP to detect total cellular GFP-PrP and GFP-PrP*, and anti-FLAG to detect surface-localized Nb complexes. Size standards are estimates based on migration of known proteins on such gradients, which migrate reproducibly from experiment to experiment. (B) GFP-PrP*-expressing cells and control HEK293T cells were surface labeled and lysed as in panel A and affinity purified via the FLAG epitope tag on the Nb. Elutions were separated by SDS-PAGE and stained with SYPRO-Ruby, with key proteins indicated on the right. (C) Cells expressing GFP-PrP and GFP-PrP* were surface labeled such that equal amounts of anti-GFP Nb-FLAG coated the surface of these two cells. This was accomplished by using saturating (200 nM) Nb for GFP-PrP* cells and 2 nM Nb for GFP-PrP cells. These values were determined in preliminary titration experiments. Surface-localized GFP-PrP and GFP-PrP* were then affinity purified as in panel B, the samples were separated by SDS-PAGE, and subjected to immunoblotting as indicated. The right panel verifies that equal amounts of GFP-PrP and GFP-PrP* were recovered with the Nb in the immunoprecipitates. (D) Schematic of the strategy to selectively label proteins near the cell surface population of GFP-PrP* using recombinant anti-GFP Nb-APEX2. Biotinylated proteins are recovered by streptavidin pulldown. (E) Cells expressing GFP-PrP and GFP-PrP* were surface labeled such that equal amounts of anti-GFP Nb-APEX2 coated the surface of these two cells, with saturating (200 nM) Nb for GFP-PrP* cells and 0.5 nM Nb for GFP-PrP cells. These values were determined in preliminary titration experiments. After 1 min of biotinylation and quenching, the cells were lysed and the input samples and streptavidin-recovered products were analyzed by immunoblotting.
Figure 6—figure supplement 1
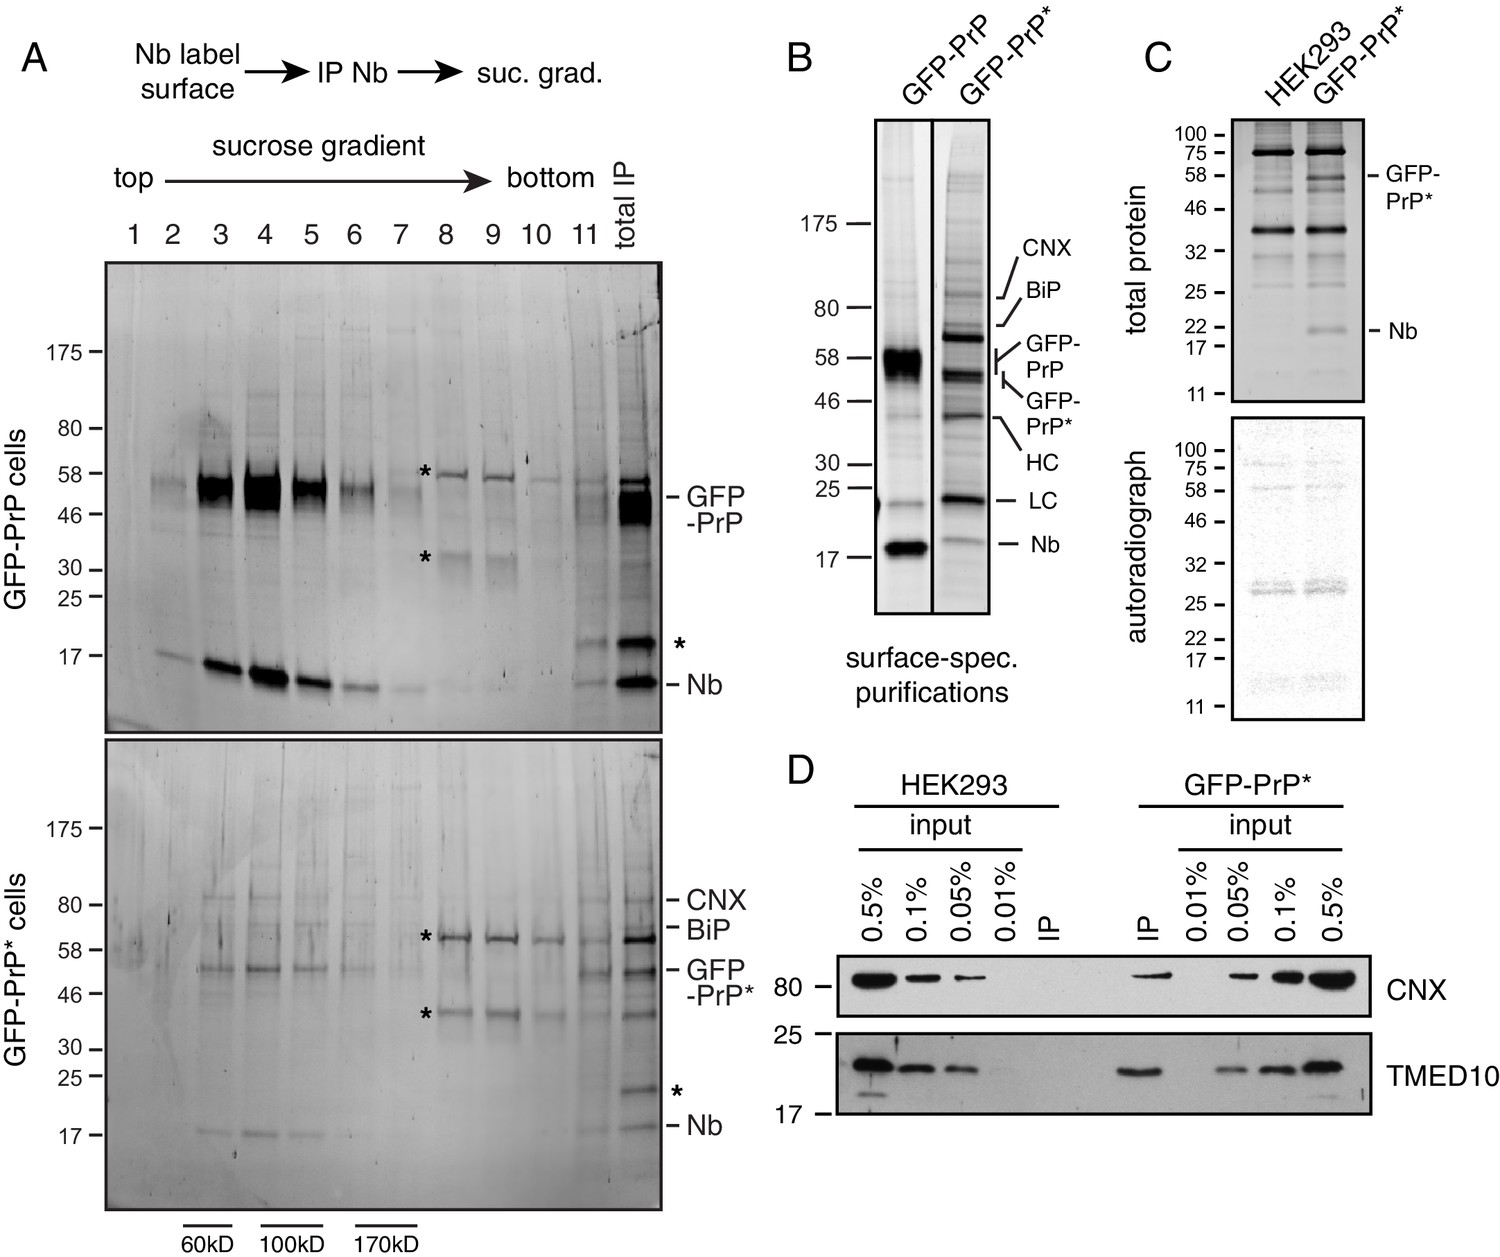
Characterization of cell surface GFP-PrP* complexes.
(A) Cells expressing GFP-PrP or GFP-PrP* were labeled on ice with saturating levels of Nb-FLAG, washed, and lysed under non-denaturing conditions. The Nb-FLAG complexes were immunopurified via the FLAG epitope tag, eluted under native conditions using FLAG peptide, and separated by size on a 5–25% sucrose gradient. Fractions were analyzed by SDS-PAGE and detected by SYPRO-Ruby stain. Size standards are estimates based on migration of known proteins on such gradients, which migrate reproducibly from experiment to experiment. An aliquot of the total IP is shown in the last lane, with key proteins and the Nb indicated. Asterisks represent the major contaminants found in both samples. As expected, far more GFP-PrP (and associated Nb) is recovered than GFP-PrP*, consistent with the former being present on the surface at ~20 fold higher levels. (B) Cells expressing GFP-PrP or GFP-PrP* were surface labeled with Nb-FLAG, washed, lysed under non-denaturing conditions, and affinity purified via the FLAG epitope tag. The elutions were separated by SDS-PAGE and detected with SYPRO-Ruby stain. The two lanes corresponding to GFP-PrP and GFP-PrP* are from the same gel and exposure, with the vertical line indicating where intervening lanes removed. (C) GFP-PrP*-expressing cells and control HEK293 cells were labeled on ice with saturating levels of Nb-FLAG and washed. In parallel, GFP-PrP*-expressing cells were radiolabelled with 35S-methionine for 1 hr and collected. The Nb-labelled and radiolabelled cells were mixed 1:1, lysed under non-denaturing conditions, and affinity purified via the FLAG epitope tag. Elutions were separated by SDS-PAGE and detected with SYPRO-Ruby stain (top panel) and autoradiography (bottom panel). Note that recovery of radiolabeled proteins was very low and the pattern of radiolabelled proteins was identical in the two samples. This indicates that the unlabeled GFP-PrP* (visible in the stained gel) does not appear to bind radiolabeled proteins after lysis. (D) Affinity purified cell surface GFP-PrP* complexes (as in Figure 6B) were compared to serial dilutions of total lysate to estimate the relative amount of CNX and TMED10 recovery. A parallel surface labeling and affinity purification performed on HEK293 cells lacking GFP-PrP* was also analyzed.
Figure 6—figure supplement 2
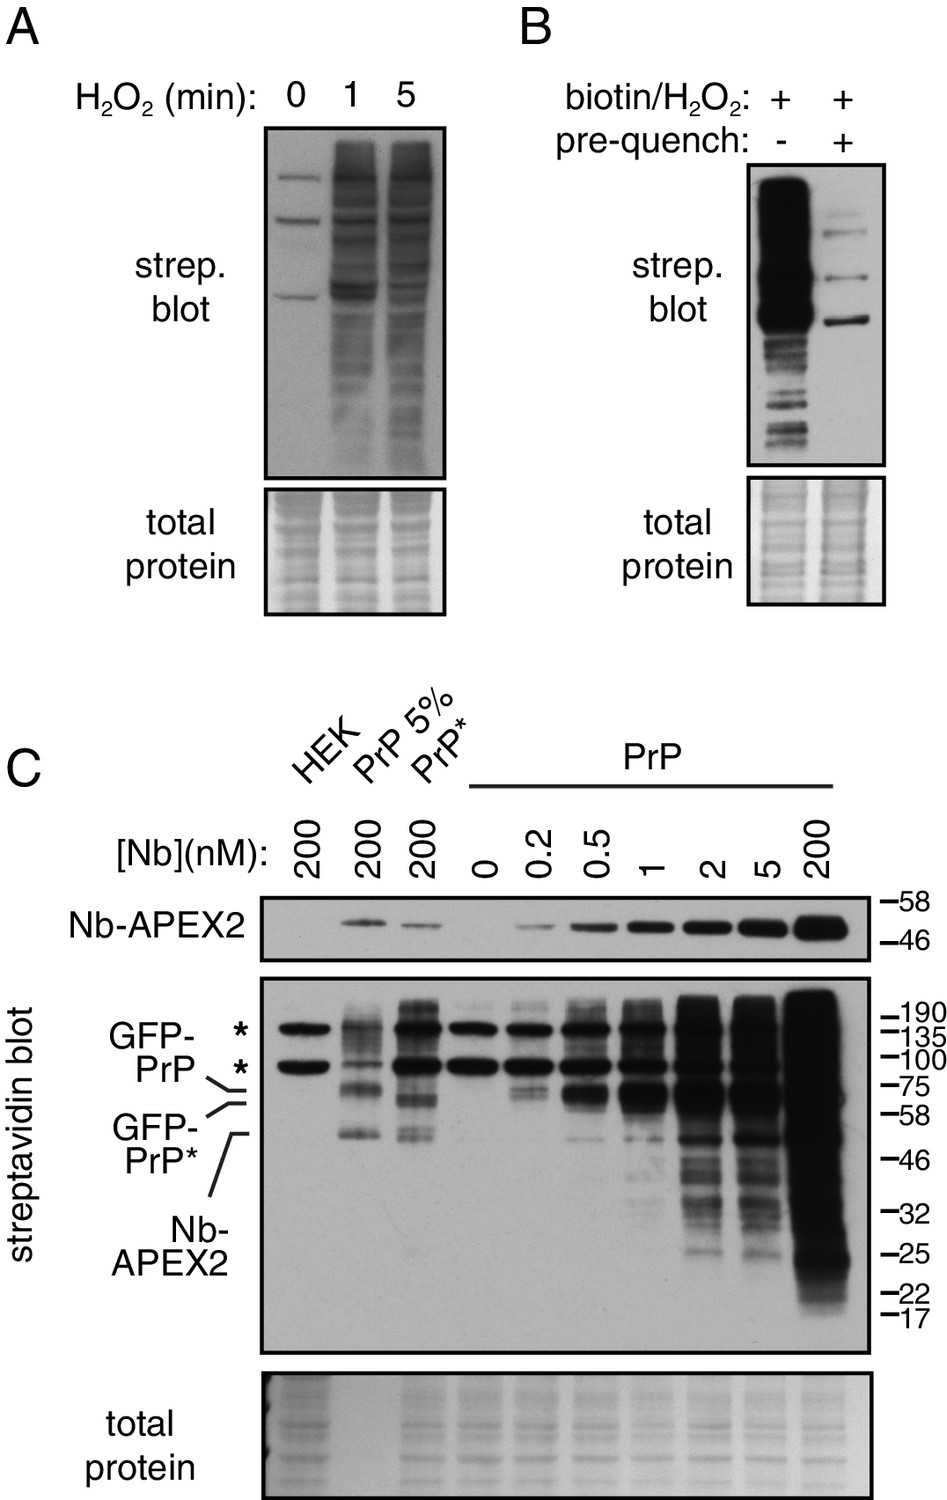
Characterization of APEX2-mediated biotinylation.
(A) Cells expressing GFP-PrP were surface labeled with 200 nM Nb-APEX2, washed, and incubated with biotin-phenol and H2O2 for the time indicated prior to quenching. Cell lysates were analyzed for biotinylated proteins by blotting with streptavidin-HRP. The few prominent bands seen at the 0 time point are endogenous biotin-modified proteins. (B) Cells expressing GFP-PrP surface labeled with 200 nM Nb-APEX2, washed, incubated with biotin-phenol and H2O2 for 1 min, then quenched (first lane). Alternatively, the quenching solution was added prior to addition of biotin-phenol and H2O2 for 1 min (second lane). The cells were then lysed and analyzed for biotinylated proteins by blotting with streptavidin-HRP. Note that if cells are pre-quenched, no biotinylated proteins are observed beyond the few endogenous biotin-modified proteins. (C) Cells expressing GFP-PrP and GFP-PrP* were surface labeled with Nb-APEX2 added at the indicated concentrations to the medium, washed, then incubated with biotin-phenol and H2O2 for 1 min. For comparison, HEK293 cells are shown as a negative control. The positions of the most prominently labeled proteins (Nb-APEX2 and its target antigen) are indicated.
Figure 7 with 1 supplement
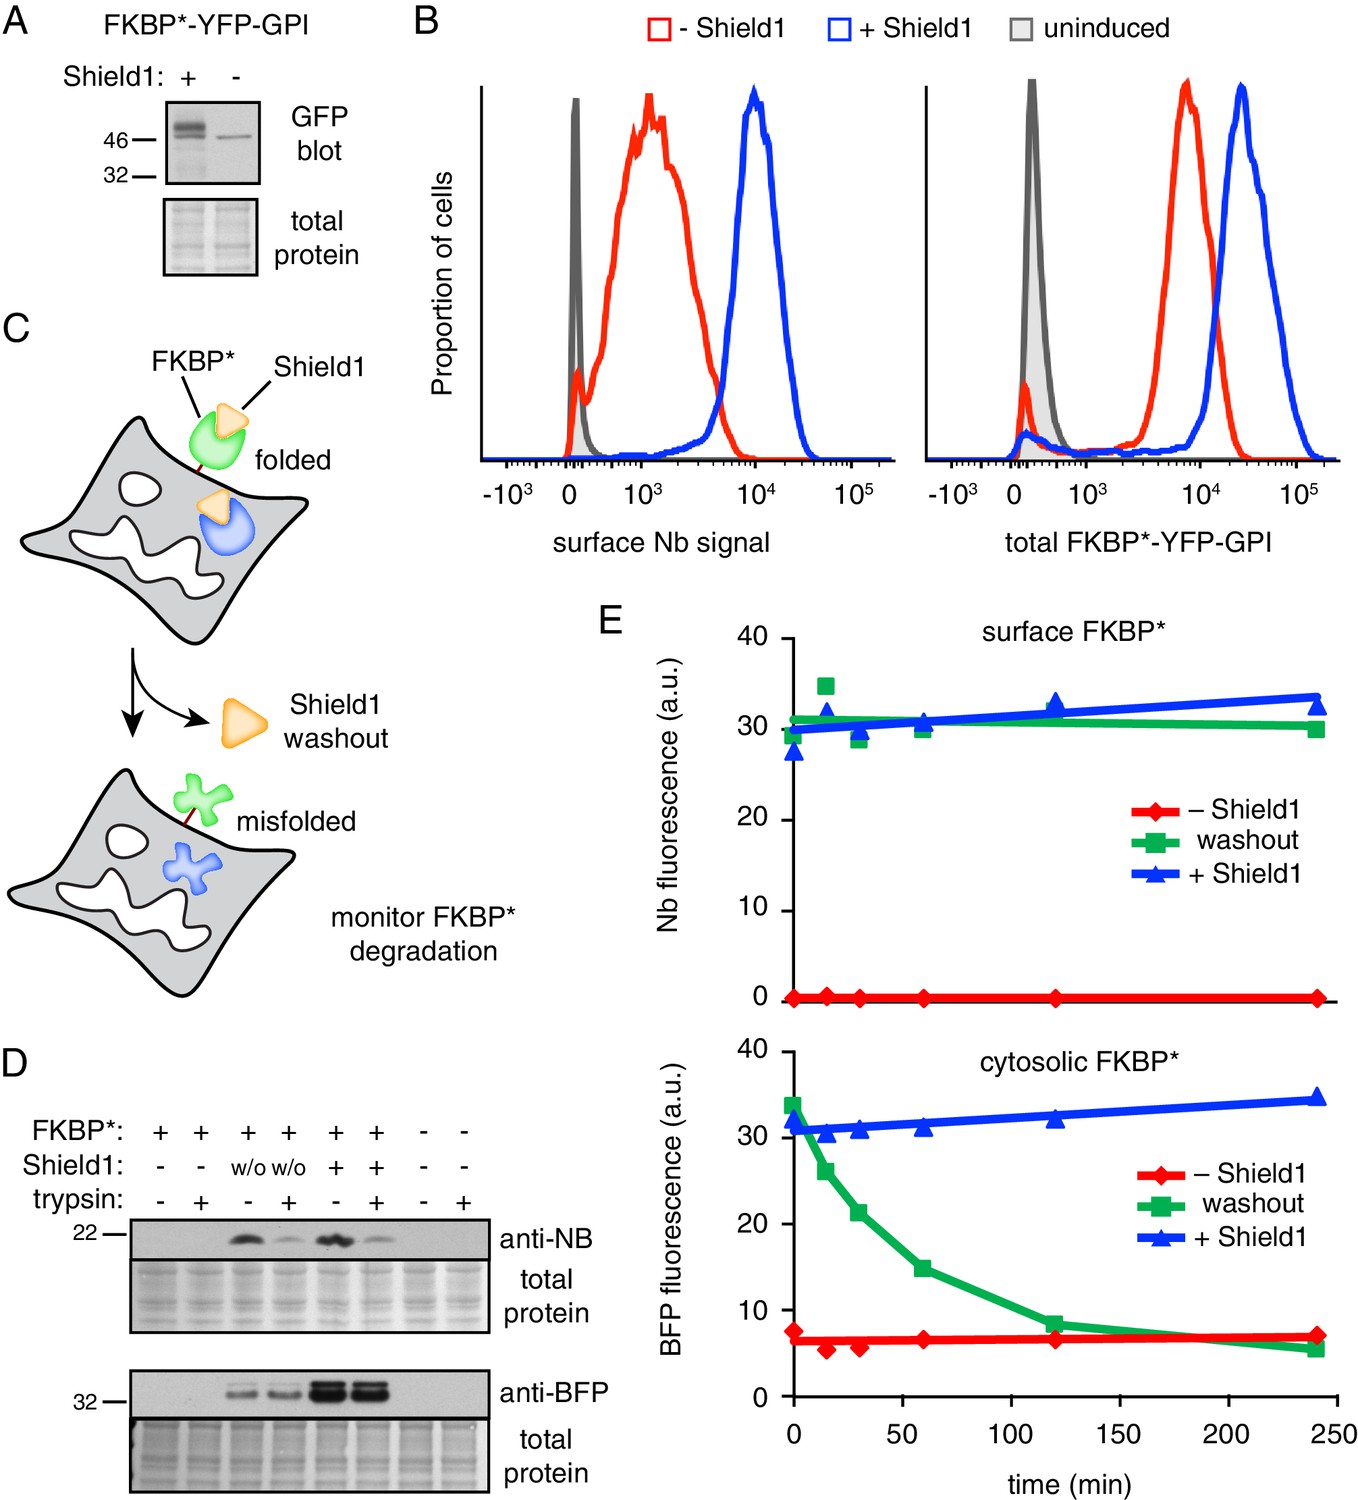
GPI-anchored protein acutely misfolded at the cell surface is not degraded.
(A) Cells transiently transfected with FKBP*-YFP-GPI for 48 hr were grown in the presence or absence of 2 µM Shield1, lysed, and immunoblotted using anti-GFP (which also detects YFP). (B) Cells stably expressing inducible FKBP*-YFP-GPI grown with or without Shield1 were incubated on ice with 200 nM Alexa647-conjugated anti-GFP Nb and analyzed by flow cytometry for Nb fluorescence (left) or total YFP fluorescence (right). (C) Schematic of experimental strategy for simultaneousy monitoring the fate of inducibly misfolded FKBP* in the cytosol and on the cell surface. The surface FKBP* is tagged with YFP and the cytosolic FKBP* is tagged with tagBFP. (D) Cells transiently transfected with FKBP*-YFP-GPI and cytosolic FKBP*-BFP for 48 hr were grown in the presence or absence of 2 µM Shield1. Following labeling on ice with Nb-FLAG, cells were washed and incubated for a further two hours at 37°C. During this incubation period, half of the cells previously grown in Shield1 were subjected to washout (w/o) by omitting Shield1 and further supplementing the medium with excess recombinant FKBP* to act as a molecular ‘sink’ to capture any residual Shield1. After the incubation period, half of the cells were treated with extracellular trypsin to digest surface-exposed proteins before inactivating the trypsin. Following lysis, Nb-FLAG and cytosolic FKBP*-BFP were detected by immunoblotting. (E) Cells transiently transfected with FKBP*-YFP-GPI and cytosolic FKBP*-BFP for 48 hr were grown in the presence or absence of 2 µM Shield1. In a subset of cells, Shield1 was withdrawn as in panel D for varying periods of time, after which surface-localized FKBP*-YFP-GPI was stained with Alexa647-Nb. Levels of cytosolic FKBP*-BFP and surface-localized FKBP*-YFP-GPI were monitored via flow cytometry. 2.5 µg/ml Brefeldin A was included in the medium during the time course to prevent export of newly-synthesized protein.
Figure 7—figure supplement 1

Characterization of FKBP*-YFP-GFP cells.
(A) Cells stably expressing inducible FKBP*-YFP-GPI grown with or without Shield1 were allowed to internalize Alexa647-Nb from the culture medium in the presence of thapsigargin-induced ER stress and 100 µg/ml cycloheximide. The graph depicts the median fluorescence intensity of internalized nanobody at each time point relative to time 0, as measured by flow cytometry. (B) Total YFP fluorescence was measured in cells over a time course experiment as in panel A. The graph depicts median fluorescence intensity as a percentage of time 0.
Tables
Key resources table
| Reagent type (species) or resource | Designation | Source or reference | Identifiers | Additional information |
|---|---|---|---|---|
| Cell line (Homo sapiens) | HEK293T | ATCC CRL-3216 | RRID:CVCL_0063 | |
| Cell line (H. sapiens) | HEK293 TRex Flp-in | Invitrogen | RRID:CVCL_U427 | |
| Cell line (H. sapiens) | HEK293 TRex GFP-PrP* | This paper | GFP-PrP* (see below) integrated into FRT site of HEK293 Trex Flp-in cell line | |
| Cell line (H. sapiens) | HEK293 TRex GFP-PrP | This paper | GFP-PrP (see below) integrated into FRT site of HEK293 Trex Flp-in cell line | |
| Cell line (H. sapiens) | HEK293 TRex GFP-PrP* TMED10 KO | This paper | Disruption of TMED10 by CRISPR/Cas9 in GFP-PrP* cell line | |
| Cell line (H. sapiens) | HEK293 TRex GFP-PrP TMED10 KO | This paper | Disruption of TMED10 by CRISPR/Cas9 in GFP-PrP cell line | |
| Cell line (H. sapiens) | HEK293 TRex FKBP*-YFP-GPI | This paper | FKBP*-YFP-GPI (see below) integrated into FRT site of HEK293 Trex Flp-in cell line | |
| Antibody | rabbit polyclonal anti-GFP | Stefanovic and Hegde, 2007 | (1:5000) | |
| Antibody | rabbit polyclonal anti-RFP | Stefanovic and Hegde, 2007 | (1:3000) | |
| Antibody | mouse monoclonal anti-FLAG (M2)-HRP conjugated | Sigma | Cat #A8592, RRID:AB_439702 | (1:10000) |
| Antibody | rabbit polyclonal anti-TMED10 C-terminus | Satpute-Krishnan et al., 2014 | (1:1000) | |
| Antibody | rabbit polyclonal anti-TMED2 | Jenne et al., 2002 | (1:6000) | |
| Antibody | rabbit polyclonal anti-TMED10 lumenal domain | Jenne et al., 2002 | (1:5000) | |
| Antibody | rabbit polyclonal anti-TMED7 | Jenne et al., 2002 | (1:5000) | |
| Antibody | rabbit polyclonal anti-TMED9 | Jenne et al., 2002 | (1:3000) | |
| Antibody | rabbit polyclonal anti-CNX N-terminus | Enzo | Cat #ADI-SPA-865, RRID:AB_10618434 | (1:2000 – 1:5000) |
| Antibody | rabbit polyclonal anti-CNX C-terminus | Enzo | Cat #ADI-SPA-860, RRID:AB_10616095 | (1:2000) |
| Antibody | rabbit polyclonal anti tagRFP (also recognizes tagBFP) | evrogen | Cat #AB233, RRID:AB_2571743 | (1:2000) |
| Antibody | mouse monoclonal anti-alpha adaptin (AP2) | BD Biosciences | Cat #610502, RRID:AB_397868 | (1:3000) |
| Antibody | mouse monoclonal anti-Transferrin receptor | Invitrogen | Cat #136800, RRID:AB_2533029 | (1:500) |
| Recombinant DNA reagent | pRSET-Nanobody-3x FLAG-His | This paper | Nanobody sequence from Addgene plasmid #49172 | |
| Recombinant DNA reagent | pX330-TMED10 sgRNA2 | This paper | sgRNA targeting TMED10 | |
| Recombinant DNA reagent | pX330-TMED10 sgRNA3 | This paper | sgRNA targeting TMED10 | |
| Recombinant DNA reagent | pcDNA3-HA-TMED10 | This paper | Human TMED10 with HA tag following signal sequence | |
| Recombinant DNA reagent | pcDNA3-HA-TMED10 si2R | This paper | HA-tagged human TMED10 as above with silent mutations to confer resistance to Stealth RNAi TMED10HSS 145904 | |
| Recombinant DNA reagent | pcDNA3-HA-RFP-TMED10 | This paper | Human TMED10 with HA tag and RFP following signal sequence | |
| Recombinant DNA reagent | pcDNA3-HA-TMED10 ΔCC | This paper | Human HA-TMED10 lacking coiled-coil domain (amino acids 130–183) | |
| Recombinant DNA reagent | pcDNA3-HA-RFP-TMED10 ΔGOLD | This paper | Human HA-RFP-TMED10 with GOLD domain deleted (residues 41–129 of original protein) | |
| Recombinant DNA reagent | pcDNA3-HA-RFP-TMED10 ΔCC | This paper | Human HA-RFP-TMED10 lacking coiled-coil domain (amino acids 130–183) | |
| Recombinant DNA reagent | FKBP12-YFP-GPI | Sengupta et al., 2015 | ||
| Recombinant DNA reagent | FKBP*-YFP-GPI | This paper | F36V and L106P mutations introduced into FKBP12-YFP-GPI | |
| Recombinant DNA reagent | pcDNA5-FRT/TO-FKBP *-YFP-GPI | This paper | FKBP*-YFP-GPI subcloned into pcDNA5-FRT/TO for stable inducible expression | |
| Recombinant DNA reagent | FKBP*-BFP | This paper | FKBP* followed by BFP for cytosolic expression | |
| Recombinant DNA reagent | pET15b-HisFKBP*12 F36V | Addgene | Cat #73180, RRID:Addgene_73180 | |
| Recombinant DNA reagent | FusionRed-Dynamin S45N | Almeida-Souza et al., 2018 | Dominant-negative dynamin mutant | |
| Recombinant DNA reagent | pcDNA3-3xmyc-TMED2 | This paper | Human TMED2 with 3xmyc tag following signal sequence. | |
| Recombinant DNA reagent | pRSET-Nanobody- APEX2-3xFLAG-His | This paper | Nanobody-APEX2-FLAG for bacterial expression. APEX2 sequence from Addgene plasmid #49386 | |
| Recombinant DNA reagent | mGFP1-N1 | Clontech | ||
| Recombinant DNA reagent | pcDNA5-FRT/TO- EGFP-PrP* | This paper | C179A mutant of hamster PrP with bovine prolactin signal sequence; EGFP @ unique Bsu36I site downstream of signal sequence. | |
| Recombinant DNA reagent | pcDNA5-FRT/TO- EGFP-PrP | This paper | Wild-type human PrP, with EGFP @ unique Bsu36I site downstream of signal sequence. | |
| Sequence-based reagent | CRISPR: TMED10 sgRNA2 | IDT | TAACGGAAAAGGGCCGCGCC | |
| Sequence-based reagent | CRISPR: TMED10 sgRNA3 | IDT | GCAGCAACGCTAACGGAAAA | |
| Sequence-based reagent | siRNA: nontargeting control | Dharmacon | D-001810–10 | |
| Sequence-based reagent | siRNA: AP2 (alpha-adaptin) | Dharmacon | gift of B. Nichols lab (MRC-LMB) | |
| Sequence-based reagent | siRNA: nontargeting control | Thermo Fisher | 4390843 | Silencer Select |
| Sequence-based reagent | siRNA: TMED1 (a) | Thermo Fisher | s21699 | Silencer Select |
| Sequence-based reagent | siRNA: TMED1 (b) | Thermo Fisher | s21700 | Silencer Select |
| Sequence-based reagent | siRNA: TMED2 (a) | Thermo Fisher | s21570 | Silencer Select |
| Sequence-based reagent | siRNA: TMED2 (b) | Thermo Fisher | s21571 | Silencer Select |
| Sequence-based reagent | siRNA: TMED3 (a) | Thermo Fisher | s23799 | Silencer Select |
| Sequence-based reagent | siRNA: TMED3 (b) | Thermo Fisher | s23800 | Silencer Select |
| Sequence-based reagent | siRNA: TMED4 (a) | Thermo Fisher | s48156 | Silencer Select |
| Sequence-based reagent | siRNA: TMED4 (b) | Thermo Fisher | s48157 | Silencer Select |
| Sequence-based reagent | siRNA: TMED5 (a) | Thermo Fisher | s27202 | Silencer Select |
| Sequence-based reagent | siRNA: TMED5 (b) | Thermo Fisher | s27203 | Silencer Select |
| Sequence-based reagent | siRNA: TMED6 (a) | Thermo Fisher | s44861 | Silencer Select |
| Sequence-based reagent | siRNA: TMED6 (b) | Thermo Fisher | s44862 | Silencer Select |
| Sequence-based reagent | siRNA: TMED7 (a) | Thermo Fisher | s27238 | Silencer Select |
| Sequence-based reagent | siRNA: TMED7 (b) | Thermo Fisher | s27239 | Silencer Select |
| Sequence-based reagent | siRNA: TMED9 (a) | Thermo Fisher | s29353 | Silencer Select |
| Sequence-based reagent | siRNA: TMED9 (b) | Thermo Fisher | s29354 | Silencer Select |
| Sequence-based reagent | siRNA: TMED10 | Thermo Fisher | HSS145904 | Stealth siRNA |
| Sequence-based reagent | siRNA: negative control | Thermo Fisher | 46–2001 | Stealth siRNA |
| Peptide, recombinant protein | Nanobody-FLAG-His | This paper | purified from E. coli (BL21) pLysS cells using immobilized metal affinity chromatography | |
| Peptide, recombinant protein | Nanobody-FLAG-APEX2 | This paper | purified from E. coli (BL21) pLysS cells using immobilized metal affinity chromatography | |
| Peptide, recombinant protein | FKBP12 (F36V) | Egeler et al., 2011 | purified from E. coli (BL21) pLysS cells using immobilized metal affinity chromatography | |
| Chemical compound, drug | Thapsigargin | Sigma | Cat #T9033 | |
| Chemical compound, drug | Bafilomycin A1 | Sigma | Cat #B1793 | |
| Chemical compound, drug | Brefeldin A | Invitrogen | Cat #B7450 | |
| Chemical compound, drug | Shield1 | Clontech/Takara | Cat #632189 | |
| Chemical compound, drug | Cycloheximide | Sigma | Cat #C4859 | |
| Chemical compound, drug | Alexa Fluor546 NHS Ester | Invitrogen | Cat #A20002 | |
| Chemical compound, drug | Alexa Fluor647 NHS Ester | Invitrogen | Cat #A37566 | |
| Chemical compound, drug | TMT labeling reagents | Thermo Fisher | Cat #90110 | |
| Chemical compound, drug | biotin-phenol | Iris Biotech | Cat #LS-3500 | |
| Other | GFP-trap | Chromotek | Cat #gta-20 | |
| Other | anti-FLAG M2 affinity resin | Sigma | Cat #A2220 | |
| Other | Streptavidin-HRP | Thermo Fisher | Cat #43–4323 | |
| Other | Streptavidin T1 Dynabeads | Invitrogen | Cat #65601 |
Additional files
-
Transparent reporting form
- https://doi.org/10.7554/eLife.46740.019
Download links
A two-part list of links to download the article, or parts of the article, in various formats.
Downloads (link to download the article as PDF)
Open citations (links to open the citations from this article in various online reference manager services)
Cite this article (links to download the citations from this article in formats compatible with various reference manager tools)
Misfolded GPI-anchored proteins are escorted through the secretory pathway by ER-derived factors
eLife 8:e46740.
https://doi.org/10.7554/eLife.46740


