Re-expression of SynGAP protein in adulthood improves translatable measures of brain function and behavior
- The Scripps Research Institute, United States
- University of Texas at Austin, United States
- Baylor College of Medicine, United States
Figures
Figure 1 with 1 supplement
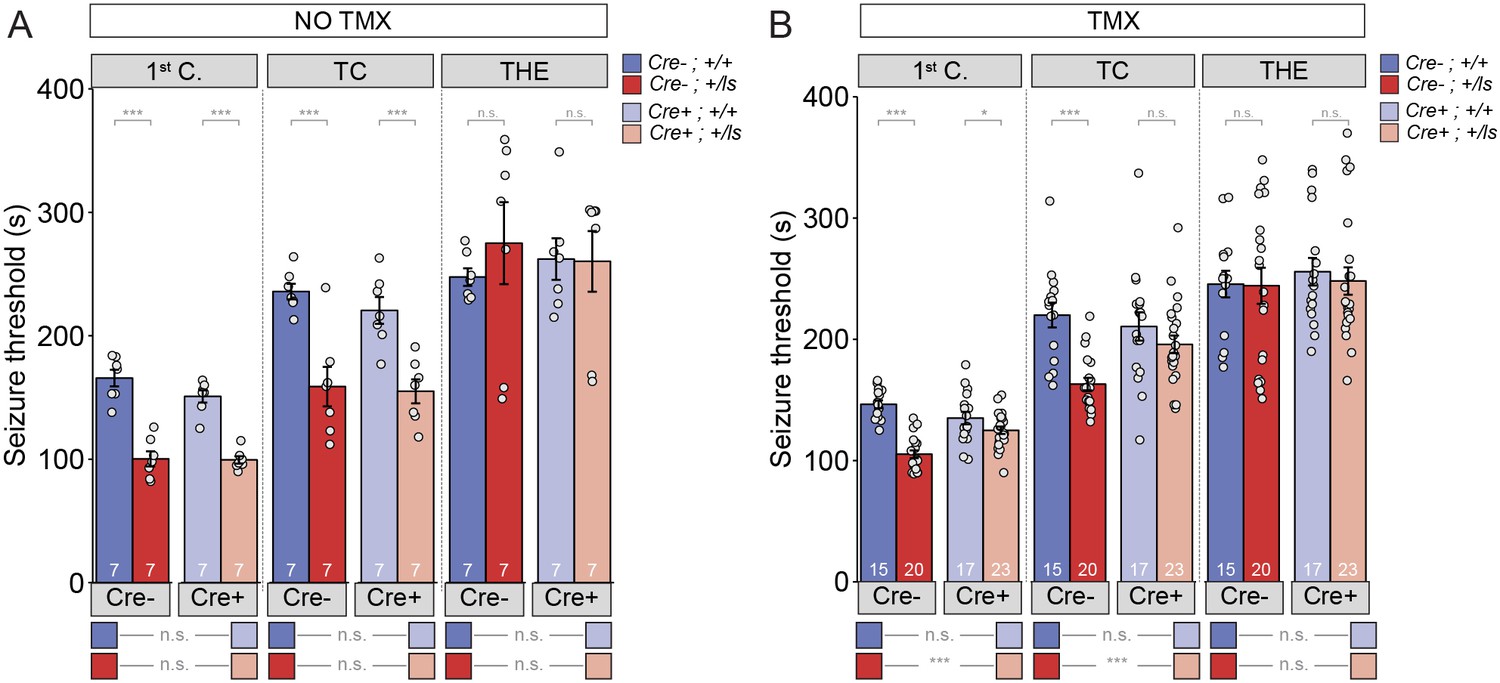
Seizure threshold is improved after adult restoration of SynGAP expression.
(A) SyngapCre-;+/ls and SyngapCre+;+/ls mice exhibit hyperexcitability in two of the three events without Cre activation (No TMX) Main effects-1st clonus: Cre F(1,24)=2.13, p=0.157, Genotype F = 117.73, p=9.75E-11, Interaction F(1,24)=1.69, p=0.206); Cre- Cohen’s d = 3.855, Cre +Cohen’s d = 4.737. TC: Cre F(1,24)=722, p=0.404, Genotype F(1,24)=40.05, p=1.53E-6), Interaction F(1,24)=.257, p=0.617); Cre- Cohen’s d = 2.396, Cre+ Cohen’s d = 2.405. THE: Cre F(1,24)=9.99E-6, p=0.998, Genotype F(1,24)=.320, p=0.577), Interaction F(1,24)=.420, p=0.523. (B) SyngapCre+;+/ls mice exhibit thresholds comparable to those of SyngapCre-;+/ls mice after Cre activation (TMX-treated) in two of the three events Main effects-1st clonus: Cre F(1,71)=2.59, p=0.112; Genotype F(1,71)=58.328, p=7.86E-11, Interaction F = 1 (1,71)=18.84 p=4.62E-5; Cre- Cohen’s d = 3.329, Cre+ Cohen’s d = 0.674; TC: Cre F(1,71)=4.53, p=0.037, Genotype F(1,71)=26.15, p=2.57E-6, Interaction F(1,71)=6.50, p=0.013; Cre- Cohen’s d = 2.040; Cre+ Cohen's d = 0.540; THE: Cre F(1,71)=.037, p=0.847, Genotype F(1,71)=1.15E-5, p=0.997, Interaction F(1,71)=.049, p=0.826. Data points (and numbers) in bars represent biological replicates (animals). Data from panel B are pooled from two separate experiments.
-
Figure 1—source data 1
Source data for Figure 1A.
- https://doi.org/10.7554/eLife.46752.005
-
Figure 1—source data 2
Source data for Figure 1B.
- https://doi.org/10.7554/eLife.46752.006
Figure 1—figure supplement 1
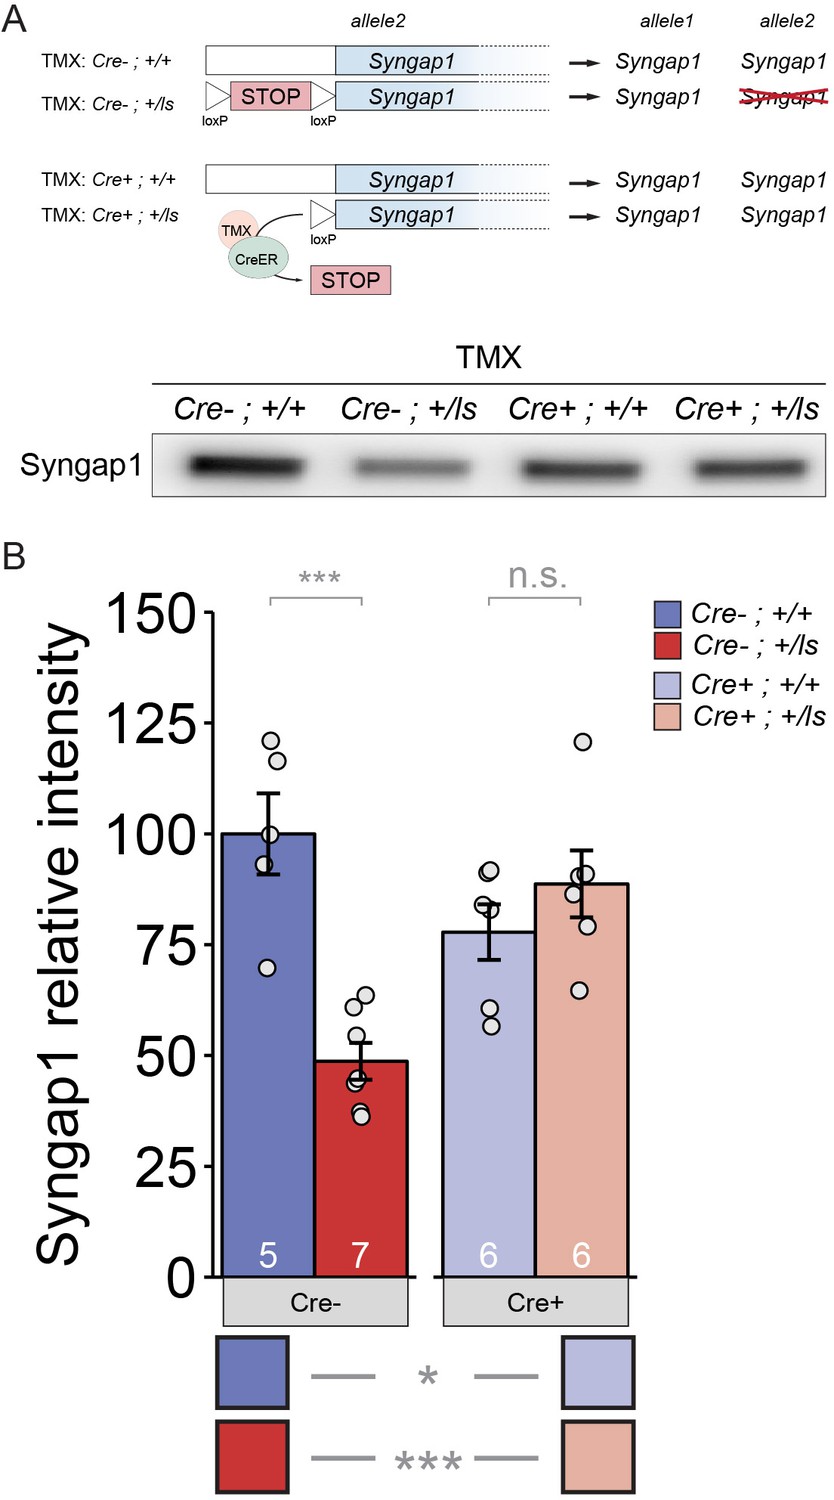
TMX-induced restoration of SynGAP protein levels in adult Syngap1Cre+;+/ls mice.
(A) Western blot demonstrating expression levels of total SynGAP in Cre(-) or Cre(+) heterozygous Lox-Stop mice and WT littermates. (B) Densitometric analysis of SynGAP. Band intensities were normalized to total protein levels and transformed to % of the Syngap1Cre-;+/+ group mean. Two-factor ANOVA. Main effects: Cre p=0.198, Genotype p=0.007, Interaction p=1.554E-4.=0.=0. Pairwise comparisons from posthoc tests can be found in Supplementary file 1. Data points (and numbers) in bars represent biological replicates (animals).
-
Figure 1—figure supplement 1—source data 1
Source data for Figure 1—figure supplement 1.
- https://doi.org/10.7554/eLife.46752.004
Figure 2 with 1 supplement

Rectification of state-dependent paroxysmal spiking events in Syngap1 mutants after adult-initiated gene therapy.
(A) Representative EEG/LFP traces from a WT [Cre(+); +/+] and Syngap1 heterozygous mutant mouse [Cre(+); +/ls]. After initial recordings (pre-TMX), all animals were injected with TMX. Post-TMX recordings were acquired 30 days after the last TMX injection. TMX rescued low levels of SynGAP protein in +/ls animals (see Figure 1—figure supplement 1). Highlighted areas correspond to periods of sleep (see Materials and methods). Phase I and Phase II recordings are from the same animals. (B) Frequency of spiking events observed in the hippocampal LFP channel during the wake phase (i.e. non-highlighted areas in panel A) from both pre- and post-TMX recording sessions in each animal. Two-way repeated measures ANOVA.:Main genotype effects: F(1,11)=10.1, p=0.00879, Main TMX effects: F(1,11)=12.088, p=0.00518. Interaction between genotype and TMX: F(1,11)=9.777, p=0.00963. Cre(+);+/+n = 6, Cre(+);+/ls n = 7. (C) Comparison of the spiking frequency from the hLFP channel in Cre(+);+/ls mice during wake and sleep before TMX injections, paired-t test t(5)=-5.6007, p=0.002507 (n = 5). Data points in plots represent biological replicates (animals).
-
Figure 2—source data 1
Source data for Figure 2B.
- https://doi.org/10.7554/eLife.46752.009
-
Figure 2—source data 2
Source data for Figure 2C.
- https://doi.org/10.7554/eLife.46752.010
Figure 2—figure supplement 1
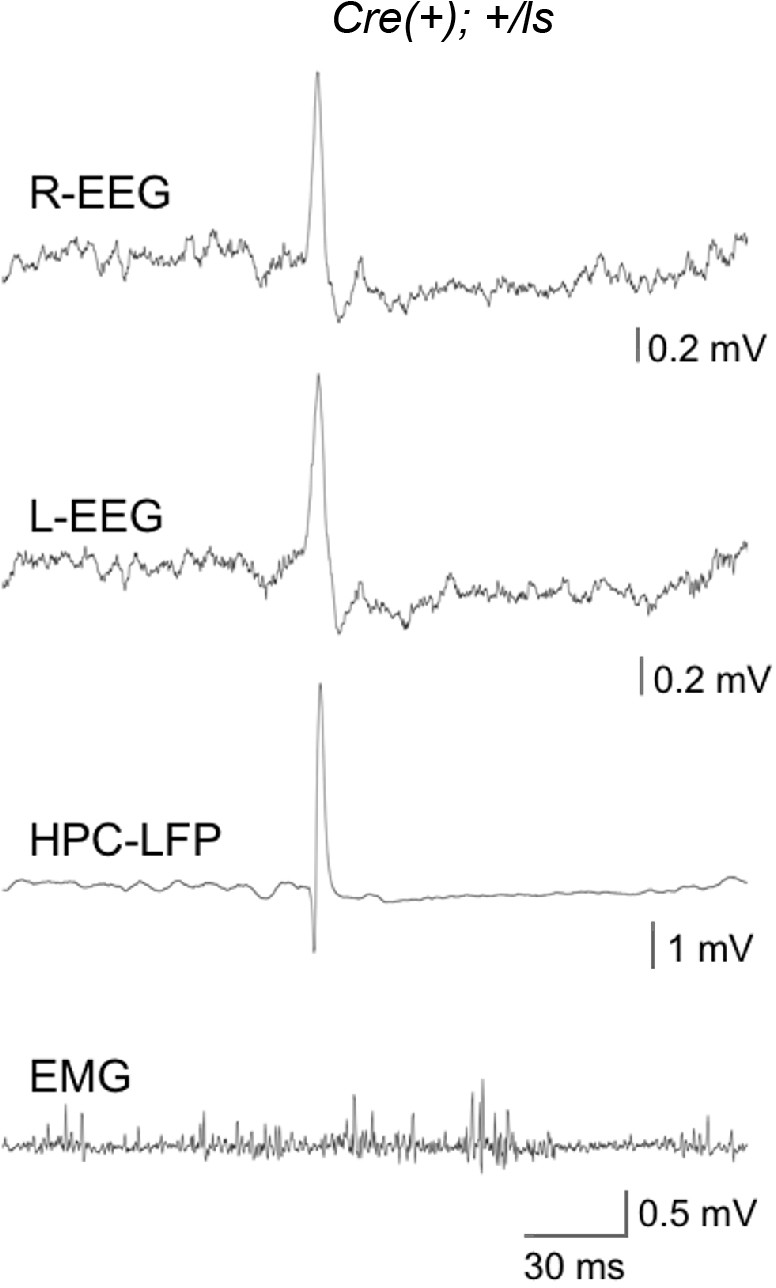
Generalization of high-amplitude spikes across the forebrain.
Representative traces from all channels during a Phase I recording from a Cre(+) Lox-Stop mouse.
Figure 3
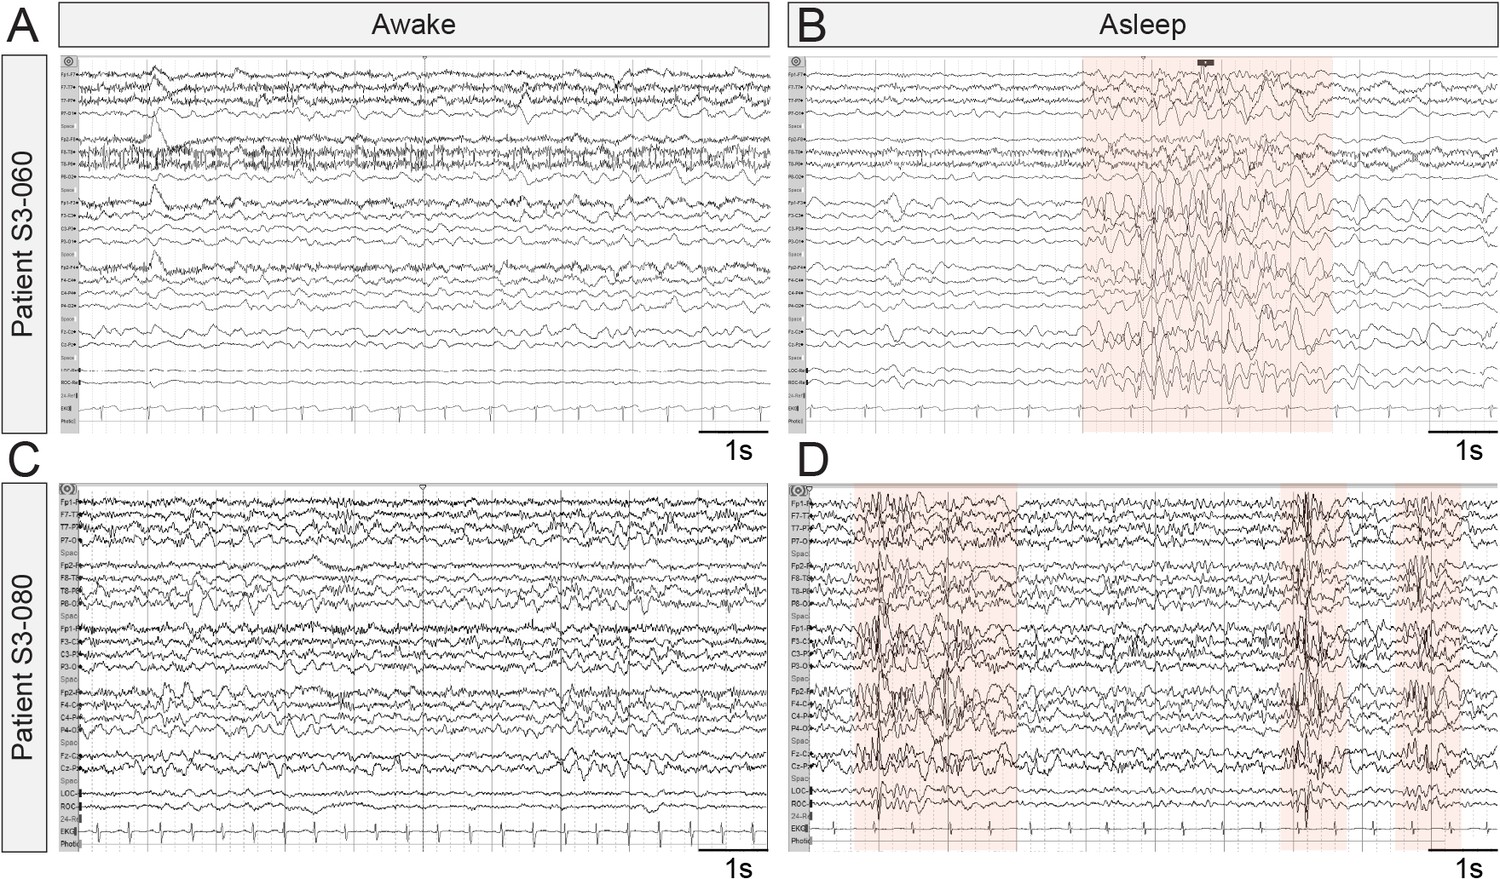
Representative EEG recordings taken from SYNGAP1 patients during wake and sleep.
Ten second epochs of electroencephalograms from patients with SYNGAP1 pathogenic variants. (A) Patient S3-060 while awake (B) Patient S3-060 while asleep (C) Patient S3-080 while awake (D) Patient S3-080 while asleep. Shaded areas indicate bursts of generalized epileptiform activity.
Figure 4

Long-term memory can be improved in adult mice with Syngap1 pathogenicity.
(A) Syngap1+/+ and Syngap1+/- ± were trained in the remote contextual fear conditioning paradigm and tested one month later for activity suppression levels. Activity of the Syngap1+/- was suppressed significantly less than that of the Syngap1+/+ group indicating compromised remote memory for the mutant group. Unpaired t test (t(19)=-2.567, p=0.019). Cohen’s d = 1.150. (B) Syngap1+/+ and Syngap1+/ls mice were trained in the contextual fear conditioning paradigm and tested one month later for activity suppression levels. Activity of the Syngap1+/ls group was suppressed significantly less than that of the Syngap1+/+ group indicating compromised remote memory for the mutant group. Wilcoxon rank sum test W = 19, p=2.82E-5, Cohen’s d = 1.676. (C) Syngap1+/+ and Syngap1+/- were tested, firstly, 1d after training, followed by another testing one month later. Activity suppression levels were not significantly different between the groups for either testing (unpaired t test,1-day t(13)=-0.033, p=0.974; 26 days t(13)=-1.068, p=0.305). (D) Experimental schematic depicting the breeding strategy for generation of Cre-inducible Syngap1Cre+;+/ls mice and Cre induction with TMX treatment for restoration of Syngap1 expression and subsequent remote fear conditioning testing. (E–F) Syngap1Cre-;+/+, Syngap1Cre-;+/ls, Syngap1Cre+;+/+, and Syngap1Cre+;+/ls mice were run in the remote contextual fear conditioning paradigm without (E) and with (F) TMX administration. Activity suppression values from mice without TMX administration (No TMX) were assessed (2-factor ANOVA: Main Effects-Cre F(1,90)=0.030, p=0.864, Genotype F(1,91)=46.78, p=9.28E-10, Interaction F(1,91)=6.81, p=0.011; Cre- Cohen’s d = 1.725, Cre+ Cohen’s d = 0.910. With TMX administration (2-factor ANOVA: Main Effects- Cre F=(1,73)=0.019, p=0.891, Genotype F(1,73)=27.49, p=1.48E-6, Interaction F(1,73)=14.75, p=2.59E-4; Cre- Cohen’s d = 2.167). Data points (and numbers) in bars represent biological replicates (animals). Data from panels E-F are pooled from at least two separate experiments.
-
Figure 4—source data 1
Source data for Figure 4A.
- https://doi.org/10.7554/eLife.46752.013
-
Figure 4—source data 2
Source data for Figure 4B.
- https://doi.org/10.7554/eLife.46752.014
-
Figure 4—source data 3
Source data for Figure 4C.
- https://doi.org/10.7554/eLife.46752.015
-
Figure 4—source data 4
Source data for Figure 4E.
- https://doi.org/10.7554/eLife.46752.016
-
Figure 4—source data 5
Source data for Figure 4F.
- https://doi.org/10.7554/eLife.46752.017
Figure 5 with 2 supplements
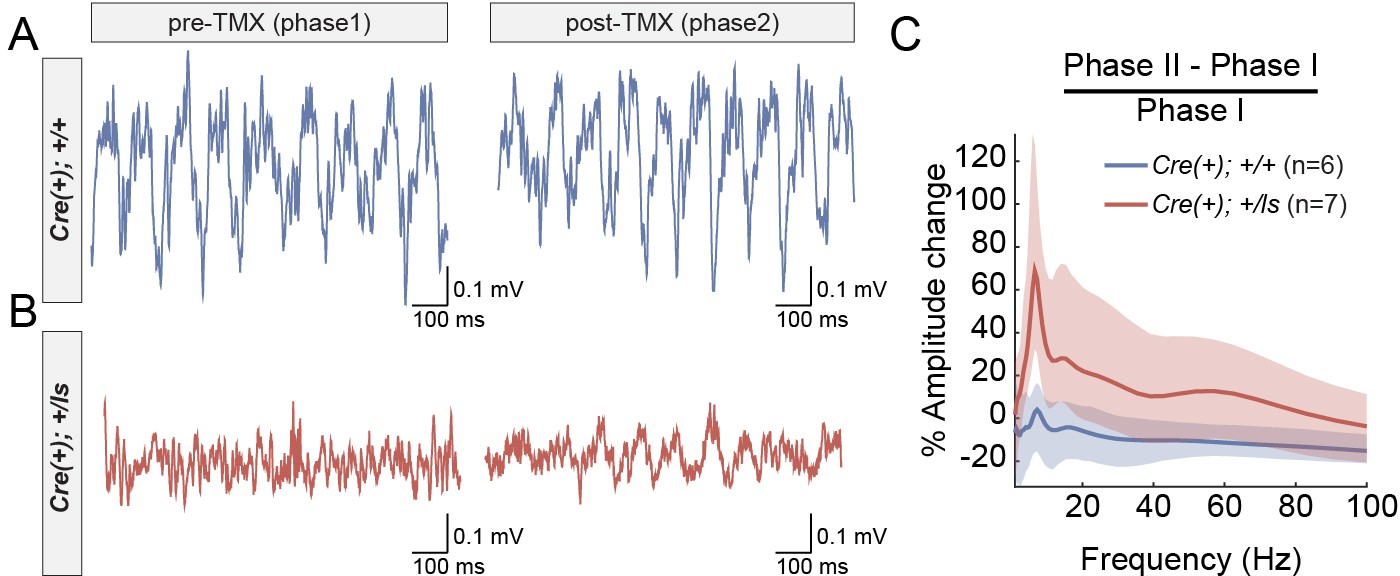
Increased amplitude of theta oscillations after SynGAP re-expression in adult Syngap1 mutant mice.
(A–B) CA1 LFP traces from a WT (A) and a Syngap1 mutant (B) mouse during Phase I and Phase II sessions. (C) Grand average of within-subjects changes in signal amplitude across the full spectrum of hippocampal rhythms. The amplitude change was normalized by the average amplitude during Phase I sessions. The shaded areas represent 95% bootstrapped confidence intervals. Significant increases in amplitude in Phase II were detected in the 6–12 Hz theta range (Permutation test: p=0.0128, 5000 shuffles). N’s are biological replicates (animals). Legends for Figure Supplements.
Figure 5—figure supplement 1

Amplitude of theta oscillations in each mouse during Phase I and Phase II recording sessions.
(A–B) CA1 LFP recordings from WT (A) and Syngap1 mutant (B) mice during Phase I and Phase II sessions. (C–D) Average amplitude spectra for each mouse during Phase I (C) and Phase II (D) sessions. Individual mice are indicated with individual lines, and WT and Syngap1 mutant spectra are depicted in blue and red, respectively.
Figure 5—figure supplement 2
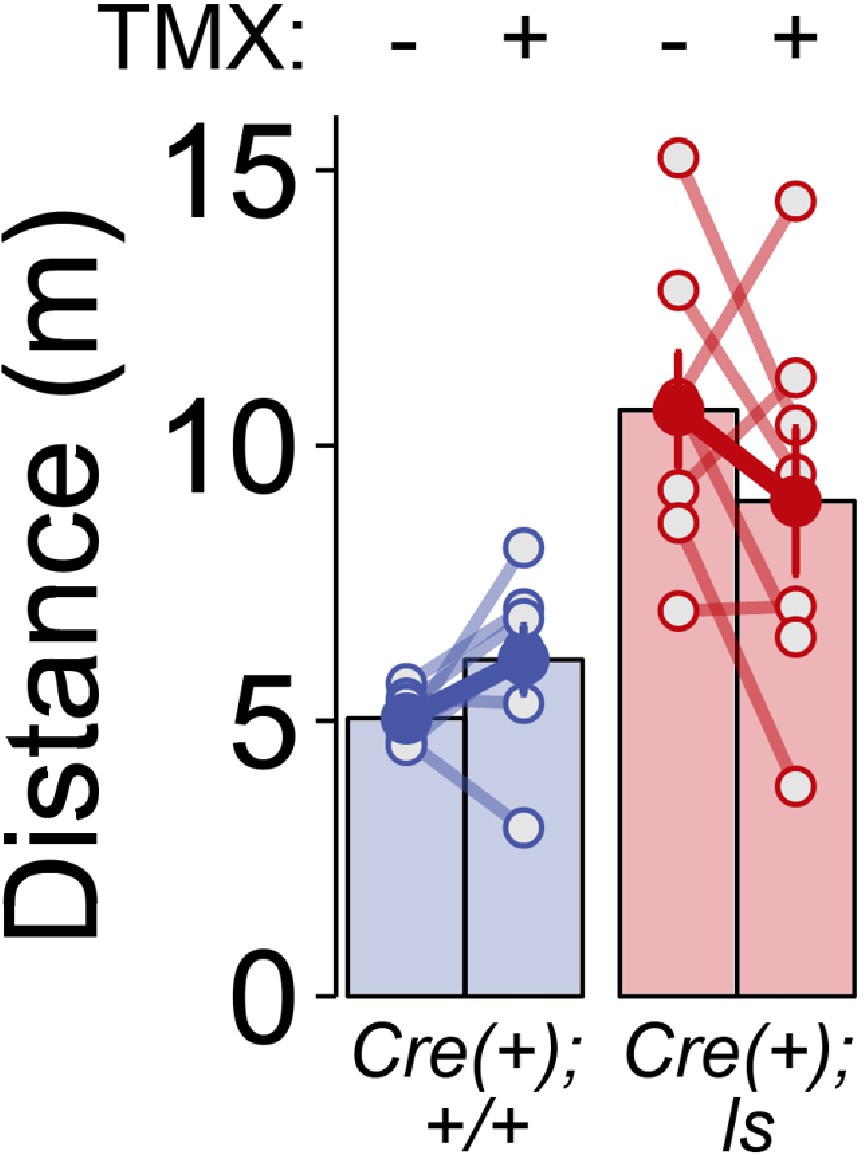
Effect of genotype, but not phase, on horizontal activity during neurophysiological recordings.
Cre(+) WT and Cre(+) Lox-Stop mice were video tracked for distances traveled during the first ten minutes of recording during Phase I (TMX-) and Phase II (TMX+) sessions. RMANOVA- Group: F(1,12)=16.527, p=0.002; Phase: F(1,12)=0.164, p=0.692; Group x Phase: F(1,12)=3.521, p=0.085. Data points in bars represent biological replicates (animals). Legends for Supplementary Files.
-
Figure 5—figure supplement 2—source data 1
Source data for Figure 5—figure supplement 2.
- https://doi.org/10.7554/eLife.46752.021
Additional files
-
Supplementary file 1
Pairwise comparison statistics for Figure 1.
Pairwise comparisons for each of the four groups in data presented in Figure 1A–B.
- https://doi.org/10.7554/eLife.46752.022
-
Supplementary file 2
Pairwise comparison statistics for Figure 1—figure supplement 1.
Pairwise comparisons for each of the four groups in data presented in Figure 1—figure supplement 1B.
- https://doi.org/10.7554/eLife.46752.023
-
Supplementary file 3
Summary of EEG data from MRD5 patients in the SYNGAP1 Registry.
Subset of entries from the SYNGAP1 patient registry noting EEG abnormalities.
- https://doi.org/10.7554/eLife.46752.024
-
Supplementary file 4
Pairwise comparison statistics for Figure 4E–F.
Pairwise comparisons for each of the four groups in data presented in Figure 4E–F.
- https://doi.org/10.7554/eLife.46752.025
-
Transparent reporting form
- https://doi.org/10.7554/eLife.46752.026
Download links
A two-part list of links to download the article, or parts of the article, in various formats.
Downloads (link to download the article as PDF)
Open citations (links to open the citations from this article in various online reference manager services)
Cite this article (links to download the citations from this article in formats compatible with various reference manager tools)
Re-expression of SynGAP protein in adulthood improves translatable measures of brain function and behavior
eLife 8:e46752.
https://doi.org/10.7554/eLife.46752


