KHNYN is essential for the zinc finger antiviral protein (ZAP) to restrict HIV-1 containing clustered CpG dinucleotides
- King’s College London, United Kingdom
- University College London, United Kingdom
Figures
Figure 1
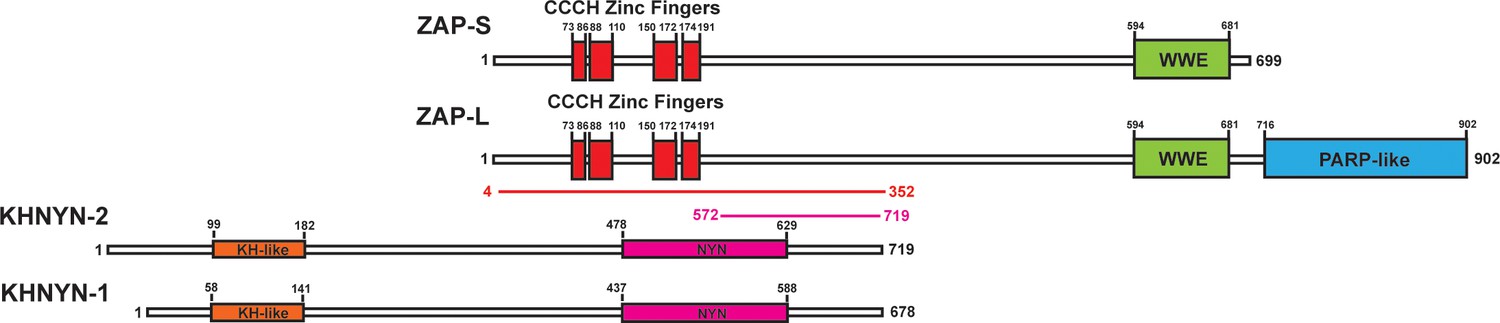
KHNYN is a ZAP-interacting factor identified by yeast two-hybrid screening.
A yeast two-hybrid screen for ZAP-S and ZAP-L interacting factors identified a region in KHNYN-1 and KHNYN-2. The selected interaction domain (SID) is the amino acid sequence shared by all prey fragments and is shown in magenta. A reciprocal yeast two-hybrid screen using KHNYN-2 as the bait identified a region in ZAP-S and ZAP-L. The SID is shown in red.
Figure 2 with 1 supplement
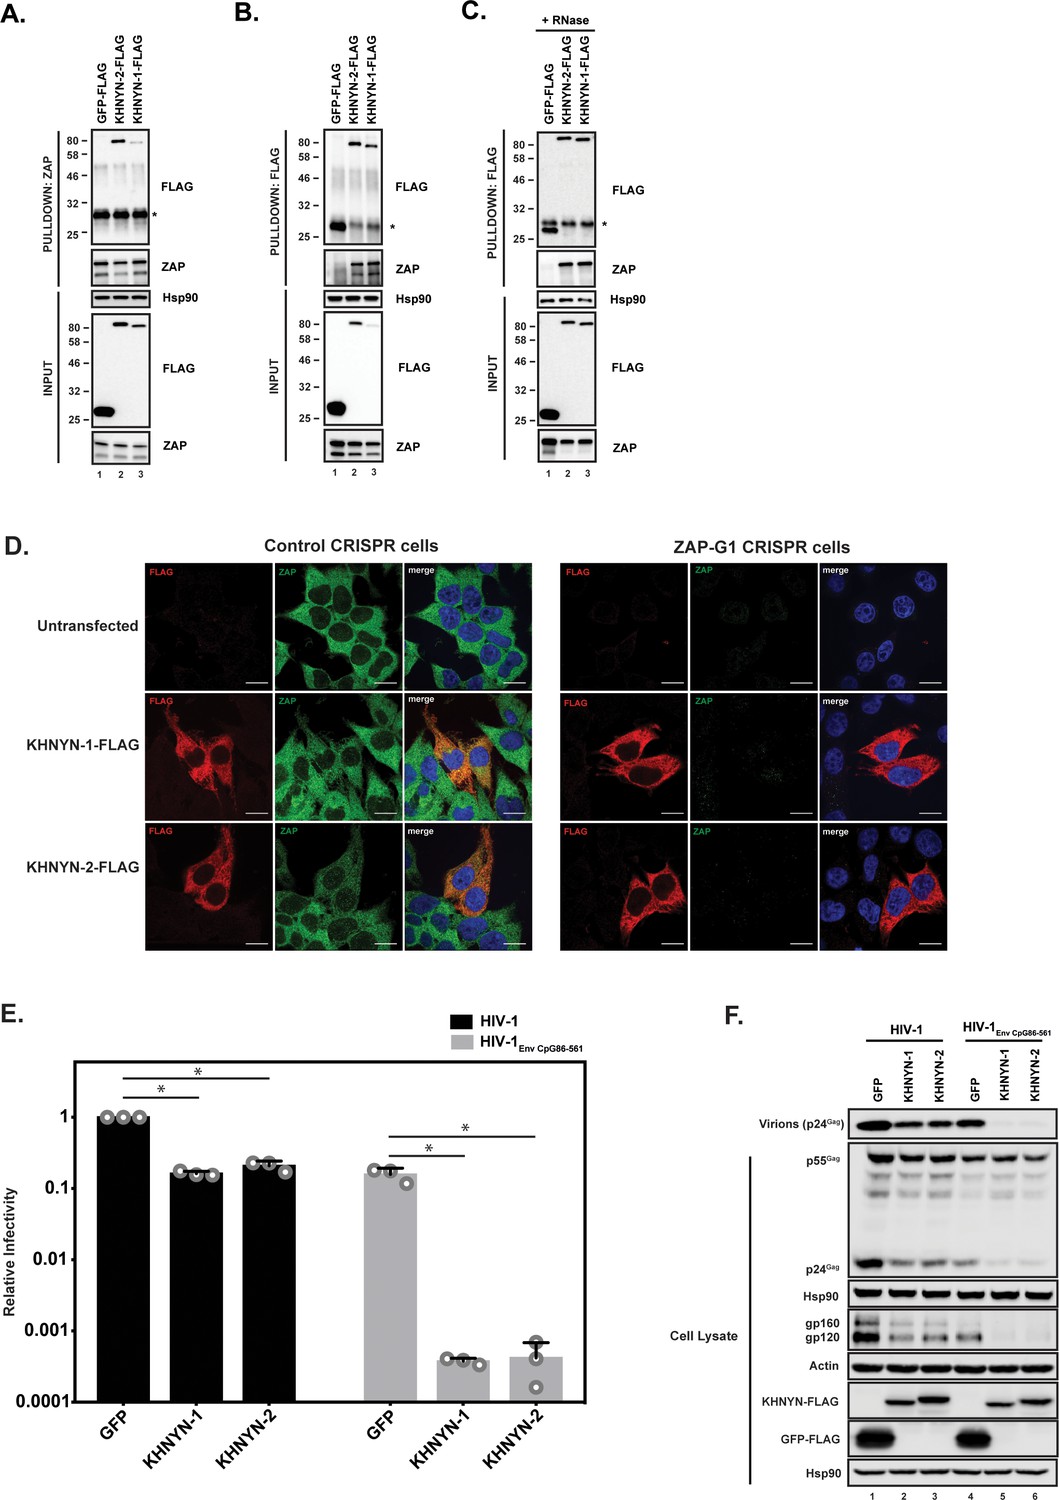
KHNYN interacts with ZAP and selectively inhibits HIV-1 containing clustered CpG dinucleotides.
(A) Lysates of HEK293T cells transfected either with pGFP-FLAG, pKHNYN-1-FLAG or pKHNYN-2-FLAG were immunoprecipitated with an anti-ZAP antibody. Post-nuclear supernatants and immunoprecipitation samples were analyzed by immunoblotting for Hsp90, KHNYN-FLAG and ZAP. * indicates a non-specific band. (B) Lysates of HEK293T cells transfected either with pGFP-FLAG, pKHNYN-1-FLAG or pKHNYN-2-FLAG were immunoprecipitated with an anti-FLAG antibody. Post-nuclear supernatants and immunoprecipitation samples were analyzed by immunoblotting for HSP90, KHNYN-FLAG and ZAP. * indicates a non-specific band. (C) Lysates of HEK293T cells transfected with pZAP-L and either pGFP-FLAG, pKHNYN-1-FLAG or pKHNYN-2-FLAG were treated with RNase and then immunoprecipitated with an anti-FLAG antibody. Post-nuclear supernatants and immunoprecipitation samples were analyzed by immunoblotting for HSP90, KHNYN-FLAG and ZAP. * indicates a non-specific band. (D) Panels show representative fields for the localization of KHNYN-1-FLAG or KHNYN-2-FLAG and endogenous ZAP in either 293T Control CRISPR cells expressing a guide RNA targeting LacZ or 293T ZAP guide 1 (ZAP-G1) CRISPR cells. Cells were stained with an anti-FLAG antibody (red), anti-ZAP antibody (green) and DAPI (blue). The scale bar represents 10 µM. (E–F) HeLa cells were transfected with 500 ng pHIV-1 or pHIV-1EnvCpG86-561 and 500 ng of pGFP-FLAG, pKHNYN-1-FLAG or pKHNYN-2-FLAG. See also Figure 2—figure supplement 1. Culture supernatants were used to infect TZM-bl reporter cells to measure infectivity (E). The bar charts show the average values of three independent experiments normalized to the value obtained for HeLa cells co-transfected with pHIV-1 and pGFP-FLAG. Data are represented as mean ± SD. *p<0.05 as determined by a two-tailed unpaired t-test. p-values for GFP verses KHNYN-1 and KHNYN-2 for wild-type HIV-1 are 2.76 × 10⁻⁹ and 2.20 × 10⁻⁶, respectively. p-Values for GFP verses KHNYN-1 and KHNYN-2 for HIV-1EnvCpG86-561 are 1.50 × 10⁻³ and 1.51 × 10⁻³, respectively. Gag expression in the media as well as Gag, Hsp90, Env, Actin, KHNYN-FLAG and GFP-FLAG expression in the cell lysates was detected using quantitative immunoblotting (F).
Figure 2—figure supplement 1
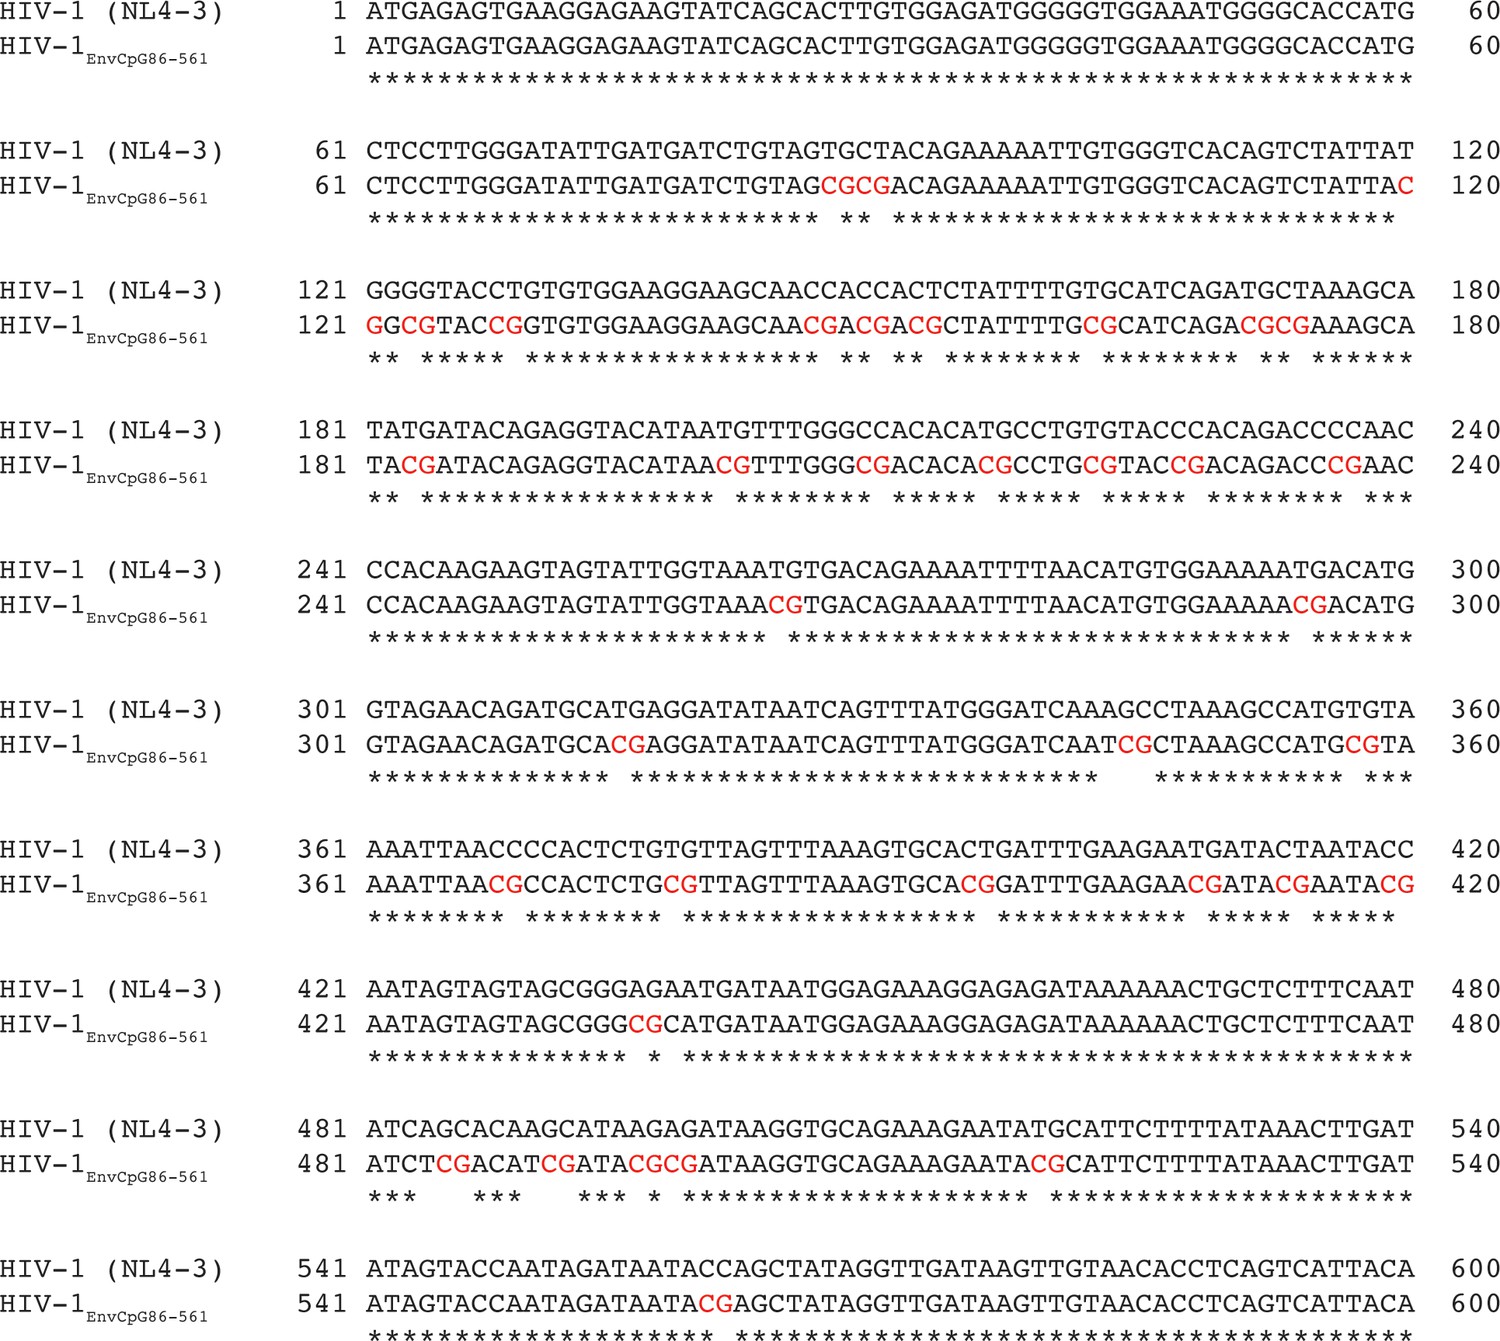
HIV-1EnvCpG86-561 contains 36 introduced CpG dinucleotides.
MacVector ClustalW alignment of nucleotides 1–600 of env from wild-type HIV-1 and HIV-1EnvCpG86-561. CpG dinucleotides introduced through synonymous mutations are highlighted in red.
Figure 3
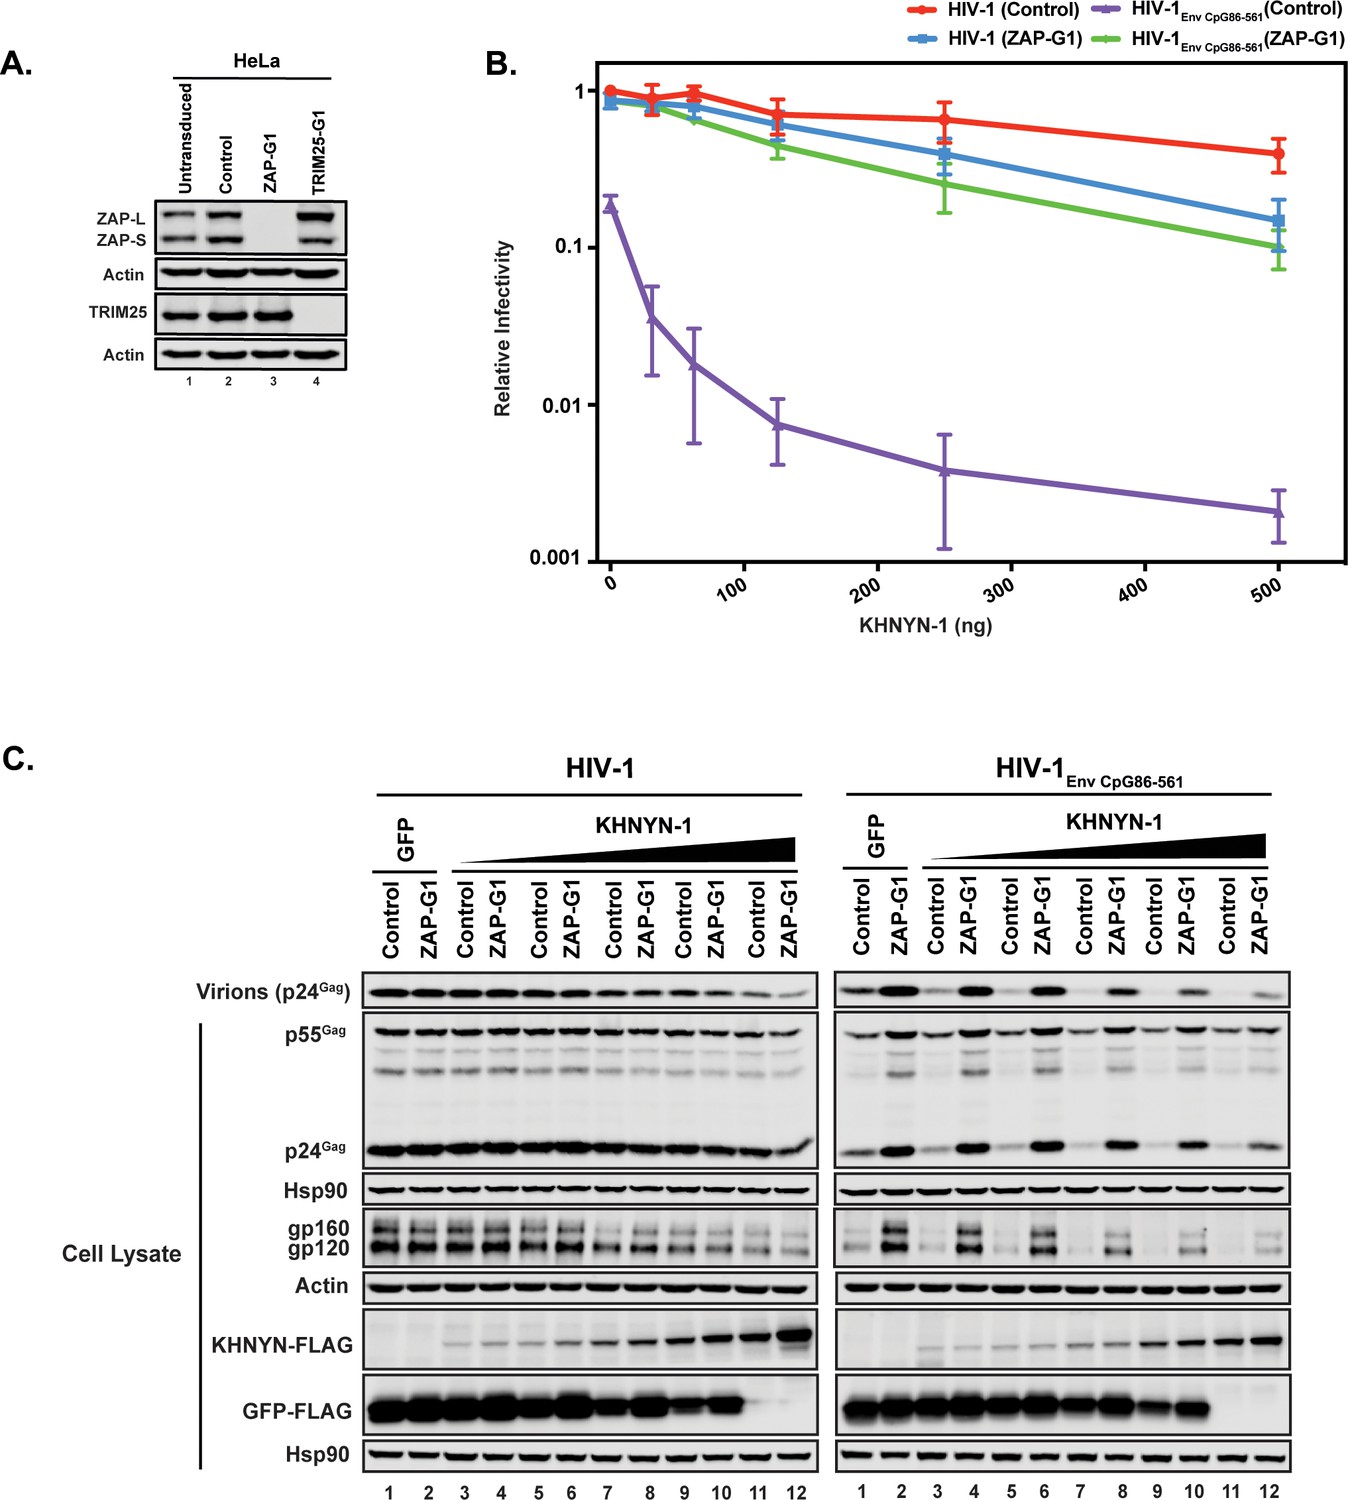
ZAP is required for KHNYN to inhibit infectious virion production for HIV-1 with clustered CpG dinucleotides.
(A) ZAP, TRIM25 and Actin expression in HeLa cells, HeLa Control CRISPR cells (expressing a guide RNA targeting the firefly luciferase gene), HeLa ZAP CRISPR guide 1 (ZAP-G1) cells and HeLa TRIM25 CRISPR guide 1 (TRIM25-G1) cells were detected using quantitative immunoblotting. (B–C) HeLa Control CRISPR cells or ZAP-G1 CRISPR cells were transfected with 500 ng pHIV-1 or pHIV-1EnvCpG86-561 and 500 ng of pGFP-FLAG or 31.25 ng, 62.5 ng, 125 ng, 250 ng or 500 ng pKHNYN-1-FLAG plus the amount of pGFP-FLAG required to make 500 ng total. Culture supernatants from the cells were used to infect TZM-bl reporter cells (B). Each point shows the average value of three independent experiments normalized to the value obtained for HeLa Control CRISPR cells co-transfected with pHIV-1 and pGFP-FLAG. Data are represented as mean ± SD. Gag expression in the media as well as Gag, Hsp90, Env, Actin, KHNYN-FLAG and GFP-FLAG expression in the cell lysates was detected using quantitative immunoblotting (C).
Figure 4
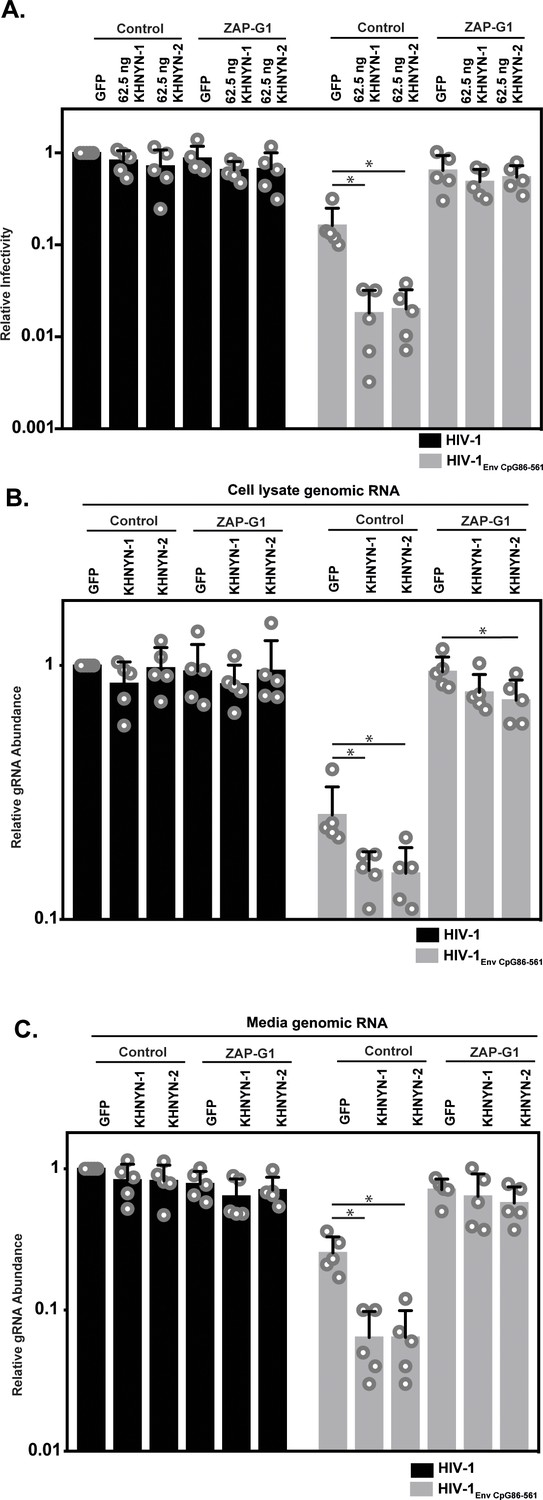
ZAP is required for KHNYN to inhibit genomic RNA abundance for HIV-1 with clustered CpG dinucleotides.
(A–C) HeLa Control CRISPR cells or ZAP-G1 CRISPR cells were transfected with 500 ng pHIV-1 or pHIV-1EnvCpG86-561 and 500 ng of pGFP-FLAG or 62.5 ng pKHNYN-1/2-FLAG plus 437.5 ng of pGFP-FLAG. Culture supernatants from the cells were used to infect TZM-bl reporter cells (A). The bar chart shows the average value of five independent experiments normalized to the value obtained for HeLa Control CRISPR cells co-transfected with pHIV-1 and pGFP-GFP. Data are represented as mean ± SD. *p<0.05 as determined by a two-tailed unpaired t-test. p-values for GFP verses KHNYN-1 and KHNYN-2 for HIV-1EnvCpG86-561 in Control cells are 6.78 × 10⁻³ and 7.20 × 10⁻³, respectively. p-Values for GFP verses KHNYN-1 and KHNYN-2 for HIV-1EnvCpG86-561 in ZAP-G1 cells are 3.22 × 10⁻¹ and 5.33 × 10⁻¹, respectively. RNA was extracted from cell lysates (B) and media (C) and genomic RNA (gRNA) abundance was quantified by qRT-PCR. The bar charts show the average value of five independent experiments normalized to the value obtained for HeLa Control CRISPR cells co-transfected with pHIV-1 and pGFP-GFP. Data are represented as mean ± SD. *p<0.05 as determined by a two-tailed unpaired t-test. For HIV-1EnvCpG86-561 genomic RNA in Control cell lysates, the GFP verses KHNYN-1 and KHNYN-2 p-values are 2.14 × 10⁻² and 2.30 × 10⁻², respectively. For HIV-1EnvCpG86-561 genomic RNA in ZAP-G1 cell lysates, the GFP verses KHNYN-1 and KHNYN-2 p-values are 1.01 × 10⁻¹ and 4.33 × 10⁻², respectively. For HIV-1EnvCpG86-561 genomic RNA in Control cell media, p-values for GFP verses KHNYN-1 and KHNYN-2 are 8.97 × 10⁻⁴ and 9.38 × 10⁻⁴, respectively. For HIV-1EnvCpG86-561 genomic RNA in ZAP-G1 cell media, p-values for GFP verses KHNYN-1 and KHNYN-2 are 6.09 × 10⁻¹ and 1.87 × 10⁻¹, respectively.
Figure 5
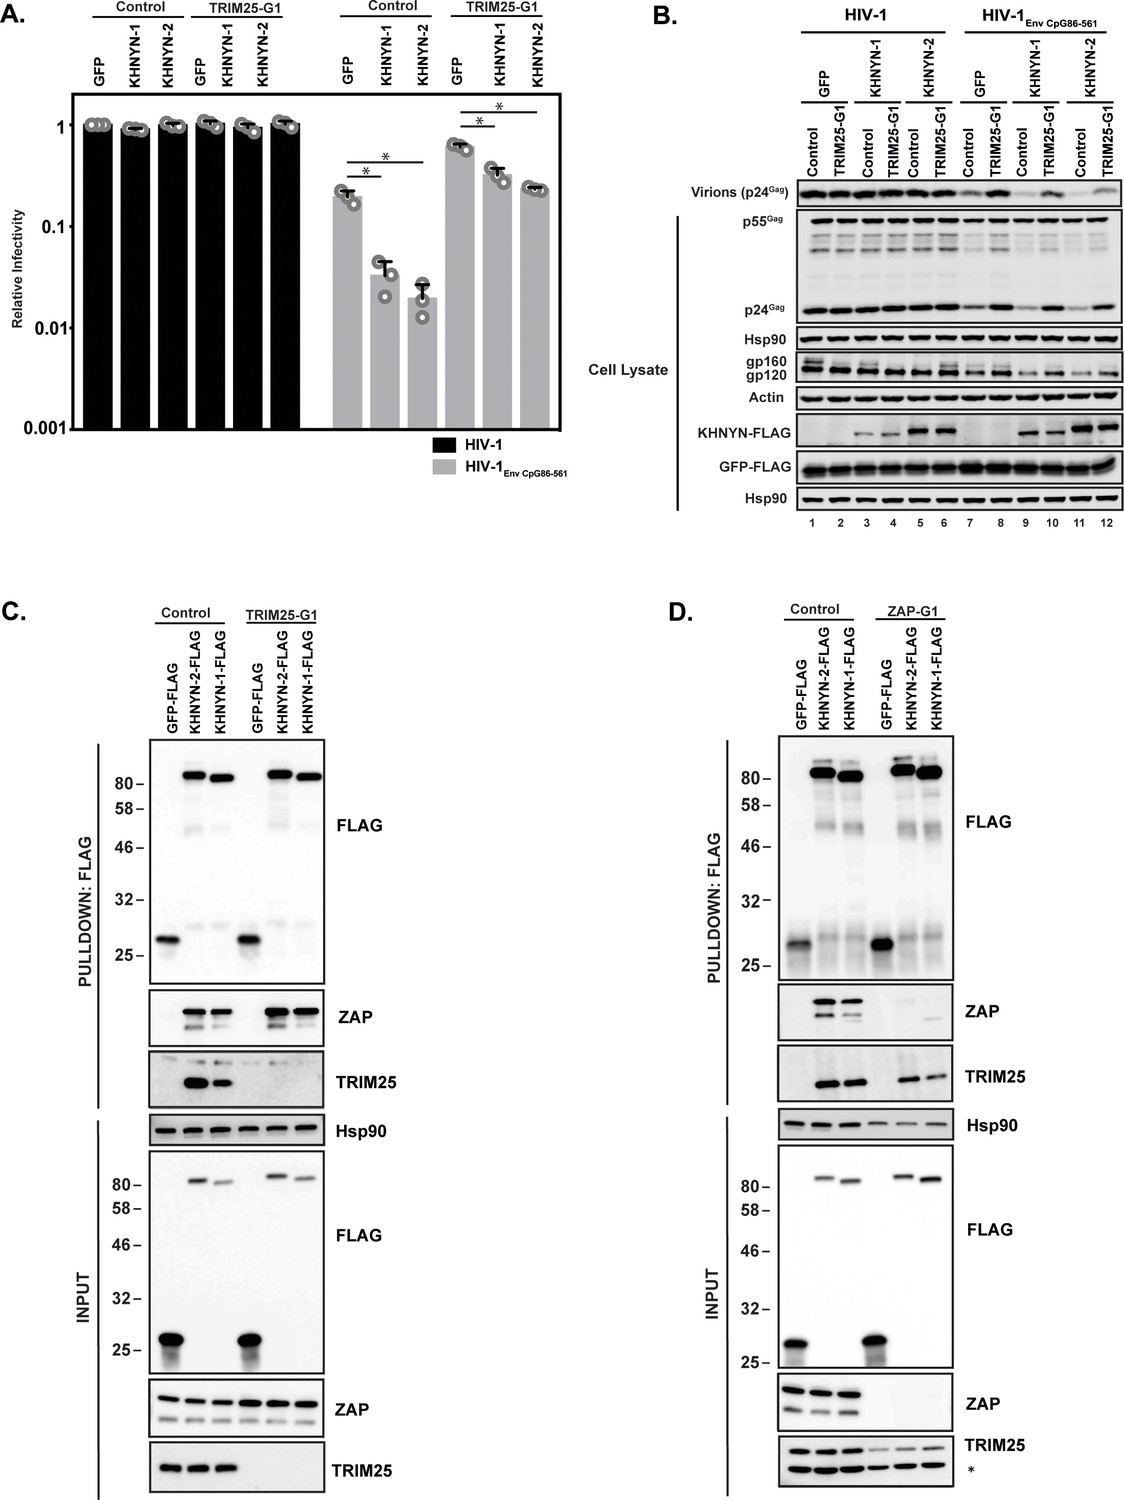
TRIM25 is required for KHNYN to inhibit HIV-1 with clustered CpG dinucleotides.
(A–B) HeLa Control CRISPR cells or TRIM25-G1 CRISPR cells were transfected with 500 ng pHIV-1 or pHIV-1EnvCpG86-561 and 500 ng of pGFP-FLAG or 62.5 ng pKHNYN-1-FLAG or pKHNYN-2-FLAG plus 437.5 ng of pGFP-FLAG. Culture supernatants from the cells were used to infect TZM-bl reporter cells (A). The bar charts show the average value of three independent experiments normalized to the value obtained for HeLa Control CRISPR cells co-transfected with pHIV-1 and pGFP-FLAG. Data are represented as mean ± SD. *p<0.05 as determined by a two-tailed unpaired t-test. p-values for GFP verses KHNYN-1 and KHNYN-2 for HIV-1EnvCpG86-561 in Control cells are 8.95 × 10⁻⁴ and 5.42 × 10⁻⁴, respectively. p-values for GFP verses KHNYN-1 and KHNYN-2 for HIV-1EnvCpG86-561 in TRIM25-G1 CRISPR cells are 1.78 × 10⁻³ and 1.01 × 10⁻⁴, respectively. Gag expression in the media as well as Gag, Hsp90, Env, Actin, KHNYN-FLAG and GFP-FLAG expression in the cell lysates was detected using quantitative immunoblotting (B). (C) Lysates of Control and TRIM25 CRISPR HEK293T cells transfected with pGFP-FLAG, pKHNYN-1-FLAG or pKHNYN-2-FLAG were immunoprecipitated with an anti-FLAG antibody. Post-nuclear supernatants and immunoprecipitation samples were analyzed by immunoblotting for HSP90, KHNYN-FLAG, TRIM25 and ZAP. The blots are representative of two independent experiments. (D) Lysates of Control and ZAP CRISPR HEK293T cells transfected with pGFP-FLAG, pKHNYN-1-FLAG or pKHNYN-2-FLAG were immunoprecipitated with an anti-FLAG antibody. Post-nuclear supernatants and immunoprecipitation samples were analyzed by immunoblotting for HSP90, KHNYN-FLAG, TRIM25 and ZAP. * indicates a non-specific band. The blots are representative of two independent experiments.
Figure 6 with 2 supplements
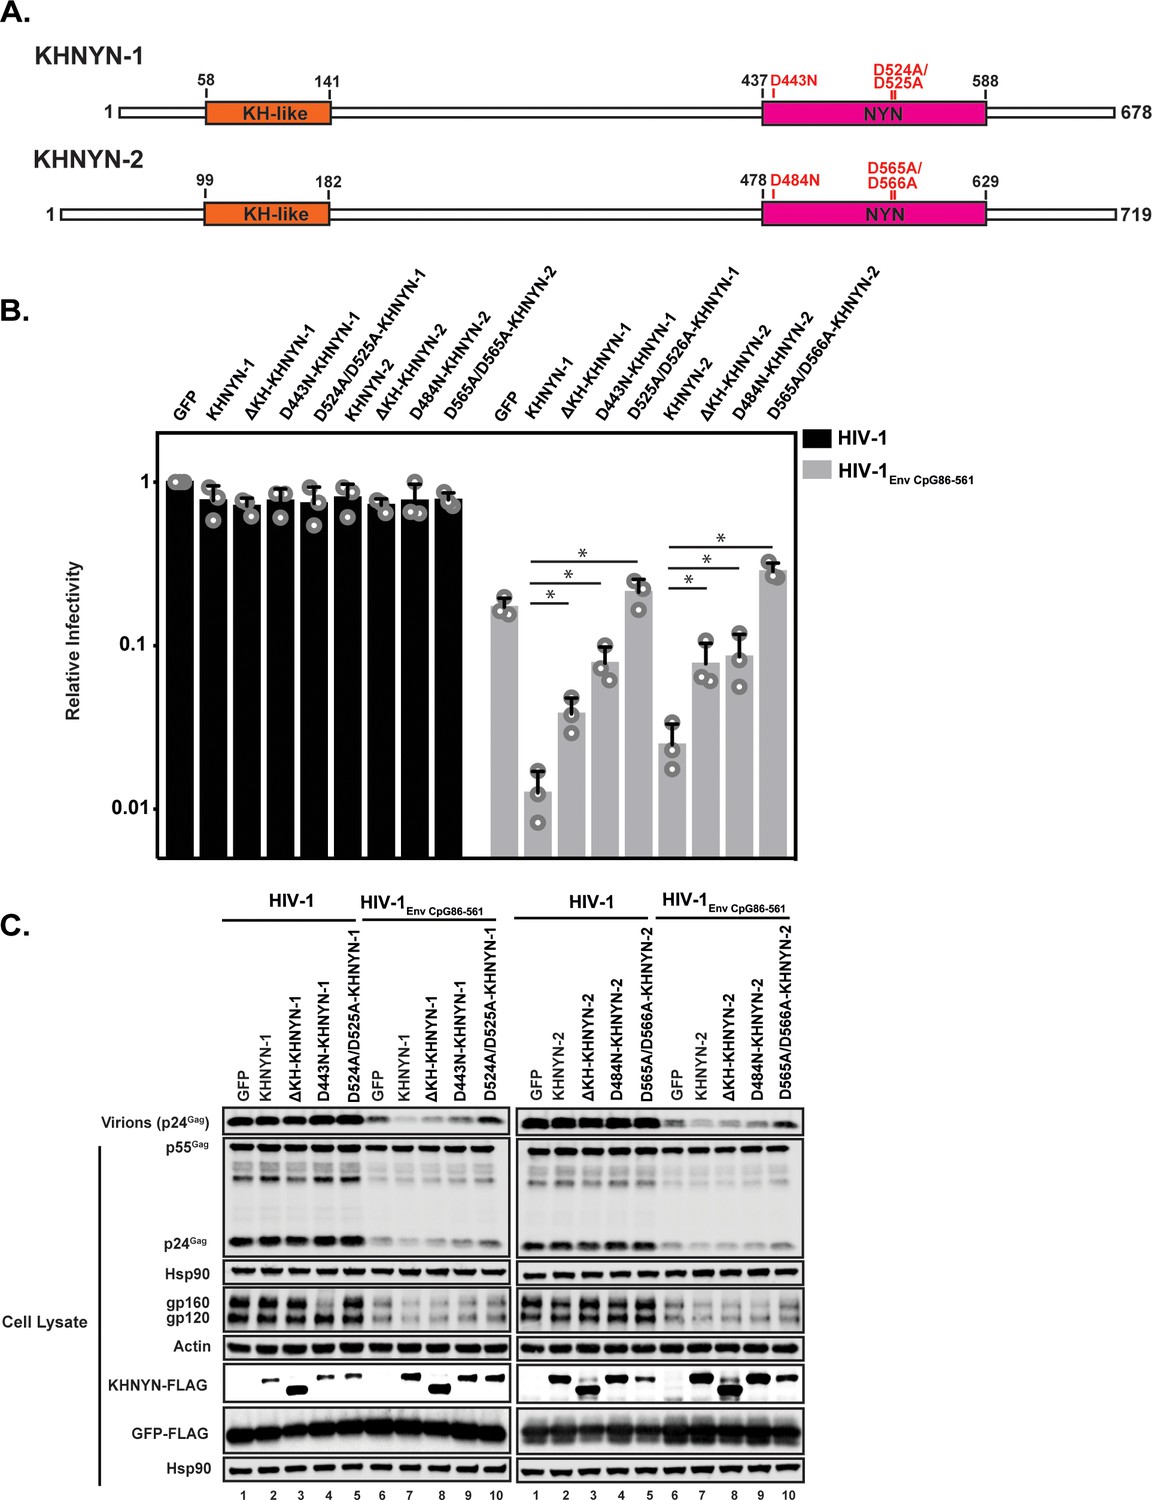
The KH and NYN domains are necessary for KHNYN antiviral activity.
(A) Schematic of KHNYN-1 and KHNYN-2 domains and mutations in the NYN domain. (B–C) HeLa cells were transfected with 500 ng pHIV-1 or pHIV-1EnvCpG86-561 and either 500 ng of pGFP-FLAG or 62.5 ng pKHNYN-1/2-FLAG and 437.5 ng of pGFP-FLAG. Culture supernatants were used to infect TZM-bl reporter cells to measure infectivity (B). The bar charts show the average values of three independent experiments normalized to the value obtained for HeLa cells co-transfected with pHIV-1 and pGFP-FLAG. Data are represented as mean ± SD. *p<0.05 as determined by a two-tailed unpaired t-test. p-values for KHNYN-1 versus ΔKH-KHNYN-1, D443N-KHNYN-1, and D524A/D525A-KHNYN-1 for HIV-1EnvCpG86-561 are 1.31 × 10⁻², 5.22 × 10⁻³, and 1.26 × 10⁻³, respectively. p-values for KHNYN-2 versus ΔKH-KHNYN-2, D443N-KHNYN-2, and D524A/D525A-KHNYN-2 for HIV-1EnvCpG86-561 are 2.88 × 10⁻², 3.26 × 10⁻², and 2.56 × 10⁻⁴, respectively. Gag expression in the media as well as Gag, Hsp90, Env, Actin, KHNYN-1/2-FLAG and GFP-FLAG expression in the cell lysates was detected using quantitative immunoblotting (C). See also Figure 6—figure supplements 1 and 2.
Figure 6—figure supplement 1
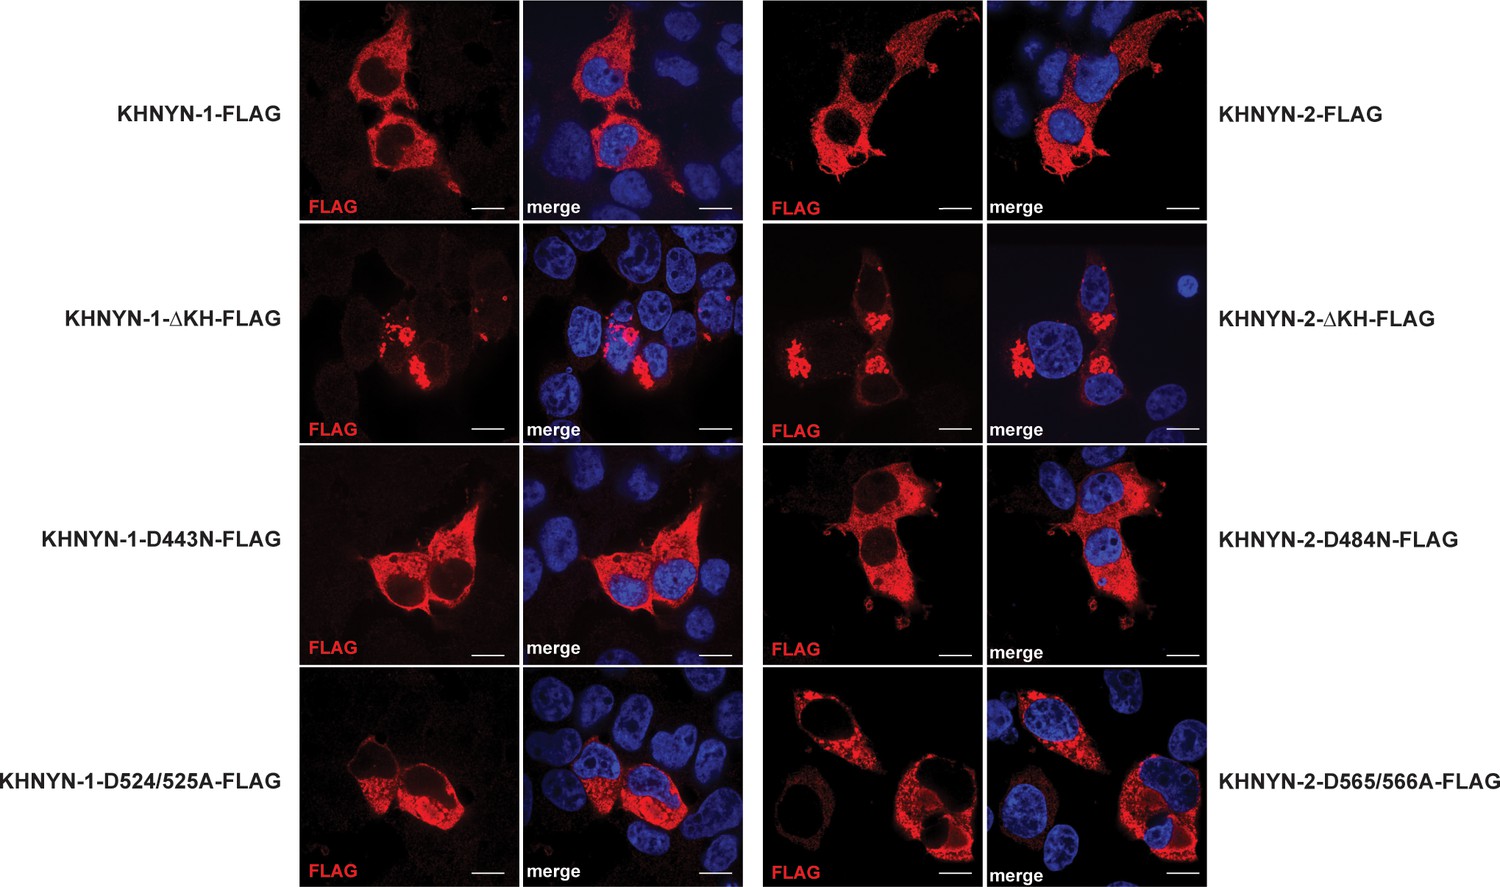
KHNYN mutant proteins localize to the cytoplasm.
Panels show representative fields for the localization of KHNYN-1/2-FLAG wild type or mutant proteins in 293T Control CRISPR cells. Cells were stained with an anti-FLAG antibody (red) and DAPI (blue). The scale bar represents 10 µm.
Figure 6—figure supplement 2
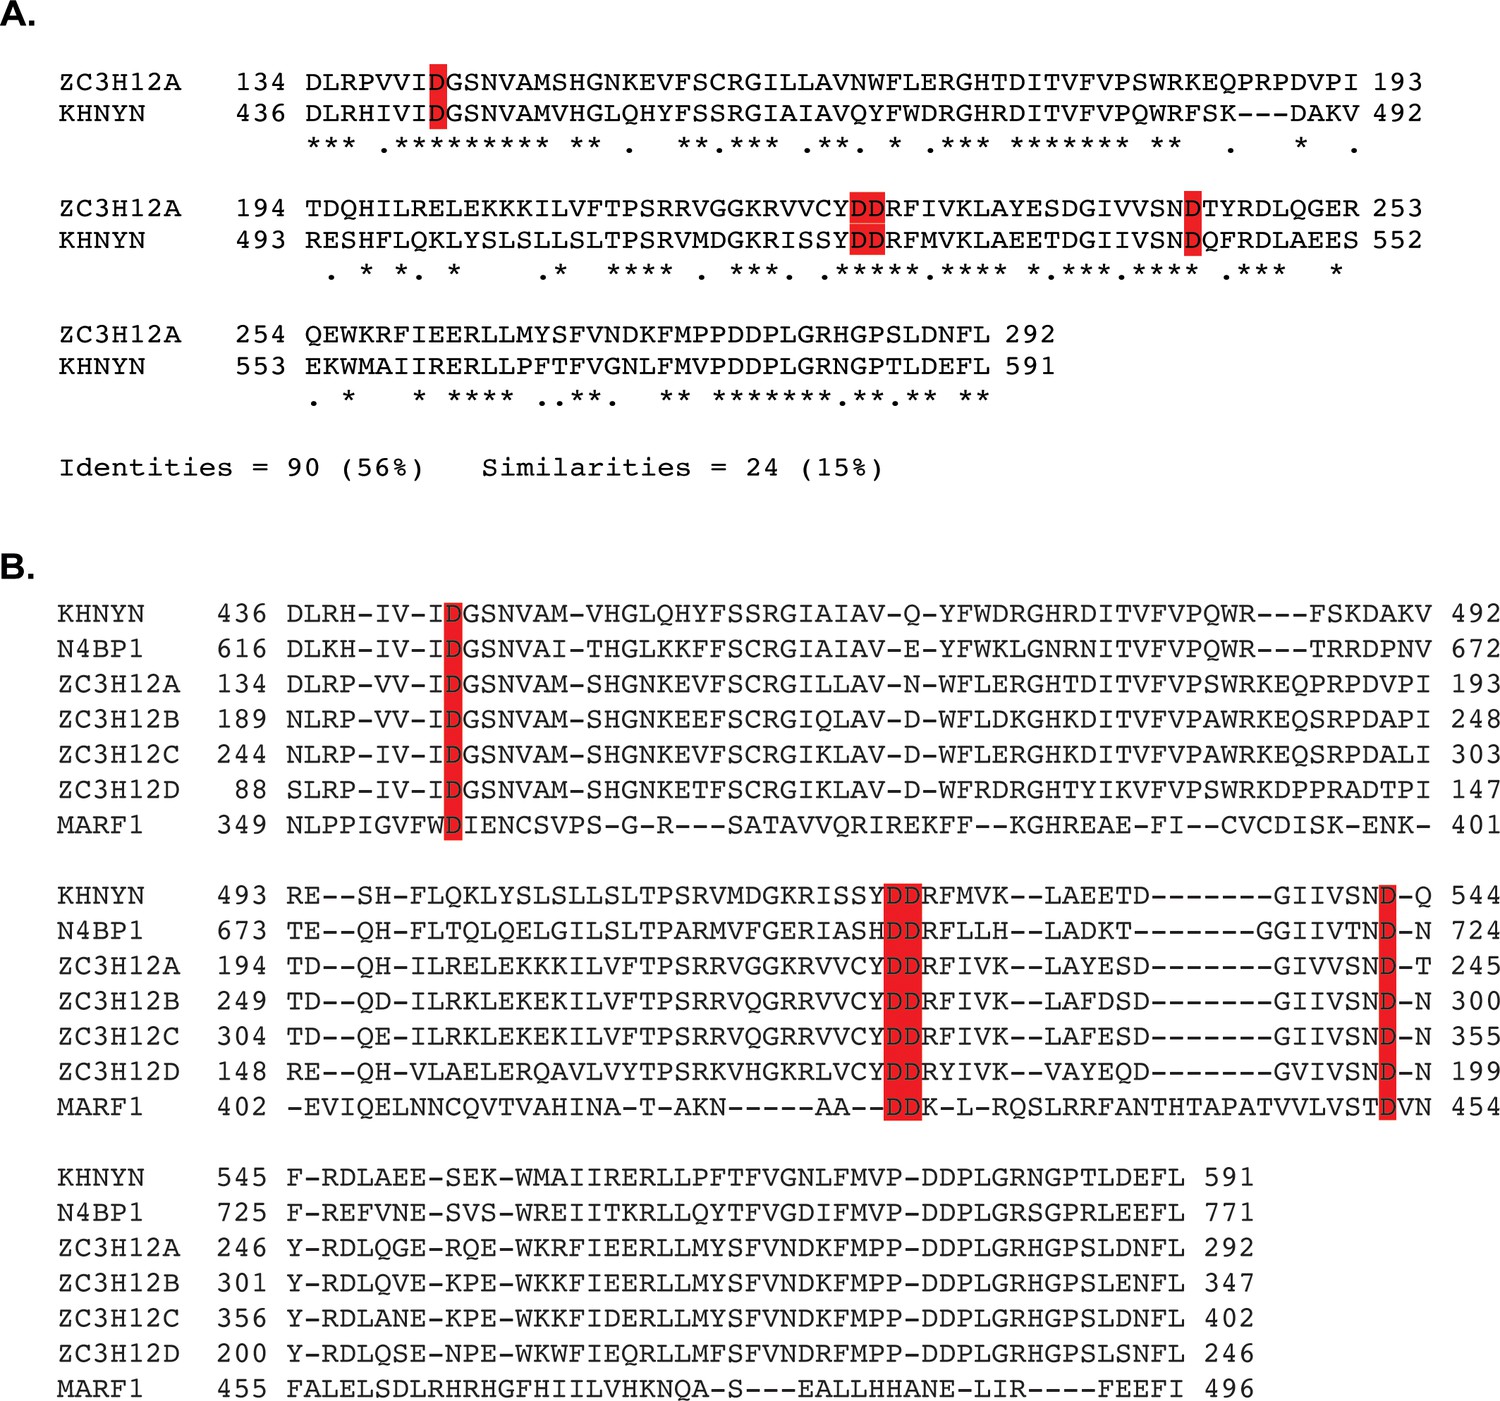
NYN domain alignment.
(A) MacVector ClustalW alignment of the NYN domains from KHNYN and ZC3H12A. The amino acid identity and similarity is shown. The four aspartic acid residues that coordinate the magnesium ion in the active site are highlighted in red. (B) MacVector ClustalW alignment of NYN domains from KHNYN, N4BP1, ZC3H12A, ZC3H12B, ZC3H12C, ZC3H12D and MARF1. The four aspartic acid residues that coordinate the magnesium ion in the active site are highlighted in red.
Figure 7 with 3 supplements
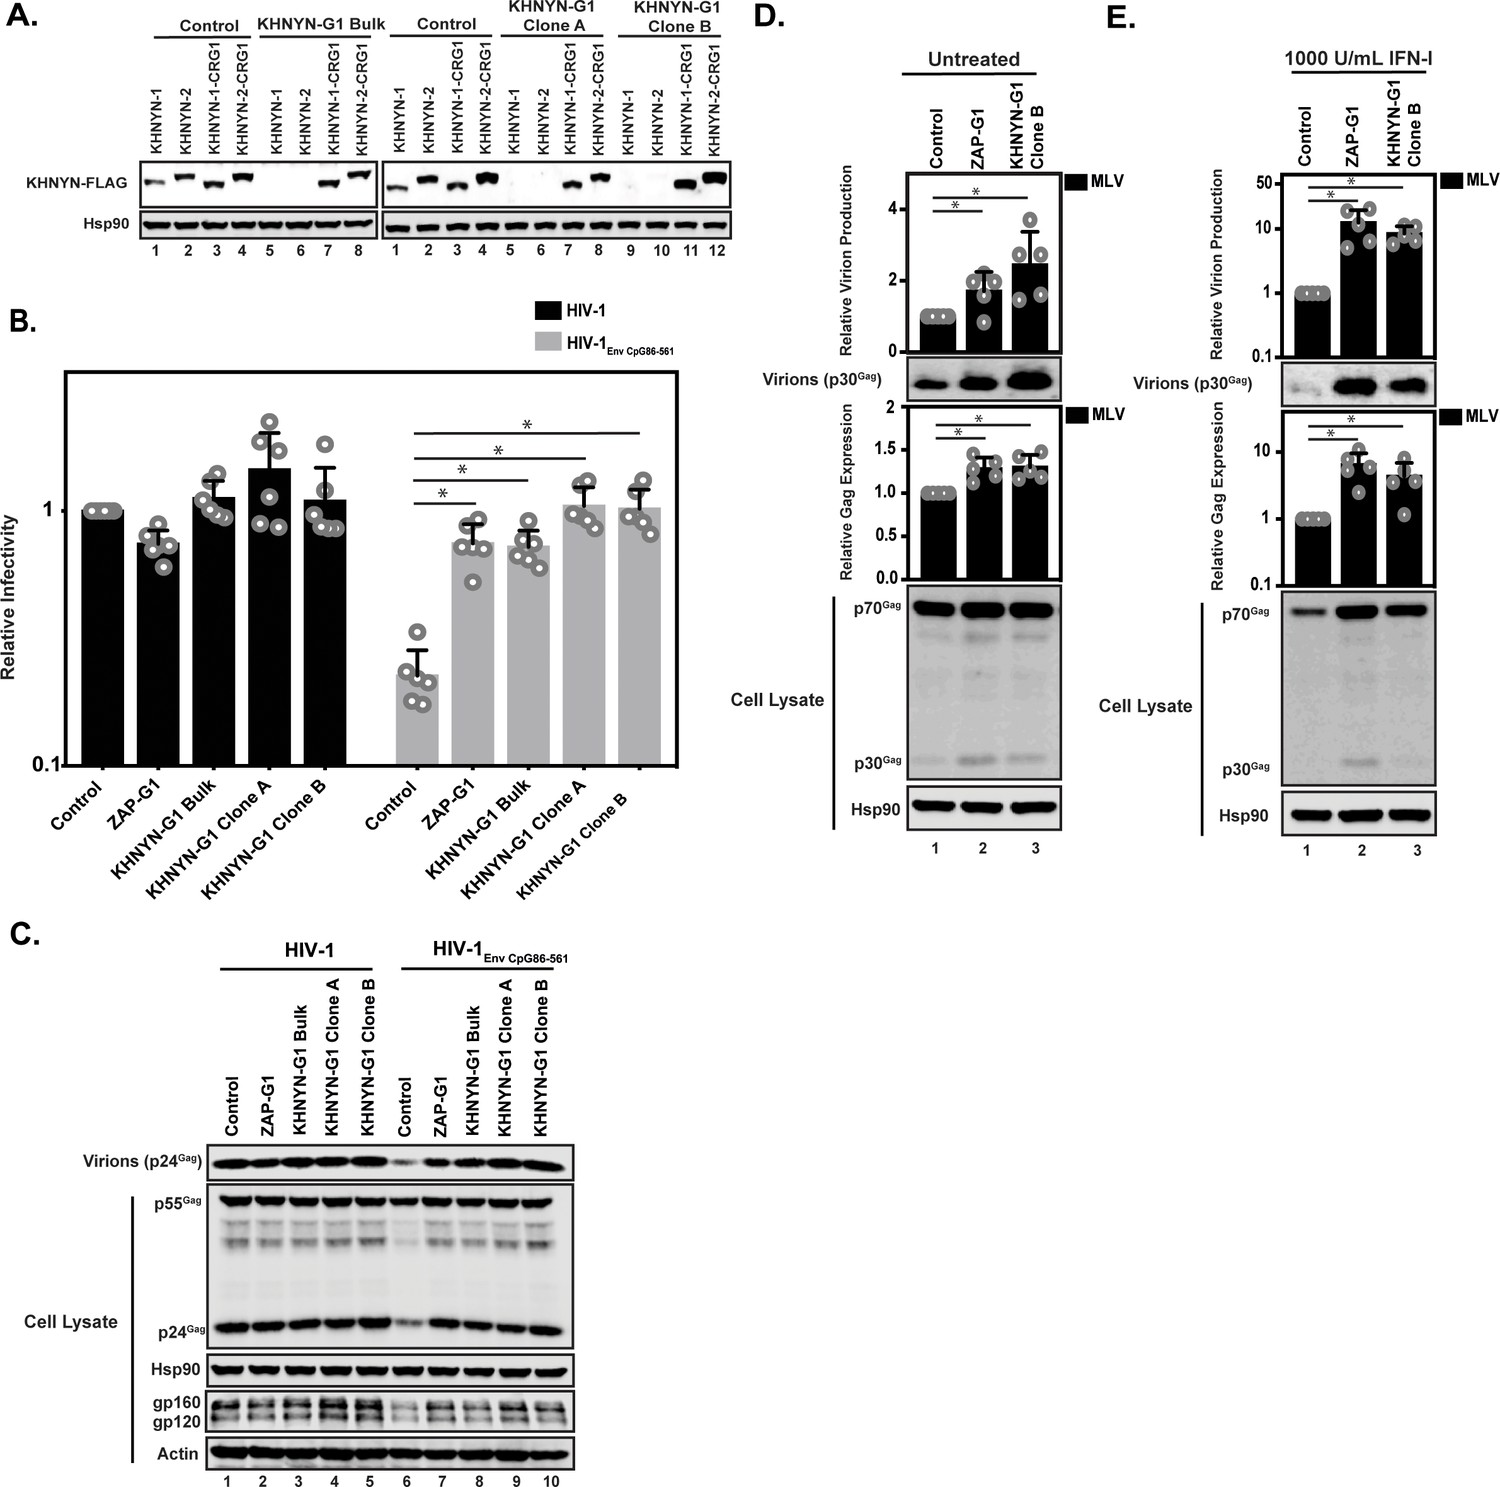
KHNYN depletion increases infectious virus production for HIV-1 with clustered CpG dinucleotides and MLV Gag expression.
(A) 100 ng pKHNYN-1-FLAG, pKHNYN-2-FLAG, pKHNYN-1-FLAG with a mutation in the PAM that prevents it from being targeted by KHNYN guide 1 (pKHNYN-1-CRG1-FLAG) or pKHNYN-2-CRG1-FLAG plus 400 ng of pGFP were transfected into HeLa Control CRISPR cells, KHNYN guide 1 (KHNYN-G1) CRISPR bulk cells or KHNYN-G1 CRISPR single cell clones A and B. KHNYN-FLAG abundance was measured by quantitative western blotting. (B–C) HeLa Control CRISPR cells, ZAP-G1 CRISPR cells, KHNYN guide 1 (KHNYN-G1) CRISPR bulk cell population or single cell clones A and B were transfected with 500 ng pHIV-1 or pHIV-1EnvCpG86-561 and 500 ng pGFP. Culture supernatants were used to infect TZM-bl reporter cells to measure infectivity (B). The bar charts show the average value of six independent experiments normalized to the value obtained for HeLa Control CRISPR cells co-transfected with pHIV-1 and pGFP. Data are represented as mean ± SD. *p<0.05 as determined by a two-tailed unpaired t-test. p-values for HIV-1EnvCpG86-561 in Control cells versus ZAP-G1, KHNYN-G1 Bulk, KHNYN-G1 Clone A, and KHNYN-G1 Clone B CRISPR cells are 8.23 × 10⁻⁶, 2.81 × 10⁻⁶, 1.60 × 10⁻⁶, and 2.24 × 10⁻⁶, respectively. Gag expression in the media as well as Gag, Hsp90, Env, and Actin expression in the cell lysates was detected using quantitative immunoblotting (C). (D–E) HeLa Control CRISPR cells, ZAP-G1 CRISPR cells and KHNYN G1 CRISPR clone B were transfected with 650 ng pMLV, 250ng p2.87 Vpu and 100 ng pGFP. Gag expression in the media (D) as well as Gag and Hsp90 expression in the cell lysates (E) was detected using quantitative immunoblotting. The bar charts show the average value of five independent experiments normalized to the value obtained for HeLa Control CRISPR cells. Data are represented as mean ± SD. *p<0.05 as determined by a two-tailed unpaired t-test. p-values for virions from Control cells versus ZAP-G1 and KHNYN-G1 Clone B CRISPR cells without type I IFN are 1.28 × 10⁻³ and 1.50 × 10⁻³, respectively, and 4.17 × 10⁻³ and 1.92 × 10⁻² with type I IFN treatment. p-values for the cell lysates from Control cells versus ZAP-G1 and KHNYN-G1 Clone B CRISPR cells are 1.78 × 10⁻² and 8.01 × 10⁻³ without type I interferon, respectively, and 6.37 × 10⁻² and 1.73 × 10⁻⁴ with type I interferon treatment.
Figure 7—figure supplement 1
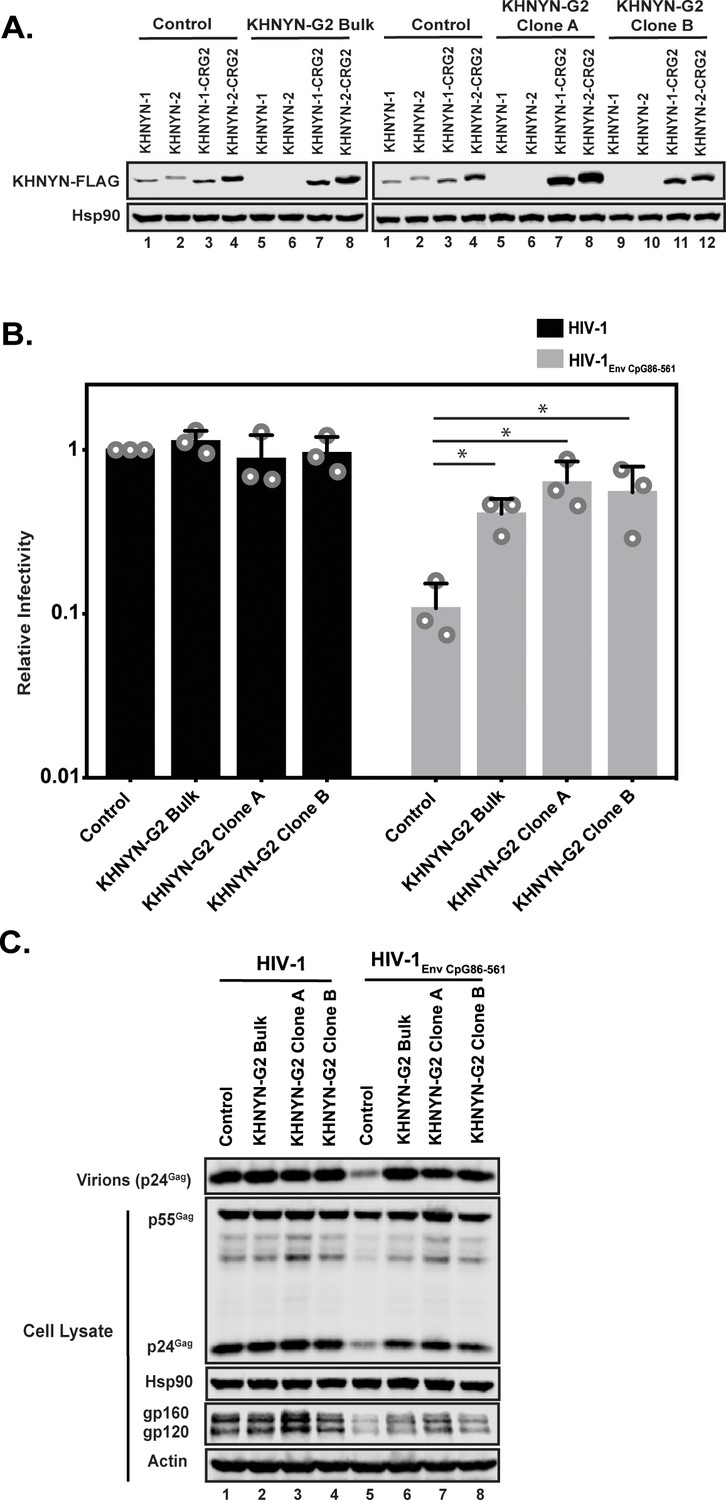
KHNYN is necessary for CpG dinucleotides to inhibit HIV-1 infectious virus production.
(A) 100 ng pKHNYN-1-FLAG, pKHNYN-2-FLAG, pKHNYN-1-FLAG with a mutation in the PAM that prevents it from being targeted by KHNYN guide 2 (pKHNYN-1-CRG2-FLAG) or pKHNYN-2-CRG2-FLAG plus 400 ng pGFP were transfected into HeLa Control CRISPR cells, KHNYN guide 2 (KHNYN-G2) CRISPR bulk cells or KHNYN-G2 CRISPR single cell clones A and B. KHNYN-FLAG abundance was measured by quantitative immunoblotting. (B–C) HeLa Control CRISPR cells, KHNYN-G2 CRISPR bulk cells or KHNYN-G2 CRISPR single cell clones A and B were transfected with 500 ng pHIV-1 or pHIV-1EnvCpG86-561 and 500 ng pGFP. Culture supernatants were used to infect TZM-bl reporter cells to measure infectivity (B). The bar charts show the average value of three independent experiments normalized to the value obtained for HeLa Control CRISPR cells co-transfected with pHIV-1 and pGFP. Data are represented as mean ± SD. *p<0.05 as determined by two-tailed unpaired t-test. p-values for HIV-1EnvCpG86-561 in Control cells versus KHNYN-G2 Bulk, KHNYN-G2 Clone A, and KHNYN-G2 Clone B CRISPR cells are 7.98 × 10⁻³, 1.49 × 10⁻², and 3.44 × 10⁻², respectively. Gag expression in the media as well as Gag, Hsp90, Env, and Actin expression in the cell lysates was detected using quantitative immunoblotting (C).
Figure 7—figure supplement 2
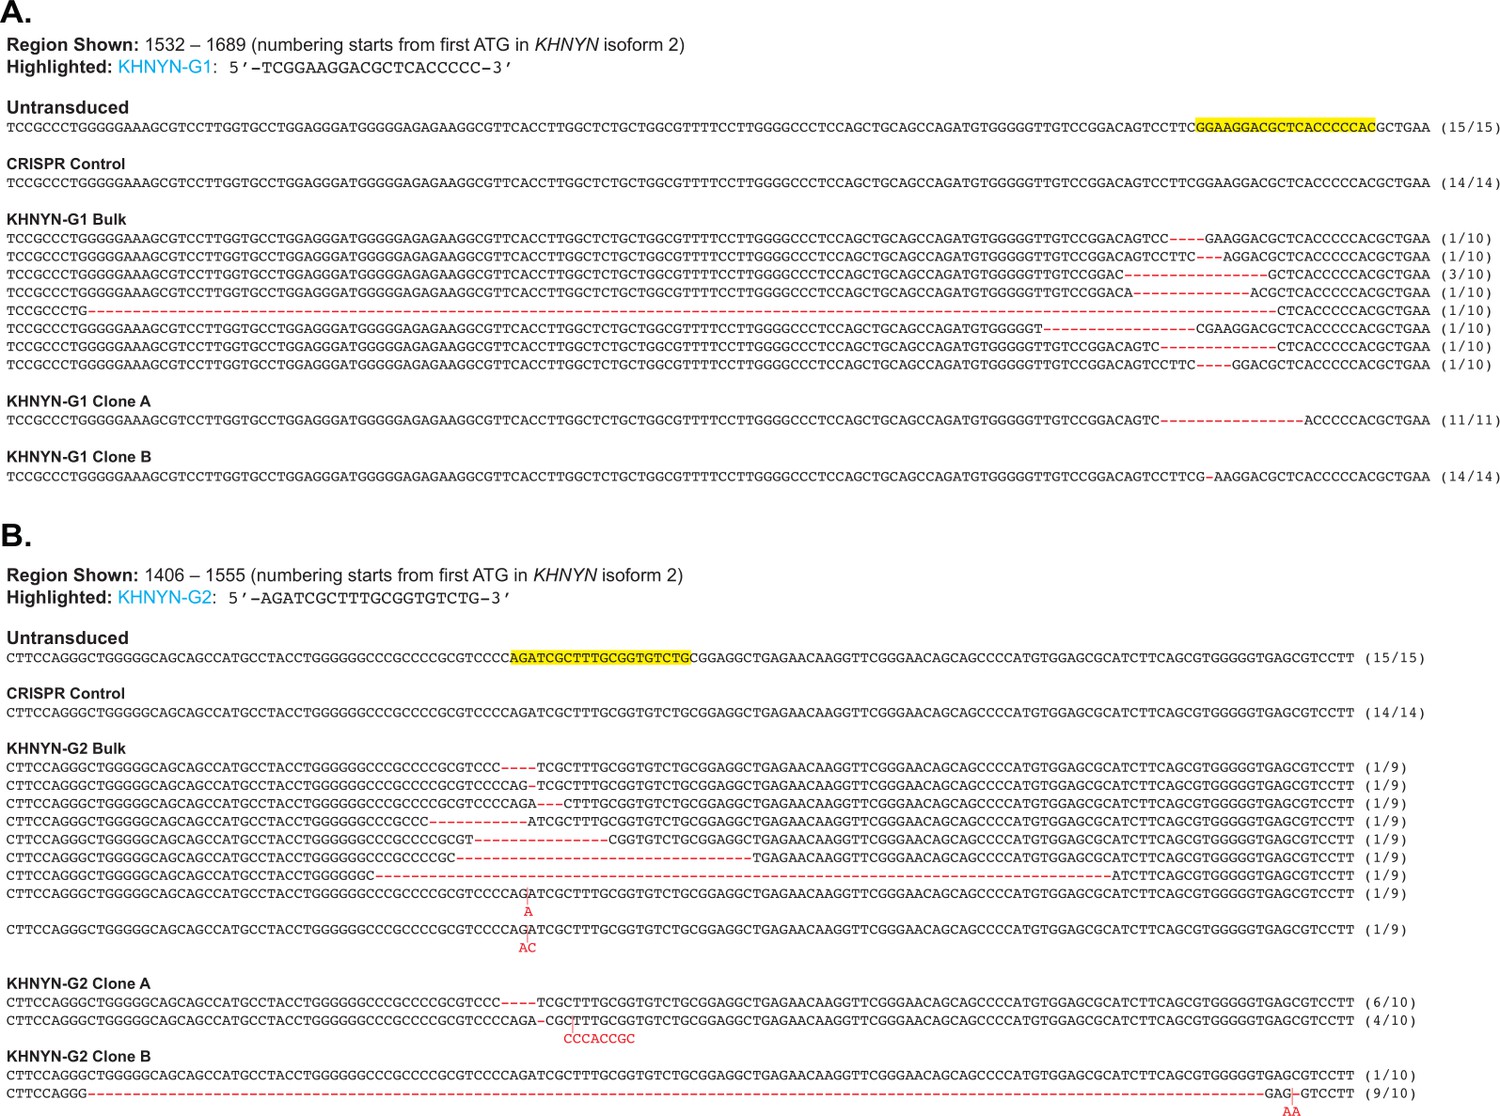
CRISPR-Cas9-induced mutations in KHNYN.
(A–B) The nucleotide sequence surrounding the guide RNA sequence for KHNYN guide 1 (A) and KHNYN guide 2 (B). The sequence in the parental cells not transduced with lentiCRISPRv2 (untransduced) as well as lentiCRISPRv2 expressing a guide RNA targeting luciferase (Control), the bulk population of cells expressing either KHNYN guide 1 or guide 2 as well as two single-cell clones from each bulk population. The numbers to the right of each sequence represent the frequency that the sequence was identified in the total number of sequences for the specific cell line.
Figure 7—figure supplement 3
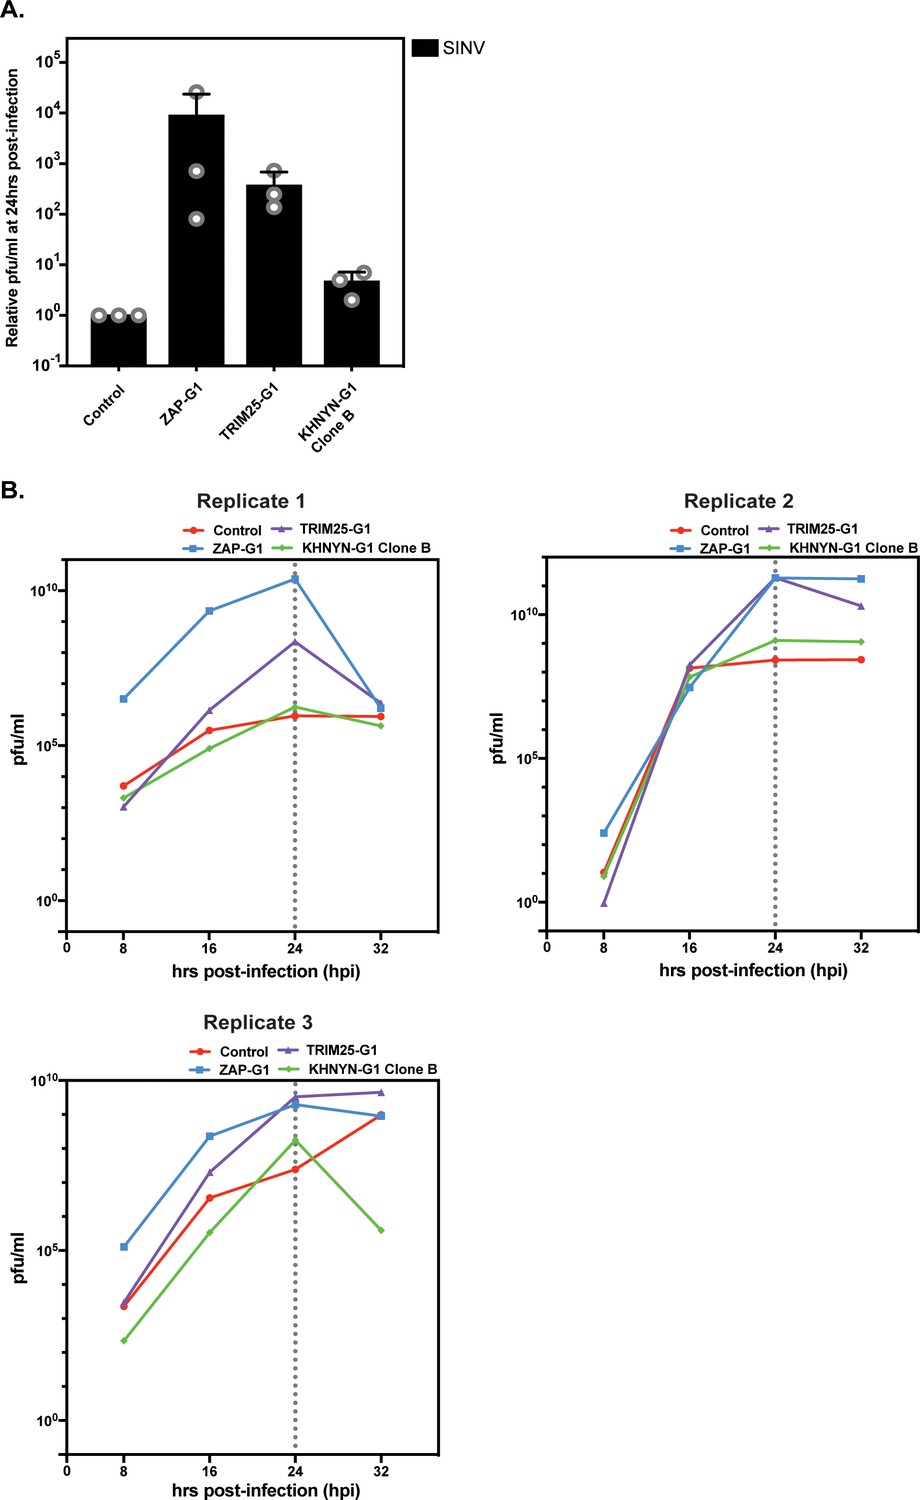
KHNYN depletion does not substantially increase Sindbis virus replication.
(A–B) HeLa Control CRISPR cells, ZAP-G1 CRISPR cells, TRIM25 CRISPR cells and KHNYN-G1 CRISPR clone B were infected with Sindbis virus and the amount of infectious virus was measured in the cell supernatants 8, 16, 24 and 32 hr post-infection. (A) The relative amount of infectious virus at 24 hr. The bar chart shows the average value of three independent experiments normalized to the value obtained for HeLa Control CRISPR cells. Data are represented as mean ± SD. (B) The three independent Sindbis virus replication curves.
Figure 8
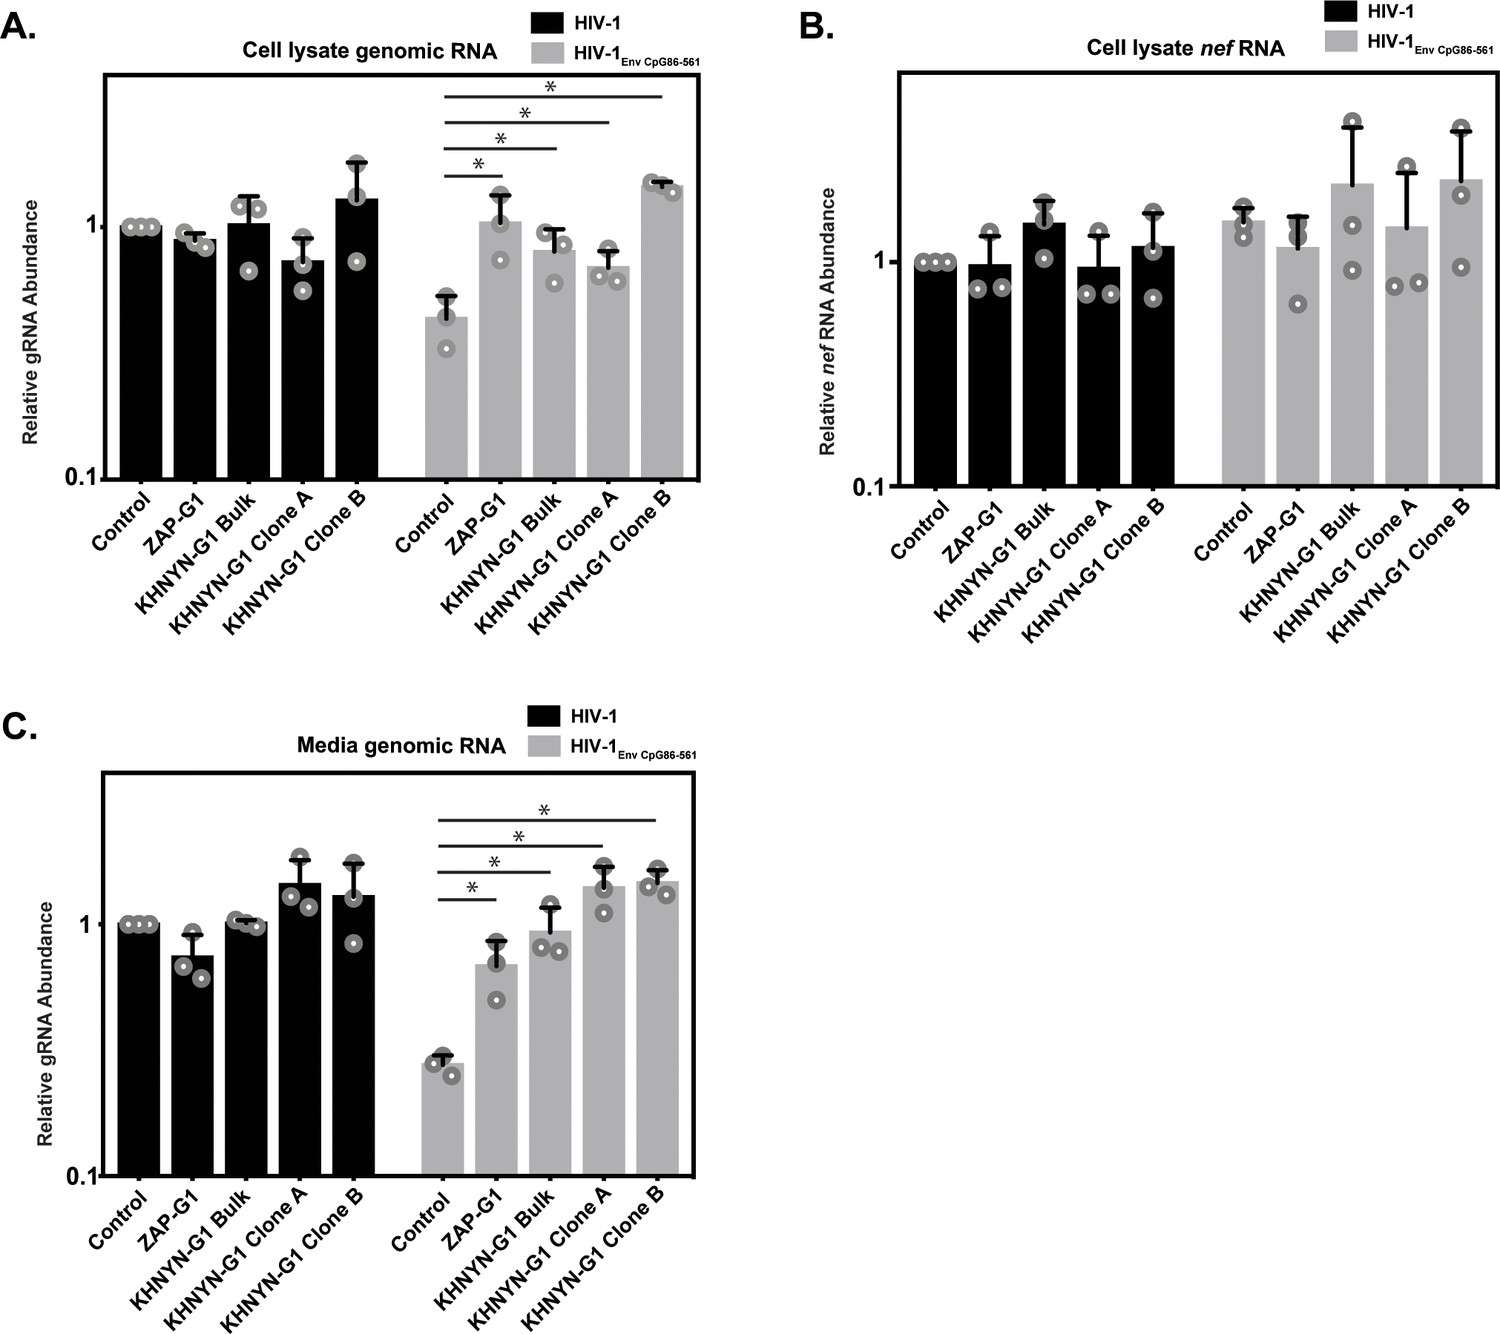
KHNYN is necessary for CpG dinucleotides to inhibit HIV-1 genomic RNA expression.
(A–C) HeLa Control CRISPR cells, ZAP-G1 CRISPR cells, KHNYN-G1 CRISPR bulk cells or two independent clones were transfected with 500 ng pHIV-1 or pHIV-1EnvCpG86-561 and 500 ng pGFP-FLAG. RNA was extracted from cell lysates (A–B) and media (C). Genomic RNA (gRNA) (A, C) or nef mRNA (B) abundance was quantified by qRT-PCR. The bar charts show the average value of three independent experiments normalized to the value obtained for HeLa Control CRISPR cells co-transfected with pHIV-1 and pGFP-FLAG. Data are represented as mean ± SD. *p<0.05 as determined by a two-tailed unpaired t-test. p-values for HIV-1EnvCpG86-561 genomic RNA in Control cell versus ZAP-G1, KHNYN-G1 Bulk, KHNYN-G1 Clone A, and KHNYN-G1 Clone B CRISPR cell lysates are 2.98 × 10⁻², 3.70 × 10⁻², 4.26 × 10⁻², and 1.30 × 10⁻⁴, respectively. p-Values for HIV-1EnvCpG86-561nef mRNA in Control cell versus ZAP-G1, KHNYN-G1 Bulk, KHNYN-G1 Clone A, and KHNYN-G1 Clone B CRISPR cell lysates are 0.29, 0.54, 0.90 and 0.42, respectively. p-Values for HIV-1EnvCpG86-561 genomic RNA in Control cell versus ZAP-G1, KHNYN-G1 Bulk, KHNYN-G1 Clone A, and KHNYN-G1 Clone B CRISPR cell media are 1.65 × 10⁻², 8.64 × 10⁻³, 2.82 × 10⁻³, and 3.54 × 10⁻⁴, respectively.
Figure 9
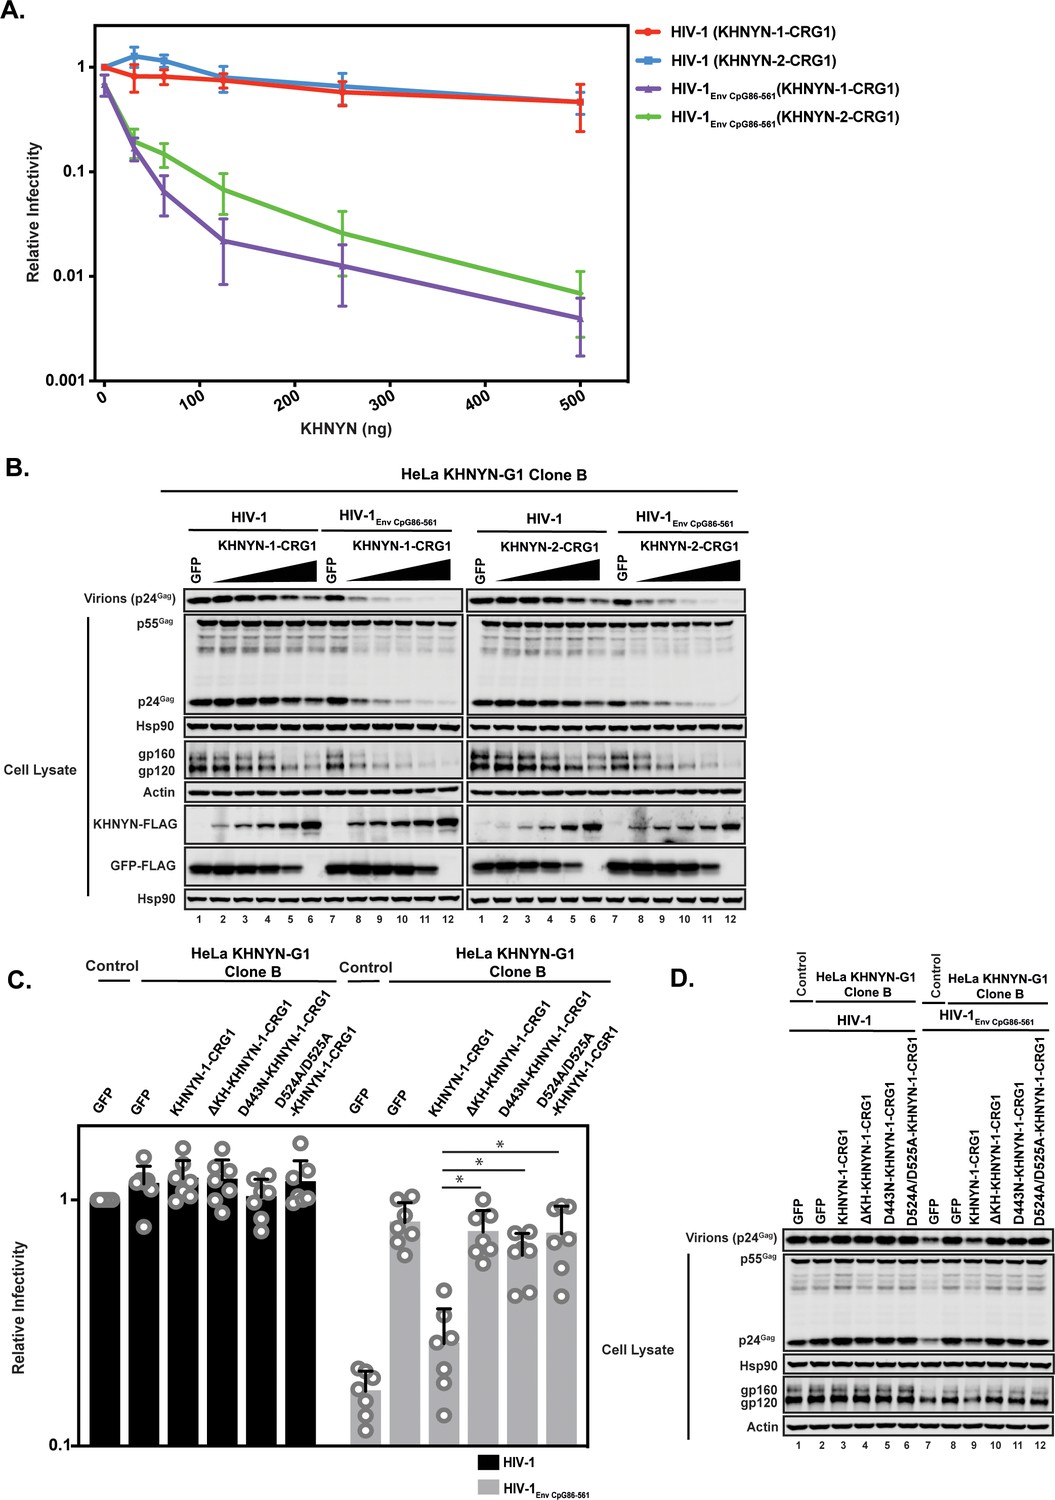
Deletion of the KH-like domain or mutations in the NYN domain in KHNYN prevent reconstitution of CpG-dependent inhibition of HIV-1 infectious virus production in KHNYN CRISPR cells.
(A–B) HeLa KHNYN-G1 CRISPR clone B cells were transfected with 500 ng pHIV-1 or pHIV-1EnvCpG86-561 and 500 ng of pGFP-FLAG or 31.25 ng, 62.5 ng, 125 ng, 250 ng or 500 ng of pKHNYN-1-CRG1-FLAG or pKHNYN-2-CRG1-FLAG plus the amount of pGFP-FLAG required to make 500 ng total. Culture supernatants from the cells were used to infect TZM-bl reporter cells (A). Each point shows the average value of three independent experiments normalized to the value obtained for HeLa Control CRISPR cells co-transfected with pHIV-1 and pGFP. Data are represented as mean ± SD. Gag expression in the media as well as Gag, Hsp90, Env, Actin, KHNYN-FLAG and GFP-FLAG expression in the cell lysates was detected using quantitative immunoblotting (B). (C–D) HeLa KHNYN-G1 CRISPR clone B cells were transfected with 500 ng pHIV-1 or pHIV-1EnvCpG86-561, 468.75 ng of pGFP-FLAG and 31.25 ng of pKHNYN-1-CRG1-FLAG expressing either wild-type or mutant proteins. Culture supernatants from the cells were used to infect TZM-bl reporter cells (C). Each point shows the average value of seven independent experiments normalized to the value obtained for HeLa Control CRISPR cells co-transfected with pHIV-1 and pGFP. Data are represented as mean ± SD. *p<0.05 as determined by a two-tailed unpaired t-test. p-Values for HIV-1EnvCpG86-561 with KHNYN-1-CRG1 versus ΔKH-KHNYN-1-CGR1, D443N-KHNYN-1-CGR1 and D524A/D525A-KHNYN-1-CGR1 are 2.56 × 10⁻⁵, 1.95 × 10⁻⁴, and 2.12 × 10⁻⁴, respectively. Gag expression in the media as well as Gag, Hsp90, Env, Actin, KHNYN-FLAG and GFP-FLAG expression in the cell lysates was detected using quantitative immunoblotting (D).
Additional files
-
Supplementary file 1
Key resources table.
- https://doi.org/10.7554/eLife.46767.018
-
Transparent reporting form
- https://doi.org/10.7554/eLife.46767.019
Download links
A two-part list of links to download the article, or parts of the article, in various formats.
Downloads (link to download the article as PDF)
Open citations (links to open the citations from this article in various online reference manager services)
Cite this article (links to download the citations from this article in formats compatible with various reference manager tools)
KHNYN is essential for the zinc finger antiviral protein (ZAP) to restrict HIV-1 containing clustered CpG dinucleotides
eLife 8:e46767.
https://doi.org/10.7554/eLife.46767


