Inhibition of synucleinopathic seeding by rationally designed inhibitors
- Howard Hughes Medical Institute, University of California, Los Angeles, United States
- University of California, Los Angeles, United States
- MRC Laboratory of Molecular Biology, United Kingdom
- David Geffen School of Medicine, University of California, Los Angeles, United States
Figures
Figure 1
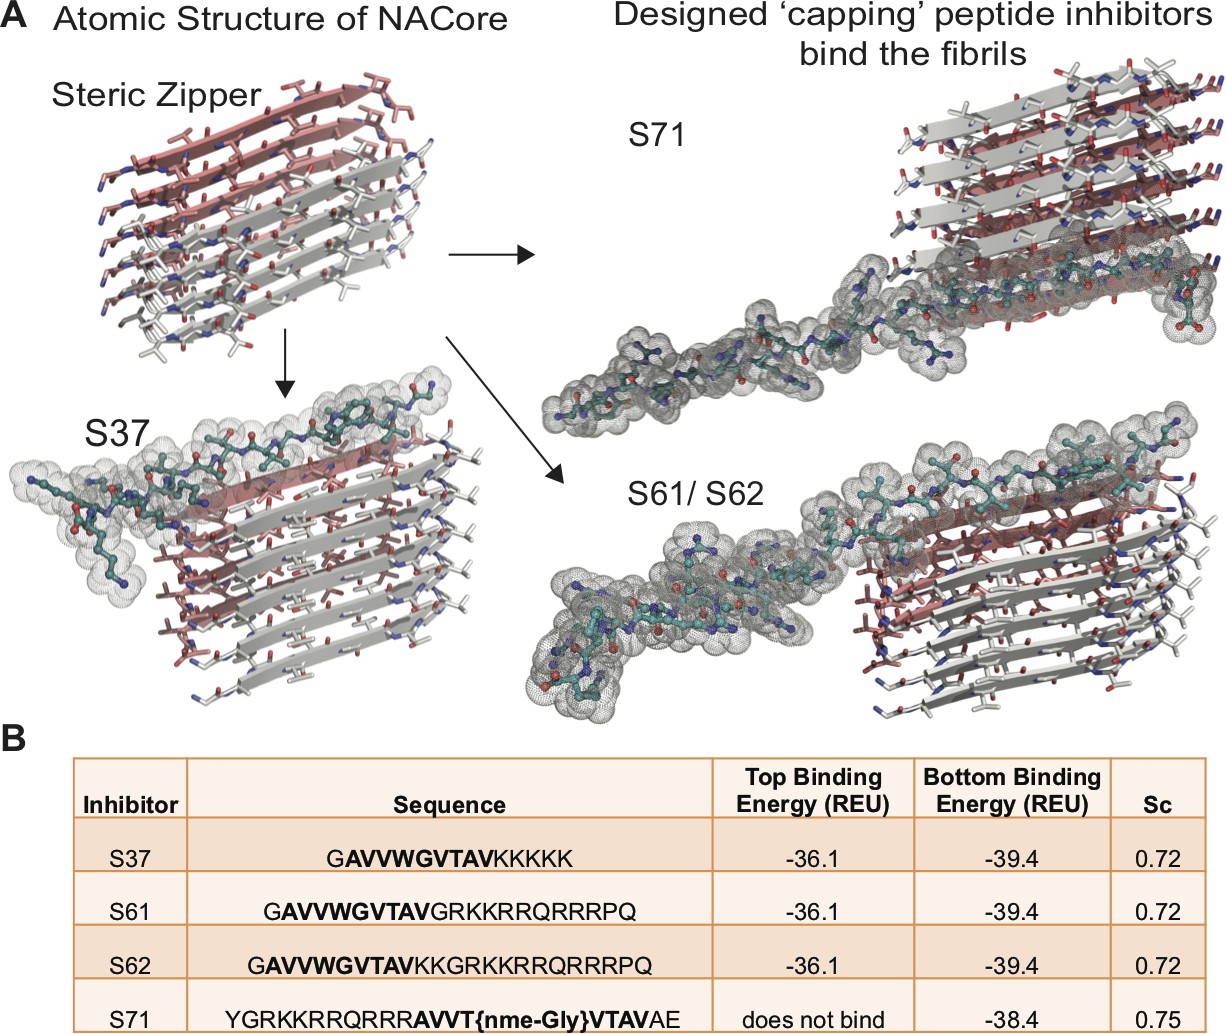
Design of α-syn seeding inhibitors.
(A) Structure-based design of α-syn aggregation inhibitors. The NACore protofilament is a dual β-sheet homo-steric zipper (upper left) (PDB ID: 4RIL). The inhibitors (cyan) cap the protofilament at one or both ends. S37, S61 and S62 are shown here to bind to the end with lower binding energy and S71 is shown to bind the only end to which it is predicted to bind. (B) Binding energies (REU, Rosetta energy units) of the four inhibitors calculated by Rosetta suggest that S37, S61 and S62 bind to both top and bottom interfaces whereas S71 is predicted to bind only to the bottom of the protofilament. Shape complementarities (Sc) of all four inhibitors with the end of the protofilament are high.
Figure 2 with 2 supplements
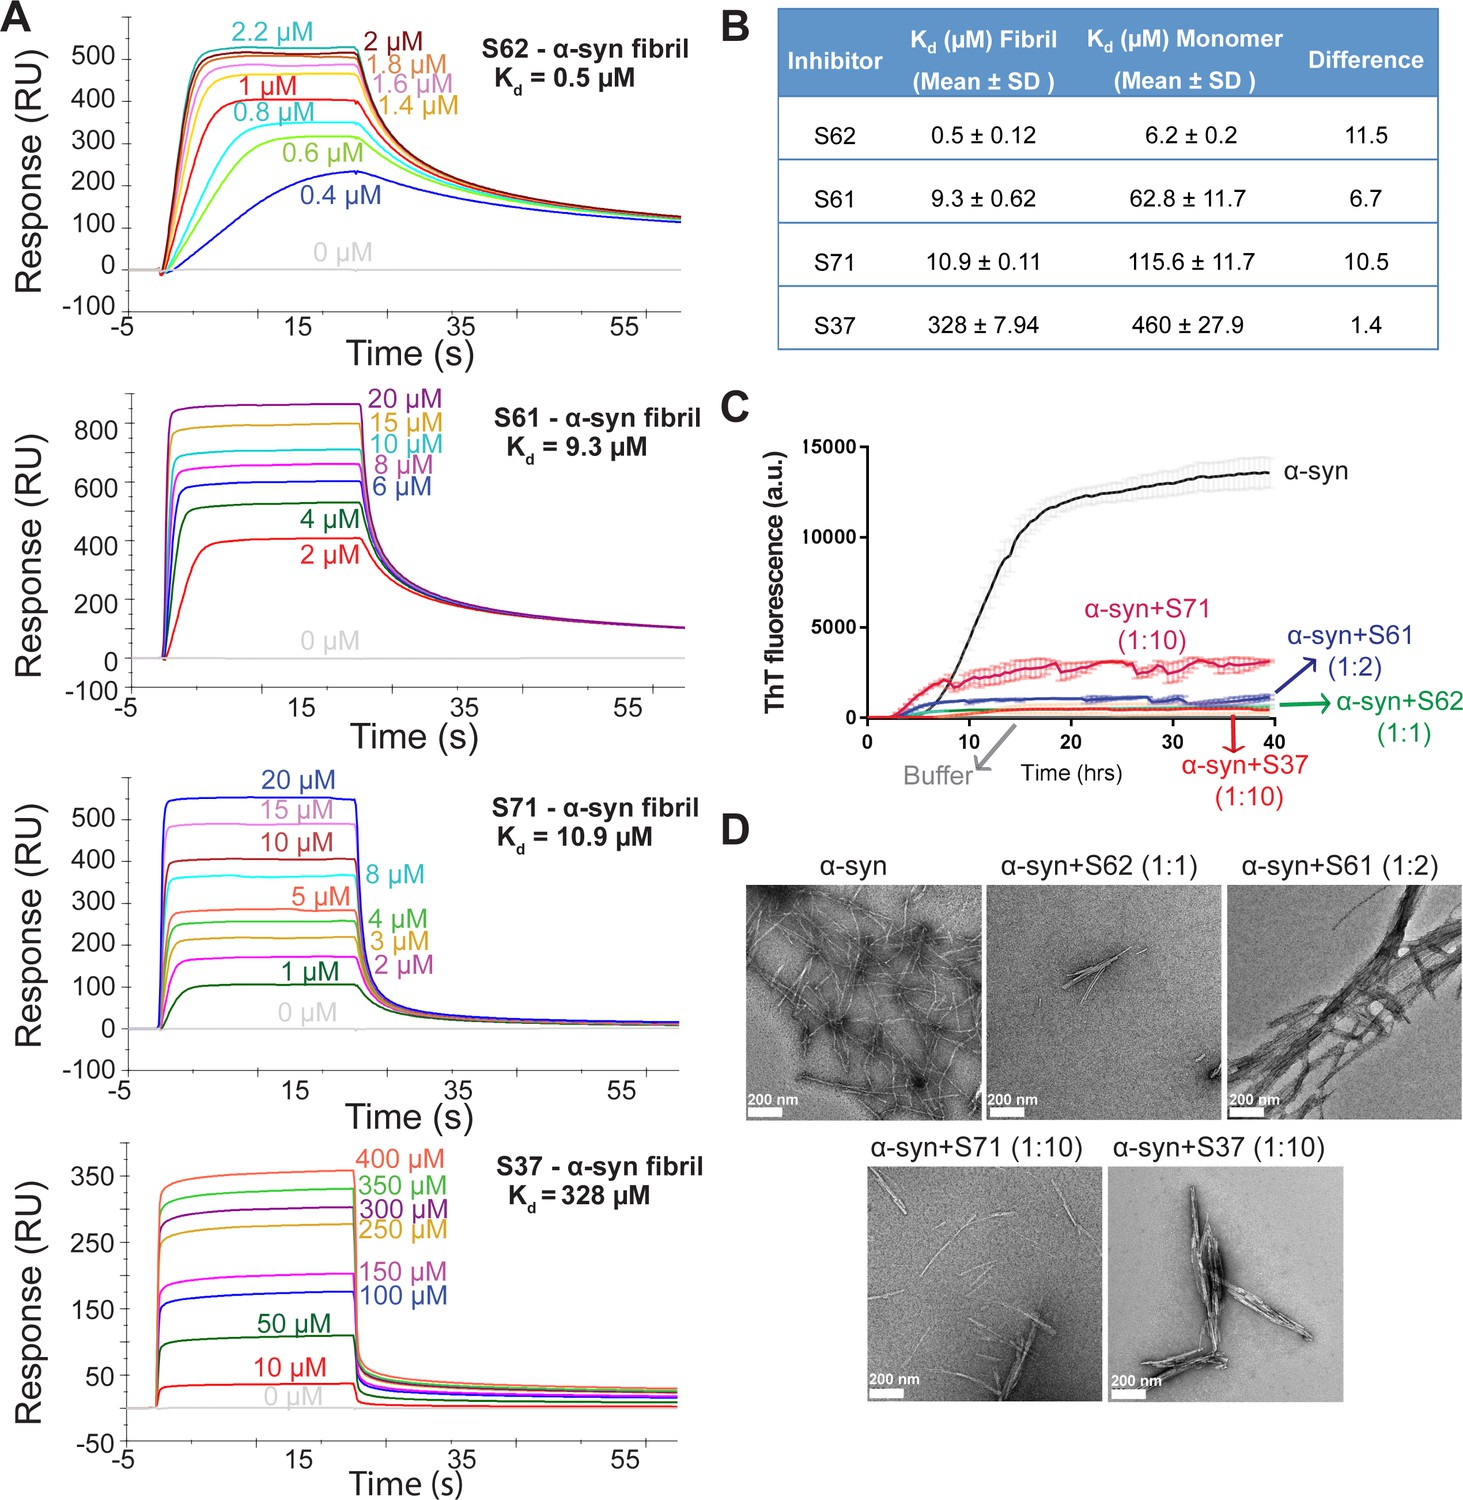
Inhibitors bind α-syn fibrils and inhibit α-syn fibril formation in vitro.
(A) SPR measurements of the different inhibitors with α-syn fibrils. α-syn fibrils were immobilized on a CM5 sensor chip using standard amine coupling chemistry. For the binding assay, each inhibitor was injected at a flow rate of 30 μl/min at concentrations ranging from 0.5 μM to 500 μM (in running buffer, PBS, pH 7.4) at 25°C. Sensorgrams for each inhibitor showing increase in SPR signal (response units) with increase in inhibitor concentration. (B) The equilibrium dissociation constant (Kd) was calculated by fitting the plot of steady-state inhibitor binding levels (SPR signal at steady-state) against inhibitor concentration with 1:1 binding model. The Kd values were calculated as 0.5 μM for S62, 9.3 μM for S61, 10.9 μM for S71 and 328 μM for S37. Similar measurements with α-syn monomers (Figure 2—figure supplement 1) show that inhibitors bind with 1 to 11-fold lower affinity to α-syn monomers. (C) Thioflavin T assay to measure α-syn aggregation and the effect of inhibitors. 50 μM α-syn was aggregated in the presence of different inhibitors (α-syn:inhibitor molar ratios); S62 (1:1), S61 (1:2) and S71 (1:10) and S37 (1:10). All four inhibitors decreased ThT fluorescence indicative of inhibition of aggregation. Each curve is an average of 3 data sets and error bars represent standard deviations. (D) Electron micrographs of α-syn aggregated with and without the different inhibitors. Sparse fibrils are seen in the presence of inhibitors compared to α-syn aggregated alone. In the presence of inhibitors, α-syn forms short, bundled fibrils with thick morphology compared to thin long fibrils in case of α-syn aggregated alone. Scale 200 nm.
Figure 2—figure supplement 1
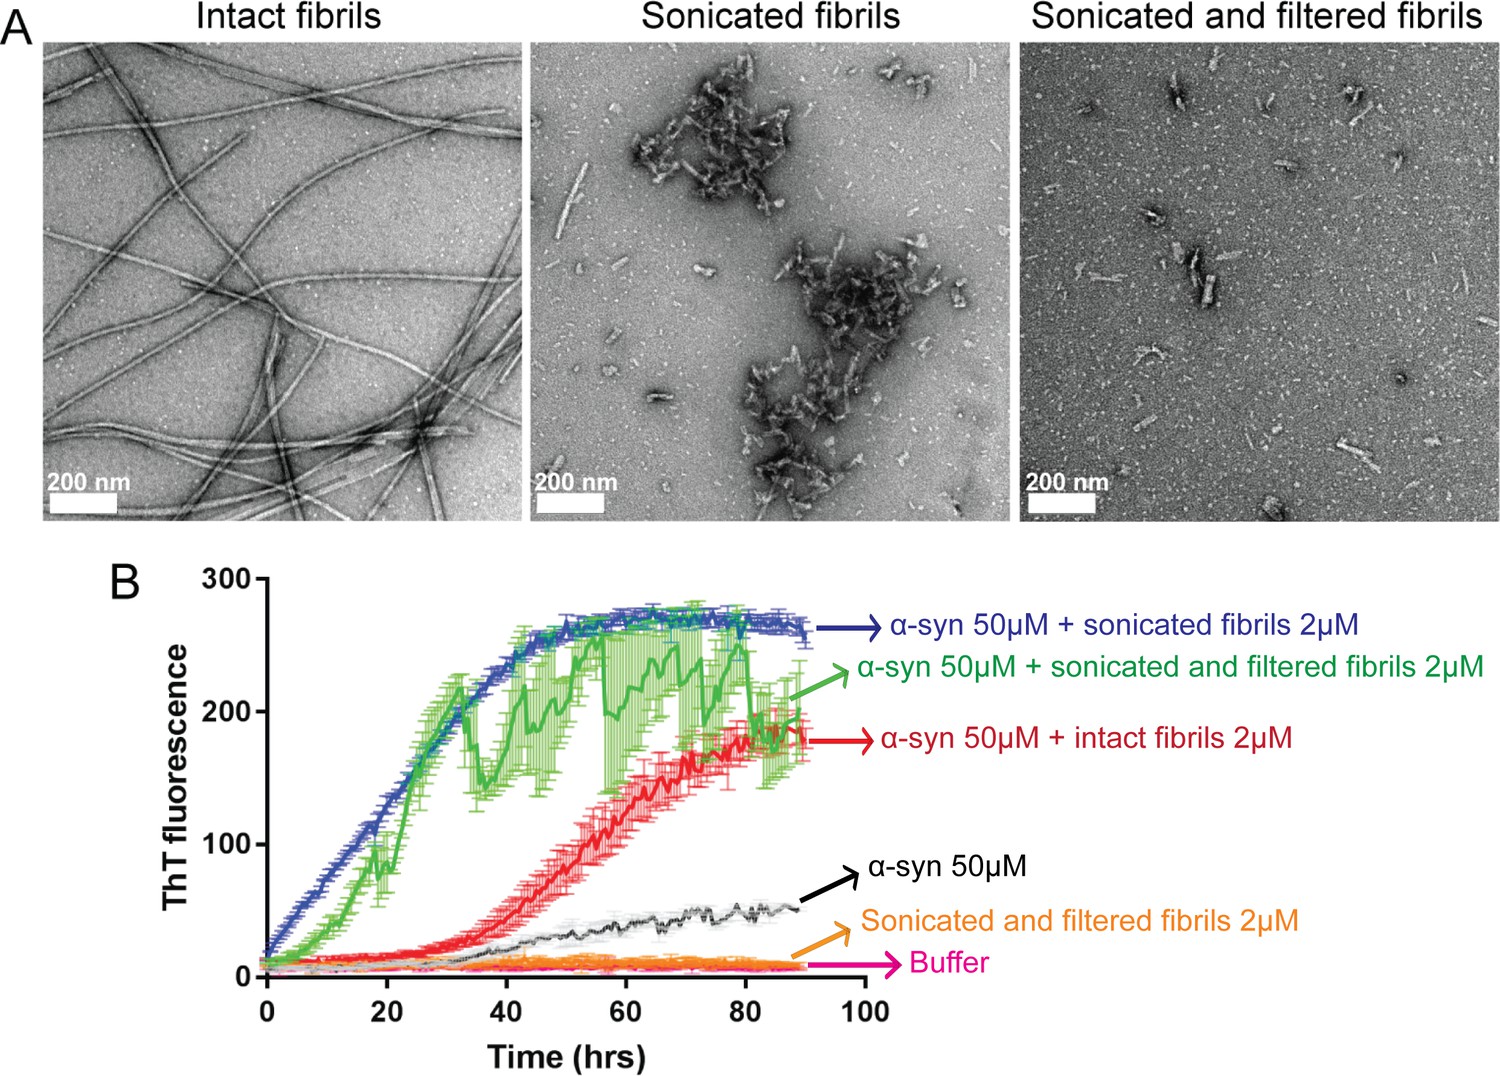
Sonicated and filtered α-syn fibrils can seed α-syn aggregation in vitro.
(A) Negatively stained EM images of intact fibrils (long un-branched fibrils), fibrils after sonication (short fibrils along with clumps) and after filtration (short fibrils free from large clumps). Scale 200 nm. (B) Seeded fibril growth monitored by the increase in fluorescence intensity of ThT showing rapid fibril growth in α-syn in presence of sonicated fibril seeds (blue curve) as well as sonicated and filtered fibril seeds (green curve) compared to α-syn incubated alone (black curve). Sonicated filtered fibrils have higher seeding ability than intact fibrils (red curve). Each curve is an average of 3 datasets and error bars represent standard deviations.
Figure 2—figure supplement 2
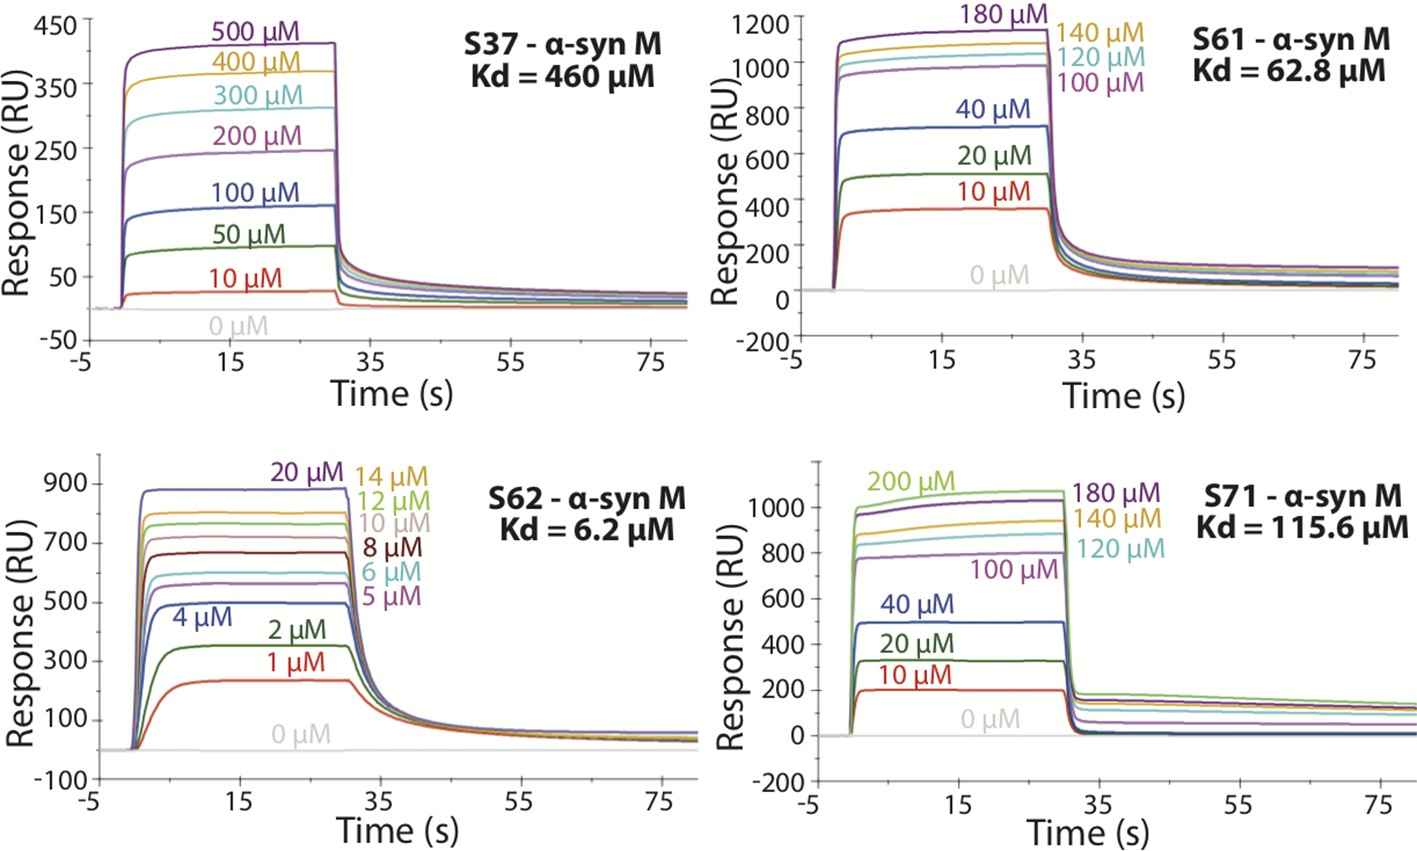
SPR measurements of the different inhibitors with α-syn monomers (α-syn M).
α-syn monomers were immobilized on a CM5 sensor chip using standard amine coupling chemistry. For the binding assay the inhibitor was injected at a flow rate of 30 μl/min over both flow cells (1 and 2) at concentrations ranging from 0.5 µM to 500 µM (in running buffer, PBS, pH 7.4) at 25°C. The dissociation constant Kd was calculated using BiaCore software as 460 μM for S37, 62.8 μM for S61, 6.2 μM for S62 and 115.6 μM for S71.
Figure 3 with 2 supplements
α-syn aggregates formed in the presence of inhibitors show reduced seeding ability in cells.
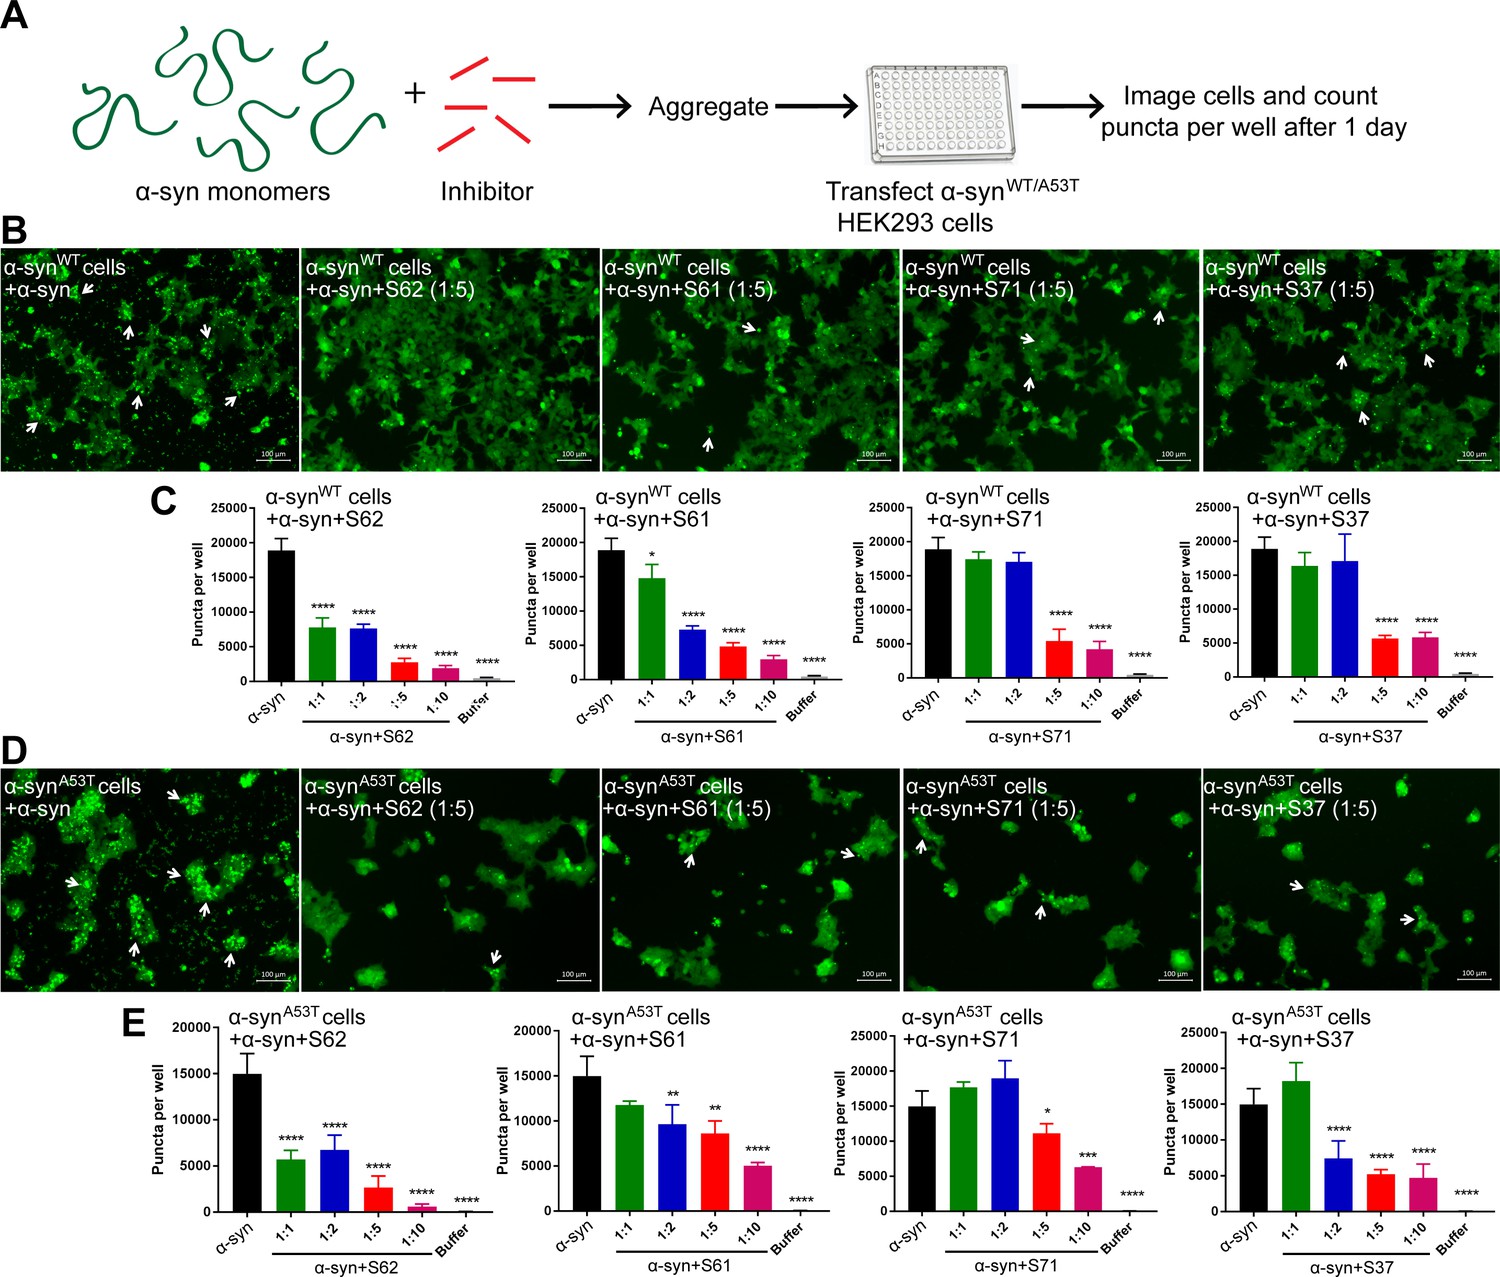
(A) Experimental design of cell culture seeding assay. 50 µM recombinant α-syn monomers (green) were aggregated (by agitation at 37°C for 2 days) in presence of various amounts of inhibitors (red). Then HEK293 cells expressing YFP labeled WT/A53T α-syn were transfected with α-syn aggregated in presence or absence of inhibitors. Cells were imaged after one day using fluorescence microscopy and the bright fluorescent puncta were counted using imaging cytometer. (B and D) Representative fluorescence micrographs of HEK293 cells expressing YFP-labeled WT (B) and A53T (D) α-syn transfected with aggregated α-syn in presence or absence of inhibitors. Transfection of α-syn aggregates induced endogenous α-syn to form large aggregates seen as bright puncta (white arrows). Transfection of α-syn aggregated in presence of inhibitors induced fewer puncta (white arrows) suggesting that all four inhibitors reduce the seeding ability of α-syn. Scale 100 µm. (C and E) Quantification of puncta formed in different conditions. With increasing concentrations of inhibitor, there is a decrease in number of puncta formed showing that the inhibitors decrease α-syn seeding ability in a dose-dependent manner. Results shown as Mean + SD (n = 3) of technical replicates. Statistical significance was analyzed by two-way ANOVA. (**p<0.01,***p<0.001,****p<0.0001).
Figure 3—figure supplement 1

Cell culture seeding assay.
(A) Experimental setup for high throughput screening in HEK293 cells. HEK293 cells were plated in 96 well plates. 125 nM α-syn fibrils were transfected and plates were imaged using an automated imaging cytometer. Puncta formed in each well were then counted using ImageJ particle analysis plugin allowing for unbiased measurements. (B) Fluorescence microscope images of HEK293 cells expressing YFP-labeled WT or A53T α-syn. Upon transfection of α-syn fibrils fluorescent puncta can be seen (white arrows). Scale 100 µm. (C, Left) Quantification of total puncta formed in each condition. The total number of puncta increases over time suggesting a prion-like propagation of aggregates. (C, Right) In both WT and A53T expressing HEK293 cells we do not observe cell death as seen by measuring the growth of cells transfected with buffer or α-syn fibrils.
Figure 3—figure supplement 2
Inhibitors reduce α-syn aggregation in vitro in a dose-dependent manner.
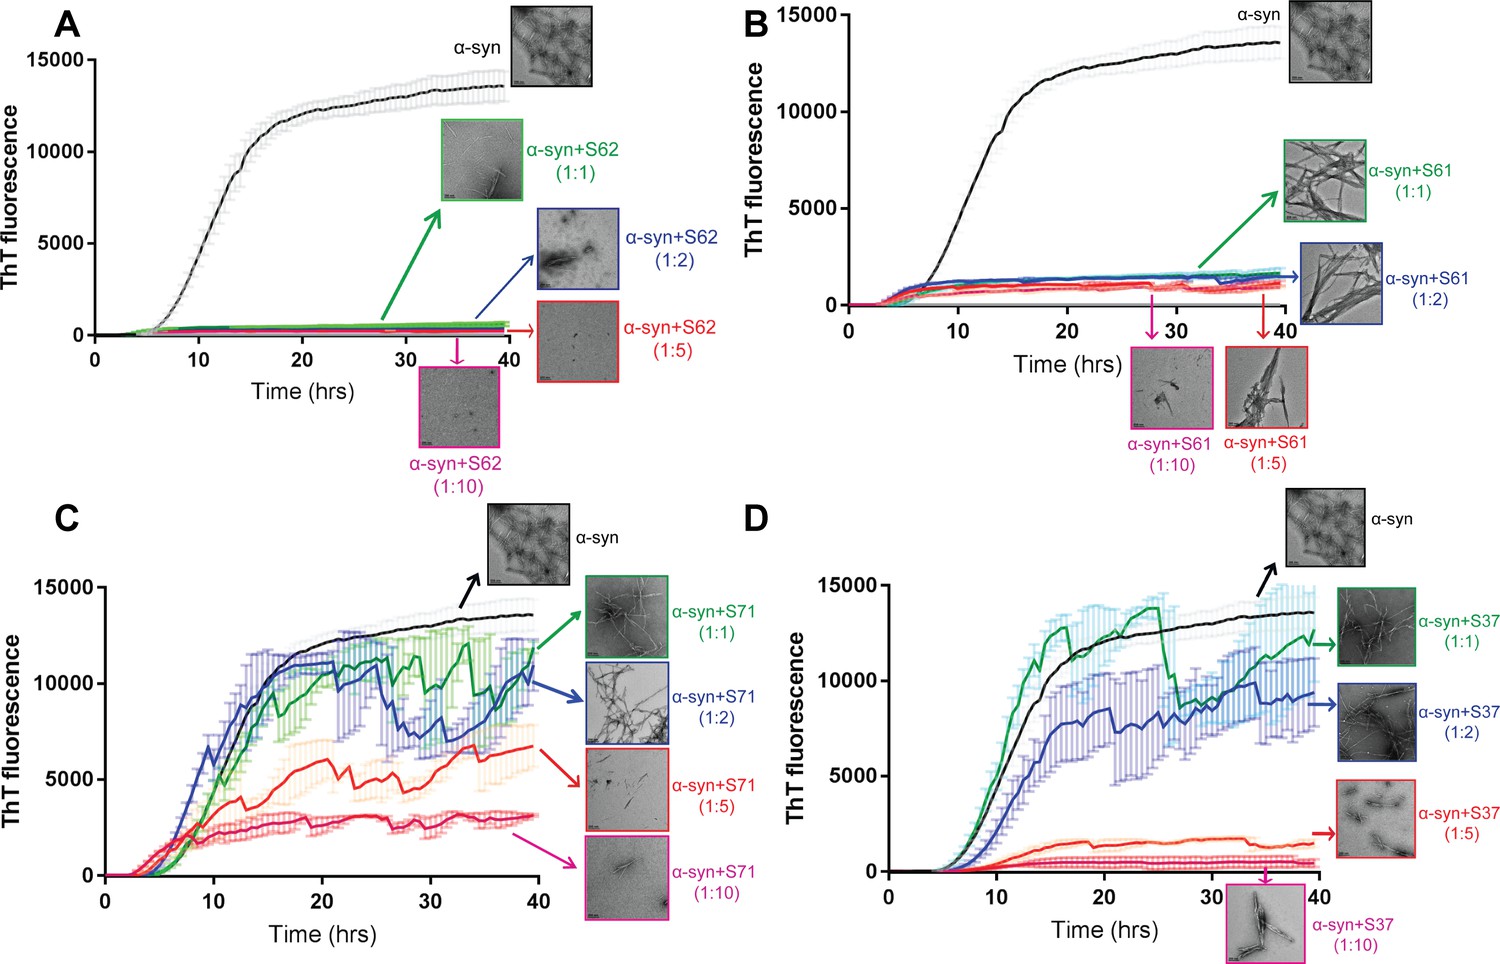
Monomeric α-syn was incubated with a range of concentrations of each inhibitor S62 (A), S71 (B), S71 (C) and S37 (D), α-syn:inhibitor molar ratios, 1:1, 1:2, 1:5 and 1:10. The ThT fluorescence data during incubation and electron micrographs of each sample at the end of incubation period show that with increase in concentration of each inhibitor there is decrease in ThT fluorescence and abundance of fibrils. This suggests that all four inhibitors, S62, S61, S71 and S37 have a dose-dependent inhibitory effect on α-syn aggregation kinetics. Scale bars in electron micrographs are 200 nm.
Figure 4 with 1 supplement

Inhibitors do not aggregate by themselves and do not seed α-syn aggregation in cells.
(A) Inhibitors, S61, S62, S37 and S71 incubated alone (at 500 µM concentration) did not show any increase in ThT fluorescence over a time period of 2 days whereas α-syn showed a time dependent increase in fluorescence indicative of fibril formation. Each curve represents average of 3 data sets and error bars represent standard deviation. (B) Electron micrographs of ThT assay samples at the end of 2 days of incubation. Sparse, small amorphous aggregates are observed for any of the inhibitors, whereas abundant fibrils are observed for α-syn. Scale 200 nm. (C) Fluorescence micrographs of WT α-syn expressing HEK293 cells transfected with α-syn/inhibitor incubated under shaking conditions for 2 days. Cells were imaged after 1 day of transfection. Inhibitor transfected cells did not have any puncta, whereas α-syn transfected cells had abundant puncta (shown by white arrows). Scale 100 um. (D) Quantification of puncta formed in different conditions. In agreement with the visual findings, the quantification of puncta shows that inhibitor/buffer transfected cells did not have puncta whereas α-syn fibrils cause abundant puncta formation.
Figure 4—figure supplement 1
Scrambling the inhibitor sequence abolishes its inhibitory effect on α-syn aggregation and seeding.
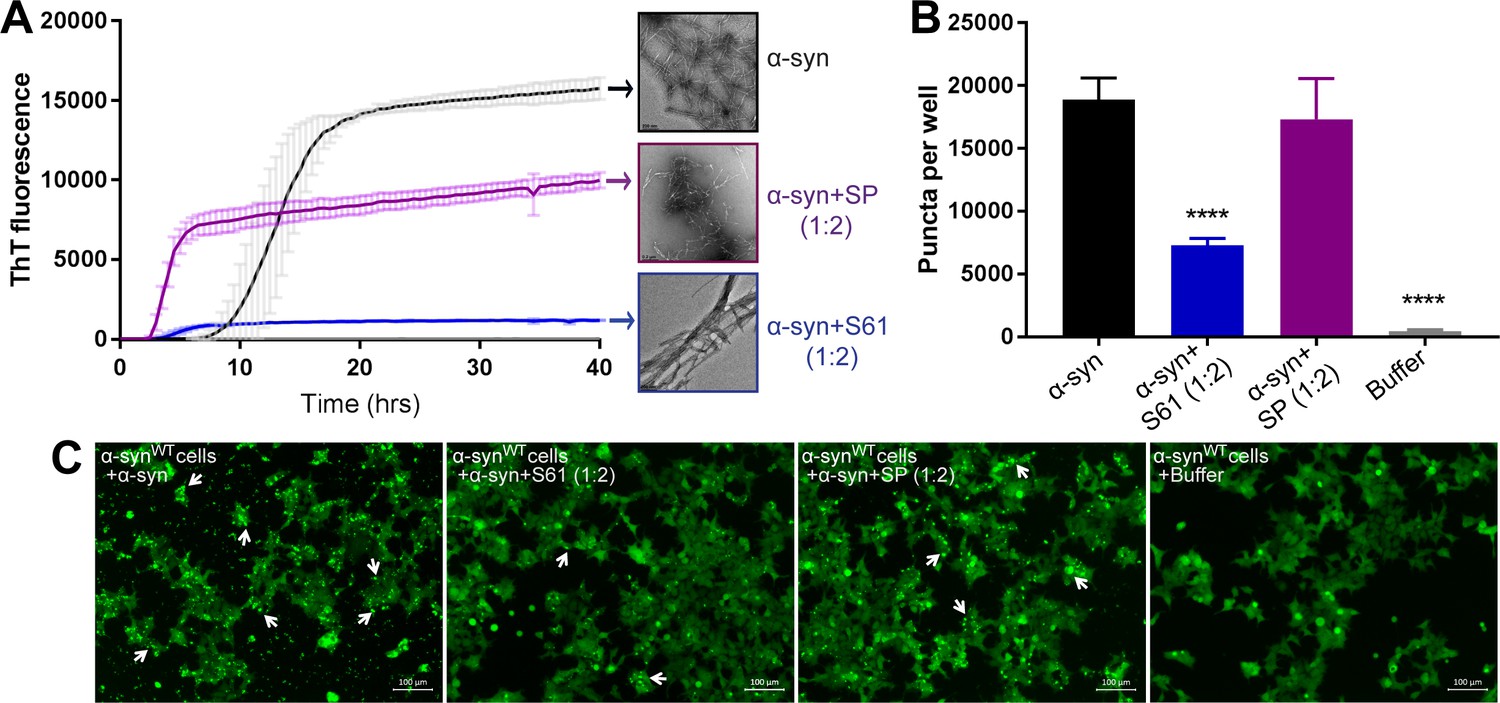
We created a scrambled peptide (SP) by scrambling the binding motif sequence of S61, keeping its cell penetration tag sequence intact. To test the sequence specificity of the inhibitory activity of our designed inhibitors we tested the efficacy of our SP in inhibiting α-syn aggregation and cell seeding. (A) In vitro aggregation monitored by the increase in fluorescence intensity of ThT showed rapid fibril growth in α-syn incubated alone as well as in presence of SP (α-syn:SP molar ratio, 1:2). However, α-syn incubated in presence of our inhibitor, S61 (α-syn:S61 molar ratio, 1:2) had about 10-fold less ThT fluorescence. Electron micrographs of ThT assay samples at the end of 2 days of incubation show abundant fibrils were observed for α-syn incubated alone and in presence of SP, whereas, sparse, thick, bundled fibrils are observed in α-syn incubated in presence of S61. Scale bars in electron micrographs are 200 nm. (B) WT α-syn expressing HEK293 cells were transfected with α-syn incubated alone or in presence of either SP or S61. Bar graph showing the average number of puncta formed in cells per well measured using imaging cytometer. Transfection of α-syn+SP does not cause a reduction in puncta whereas the inhibitor S61 causes significant in puncta per well. (C) Representative fluorescence micrographs of cells transfected with α-syn, α-syn+S61, α-syn+SP and buffer. Cells were imaged after 1 day of transfection. α-syn and α-syn+SP transfected cells had abundant puncta (shown by white arrows), whereas α-syn+S61 transfected cells had significantly lower amounts of puncta. This suggests that scrambling the binding motif sequence results in loss of inhibitory effect of our designed peptides. Scale 100 µm.
Figure 5 with 1 supplement
Inhibitors reduce the seeding ability of α-syn fibrils in cells.
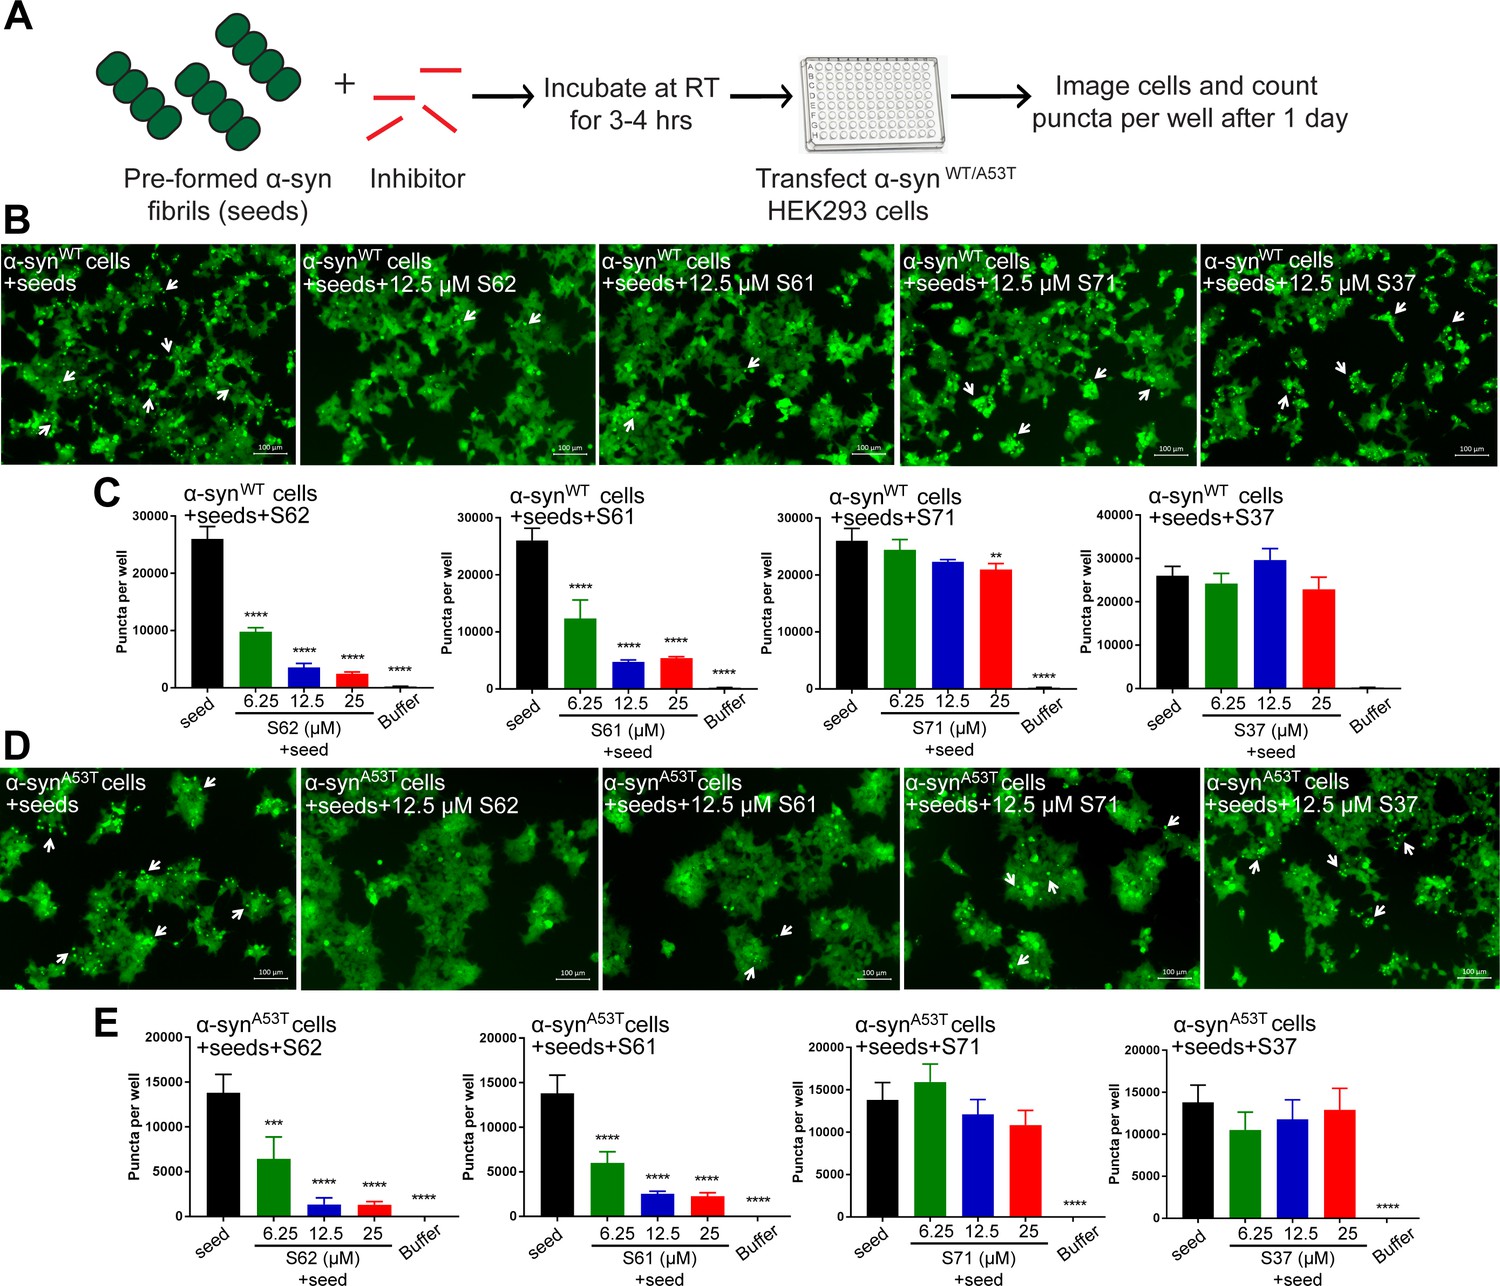
(A) Experimental design of cell culture seeding assay. Pre-formed α-syn fibrils (green) were incubated with various amounts of inhibitors (red) for 3–4 hr to allow binding. The mixture was transfected in HEK293 cells expressing YFP-labelled WT/A53T α-syn. After 1 day of transfection, cells were imaged using fluorescence microscopy and the bright fluorescent puncta were counted using imaging cytometer (B and D) Representative fluorescence micrographs of HEK293 cells expressing YFP labeled WT (B) and A53T (D) α-syn transfected with seeds and seeds pre-incubated with inhibitors. Transfection of α-syn seeds induced endogenous α-syn to form large aggregates seen as bright puncta (white arrows). Transfection of α-syn seeds pre-incubated with inhibitors S62 and S61 induced fewer puncta (white arrows) in both WT and A53T α-syn expressing HEK293 cells but S37 and S71 do not have a significant effect on puncta formation. Scale 100 µm. (C and E) Quantification of puncta formed in different conditions. In agreement to the visual findings the quantification of puncta shows that S62 and S61 significantly reduce the number of puncta in both cell lines. This means that pre-incubation of α-syn fibrils with inhibitors (S62 and S61) that have higher binding affinity for α-syn fibrils reduces cell seeding ability. In contrast, the inhibitors S71 and S37, which have lower affinity for α-syn fibrils do not have a significant effect on cell seeding ability of α-syn fibrils. Results shown as Mean + SD (n = 3) of technical replicates. Statistical significance was analyzed by two-way ANOVA. (**p<0.01,***p<0.001,****p<0.0001).
Figure 5—figure supplement 1
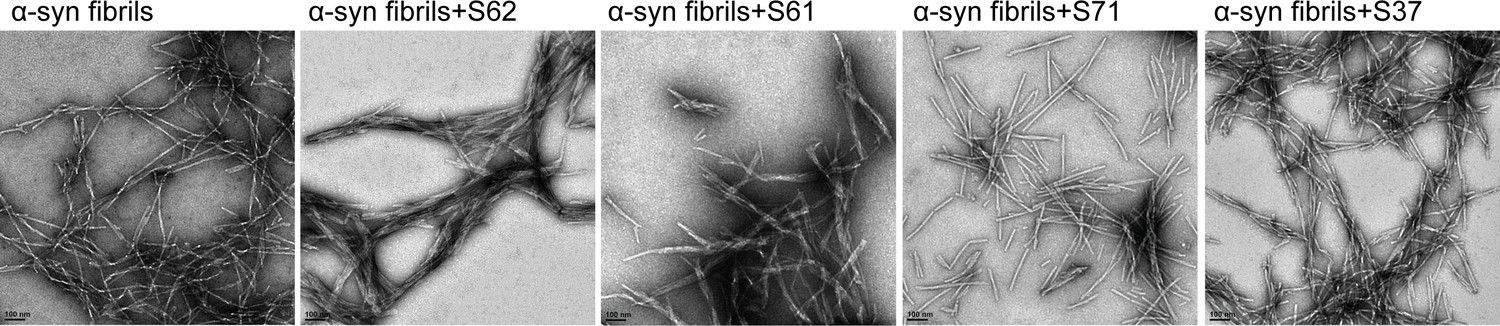
Incubation with inhibitors causes morphological changes in α-syn fibrils.
Negatively stained electron micrographs of pre-formed α-syn fibrils incubated for 3-4 hours with each inhibitor at room temperature. Incubation of α-syn fibrils with inhibitors, S62 and S61 results in bundling of fibrils into thick morphologies. Inhibitors, S71 and S37 do not affect the morphology of α-syn fibrils. Scale 100 nm.
Figure 6 with 2 supplements
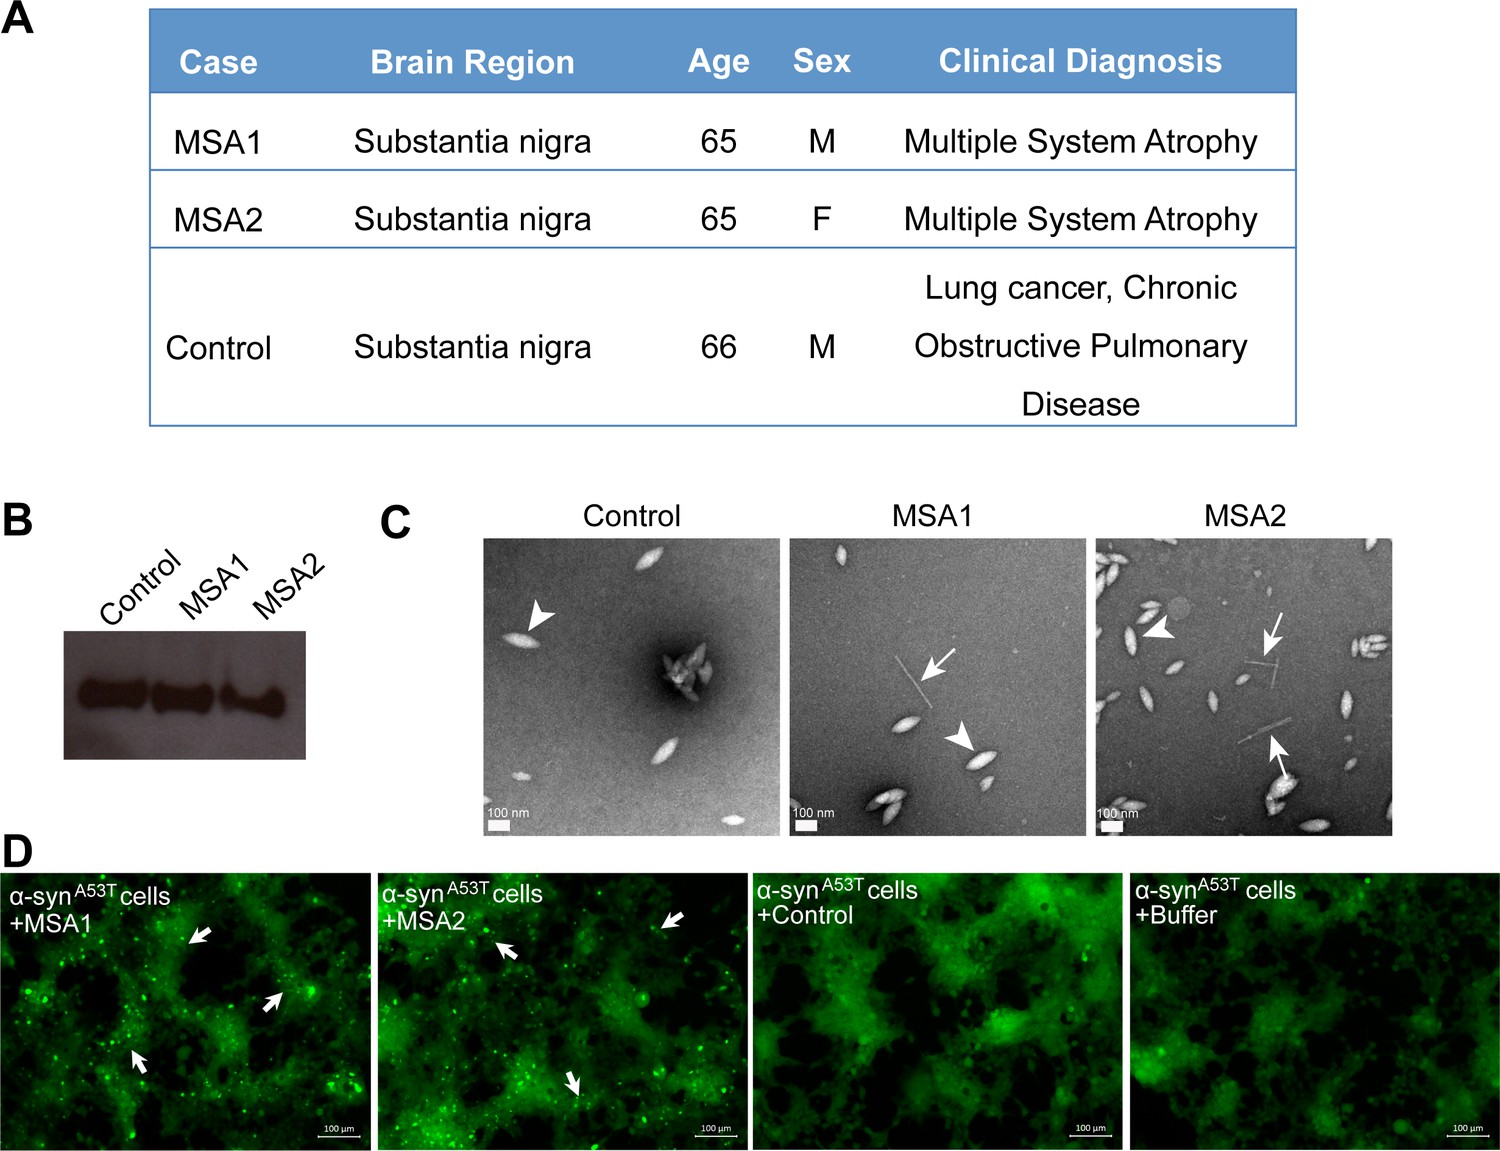
MSA derived α-syn fibrils seed α-syn aggregation in cell culture model.
(A) Clinical information of human tissues used in this study. (B) Western blot of extracts from MSA1, MSA2 and control brain samples. All three samples show positive reactivity against α-syn. (C) Electron micrographs of extracts from MSA1, MSA2 and control brain samples. Fibrillar structures (white arrows) were found in MSA1 and MSA2 samples but not in control sample. Large amorphous structures (white arrowheads) are seen in all three samples. Scale 100 nm. (D) Fluorescence micrographs of HEK293 cells expressing A53T α-syn transfected with extracts from MSA1, MSA2 and control brain samples. Images were taken 7 days after transfection. Robust seeding was observed in MSA1 and MSA2 transfected cells (puncta shown by white arrows), whereas no seeding was observed in buffer or control transfected cells. Scale 100 µm.
Figure 6—figure supplement 1
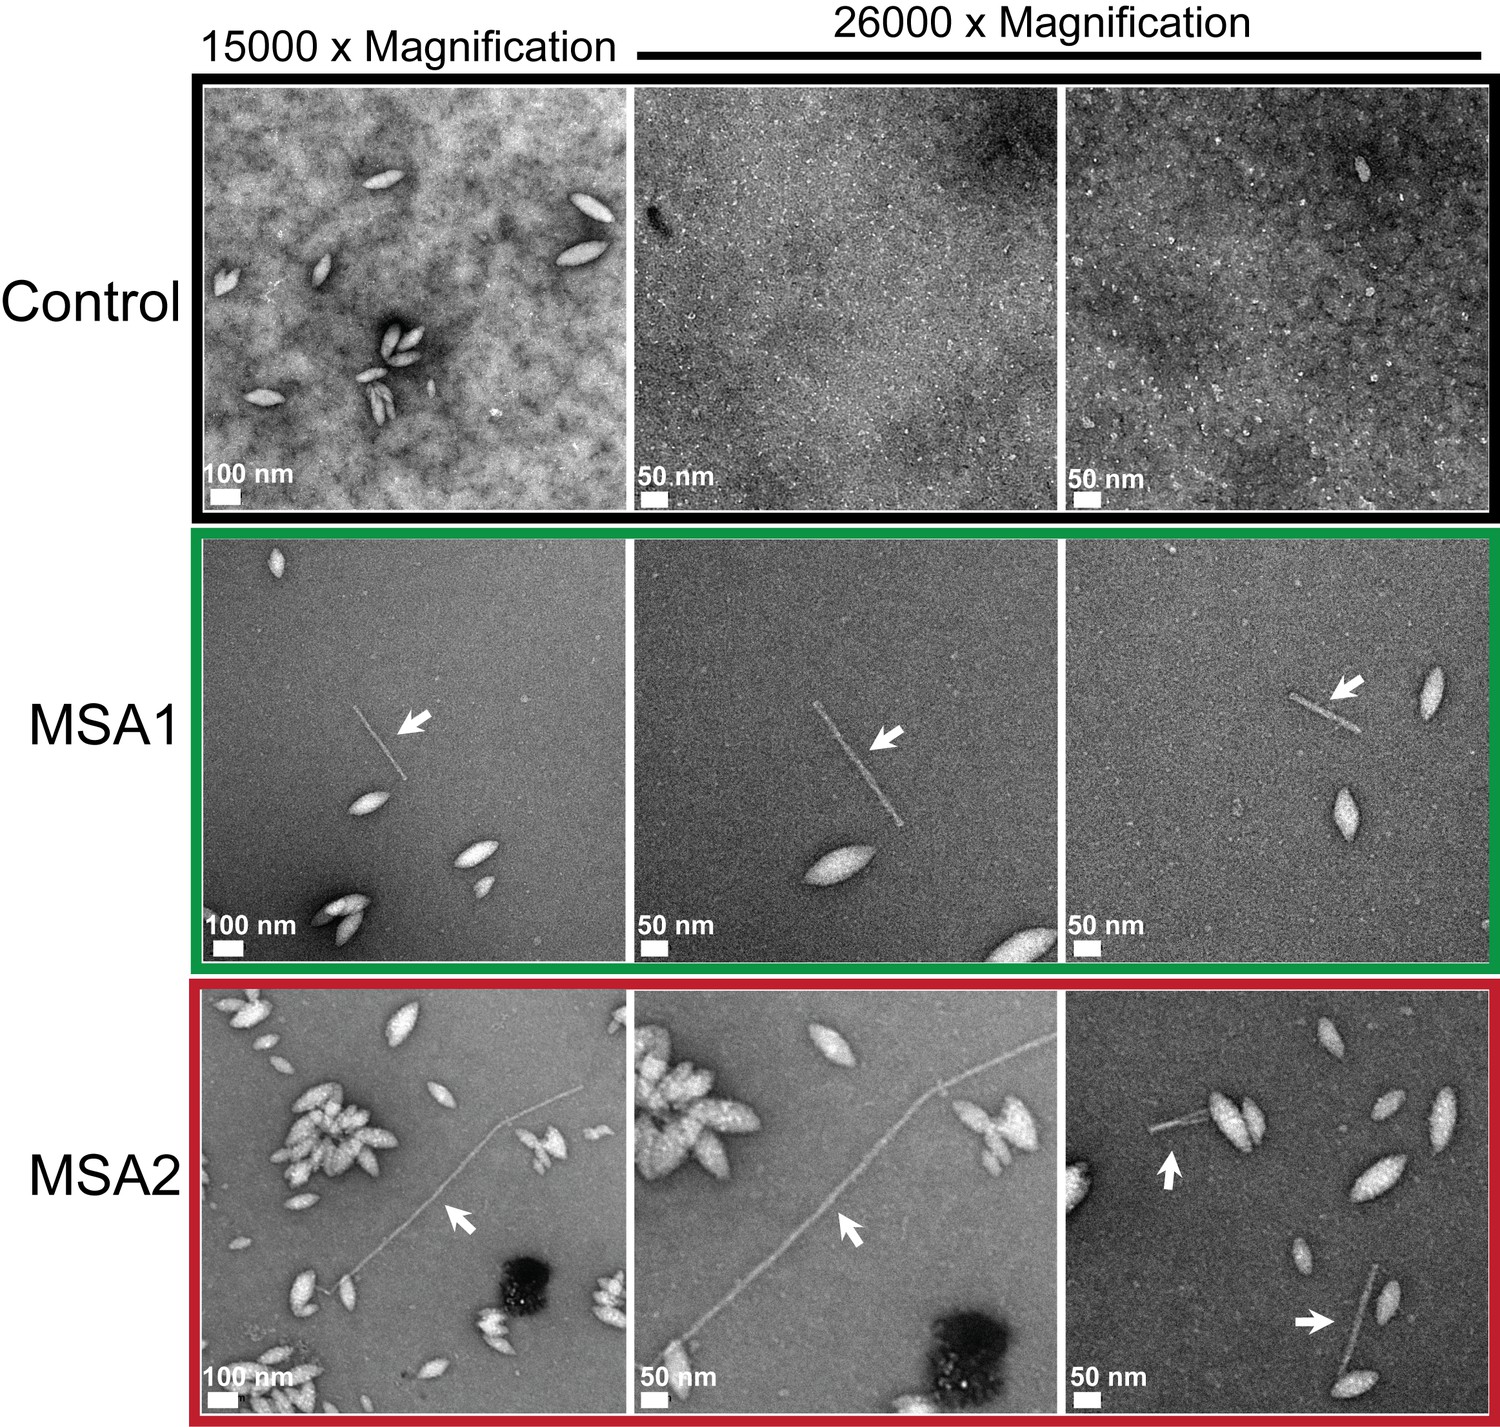
MSA brain extracts contain fibrils.
Negatively stained electron micrographs of extracts from MSA1, MSA2 and control brain samples. Along with other morphologies fibrillar structures (shown by white arrows) were found in MSA1 and MSA2 samples. In control sample, no fibril-like structures were observed.
Figure 6—figure supplement 2
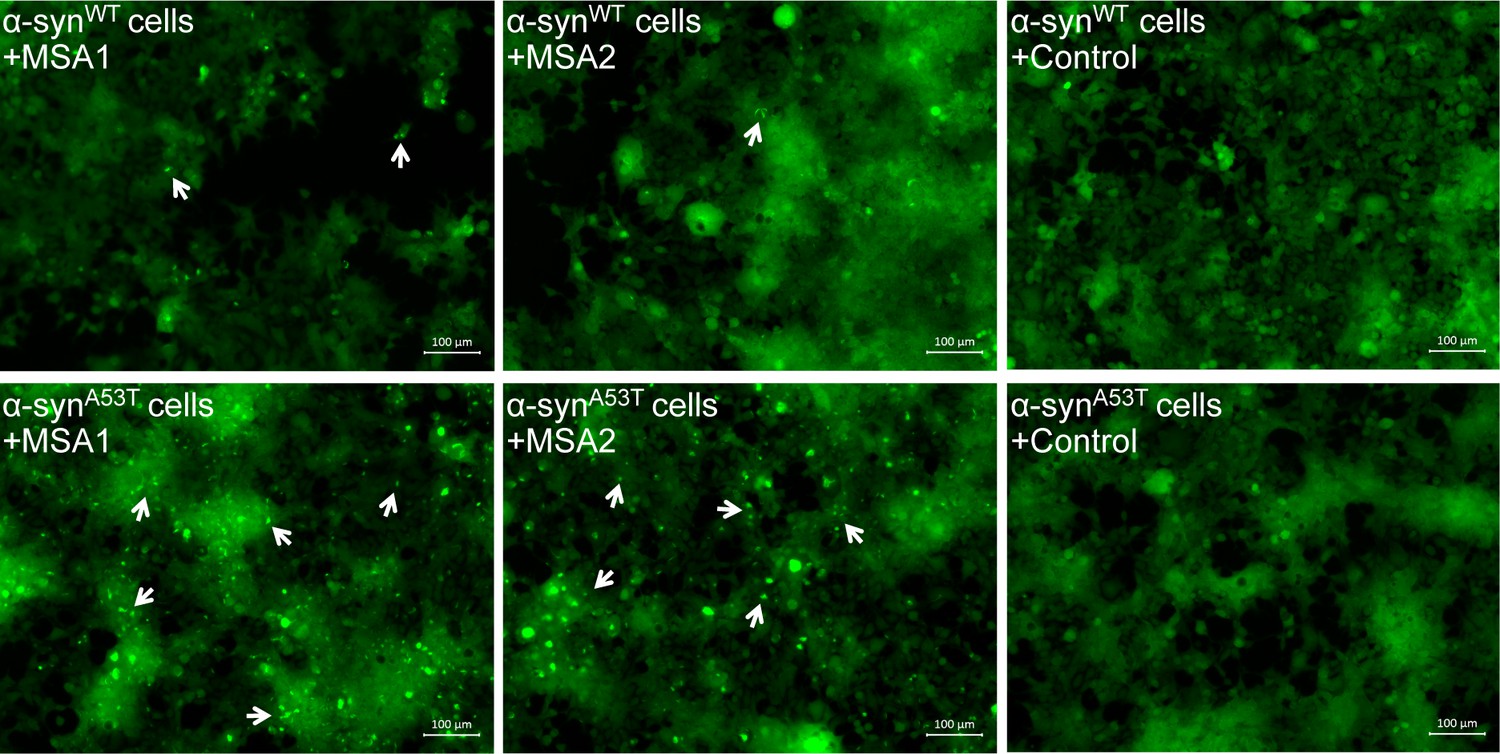
MSA derived α-syn aggregates seed α-syn aggregation in HEK293 cells expressing YFP-labeled WT/A53T α-syn.
Fluorescence micrographs of HEK293 cells expressing WT (upper panel)/A53T (lower panel) α-syn transfected with extracts from MSA1, MSA2 and control brain samples. Images were taken 7 days after transfection. Robust seeding was observed in MSA1 and MSA2 transfected A53T cells (puncta shown by white arrows) and faint seeding was observed in MSA1 and MSA2 transfected WT cells, whereas no seeding was observed in buffer or control transfected WT/A53T cells. Scale 100 µm.
Figure 7

Inhibitors reduce the seeding by MSA derived α-syn fibrils.
(A) Experimental design of cell culture seeding assay showing MSA derived α-syn fibrils (green) were incubated with each inhibitor (red) for 3–4 hr to allow binding. Then HEK293 cells expressing YFP-labelled A53T α-syn were transfected with this mixture. After 7 days of transfection cells were imaged using fluorescence microscope and the bright fluorescent puncta were counted using imaging cytometer. (B and C) Representative fluorescence micrographs of the cells show that all the four inhibitors cause reduction in puncta (shown by white arrows) both in MSA1 (B) and MSA2 (C) transfected cells. Scale 100 µm. (D and E) Quantification of puncta in different conditions. All four inhibitors significantly reduce seeding by both MSA1 and MSA2 samples. Results shown as Mean + SD (n = 3) of technical replicates. Statistical significance was analyzed by two-way ANOVA. (**p<0.01,***p<0.001,****p<0.0001).
Additional files
Download links
A two-part list of links to download the article, or parts of the article, in various formats.
Downloads (link to download the article as PDF)
Open citations (links to open the citations from this article in various online reference manager services)
Cite this article (links to download the citations from this article in formats compatible with various reference manager tools)
Inhibition of synucleinopathic seeding by rationally designed inhibitors
eLife 9:e46775.
https://doi.org/10.7554/eLife.46775


