The effects of psychosocial stress on dopaminergic function and the acute stress response
- Imperial College London, United Kingdom
- University College London, United Kingdom
- Kings College London, United Kingdom
- NIHR University College London Hospitals Biomedical Research Centre, United Kingdom
- St Pancras Hospital, Camden and Islington NHS Foundation Trust, United Kingdom
- National Hospital for Neurology and Neurosurgery, University College London Hospitals NHS Foundation Trust, United Kingdom
- University of Bath, United Kingdom
Figures
Figure 1
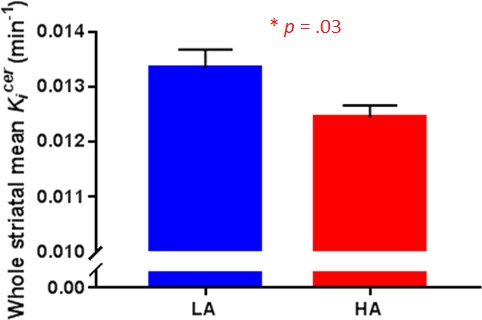
Striatal dopamine synthesis capacity in Low Adversity (LA, n = 17) and High Adversity participants (HA, n = 17).
Dopamine synthesis capacity was significantly reduced in HA compared with LA (t32 = 2.27, p=0.03). Error bars indicate standard errors.
Figure 2
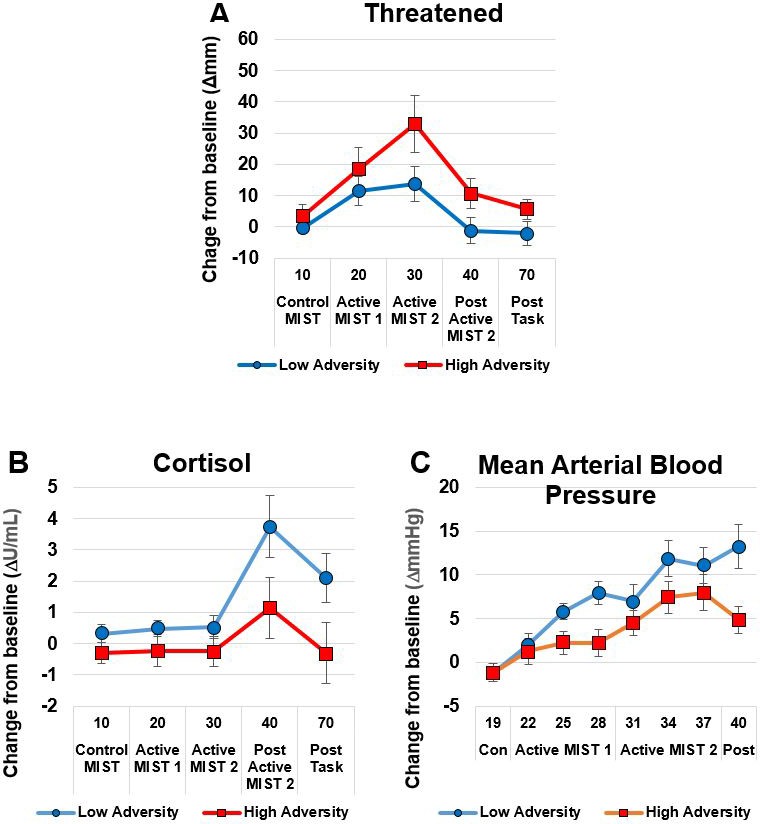
The High Adversity group showed a heightened subjective response and a blunted physiological response.
Panel A shows subjective Threatened responses; Panels B (Cortisol) and C (Mean Arterial Blood Pressure) show physiological response. Data show mean (+ /- SEM).
Figure 3

Correlations between striatal dopamine synthesis capacity and acute response to psychosocial stress.
(A) Whole striatal dopamine synthesis capacity was positively correlated with stress-induced threat in the Low Adversity group (r = 0.73, p=0.001) but not the High Adversity group (r = −0.03, p=0.934). (B). Whole striatal dopamine synthesis capacity was negatively correlated with stress-induced threat and mean arterial blood pressure in the Low Adversity group (r = −0.62, p=0.013) but not the High Adversity group (r = 0.23, p=0.395). Extreme bivariate outliers have been removed from the figures.
Figure 4
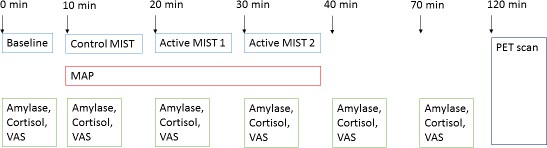
Experimental procedures.
MIST, Montreal Imaging Stress Test; MAP, Mean Arterial Blood Pressure; VAS, visual analogue scale.
Tables
Table 1
Sample characteristics and scan parameters
https://doi.org/10.7554/eLife.46797.002| Sample characteristic | LA ( = 17) | HA ( = 17) | pa | ||
|---|---|---|---|---|---|
| Age, years [mean(SD)] | 27.6 | (7.8) | 29.2 | (7.2) | 0.54 |
| Sex, n | nine female, eight male | eight female, nine male | 1.00 | ||
| Ethnicity, n | 17 WB | 4 BA, 1BB, 4 BC, 6 ME, 1 OE, 1 WB | <0.001 | ||
| Childhood Adversity | |||||
| CTQ [mean(SD)] | 3.8 | (5.2) | 15.3 | (16.1) | 0.01 |
| Parental loss (parental separation with loss of parental contact and/or death and/or going into foster care and/or being adopted) during childhood, n | 0 | 13 | <0.001 | ||
| Childhood sexual abuse | 0 | 6 | 0.02 | ||
| Adult Adversity | |||||
| Number of adverse life events over last 6 months [mean(SD)] | 0.5 (0.9) | 2.6 (1.9) | 0.001 | ||
| Life events score over last 6 months [mean(SD)] | 15.1 (37.0) | 72.3 (55.7) | <0.01 | ||
| Clinical Scores | |||||
| BDI [mean(SD)] | 2.7 (3.8) | 6.5 (5.6) | 0.03 | ||
| BAI [mean(SD)] | 4.8 (6.7) | 9.7 (10.2) | 0.11 | ||
| IES-6 [mean(SD)] | 1.7 (2.3) | 7.7 (7.6) | 0.01 | ||
| O-LIFE [mean(SD)] | 7.2 (6.5) | 13.1 (9.5) | 0.07 | ||
| ASI [mean(SD)] | 5.7 (5.8) | 11.6 (7.5) | 0.02 | ||
| Current Drug Usec,d | |||||
| Tobacco cigarette smokers in last 3 months (n) | three user, 14 non-users | four users, 13 non-users | 1.00 | ||
| Tobacco use in whole sample (cigarettes/day) [mean(SD)] | .4 | (1.5) | 1.7 | (3.6) | 0.19 |
| Alcohol use in last 3 months (n) | 15 users, two non-users | 14 users, three non-users | 1.00 | ||
| Alcohol use (UK alcohol units/week) [mean(SD)] | 10.2 | (9.0) | 7.0 | (8.9) | 0.30 |
| Scan parameter | |||||
| Injected dose (MBq) [mean(SD)] | 143.4 | (7.7) | 142.9 | (7.7) | 0.85 |
| Specific activity (MBq/µmol) [mean(SD)] | 35.3 | (6.7) | 41.4 | (15.4) | 0.14 |
| Whole striatal volume (mm3) [mean(SD)] | 16,842 | (5094) | 15,741 | (4,601) | 0.54 |
| Associative striatal volume (mm3) [mean(SD)] | 10,460 | (3202) | 9771 | (2885) | 0.54 |
| Limbic striatal volume (mm3) [mean(SD)] | 2005 | (610) | 1897 | (547) | 0.61 |
| Sensorimotor striatal volume (mm3) [mean(SD)] | 4375 | (1314) | 4072 | (1189) | 0.51 |
-
Abbreviations: ASI, Aberrant Salience Inventory; BA, black African; BAI; Beck Anxiety Inventory; BB, black British; BC, black Caribbean; BDI, Beck Depression Inventory; CTQ, Childhood Trauma Questionnaire; IES-6, Brief Impact of Events Scale;, mixed ethnicity; OE, other ethnicity; O-LIFE, Oxford-Liverpool Inventory of Feelings and Experiences; SEAT, Social Environment Assessment Tool; WB, White British.
a Independent-samples t-tests for variables with normal data distributions; Mann-Whitney U tests for variables with non-normal data distributions; χ2-tests for dichotomous variables.
-
bGroups were compared on a dichotomised ethnicity variable (white British vs ethnic minority).
c 1 UK alcohol unit = 10 mL (~7.88 g) alcohol.
Table 2
[18F]-DOPA Kicer (min−1) by group
https://doi.org/10.7554/eLife.46797.004| VOI | LA ( = 17) | HA ( = 17) | Group comparisonsa | Effect size | |||
|---|---|---|---|---|---|---|---|
| Mean | (SD) | Mean | (SD) | tdf | p | (Cohen’s D) | |
| STR | 0.0133 | (0.0014) | 0.0124 | (0.0013) | 2.2732 | 0.03 | 0.80 |
| AST | 0.0133 | (0.0011) | 0.0124 | (0.0010) | 2.2832 | 0.03 | 0.81 |
| LST | 0.0140 | (0.0015) | 0.0128 | (0.0010) | 2.6932 | 0.01 | 0.95 |
| SMST | 0.0132 | (0.0013) | 0.0125 | (0.0011) | 1.1732 | 0.10 | 0.41 |
-
Abbreviations: AST, associative striatum; LST, limbic striatum; Kicer, influx rate constant; SMST, sensorimotor striatum; STR, whole striatum; VOI, volume of interest.
a Independent-samples t-tests.
Table 3
Baseline stress reactivity in Low Adversity (LA) and High Adversity (HA) groups at prior to acute psychosocial stress challenge
https://doi.org/10.7554/eLife.46797.005| Measure | LA ( = 17) | HA ( = 17) | Group comparisons | Effect size | |||
|---|---|---|---|---|---|---|---|
| Mean | (SD) | Mean | (SD) | tdf | P | (Cohen’s D) | |
| Threatened (mm) | 6.75 | (15.52) | 4.58 | (6.00) | 0.4626 | 0.65 | 0.18 |
| Cortisol (U/mL) | 3.93 | (2.74) | 5.12 | (3.54) | 1.0830 | 0.29 | 0.38 |
| Amylase (U/mL) | 178.42 | (173.83) | 92.79 | (53.13) | 1.8330 | 0.07 | 0.67 |
| MAP (mmHg) | 89.67 | (9.45) | 90.38 | (9.63) | 0.2129 | 0.84 | 0.07 |
-
Abbreviations: HA, high adversity; LA, low adversity; MAP, mean arterial pressure.
Table 4
Acute response to psychosocial stress challenge in Low Adversity (LA) and High Adversity (HA) groups
https://doi.org/10.7554/eLife.46797.006| Measure | LA ( = 17) | HA ( = 17) | Group comparisons | Effect size | |||
|---|---|---|---|---|---|---|---|
| Mean | (SD) | Mean | (SD) | tdf | p | (Cohen’s D) | |
| Threatened (AUC) | 191.25 | (587.99) | 780.83 | (764.33) | 2.3126 | 0.04 | 0.86 |
| Cortisol (AUC) | 122.34 | (156.49) | 11.75 | (166.14) | 1.9430 | 0.06 | 0.69 |
| Amylase (AUC) | 1616.67 | (5750.66) | 1015.84 | (2740.24) | 0.3730 | 0.72 | 0.13 |
| MAP (AUC) | 153.30 | (90.04) | 79.31 | (92.09) | 2.2629 | 0.03 | 0.81 |
-
Abbreviations: HA, high adversity; LA, low adversity; MAP, mean arterial pressure.
Additional files
-
Source data 1
- https://doi.org/10.7554/eLife.46797.010
-
Transparent reporting form
- https://doi.org/10.7554/eLife.46797.011
Download links
A two-part list of links to download the article, or parts of the article, in various formats.
Downloads (link to download the article as PDF)
Open citations (links to open the citations from this article in various online reference manager services)
Cite this article (links to download the citations from this article in formats compatible with various reference manager tools)
The effects of psychosocial stress on dopaminergic function and the acute stress response
eLife 8:e46797.
https://doi.org/10.7554/eLife.46797


