Interactions between a subset of substrate side chains and AAA+ motor pore loops determine grip during protein unfolding
- Massachusetts Institute of Technology, United States
- Howard Hughes Medical Institute, Massachusetts Institute of Technology, United States
Figures
Figure 1
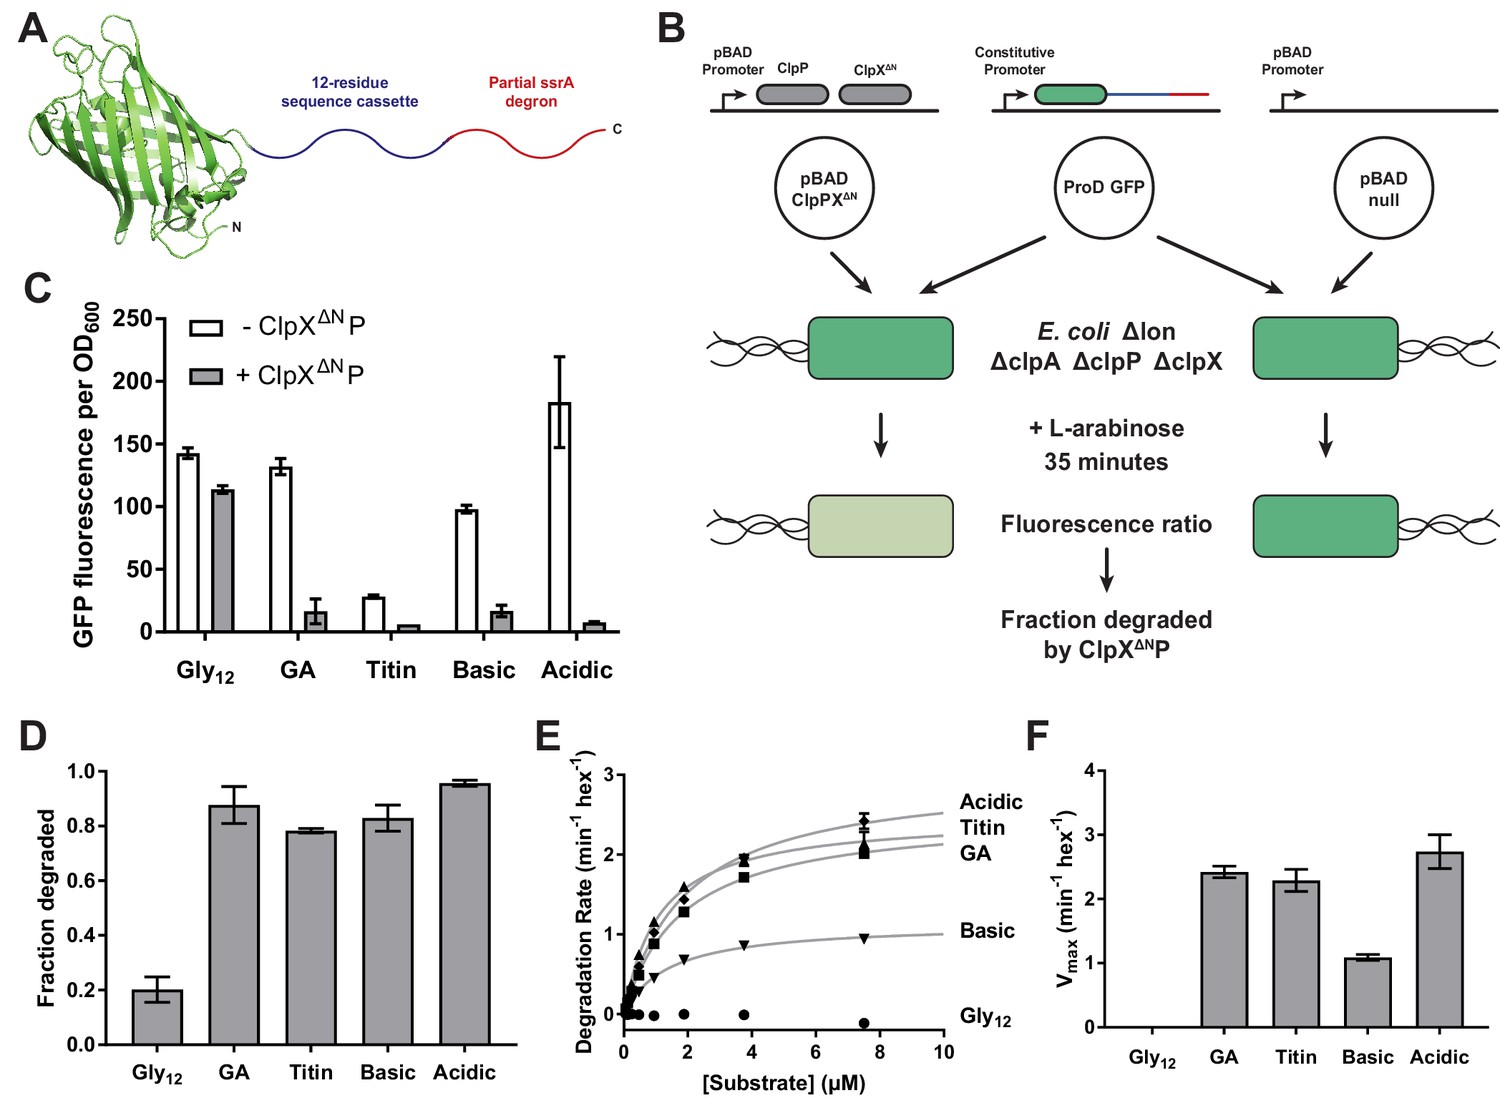
Effects of cassette sequence on GFP unfolding and degradation.
(A) Starting at the N terminus, substrates contained residues 1–229 of A.victoria GFP (PDB 1GFL, Yang et al., 1996), a cassette with 12 variable residues, and a partial ssrA degron. (B) Method for measuring intracellular degradation of substrates by ClpXΔN/ClpP. (C) Cellular fluorescence depends upon ClpXΔN/ClpP expression and cassette sequence (listed in Table 1). (D) Fraction intracellular degradation for substrates bearing different cassettes. (E) Fits of the substrate dependence of degradation in vitro to a hyperbolic Michaelis-Menten equation. (F) Vmax values for different substrates. In panels, C–F, values represent averages (± S.D.) of three biological replicates.
Figure 2 with 2 supplements
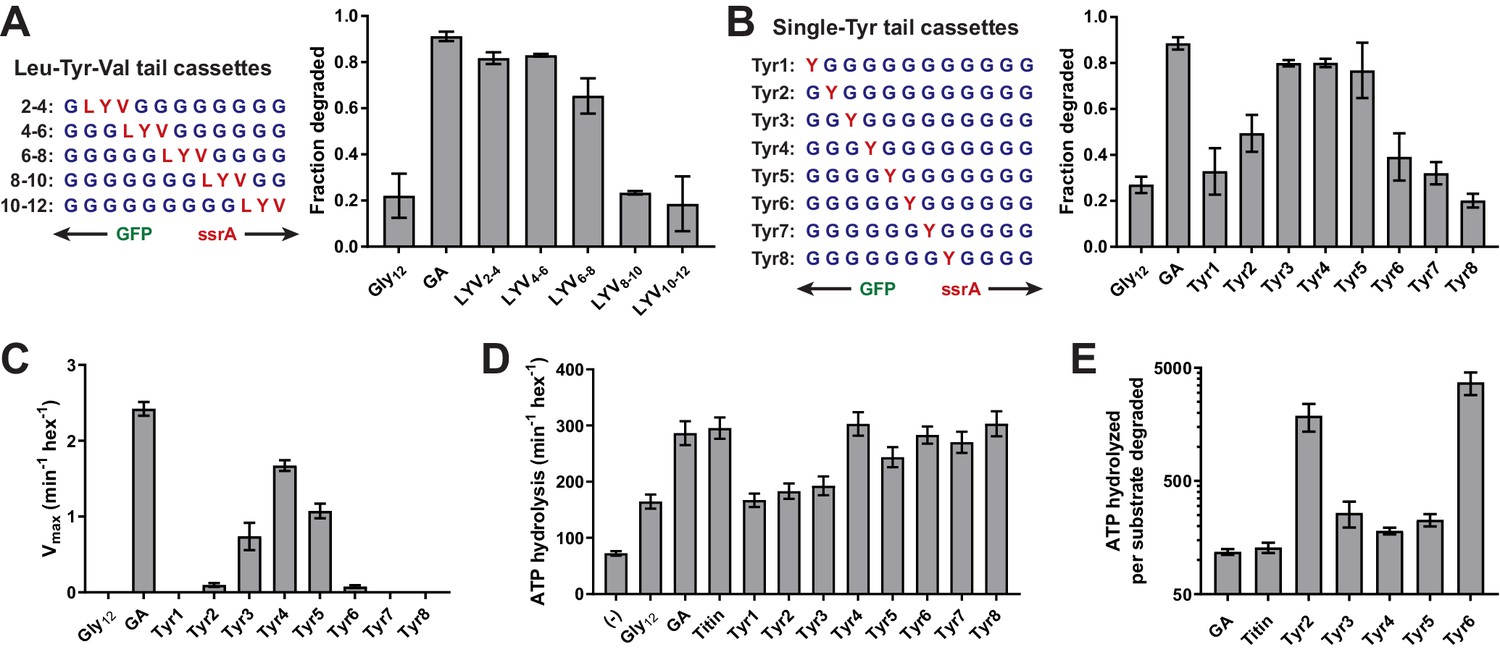
A small subset of tail residues mediate grip during GFP unfolding.
(A) Fraction intracellular degradation for substrates with tails containing LYV tripeptides in otherwise all-glycine cassettes. Gly12 and GA substrates were included as internal controls. (B) Fraction intracellular degradation for substrates with tails containing one tyrosine (Y) in otherwise all-glycine cassettes. Gly12 and GA substrates were included as internal controls. (C) Vmax values from Michaelis-Menten analysis of degradation of purified substrates with single-tyrosine cassettes. (D) Rates of ATP hydrolysis by ClpXΔN (0.1 μM hexamer) in the presence of ClpP (0.3 μM 14-mer) in the absence (–) or presence of different substrates (15 μM monomer). (E) ATP cost of degrading substrates with single-tyrosine cassettes. Note that the Y-axis is logarithmic. In all panels, values represent averages (± S.D.) of three biological replicates.
-
Figure 2—source data 1
Stimulation of ClpXP ATP hydrolysis by purified substrates.
Values are averages of three biological replicates ± S.D.
- https://doi.org/10.7554/eLife.46808.009
Figure 2—figure supplement 1
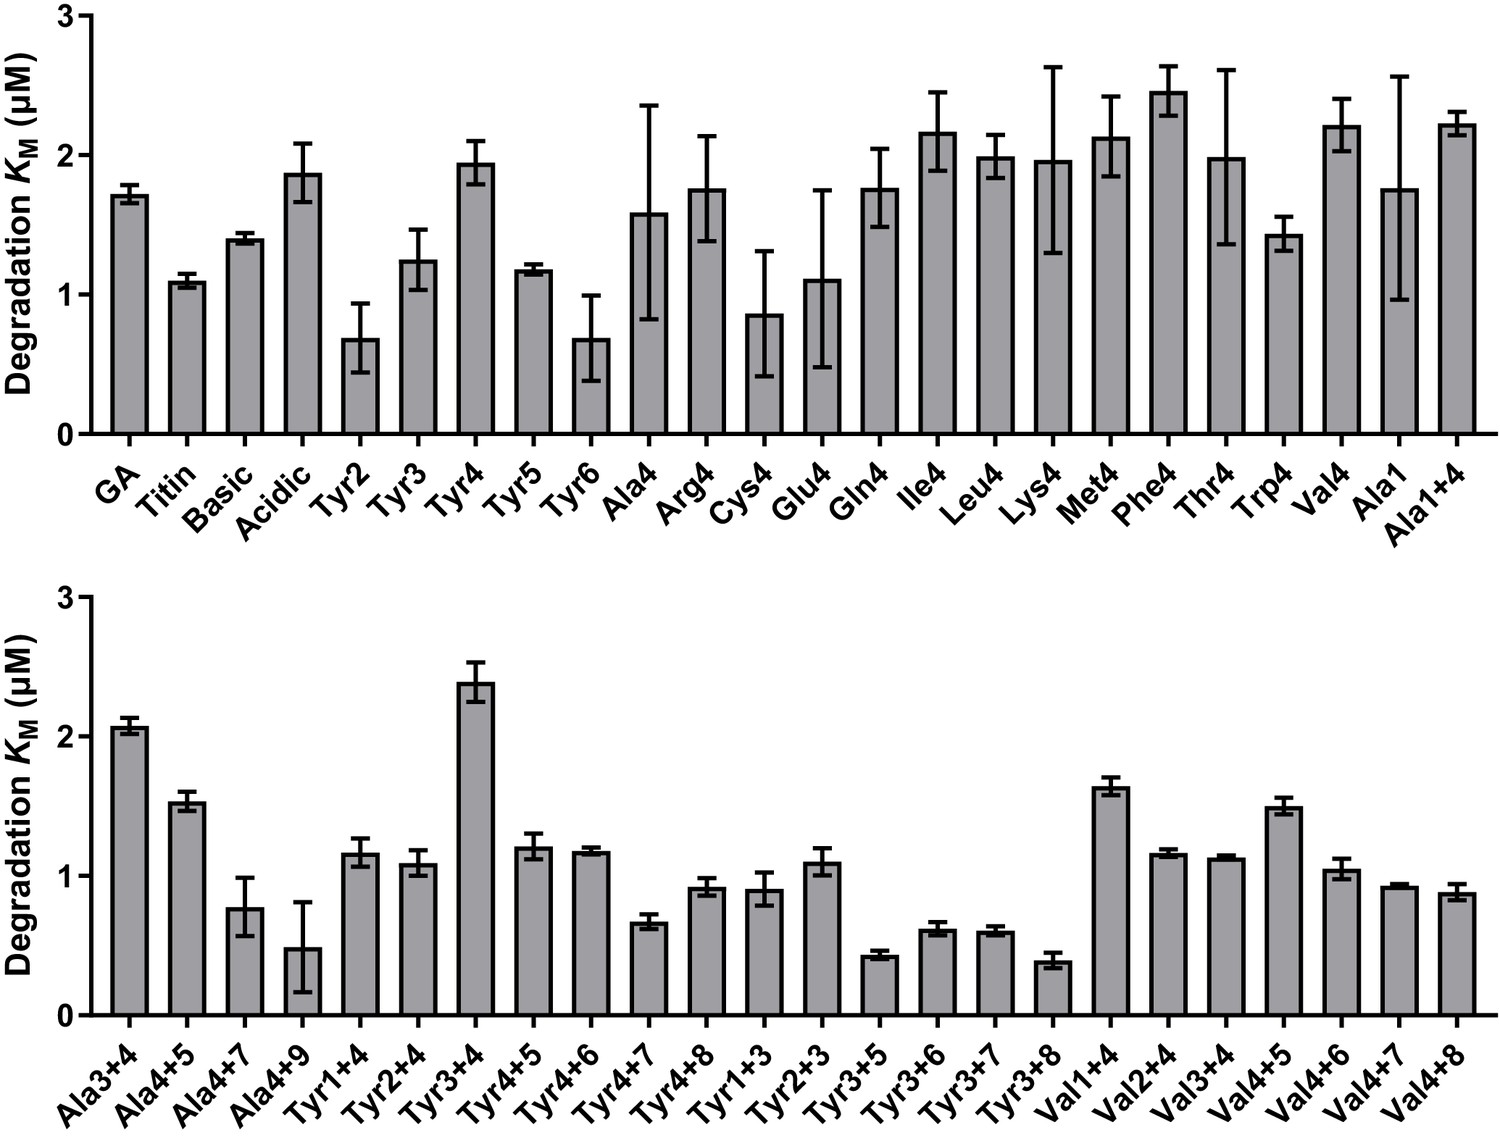
Comparison of KM values for substrates tested in vitro; comparison of fitted values for KM for substrate degradation.
Values are the average of three biological replicates ± S.D. None of the substrates exhibited a substantial increase in KM, indicating that differences in degradation rates result from differences in grip rather than in initial substrate recognition.
Figure 2—figure supplement 2

Stimulation of ClpXP ATP hydrolysis by purified substrates.
(A) Rates of ATP hydrolysis by ClpXΔN (0.1 μM hexamer) in the presence of ClpP (0.3 μM 14-mer) in the absence (–) or presence of different substrates (15 μM monomer). (B) ATP cost of degrading substrates. In both panels, values represent averages (± S.D.) of three biological replicates.
Figure 3
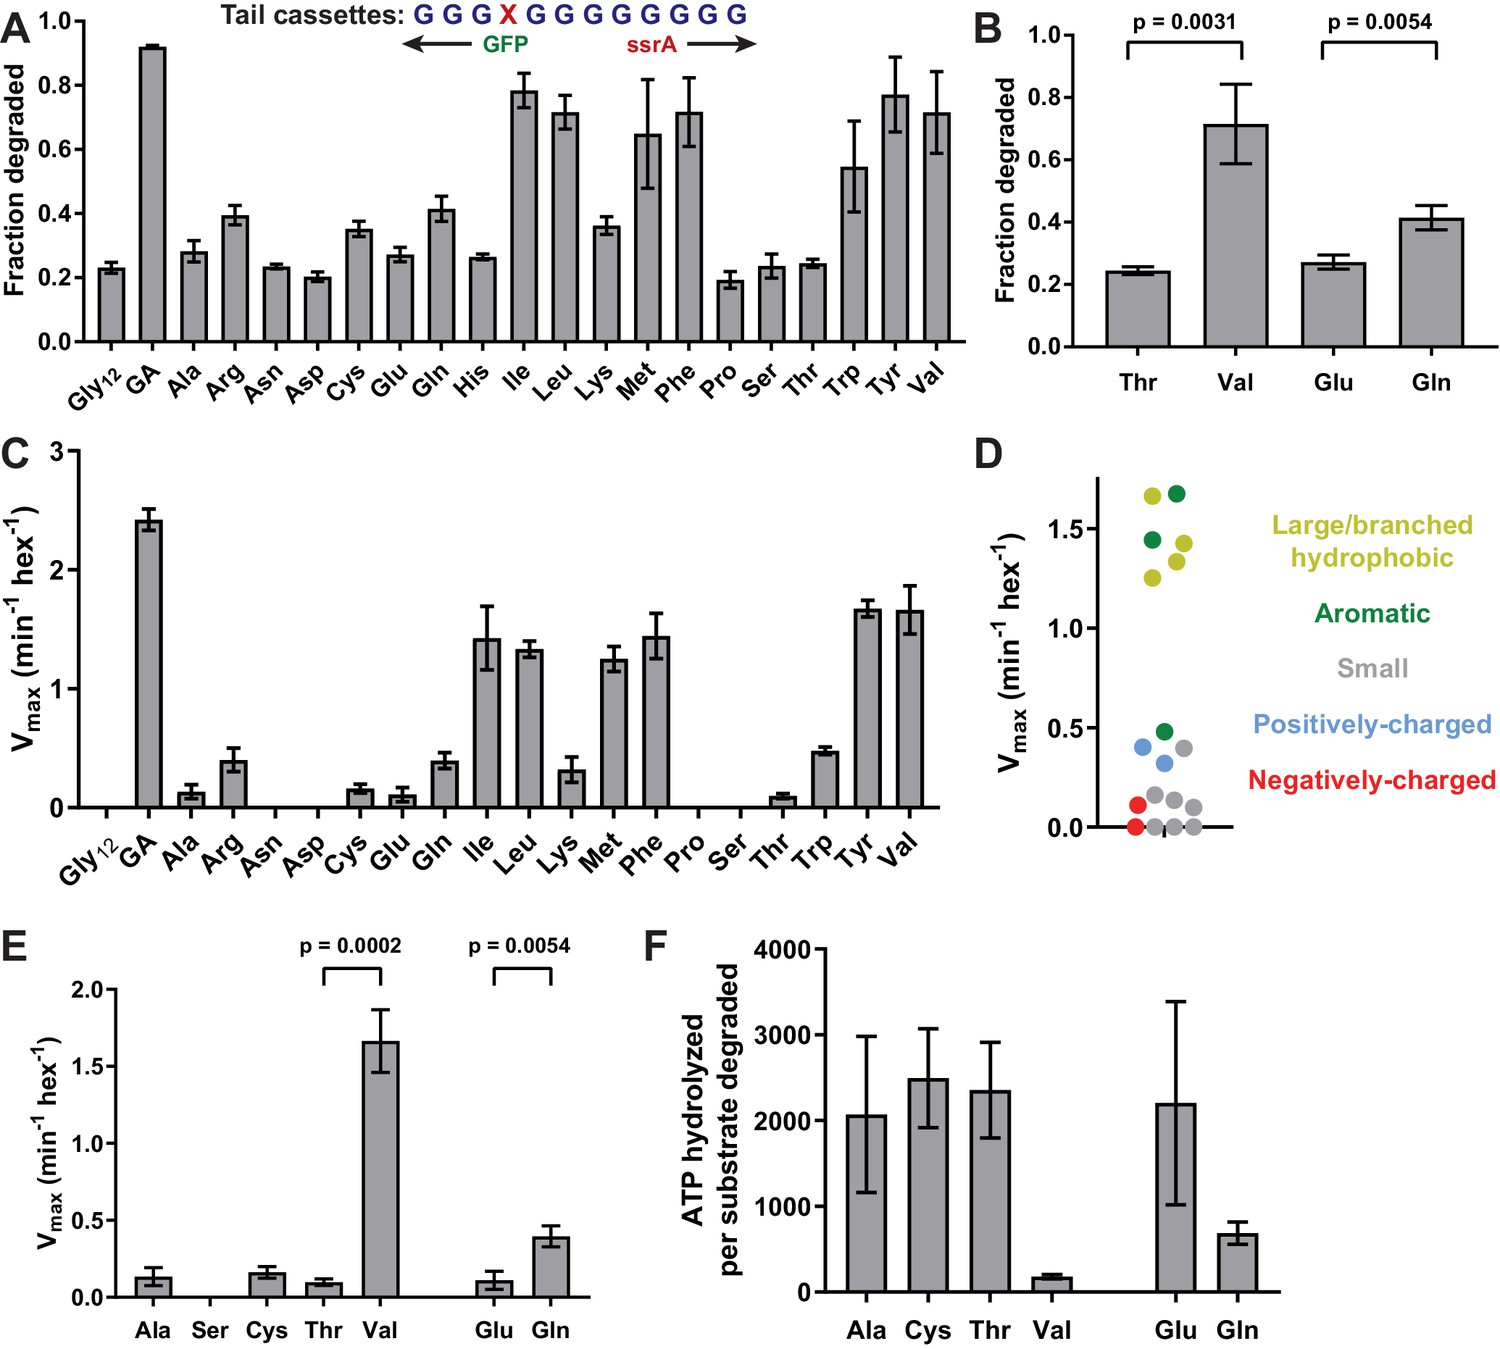
Side-chain grip effects at tail-position 4.
(A) In substrates with otherwise all-glycine cassettes, fraction intracellular degradation depends on side-chain identity at tail-position 4. (B) Comparison of degradation in vivo for substrates with Thr or Val at tail-position four or Glu or Gln at tail-position 4 (Student’s two-tailed t-test significance; Val/Thr: t = 6.37, df = 4; Glu/Gln: t = 5.47, df = 4). (C) Vmax values from Michaelis-Menten analysis of degradation of purified substrates. (D) Effects of position-4 residues, color-coded by side-chain properties, on Vmax. (E) Comparison of degradation in vitro between substrates with Ala, Ser, Cys, Thr, or Val at tail-position four or Glu or Gln at tail-position 4 (Student’s two-tailed t-test significance; Val/Thr: t = 13.3, df = 4; Glu/Gln: t = 5.49, df = 4). (F) ATP cost of degrading substrates with Ala, Cys, Thr, Val, Glu, or Gln at tail-position 4. With the exception of panel A, where Gly12 and GA values represent averages (± S.D.) of nine biological replicates, all values represent three biological replicates.
Figure 4 with 1 supplement

Multiple substrate residues contribute synergistically to grip.
(A) GA and Ala-4 cassette sequences. A heatmap of Vmax values from Figure 2C is overlaid to show contribution of single tyrosine residues as each tail position. (B) Fraction intracellular degradation of substrates with one alanine at tail-position 4 and a second alanine at a variable position in otherwise all-glycine cassettes. (C) Comparison of intracellular degradation for a subset of substrates, including Ala-1. (D) Vmax values from Michaelis-Menten analysis of degradation of purified substrates. (E and F) Michaelis-Menten Vmax values for purified substrates with one tyrosine (E) or valine (F) at tail-position four and a second tyrosine (E) or valine (F) at each tail position in otherwise all-glycine cassettes. Overlaid dashed lines indicate degradation rate for the parental Tyr-4 (E) or Val-4 (F) substrates. In all panels, values represent averages (± S.D.) of three biological replicates.
Figure 4—figure supplement 1
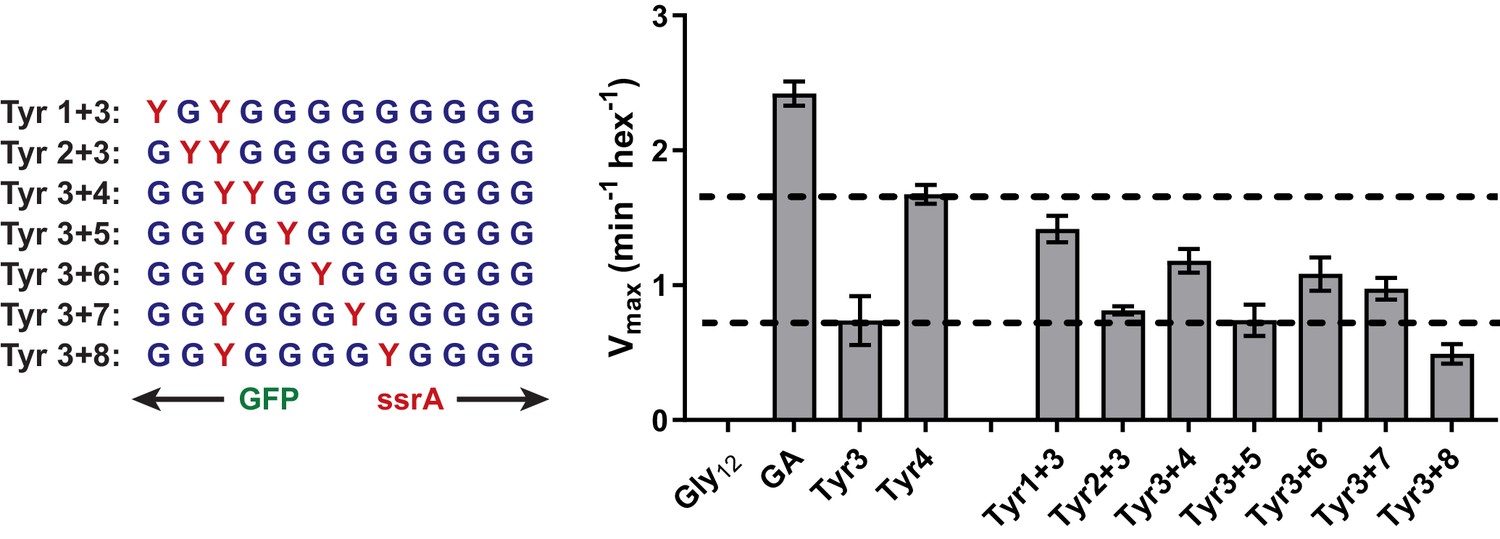
Degradation of Dual-Tyr substrates centered at tail position 3.
Vmax values for degradation from Michaelis-Menten analysis of purified substrates with one tyrosine at tail-position three and a second tyrosine at a variable position in otherwise all-glycine cassettes.
Relative degradation for substrate tails with a single Tyr residue at position 3 or 4 indicated by dashed lines. Values represent averages (± S.D.) of three biological replicates.
Figure 5
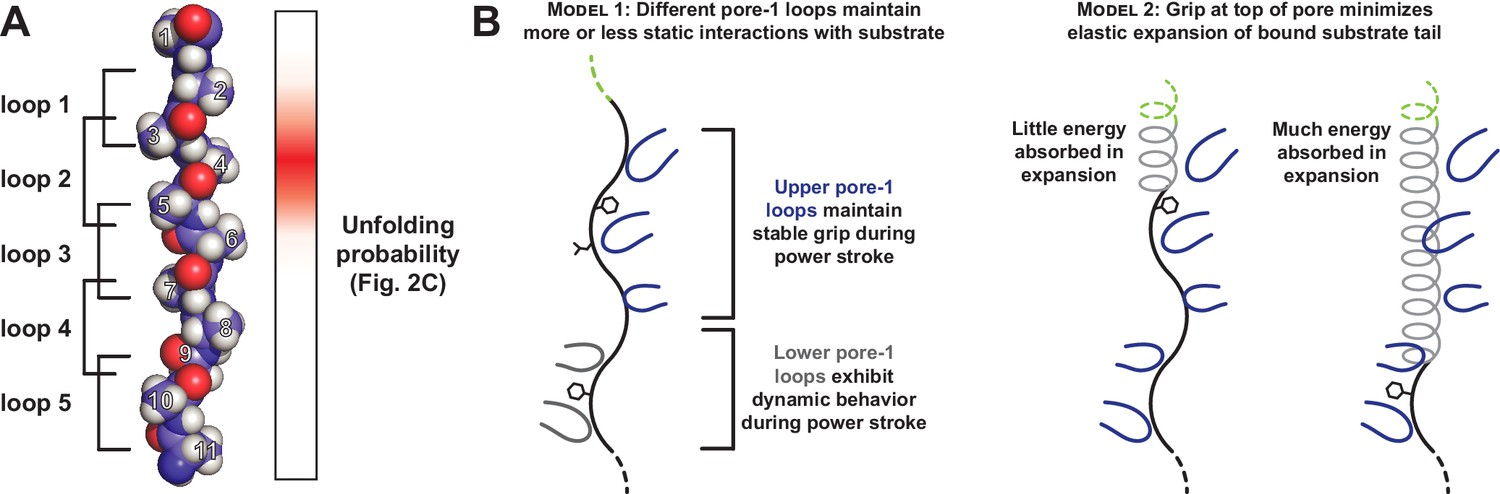
Only a subset of pore-1 loops in ClpX appear to mediate substrate grip.
(A) Model of an extended poly-alanine substrate in the axial pore of ClpX and its interactions with different pore-1 loops based on cryo-EM structures of ClpXP (X.Fei, T.A. Bell, B.M. Stinson, S. Jenni, T.A. Baker, S.C. Harrison, and R.T. Sauer, in preparation). Similar loop-substrate interactions are observed in the yeast AAA+ protease Yme1 (Puchades et al., 2017). On the right, a heatmap of Vmax values from Figure 2C is shown. The substrate tail residues are numbered relative to where a folded domain would be expected to sit at the apical surface of the AAA+ ring during unfolding. Tail residues 2–6, which promote strong grip in ClpX, are positioned to interact with the three pore-1 loops at the top of the axial pore. (B) Two models for asymmetric contribution of pore-1 loops to substrate grip.
Tables
Table 1
Degradation of variable-tail substrates in the bacterial cytoplasm.
Sequences of all substrate tails tested and the extent of degradation by ClpXΔNP in E. coli after 35 min. For substrates tested in multiple panels, the value presented is from the panel in which they first appear. Values are the average of three biological replicates ± S.D.
| Substrate | Variable tail sequence | Fraction degraded in vivo |
|---|---|---|
| Gly12 | GGGG GGGG GGGG | 0.20 ± 0.05 |
| GA | AGAG GGAG AGGA | 0.88 ± 0.07 |
| Titin | HLGL IEVE KPLY | 0.78 ± 0.01 |
| Basic | GKGR GKGR GKGR | 0.83 ± 0.05 |
| Acidic | GEGD GEGD GEGD | 0.96 ± 0.01 |
| LYV2-4 | GLYV GGGG GGGG | 0.82 ± 0.03 |
| LYV4-6 | GGGL YVGG GGGG | 0.83 ± 0.01 |
| LYV6-8 | GGGG GLYV GGGG | 0.65 ± 0.08 |
| LYV8-10 | GGGG GGGL YVGG | 0.23 ± 0.01 |
| LYV10-12 | GGGG GGGG GLYV | 0.2 ± 0.1 |
| Tyr1 | YGGG GGGG GGGG | 0.3 ± 0.1 |
| Tyr2 | GYGG GGGG GGGG | 0.49 ± 0.08 |
| Tyr3 | GGYG GGGG GGGG | 0.80 ± 0.01 |
| Tyr4 | GGGY GGGG GGGG | 0.80 ± 0.02 |
| Tyr5 | GGGG YGGG GGGG | 0.8 ± 0.1 |
| Tyr6 | GGGG GYGG GGGG | 0.4 ± 0.1 |
| Tyr7 | GGGG GGYG GGGG | 0.32 ± 0.05 |
| Tyr8 | GGGG GGGY GGGG | 0.20 ± 0.03 |
| Ala4 | GGGA GGGG GGGG | 0.28 ± 0.03 |
| Arg4 | GGGR GGGG GGGG | 0.39 ± 0.03 |
| Asn4 | GGGN GGGG GGGG | 0.23 ± 0.01 |
| Asp4 | GGGD GGGG GGGG | 0.20 ± 0.02 |
| Cys4 | GGGC GGGG GGGG | 0.35 ± 0.02 |
| Glu4 | GGGE GGGG GGGG | 0.27 ± 0.02 |
| Gln4 | GGGQ GGGG GGGG | 0.41 ± 0.04 |
| His4 | GGGH GGGG GGGG | 0.26 ± 0.01 |
| Ile4 | GGGI GGGG GGGG | 0.78 ± 0.05 |
| Leu4 | GGGL GGGG GGGG | 0.7 ± 0.1 |
| Lys4 | GGGK GGGG GGGG | 0.36 ± 0.02 |
| Met4 | GGGM GGGG GGGG | 0.6 ± 0.2 |
| Phe4 | GGGF GGGG GGGG | 0.7 ± 0.1 |
| Pro4 | GGGP GGGG GGGG | 0.19 ± 0.03 |
| Ser4 | GGGS GGGG GGGG | 0.24 ± 0.04 |
| Thr4 | GGGT GGGG GGGG | 0.24 ± 0.01 |
| Trp4 | GGGW GGGG GGGG | 0.5 ± 0.1 |
| Val4 | GGGV GGGG GGGG | 0.7 ± 0.1 |
| Ala1 | AGGG GGGG GGGG | 0.41 ± 0.03 |
| Ala1 + 4 | AGGA GGGG GGGG | 0.84 ± 0.03 |
| Ala2 + 4 | GAGA GGGG GGGG | 0.88 ± 0.01 |
| Ala3 + 4 | GGAA GGGG GGGG | 0.88 ± 0.01 |
| Ala4 + 5 | GGGA AGGG GGGG | 0.87 ± 0.02 |
| Ala4 + 6 | GGGA GAGG GGGG | 0.7 ± 0.1 |
| Ala4 + 7 | GGGA GGAG GGGG | 0.51 ± 0.09 |
| Ala4 + 8 | GGGA GGGA GGGG | 0.31 ± 0.04 |
| Ala4 + 9 | GGGA GGGG AGGG | 0.24 ± 0.07 |
| Ala4 + 10 | GGGA GGGG GAGG | 0.29 ± 0.07 |
| Ala4 + 11 | GGGA GGGG GGAG | 0.33 ± 0.06 |
| Ala4 + 12 | GGGA GGGG GGGA | 0.31 ± 0.04 |
Table 2
Degradation of purified variable-tail substrates in vitro.
Fitted parameters from Michaelis-Menten analysis of substrate degradation by ClpXΔNP. No fit – substrate degradation too slow to be accurately fit. Values are the average of three biological replicates ± S.D.
| Substrate | Vmax (min−1 hex−1) | KM (μM) |
|---|---|---|
| Gly12 | No fit | |
| GA | 2.4 ± 0.1 | 1.7 ± 0.1 |
| Titin | 2.3 ± 0.2 | 1.1 ± 0.1 |
| Basic | 1.1 ± 0.1 | 1.4 ± 0.1 |
| Acidic | 2.7 ± 0.3 | 1.9 ± 0.2 |
| Tyr1 | No fit | |
| Tyr2 | 0.10 ± 0.03 | 0.7 ± 0.2 |
| Tyr3 | 0.7 ± 0.2 | 1.3 ± 0.2 |
| Tyr4 | 1.7 ± 0.1 | 1.9 ± 0.2 |
| Tyr5 | 1.1 ± 0.1 | 1.2 ± 0.1 |
| Tyr6 | 0.08 ± 0.02 | 0.7 ± 0.3 |
| Tyr7 | No fit | |
| Tyr8 | No fit | |
| Ala4 | 0.13 ± 0.06 | 1.6 ± 0.8 |
| Arg4 | 0.4 ± 0.1 | 1.8 ± 0.4 |
| Asn4 | No fit | |
| Asp4 | No fit | |
| Cys4 | 0.16 ± 0.04 | 0.9 ± 0.4 |
| Glu4 | 0.11 ± 0.06 | 1.1 ± 0.6 |
| Gln4 | 0.40 ± 0.07 | 1.8 ± 0.3 |
| Ile4 | 1.4 ± 0.3 | 2.2 ± 0.3 |
| Leu4 | 1.3 ± 0.1 | 2.0 ± 0.2 |
| Lys4 | 0.3 ± 0.1 | 2.0 ± 0.7 |
| Met4 | 1.3 ± 0.1 | 2.1 ± 0.3 |
| Phe4 | 1.4 ± 0.2 | 2.5 ± 0.2 |
| Pro4 | No fit | |
| Ser4 | No fit | |
| Thr4 | 0.10 ± 0.02 | 2.0 ± 0.6 |
| Trp4 | 0.48 ± 0.03 | 1.4 ± 0.1 |
| Val4 | 1.7 ± 0.2 | 2.2 ± 0.2 |
| Ala1 | 0.19 ± 0.04 | 1.8 ± 0.8 |
| Ala1 + 4 | 2.3 ± 0.2 | 2.2 ± 0.1 |
| Ala3 + 4 | 2.4 ± 0.1 | 2.1 ± 0.1 |
| Ala4 + 5 | 1.7 ± 0.2 | 1.5 ± 0.1 |
| Ala4 + 7 | 0.38 ± 0.09 | 0.8 ± 0.2 |
| Ala4 + 9 | 0.09 ± 0.04 | 0.5 ± 0.3 |
| Tyr1 + 4 | 1.5 ± 0.1 | 1.2 ± 0.1 |
| Tyr2 + 4 | 2.1 ± 0.1 | 1.1 ± 0.1 |
| Tyr3 + 4 | 1.2 ± 0.1 | 2.4 ± 0.1 |
| Tyr4 + 5 | 1.4 ± 0.2 | 1.2 ± 0.1 |
| Tyr4 + 6 | 2.4 ± 0.2 | 1.2 ± 0.1 |
| Tyr4 + 7 | 1.0 ± 0.1 | 0.67 ± 0.05 |
| Tyr4 + 8 | 2.0 ± 0.3 | 0.92 ± 0.06 |
| Tyr1 + 3 | 1.4 ± 0.1 | 0.9 ± 0.1 |
| Tyr2 + 3 | 0.81 ± 0.03 | 1.1 ± 0.1 |
| Tyr3 + 5 | 0.7 ± 0.1 | 0.43 ± 0.03 |
| Tyr3 + 6 | 1.1 ± 0.1 | 0.62 ± 0.05 |
| Tyr3 + 7 | 0.97 ± 0.08 | 0.61 ± 0.03 |
| Tyr3 + 8 | 0.49 ± 0.07 | 0.39 ± 0.06 |
| Val1 + 4 | 2.3 ± 0.1 | 1.6 ± 0.1 |
| Val2 + 4 | 1.8 ± 0.1 | 1.2 ± 0.1 |
| Val3 + 4 | 1.6 ± 0.1 | 1.1 ± 0.1 |
| Val4 + 5 | 2.1 ± 0.1 | 1.5 ± 0.1 |
| Val4 + 6 | 1.4 ± 0.1 | 1.1 ± 0.1 |
| Val4 + 7 | 1.3 ± 0.1 | 0.93 ± 0.01 |
| Val4 + 8 | 1.0 ± 0.1 | 0.88 ± 0.06 |
Key resources table
| Reagent type (species) or resource | Designation | Source or reference | Identifiers | Additional information |
|---|---|---|---|---|
| Cell line (Escherichia coli) | E. coli T7 Express ΔclpA ΔclpP ΔclpX | this paper | E. coli strain lacking the ClpA, ClpP, and ClpX genes. progenitor: E. coli T7 Express (New England Biolabs #C2566) | |
| Recombinant DNA reagent | pT7 ClpXΔN(plasmid) | Martin et al., 2005 | N-terminally His6-tagged ClpXΔN (residues 62–424) for overexpression | |
| Recombinant DNA reagent | pT7 ClpP (plasmid) | Kim et al., 2000 | C-terminally His6-tagged ClpP for overexpression | |
| Recombinant DNA reagent | pBAD ClpP/ClpXΔN(plasmid) | this paper | for inducible polycistronic expression of ClpP and ClpXΔN(residues 62–424) for cytoplasmic GFP degradation assays. Progenitor: pBAD (Guzman et al., 1995; jb.177.14.4121–4130.199) | |
| Recombinant DNA reagent | pBAD null (plasmid) | this paper | control plasmid for cytoplasmic GFP degradation assays. Progenitor: pBAD (Guzman et al., 1995) | |
| Recombinant DNA reagent | ProD GFP Gly12 ssrA (plasmid) | this paper | for constitutive expression of GFP (residues 1–229) substrates with a 12xGly cassette and partial ssrA (GSENYALAA). All other substrates are derivatives of this construct with different variable cassette sequences. Progenitor: ProD Gemini (Davis et al., 2011; nar/gkq81) | |
| Recombinant DNA reagent | pT7 GFP Gly12 ssrA (plasmid) | this paper | for overexpression of N-terminally His6-tagged GFP (1-229) substrates with a 12xGly cassette and partial ssrA (GSENYALAA). All other substrates are derivatives of this construct with different variable cassette sequences. |
Additional files
-
Transparent reporting form
- https://doi.org/10.7554/eLife.46808.014
Download links
A two-part list of links to download the article, or parts of the article, in various formats.
Downloads (link to download the article as PDF)
Open citations (links to open the citations from this article in various online reference manager services)
Cite this article (links to download the citations from this article in formats compatible with various reference manager tools)
Interactions between a subset of substrate side chains and AAA+ motor pore loops determine grip during protein unfolding
eLife 8:e46808.
https://doi.org/10.7554/eLife.46808


