The cerebellum is involved in processing of predictions and prediction errors in a fear conditioning paradigm
- Essen University Hospital, Germany
- University of Duisburg-Essen, Germany
- University Hospital Cologne, Germany
- Ruhr University Bochum, Germany
Figures
Figure 1
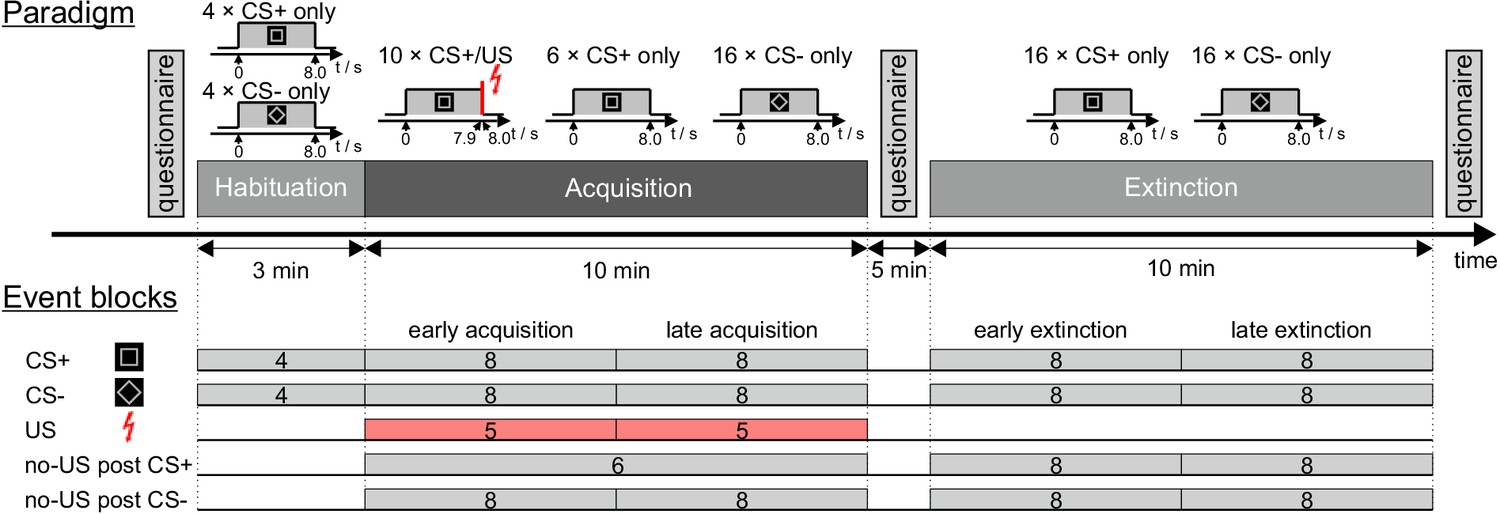
Experimental paradigm and overview of individual events.
CS = conditioned stimulus; US = unconditioned stimulus. For further details see text.
Figure 2 with 1 supplement
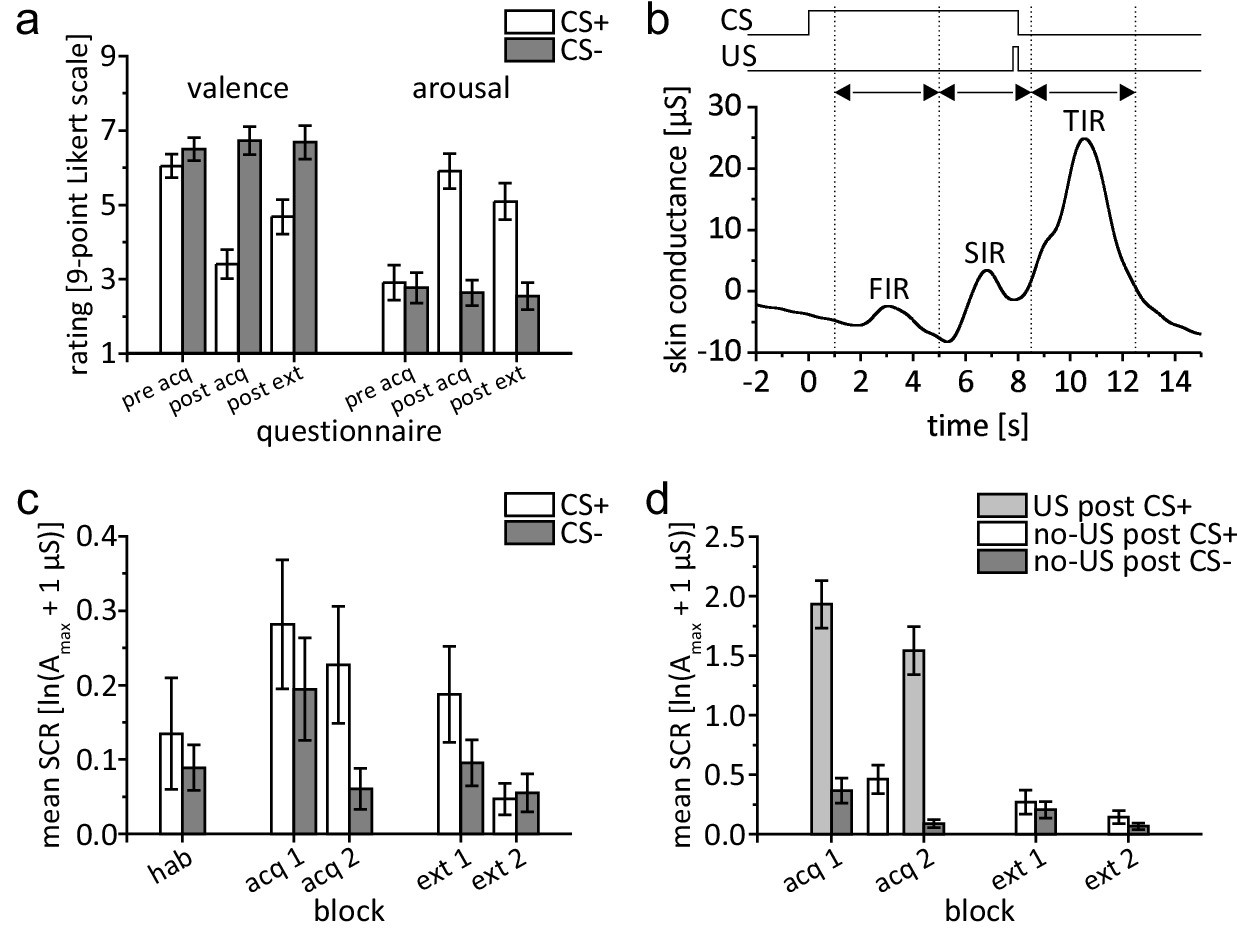
Behavioral data.
(a) Group mean valence and arousal ratings for CS+ and CS- during acquisition and extinction. (b) Example of bandpass filtered individual SCR in a paired CS+/US trial depicting response interval windows and displaying a distinct response in each interval. (c) Group mean SIR. (d) Group mean TIR. Please note the different scales of the y-axis used for illustration purposes. Error bars represent standard errors of the mean. acq 1, acq 2 = early and late acquisition; CS = conditioned stimulus; ext 1, ext 2 = early and late extinction; FIR = first interval response; hab = habituation; SCR = skin conductance response; SIR = second interval response; TIR = third interval response; US = unconditioned stimulus.
-
Figure 2—source data 1
Mean SCR data.
- https://doi.org/10.7554/eLife.46831.005
Figure 2—figure supplement 1
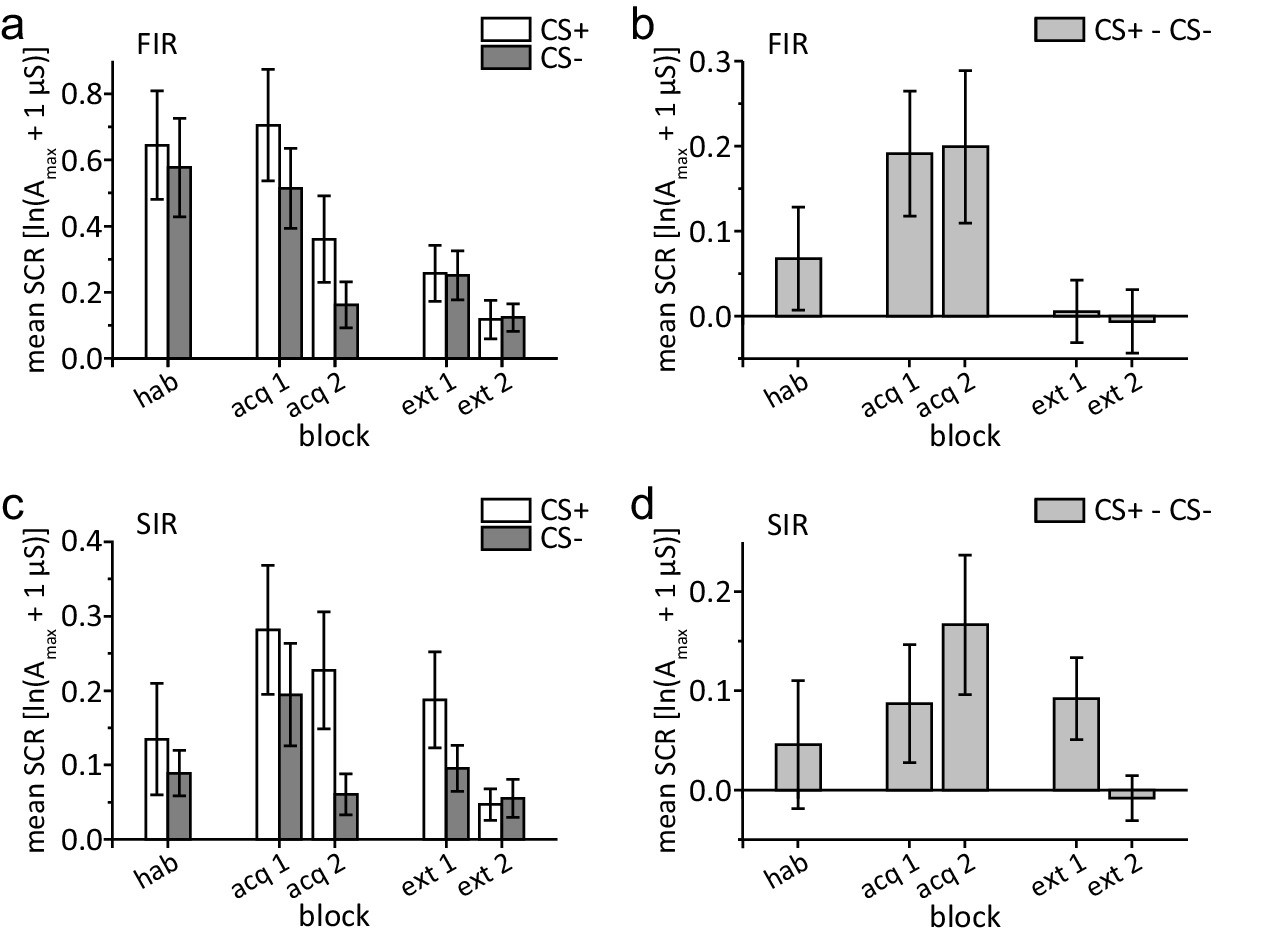
SCR related to CS presentation: FIR and SIR in comparison.
Group mean (a) FIR and (c) SIR related to the CS presentation. In (b,d) mean differences of FIR and SIR to CS+ and CS- presentations are displayed (CS+ - CS-). Note, that (c) is identical to Figure 2c in the main document. Error bars represent standard errors of the mean. acq 1, acq 2 = early and late acquisition; CS = conditioned stimulus; ext 1, ext 2 = early and late extinction; FIR = first interval response; hab = habituation; SCR = skin conductance response; SIR = second interval responses.
Figure 3 with 2 supplements
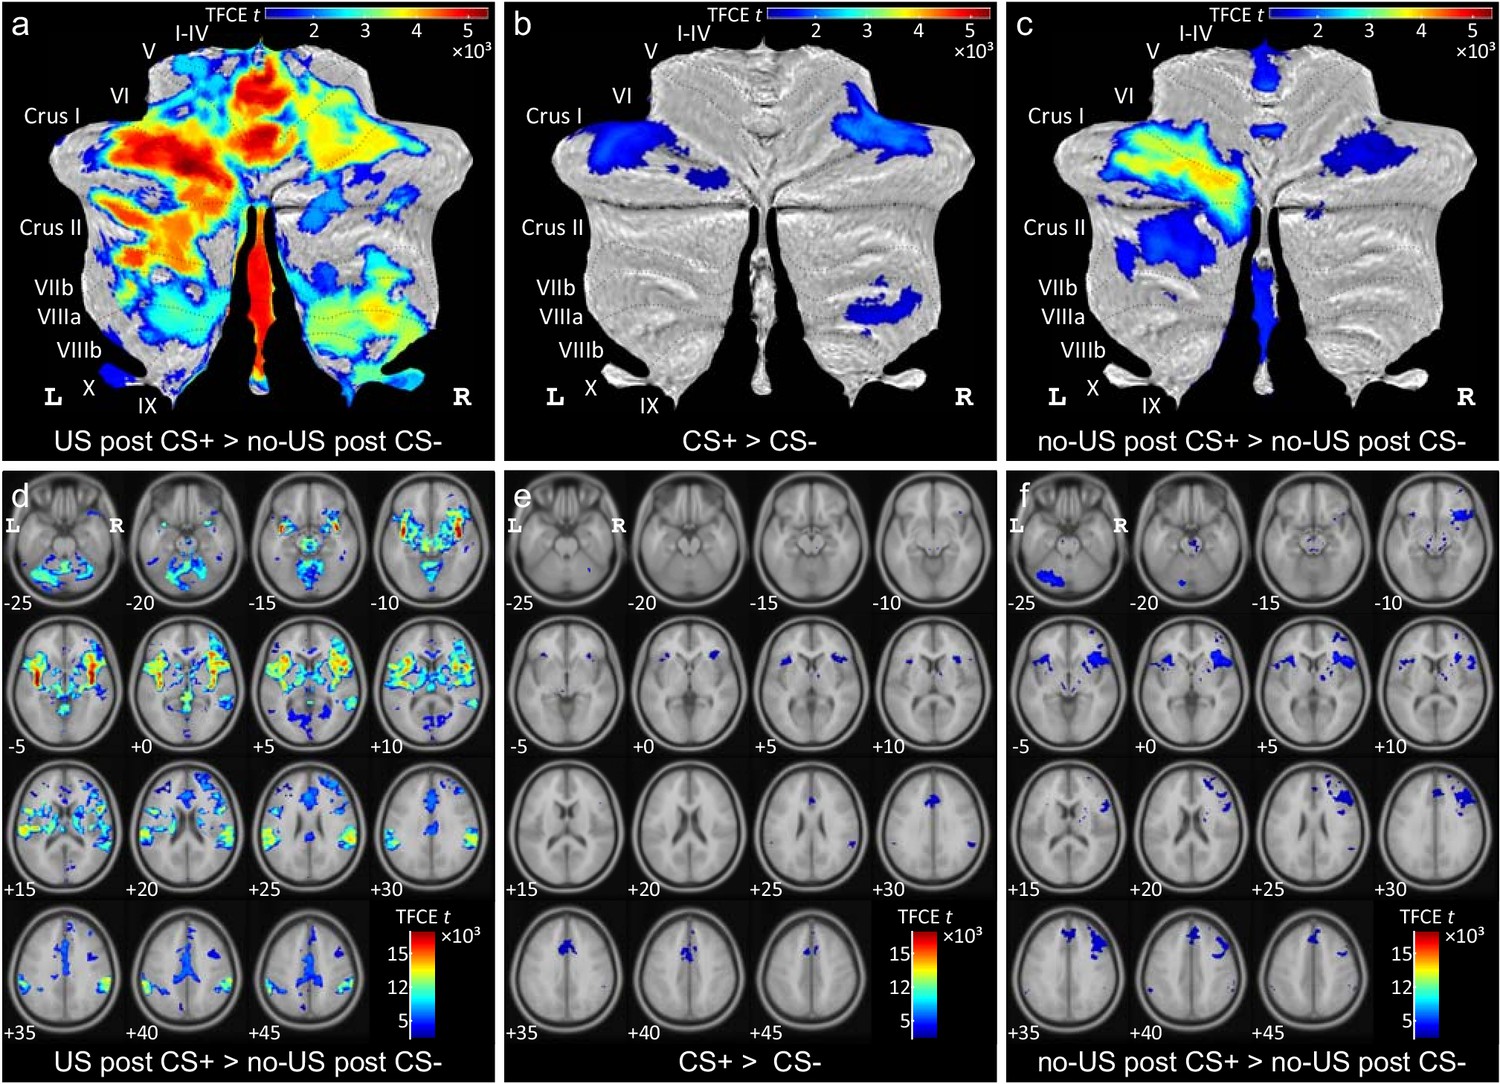
Diffential activations during fear acqusition.
(a–c) Differential cerebellar activations during fear acquisition in SUIT space projected on a cerebellar flatmap (Diedrichsen and Zotow, 2015). (d–f) Corresponding differential whole brain activations in MNI normalized space. All contrasts collapsed over early and late acquisition blocks and calculated using TFCE and familywise error correction (p<0.05). CS = conditioned stimulus; L = left; MNI = Montreal Neurological Institute standard brain; R = right; SUIT = spatially unbiased atlas template of the cerebellum; TFCE = threshold-free cluster-enhancement; US = unconditioned stimulus.
Figure 3—figure supplement 1

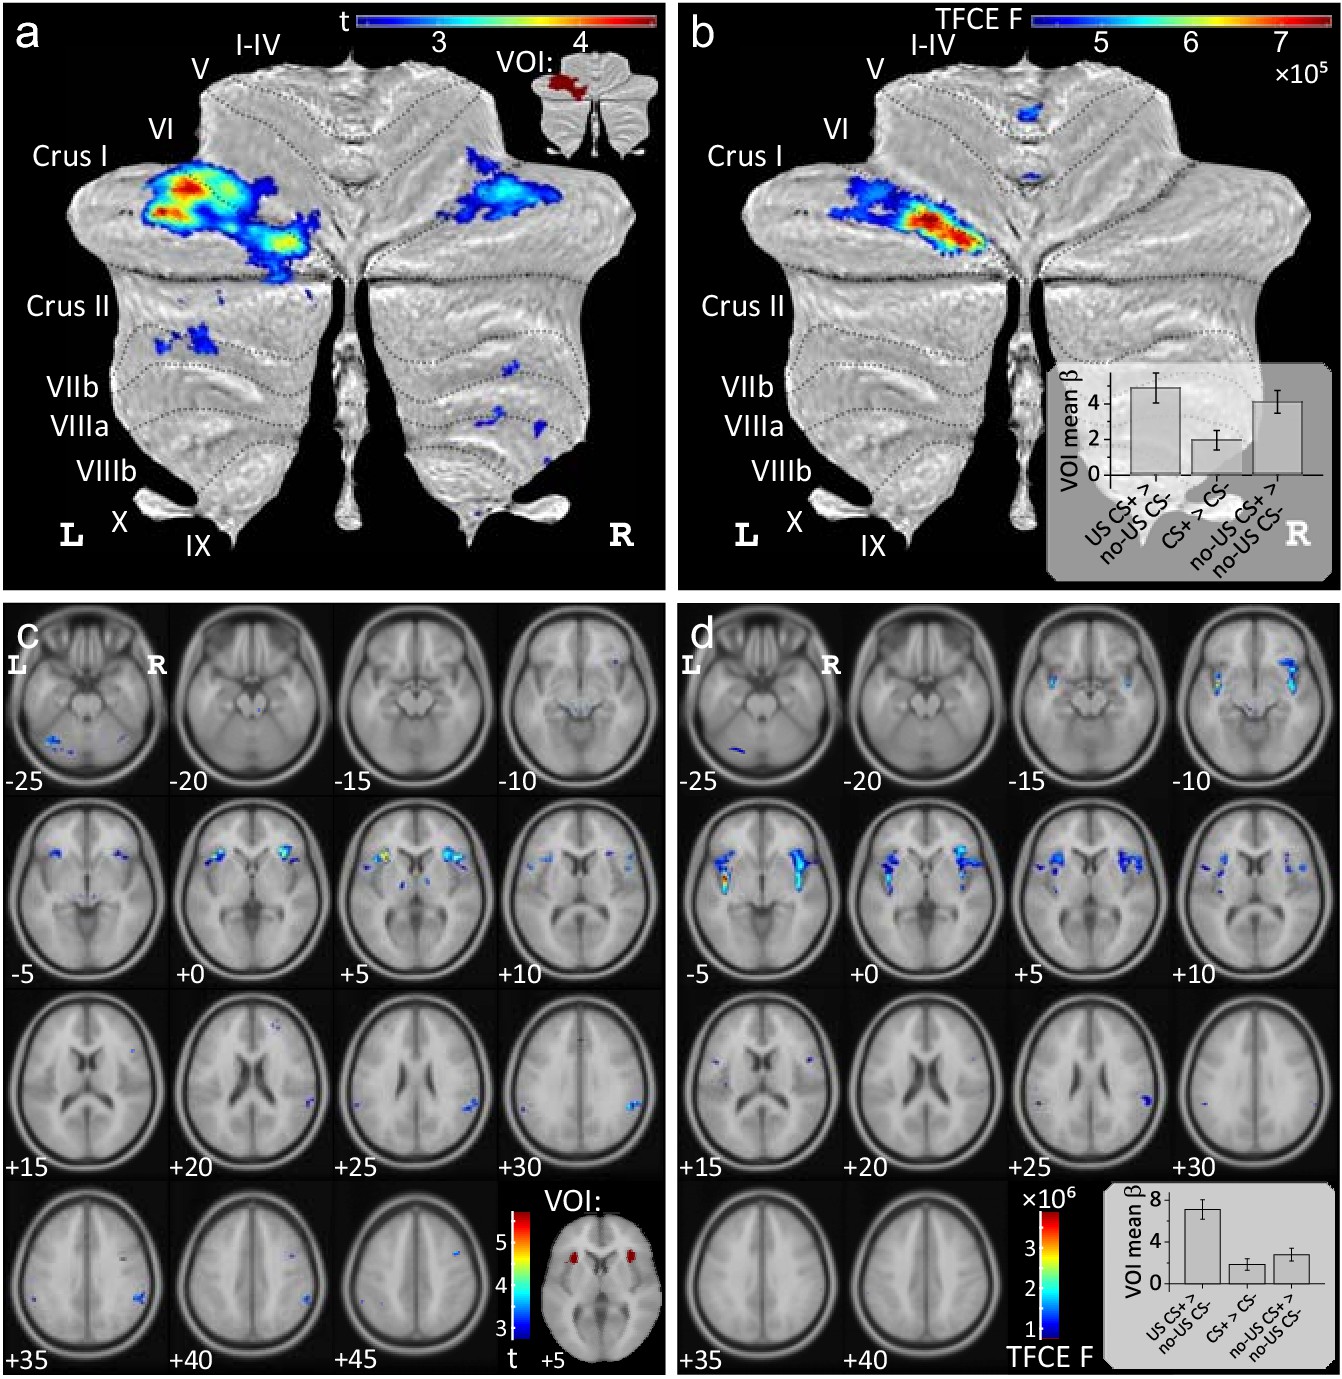
Changes in differential cerebellar activation across acquisition and extinction blocks based on F-tests.
(a) Related to the prediction of the US (contrast ‘CS+ > CS-‘), and (b) related to the omission of the US (contrast ‘no-US CS+ > no US CS-") [p<0.05 FWE corrected, using TFCE; http://dbm.neuro.uni-jena.de/tfce/]. Mean β values across blocks are shown in the inserts. Note that all no-US CS+ trials were considered as a single block which was compared first against the early and then against the late ‘no-US post CS-’ block. (c) Cerebellar activation during extinction trials considering the contrast ‘no-US CS+ > no US post CS-’ (p<0.05 FWE corrected, TFCE). CS = conditioned stimulus; FWE = familywise error; TFCE = threshold-free cluster-enhancement; US = unconditioned stimulus.
Figure 3—figure supplement 2
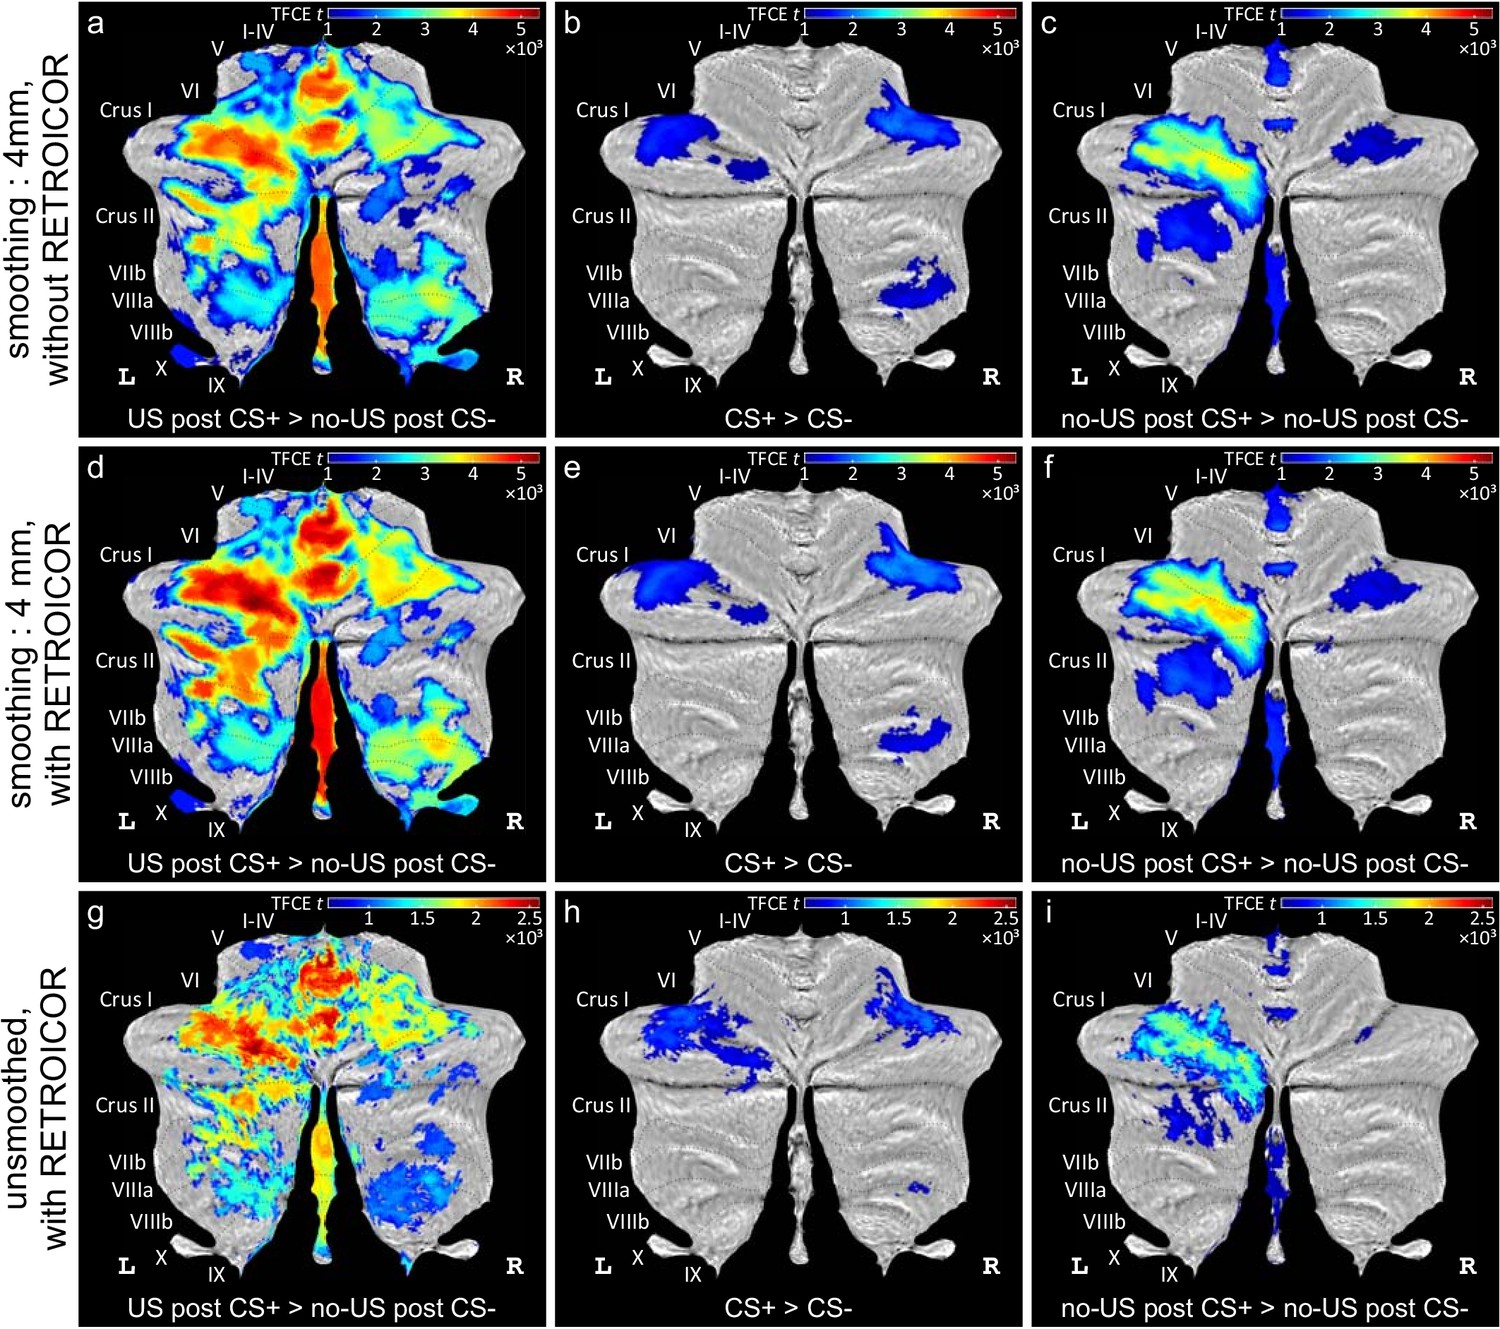
Effect of physiological denoising and smoothing kernel.
Differential cerebellar activations during fear acquisition (p<0.05 FWE corrected, TFCE) in SUIT space projected on a cerebellar flatmap (Diedrichsen and Zotow, 2015): following application of (a–c) a 4 mm smoothing kernel on the normalized functional images and without use of RETROICOR physiological denoising, (d–f) 4 mm smoothing kernel and physiological denoising, and (g–i) physiological denoising but without any smoothing. Note that data displayed in (d–f) are identical to data shown in Figure 3a–c of the main manuscript. For comparability, data overlays in (a–f) are scaled to the range of the overall minimal to maximal value. Cerebellar activation patterns were essentially unchanged. Physiological denoising and spatial smoothing, however, improved statistical power. CS = conditioned stimulus; FWE = familywise error; L = left, R = right; TFCE = threshold-free cluster-enhancement; US = unconditioned stimulus.
Figure 4 with 1 supplement
Conjunction analyses.
Conjunction analyses testing global null hypotheses (a,c) and analyses of differences (b,d) between the three contrasts ‘US post CS+ > no US post CS-', ‘CS+ > CS-’ and ‘no-US post CS+ > no US post CS-’ (shown in Figure 3) during fear acquisition. Data in (a,b) is shown in SUIT space and in (c,d) in MNI space. All contrasts displayed using FWE correction (p<0.05), (b,d) using TFCE. Bar graphs display group mean β values for each contrast considering the whole activation volume (error bars: standard error). VOI were defined based on conjunction analyses and are shown in the inserts: cerebellar VOI (a) and bilateral insula VOI (c). CS = conditioned stimulus; FWE = familywise error; TCFE = threshold-free cluster-enhancement; US = unconditioned stimulus; VOI = volumes of interest.
-
Figure 4—source data 1
Mean β data.
- https://doi.org/10.7554/eLife.46831.012
Figure 4—figure supplement 1
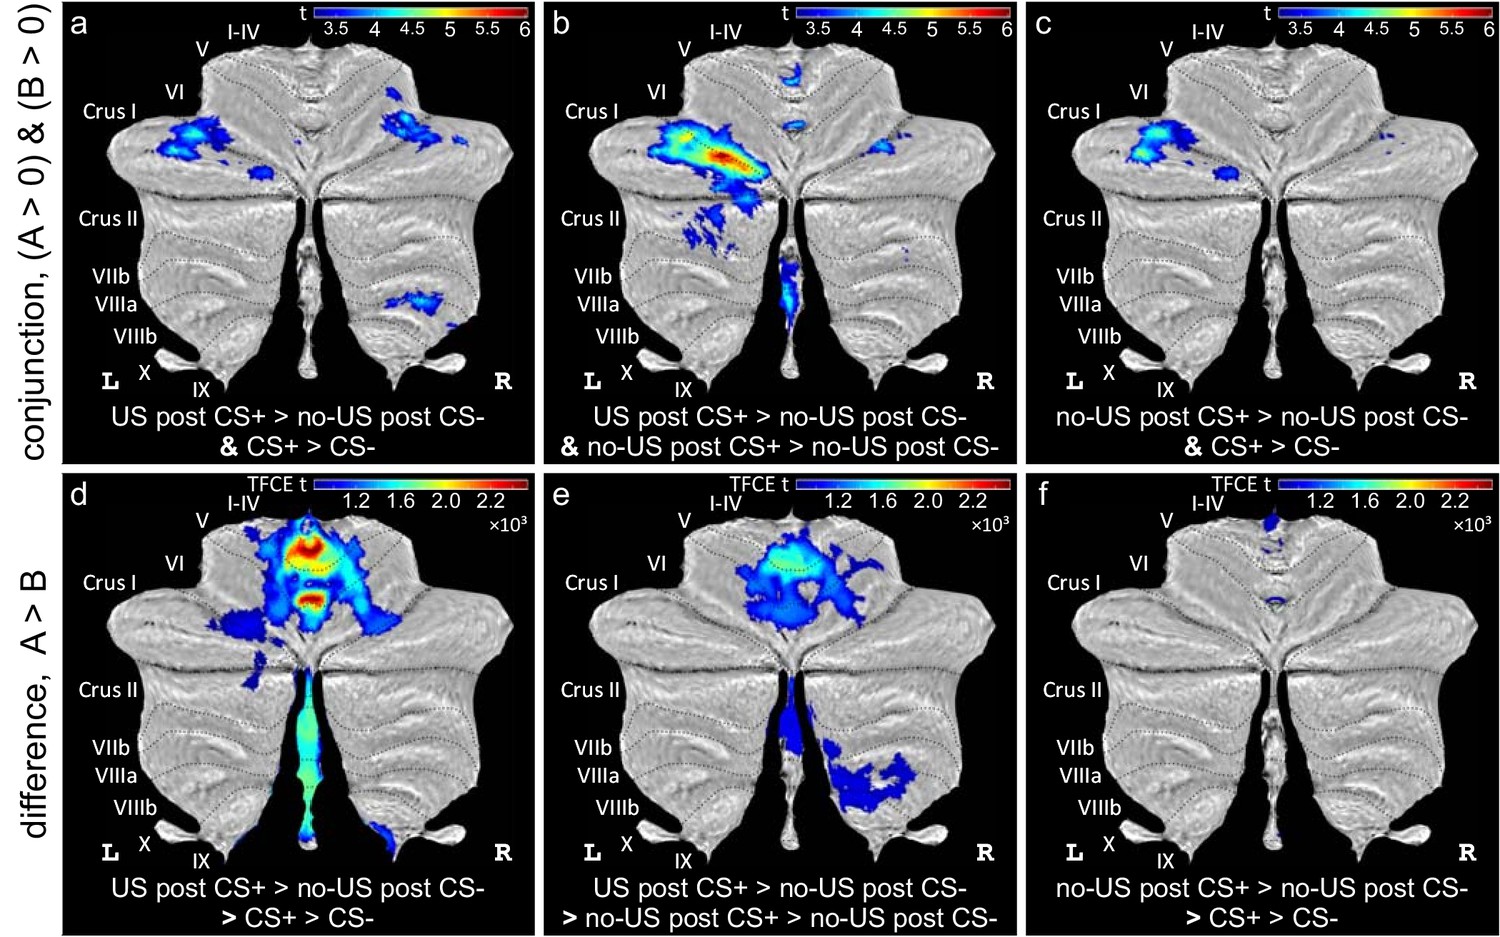
Comparison of cerebellar areas related to the presentation, the prediction and the omission of the aversive stimulus.
(a–c) Common areas of cerebellar activation considering any two of the three main acquisition contrasts as revealed by conjunction analyses testing global null hypothesis; (d–f) significant differences in activation considering any two of the three main acquisition contrasts as revealed by F-tests (using TFCE; inverse tests do not show any significant activation). All data presented at a significance level of p<0.05 FWE-corrected. CS = conditioned stimulus; FWE = familywise error; TCFE = threshold-free cluster-enhancement; US = unconditioned stimulus; VOI = volumes of interest.
Figure 5
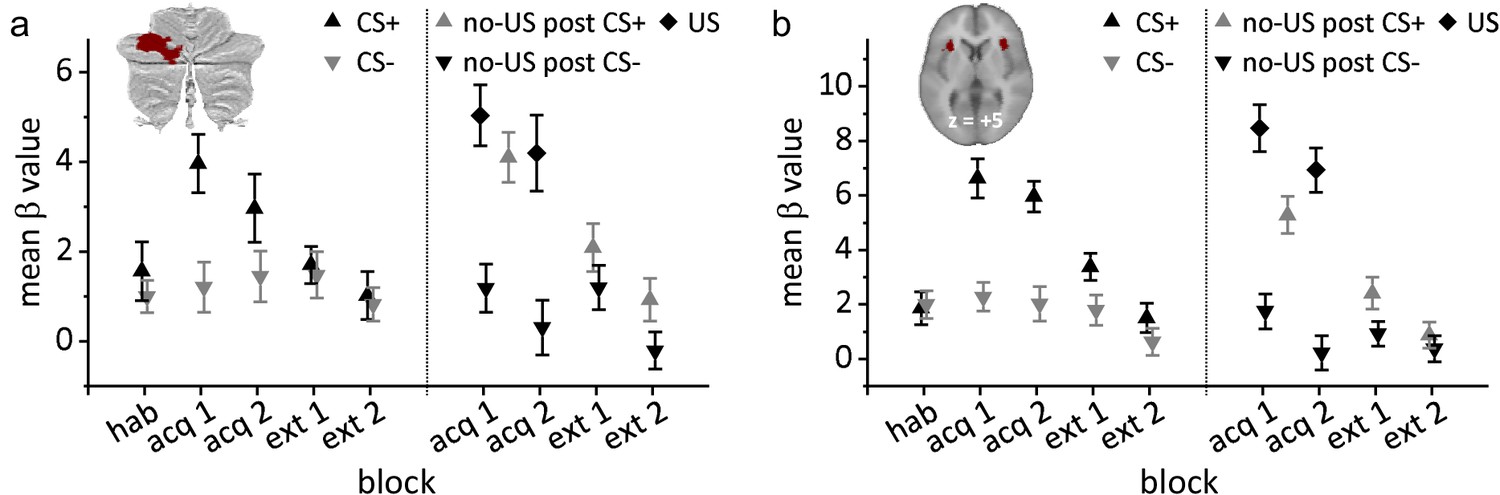
Group mean β values related to each event (presentation of US, CS+, CS-, omission of US) compared to rest.
(a) Volume of interest (VOI) in the left cerebellar hemisphere; (b) VOI in the bilateral insula. Error bars represent standard errors. acq 1, acq 2 = early and late acquisition; CS = conditioned stimulus; ext 1, ext 2 = early and late extinction; hab = habituation; US = unconditioned stimulus.
-
Figure 5—source data 1
Mean β data.
- https://doi.org/10.7554/eLife.46831.015
Figure 6 with 1 supplement
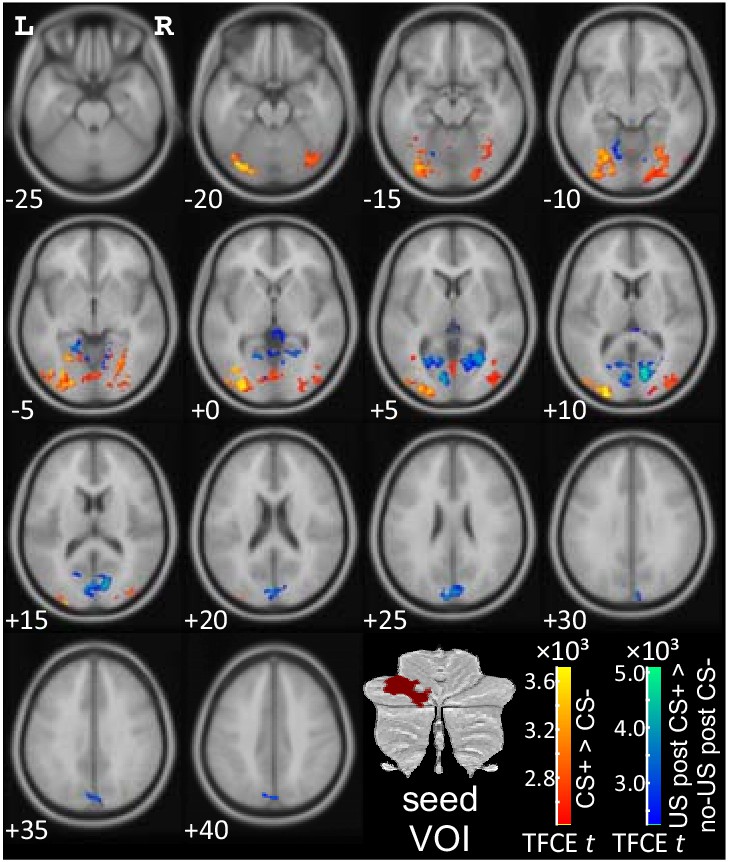
PPI analysis based on a seed region in the left lateral cerebellar cerebellum (p<0.05 FWE corrected level after TFCE application).
CS = conditioned stimulus; FWE = familywise error; L = left; PPI = psychophysiological interaction; R = right; TFCE = threshold-free cluster-enhancement; US = unconditioned stimulus; VOI = volumes of interest.
Figure 6—figure supplement 1
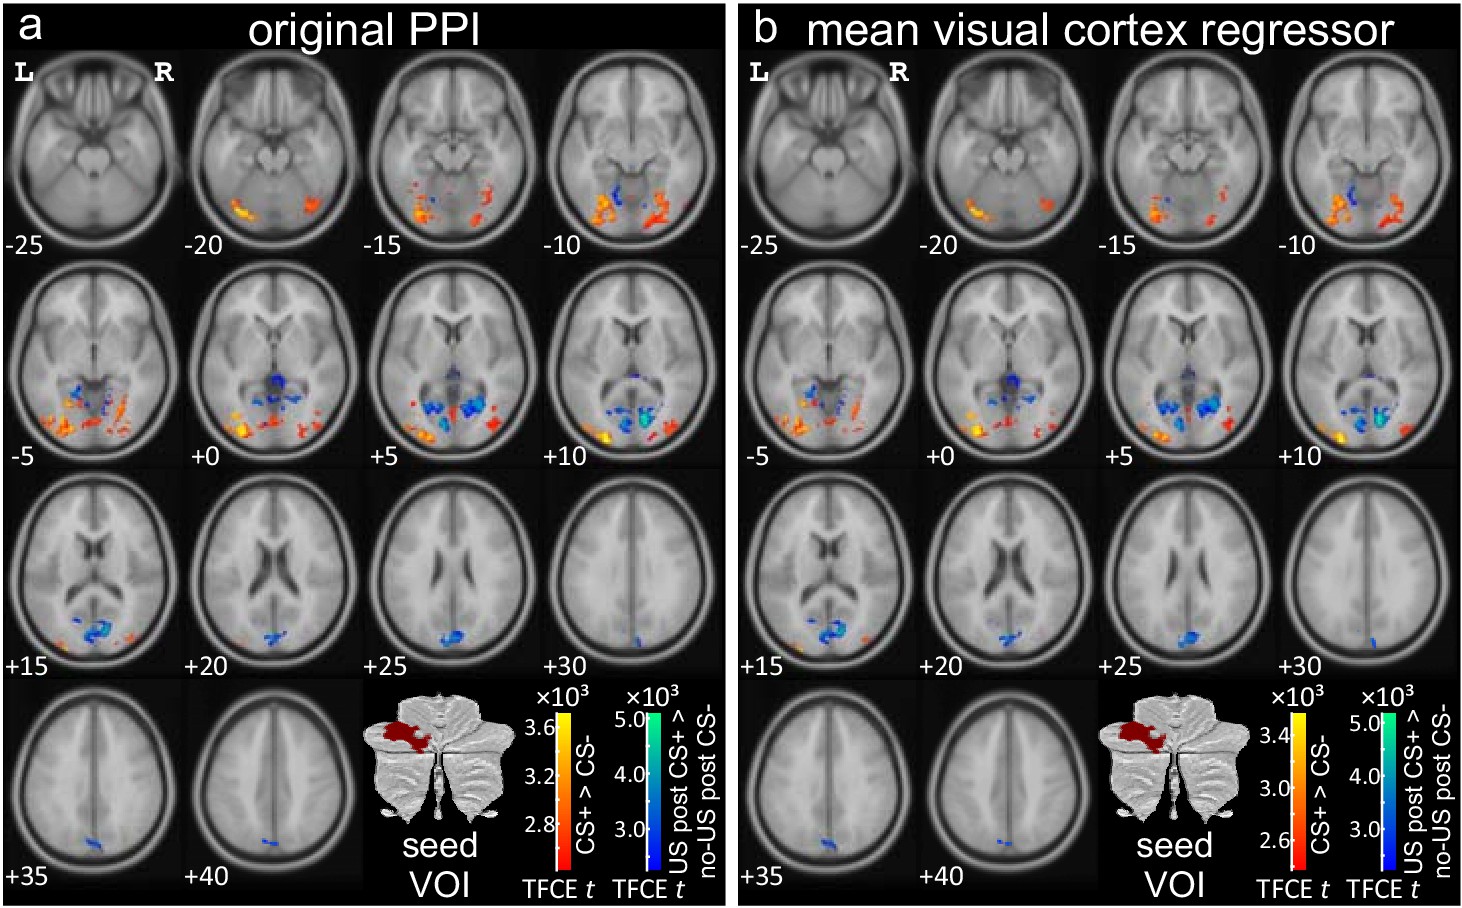
Reanalysis of PPI data to exclude "bleed over" from visual cortex.
To exclude this possibility, data were reanalyzed using the mean signal modulation in the occipital lobe as first level nuisance regressor in analogy to the method applied by Buckner et al. (2011) (b). For comparison, data of the original analysis are shown in (a), which is identical to Figure 6 in the main manuscript. Note that the main results did not change, that is functional connectivity of the cerebellum was increased with visual cortical areas when comparing CS+ with CS- trials. Data are shown at p<0.05 FWE corrected level after TFCE application. CS = conditioned stimulus; FWE = familywise error; L = left; PPI = psychophysiological interaction; R = right; TFCE = threshold-free cluster-enhancement; US = unconditioned stimulus; VOI = volumes of interest.
Tables
Table 1
Cerebellar activations during acquisition and extinction.
Displayed are all clusters of ≥20 mm3. In each cluster, up to three maxima are listed separated by ≥8 mm. Corresponding activations for whole brain analysis are summarized in Supplementary file 1 Table 5.
| Index | Location (lobule) | Side | SUIT coordinates/mm | Cluster size/mm3 | pFWE | TFCE | |||
|---|---|---|---|---|---|---|---|---|---|
| A) US post CS+ > no US post CS-: acquisition t-test, TFCE, p<0.05, FWE corr. | |||||||||
| 1 | Extended cluster | left VI (8390), white matter (7950), left Crus I (7889), right VI (6404), right V (4250), left Crus II (4223), left V (4085), right Crus I (3457), right I-IV (2761), left I-IV (2529), right VIIIa (2432), right VIIIb (2244), left VIIb (1602), left VIIIb (1583), left VIIIa (1536), right VIIb (1467), vermal VI (1368), right IX (1330), vermal VIIIa (1307), right Crus II (1034), right dentate nuc. (921), vermal IX (804), left dentate nuc. (713), left IX (628), vermal VIIIb (474), vermal VIIb (236), right X (168), vermal Crus II (162), vermal X (120), left interposed nuc. (86), left X (70), right interposed nuc. (69), left fastigial nuc. (23), vermal Crus I (21), right fastigial nuc. (19) | |||||||
| Crus I | Left | −26 | −74 | −27 | 72355 | 0.001 | 5386.8 | ||
| I-IV | Left | 0 | −53 | −24 | 0.001 | 5373.2 | |||
| V | Left | -3 | −62 | −23 | 0.001 | 5032.2 | |||
| 2 | IX | Left | -5 | −47 | −51 | 39 | 0.025 | 1592.2 | |
| 3 | IX | Right | 7 | −49 | −61 | 117 | 0.034 | 1435.8 | |
| b) CS+ > CS-: habituation t-test, TFCE, p<0.05 FWE corr. | |||||||||
| no significant voxels | |||||||||
| c) CS+ > CS-: acquisition t-test, TFCE, p<0.05, FWE corr. | |||||||||
| 1 | Extended cluster | right Crus I (1506), right VI (1481), white matter (23), right V (16) | |||||||
| VI | Right | 35 | −50 | −31 | 3027 | 0.004 | 2256.6 | ||
| VI | Right | 33 | −60 | −26 | 0.004 | 2174.7 | |||
| Crus I | Right | 40 | −57 | −32 | 0.005 | 2082.8 | |||
| 2 | Extended cluster | left Crus I (1658), left VI (727) | |||||||
| Crus I | Left | −44 | −56 | −33 | 2385 | 0.006 | 1911.7 | ||
| Crus I | Left | −36 | −53 | −33 | 0.007 | 1851.3 | |||
| Crus I | Left | −41 | −64 | −31 | 0.014 | 1629.8 | |||
| 3 | Extended cluster | right VIIIa (287), right VIIIb (283), white matter (36), right VIIb (2) | |||||||
| VIIIb | Right | 28 | −48 | −49 | 608 | 0.019 | 1495.2 | ||
| VIIIb | Right | 22 | −54 | −48 | 0.020 | 1483.1 | |||
| VIIIa | Right | 29 | −58 | −47 | 0.037 | 1263.4 | |||
| 4 | Crus I | Left | −17 | −76 | −29 | 264 | 0.036 | 1278.4 | |
| 5 | Crus I | Left | −34 | −75 | −25 | 46 | 0.047 | 1163.4 | |
| d) CS+ > CS-: extinction t-test, TFCE, p<0.05 FWE corr. | |||||||||
| no significant voxels | |||||||||
| e) no-US post CS+ > no US post CS-: acquisition t-test, TFCE, p<0.05, FWE corr. | |||||||||
| 1 | Extended cluster | left Crus I (7688), left VI (4023), left Crus II (3373), white matter (1741), right I-IV (580), left VIIb (541), left dentate nuc. (474), left I-IV (472), vermal VIIIb (226), vermal IX (200), right interposed nuc. (163), vermal VIIIa (159), right dentate nuc. (92), left interposed nuc. (73), right V (70), left V (41), left IX (34), right fastigial nuc. (31), left VIIIa (30), vermal VI (9), right IX (9), vermal Crus I (8), left fastigial nuc. (8), vermal Crus II (2) | |||||||
| Crus I | Left | −17 | −78 | −25 | 20047 | <0.001 | 4010.8 | ||
| VI | Left | −25 | −73 | −26 | <0.001 | 3912.9 | |||
| Crus I | Left | −41 | −68 | −29 | 0.001 | 3633.1 | |||
| 2 | Extended cluster | right Crus I (1313), right VI (750), white matter (66) | |||||||
| VI | Right | 30 | −68 | −27 | 2129 | 0.015 | 1484.6 | ||
| VI | Right | 25 | −73 | −22 | 0.018 | 1422.4 | |||
| Crus I | Right | 45 | −65 | −27 | 0.019 | 1384.5 | |||
| 3 | Crus II | Right | 15 | −79 | −33 | 42 | 0.047 | 1079.1 | |
| f) no-US post CS+ > no US post CS-: extinction t-test, TFCE, p<0.05, FWE corr. | |||||||||
| 1 | Crus I | Left | −14 | −72 | −35 | 273 | 0.016 | 1416.9 | |
Table 2
Psychophysiological interactions (PPI) based on a seed region in the left lateral cerebellum.
Clusters of ≥20 mm3 are shown. Up to three maxima in each cluster are shown separated by at least 8 mm.
| Index | Location | Side | SUIT coordinates/mm | Cluster size/mm3 | pFWE | TFCE | |||
|---|---|---|---|---|---|---|---|---|---|
| PPI (increased functional connectivity): acquisition, US post CS+ > no US post CS- t-test, TFCE, p<0.05 FWE corr. | |||||||||
| 1 | Extended cluster | right Calcarine (4607), left Calcarine (3955), left Cuneus (2921), left Lingual (1995), right Lingual (1903), outside GM (1632), right Cuneus (932), left Precuneus (424), vermal Lob. IV-V (323), left Lob. IV-V (193), left Lob. VI (141), left Occipital_Sup (117), right Thalamus (53), right Precuneus (47), left Thalamus (39), right Lob. IV-V (37), right Cingulum_Post (27), left Parietal_Sup (27), left Cingulum_Post (13), left ParaHippocampal (11), right Hippocampus (9), right ParaHippocampal (3) | |||||||
| Calcarine | Right | 11 | −74 | 11 | 19409 | 0.001 | 5080.1 | ||
| Calcarine | Left | -8 | −80 | 7 | 0.002 | 4220.7 | |||
| Calcarine | Right | 22 | −58 | 3 | 0.003 | 4102.5 | |||
| PPI (increased functional connectivity): acquisition, CS+>CSt-test, TFCE, p<0.05 FWE corr. | |||||||||
| 1 | Extended cluster | left Occipital_Mid (5908), left Lingual (4253), left Fusiform (2706), left Occipital_Inf (2297), outside GM (1491), left Lob. Crus I (645), right Lingual (616), left Calcarine (241), left Lob. VI (177), left Occipital_Sup (114), right Calcarine (99), left Precuneus (21), left Temporal_Mid (16), vermal Lob. IV-V (3) | |||||||
| Occipital_Mid | Left | −24 | −98 | 10 | 18587 | 0.007 | 3714.2 | ||
| Occipital_Mid | Left | −29 | −89 | 0 | 0.008 | 3634.5 | |||
| Fusiform | Left | −24 | −71 | -8 | 0.009 | 3568.4 | |||
| 2 | Extended cluster | right Fusiform (3493), right Occipital_Mid (2820), right Lingual (2743), right Occipital_Inf (1068), outside GM (1040), right Temporal_Mid (411), right Occipital_Sup (329), right Cuneus (301), right Lob. Crus I (288), right Lob. VI (270), right Temporal_Inf (251), right Calcarine (151) | |||||||
| Fusiform | Right | 33 | −79 | -7 | 13165 | 0.018 | 3160.4 | ||
| Lingual | Right | 26 | −62 | -6 | 0.018 | 3133.8 | |||
| Fusiform | Right | 24 | −71 | -6 | 0.02 | 3088.5 | |||
| 3 | Paracentral Lob. | Left | -2 | −38 | 69 | 394 | 0.018 | 3158.1 | |
| 4 | Extended cluster | vermal Lob. IV-V (92), left Lob. IV-V (35), vermal Lob. VI (12), left Lob. VI (8) | |||||||
| Lob. VI | Vermal | -1 | −64 | −10 | 147 | 0.04 | 2580.3 | ||
| Lob. IV-V | Vermal | 1 | −56 | -4 | 0.05 | 2417.9 | |||
| 5 | Extended cluster | left Fusiform (248), left Occipital_Inf (6), outside GM (1), left Temporal_Inf (1) | |||||||
| Fusiform | Left | −33 | −48 | −13 | 256 | 0.042 | 2541.9 | ||
| Fusiform | Left | −41 | −58 | −14 | 0.042 | 2520.3 | |||
| 6 | Extended cluster | right Lingual (173), right Lob. IV-V (14) | |||||||
| Lingual | Right | 17 | −56 | -4 | 187 | 0.044 | 2483.6 | ||
| Lingual | Right | 10 | −60 | -4 | 0.045 | 2475.6 | |||
| 7 | Lingual | Right | 17 | −52 | 2 | 65 | 0.047 | 2455.3 | |
Additional files
-
Supplementary file 1
Five supplementary tables are supplied to report on further statistical results.
Table 1, first interval skin conductance responses; Table 2, changes in cerebellar activation across blocks during acquisition and extinction; Table 3, results of cerebellar and whole brain conjunction analyses; Table 4, differences across acquisition contrasts in cerebellar and whole brain activation; Table 5, whole brain activations during acquisition and extinction.
- https://doi.org/10.7554/eLife.46831.018
-
Transparent reporting form
- https://doi.org/10.7554/eLife.46831.019
Download links
A two-part list of links to download the article, or parts of the article, in various formats.
Downloads (link to download the article as PDF)
Open citations (links to open the citations from this article in various online reference manager services)
Cite this article (links to download the citations from this article in formats compatible with various reference manager tools)
The cerebellum is involved in processing of predictions and prediction errors in a fear conditioning paradigm
eLife 8:e46831.
https://doi.org/10.7554/eLife.46831


