Heparan sulfates are critical regulators of the inhibitory megakaryocyte-platelet receptor G6b-B
- University of Birmingham, United Kingdom
- Wellcome Trust Sanger Institute, United Kingdom
- University Hospital Würzburg, Germany
- Université de Strasbourg, Institut National de la Santé et de la Recherche Médicale, Etablissement Français du Sang Grand Est, Unité Mixte de Recherche-S 1255, Fédération de Médecine Translationnelle de Strasbourg, France
- Sygnature Discovery Limited, United Kingdom
- University of Helsinki, Helsinki University Hospital, Finland
- Aplagon Oy, Finland
- Helsinki University Hospital Research Institute, Finland
- University of Westminster, United Kingdom
- Alderley Park, United Kingdom
- Dudley Group NHS Foundation Trust, United Kingdom
- Aston University, United Kingdom
Figures
Figure 1 with 3 supplements
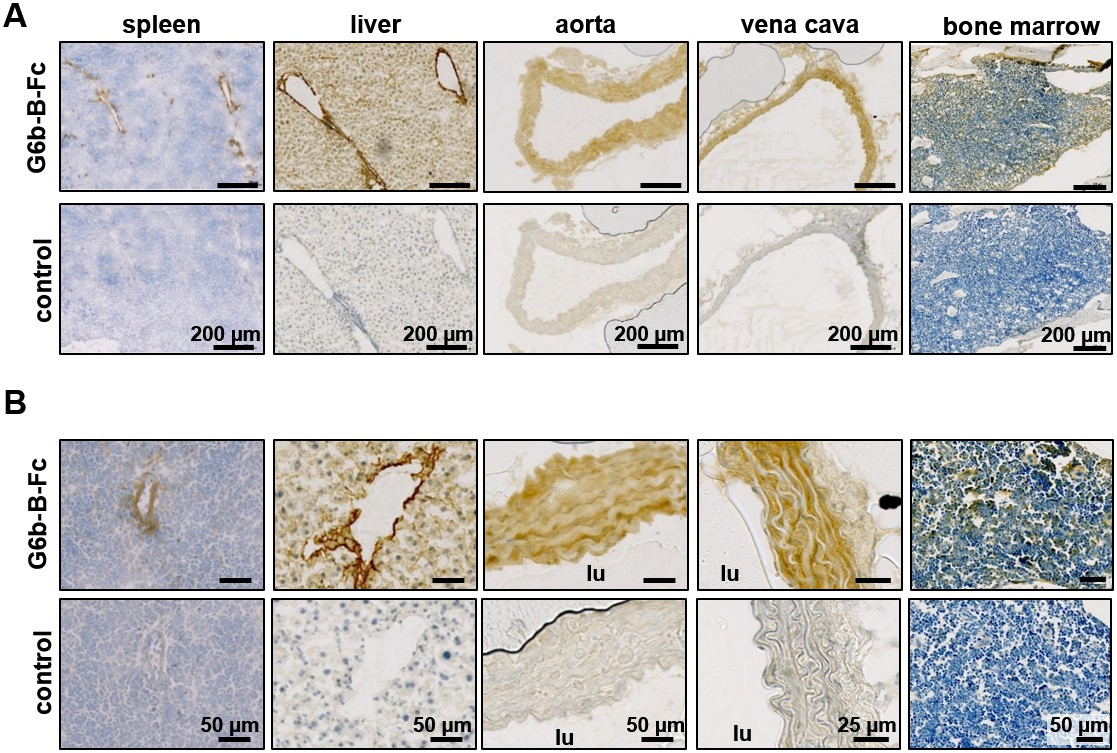
Prominent binding of mG6b-B-Fc to the vessel wall.
Immunohistochemistry staining of frozen mouse tissue sections with mG6b-B-Fc or human IgG-Fc fragments (control). Bound protein was visualized using a secondary anti-human-Fc-HRP antibody and DAB substrate, prior to counterstaining with hematoxylin. The images were captured by a Zeiss Axio Scan.Z1 slidescanner, and images were exported using the Zeiss Zen software. (A) Overview and (B) zoomed-in images for the indicated tissues. lu, vessel lumen. Larger overview sections of the tissues are shown in Figure 1—figure supplements 1, 2.
Figure 1—figure supplement 1
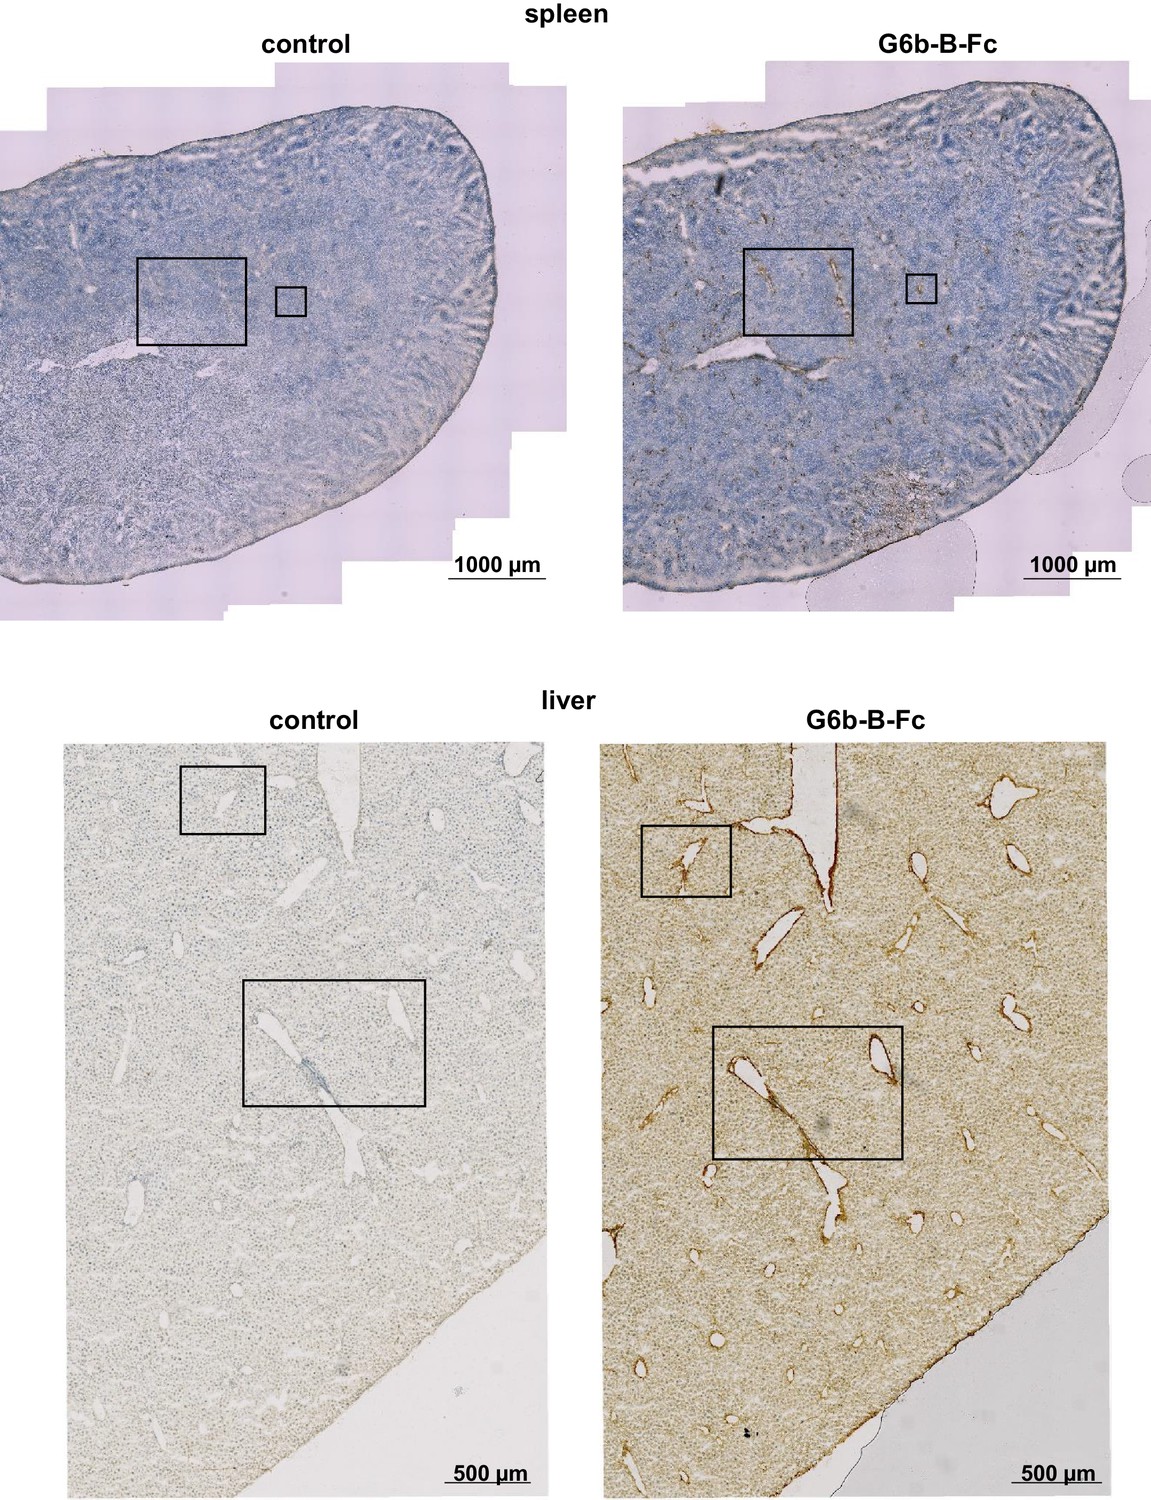
Overview sections of tissues stained with mG6b-B-Fc or negative control.
Overview sections of the tissues depicted in Figure 1. Boxed areas mark the sections shown in Figure 1.
Figure 1—figure supplement 2
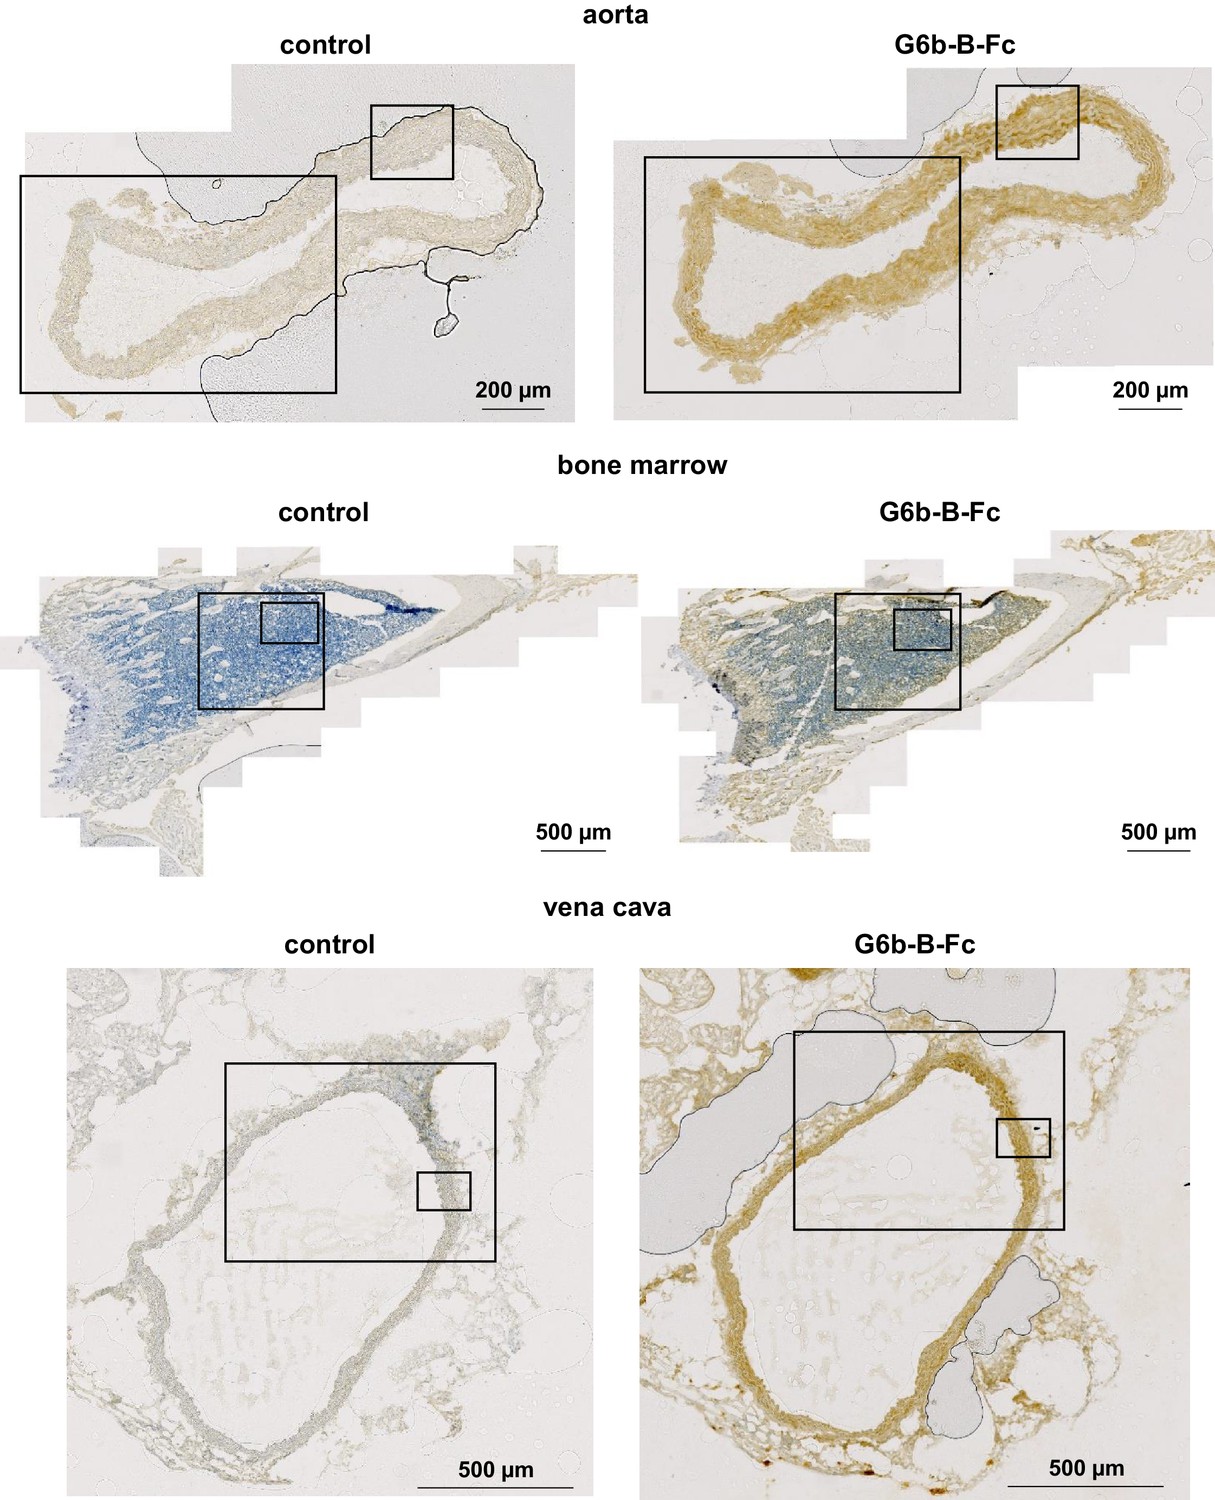
Overview sections of tissues stained with mG6b-B-Fc or negative control.
Overview sections of the tissues depicted in Figure 1. Boxed areas mark the sections shown in Figure 1.
Figure 1—figure supplement 3
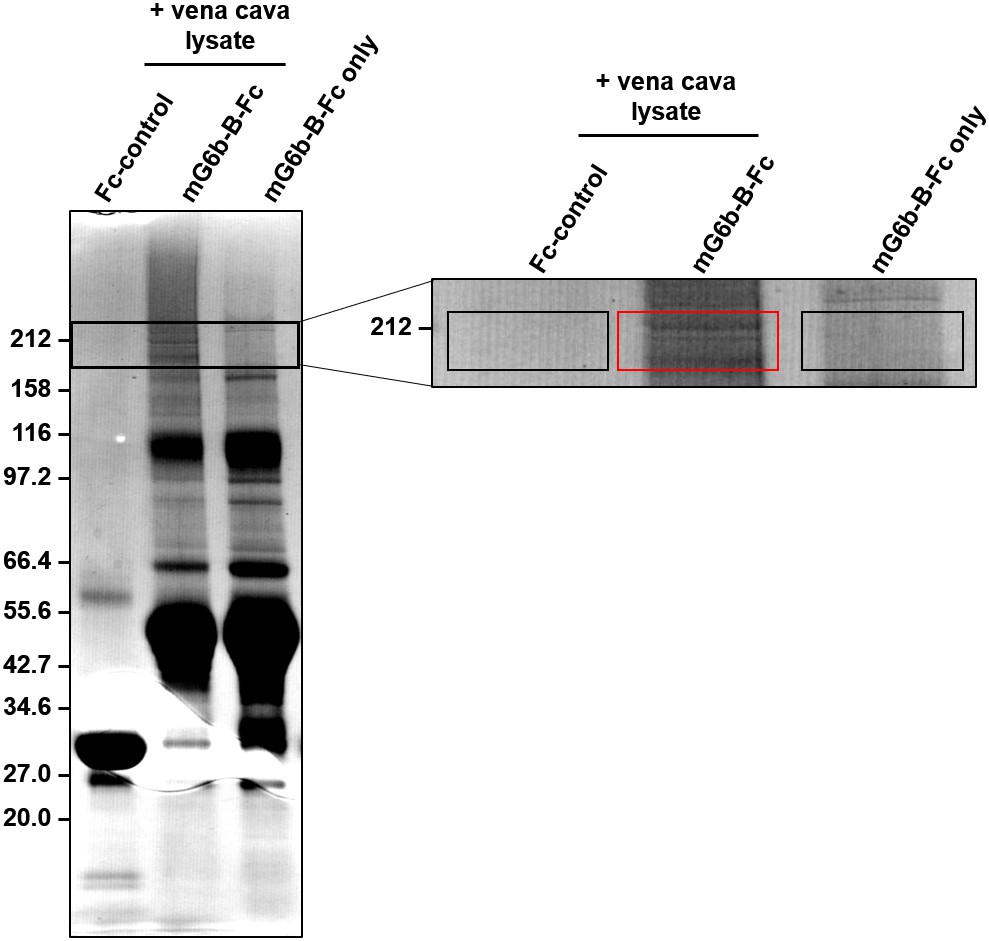
Pull-down of G6b-B binding partners from vena cava lysates.
Vena cava homogenates were incubated with G6b-B-Fc or Fc control protein as well as protein G sepharose beads to precipitate G6b-B binding partners. Following multiple washing steps, samples were analyzed by SDS page and colloidal coomassie staining. Recombinant G6b-B-Fc alone was loaded as an additional negative control. Boxed areas in the magnified section mark the regions that were excised and analyzed by mass spectrometry, with results shown in Table 1 and the corresponding source tables.
Figure 2 with 1 supplement
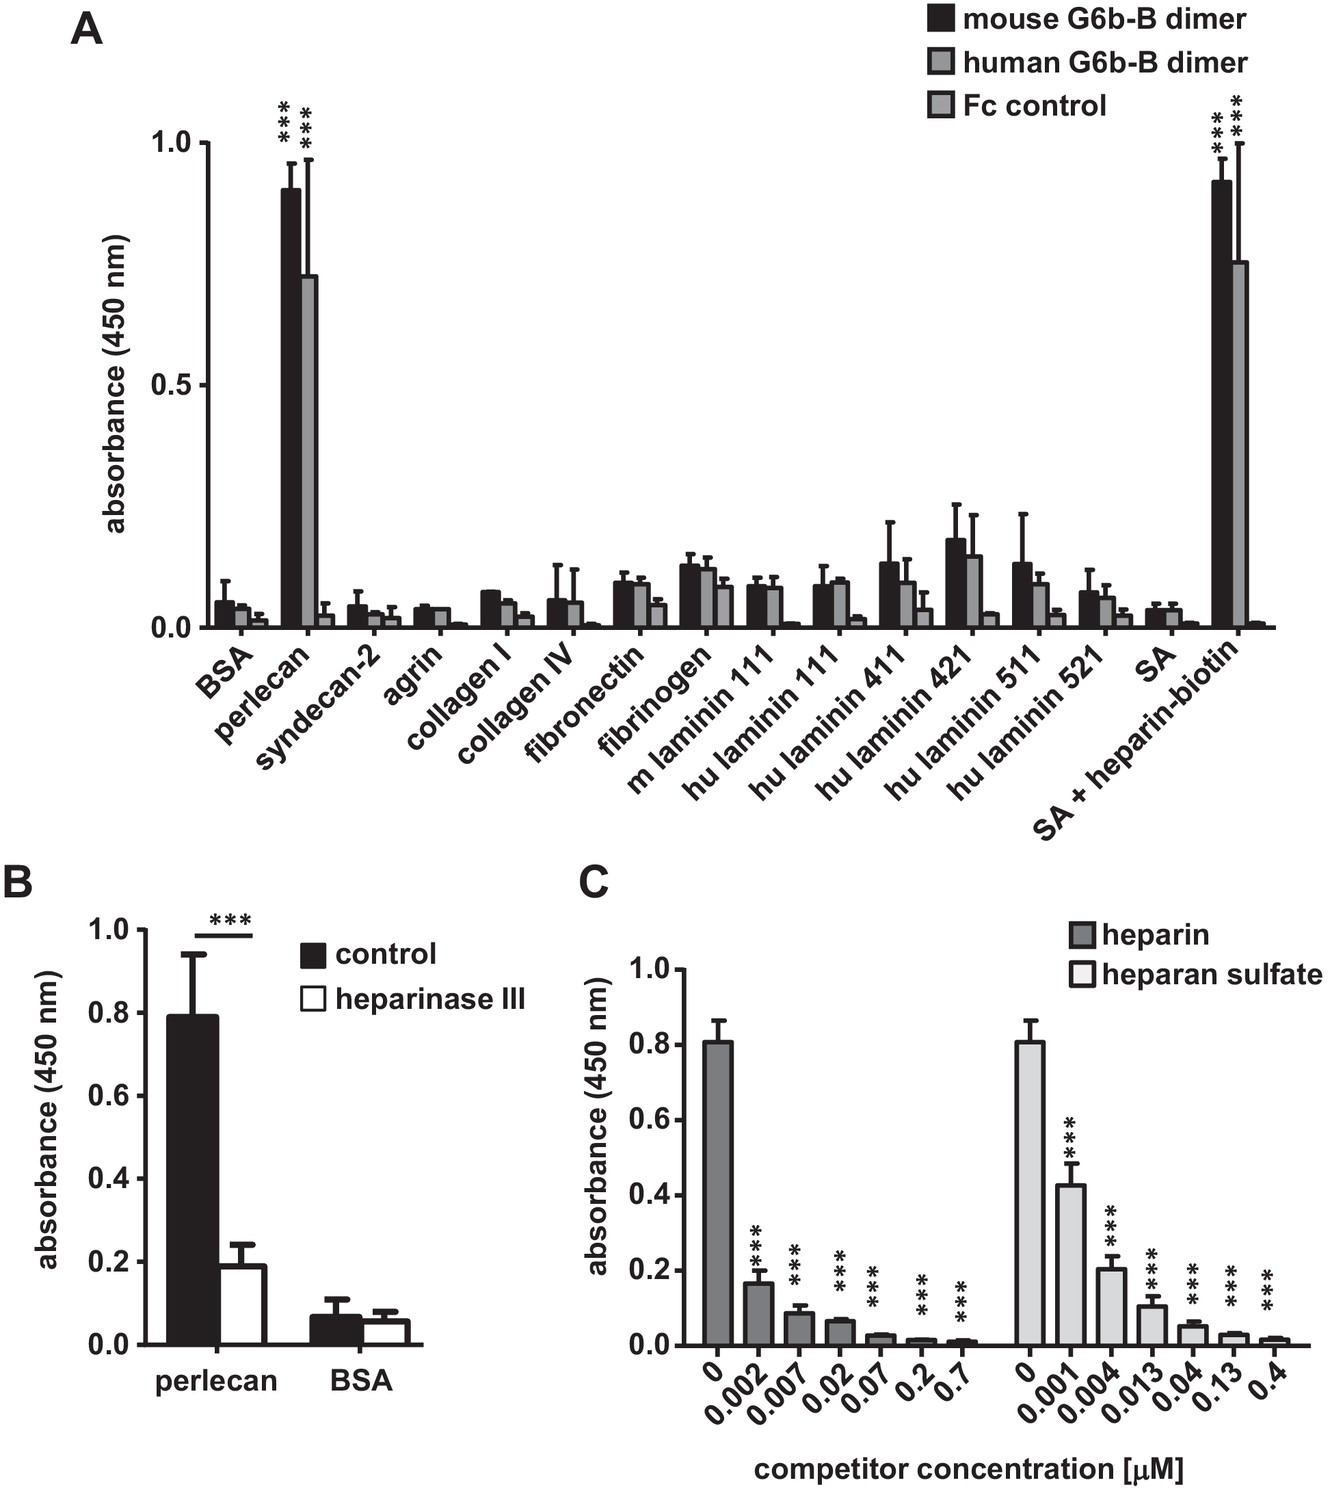
G6b-B-Fc binds to heparan sulfate side-chains of perlecan.
(A) 96-well plates were coated with the indicated substrates (5 µg/ml) and incubated with mouse G6b-B-Fc (10 µg/ml), human G6b-B-Fc (30 µg/ml) or Fc-control (10 µg/ml). Bound protein was detected with an anti-human-Fc-HRP antibody and 3,3′,5,5′-tetramethylbenzidine (TMB) substrate. n = 2–4; SA, streptavidin. (B) Perlecan and bovine serum albumin (BSA) were treated or not with heparinase III (5 mU/ml) prior to blocking, and mG6b-B-Fc binding was measured. n = 4. (C) mG6b-B binding to immobilized perlecan was measured in the presence of the indicated concentrations of heparin and heparan sulfate. n = 3. P-values were calculated using ordinary one-way ANOVA with Dunnett’s post-hoc test and asterisks denote statistical significance compared to the respective control. ***, p<0.001. Source files of all binding assays are available in Figure 2—source data 1.
-
Figure 2—source data 1
Source data for graphs shown in Figure 2A–C.
- https://doi.org/10.7554/eLife.46840.012
Figure 2—figure supplement 1
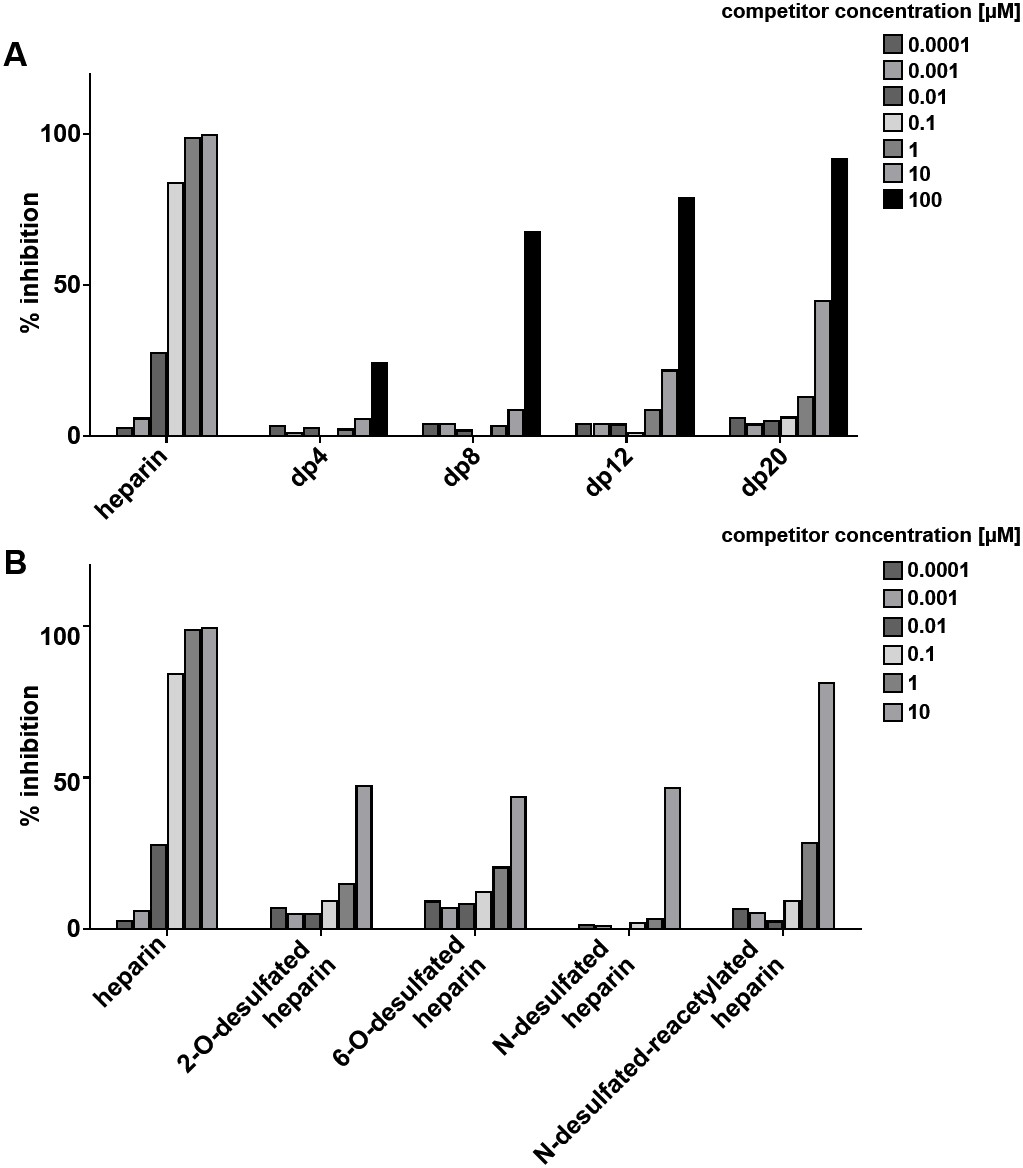
Loss of heparin sulfation impairs interaction with G6b-B.
96-well plates were coated with streptavidin followed by incubation of biotinylated heparin. Binding of the huG6b-B monomer–anti-G6b-B antibody complex (1 µg/ml each) was measured in the presence of (A) heparin or oligosaccharides of defined length (dp, degree of polymerization = number of saccharides) or (B) selectively desulfated heparin species at the given concentration. % inhibition was calculated by normalizing optical density (OD) to maximum and minimum values. Representative results for two independent experiments are shown.
Figure 3

The heparan sulfate biosynthesis pathway is required for G6b-B binding to HEK293 cells.
(A) Recombinant G6b-B, produced as a monomeric biotinylated protein and conjugated to streptavidin-PE to generate an avid probe, binds to HEL, HEK293 and COLO-320-HSR cells. (B) A genome-wide loss-of-function approach identifies the HS biosynthesis pathway as the factor required to mediate the binding of recombinant G6b-B to HEK293 cells (left panel). X- and y-axis represent the log-fold-change (LFC) and robust rank aggregation (RRA) score calculated using the MAGeCK software, respectively. Circles represent individual genes and sizes represent the false-discovery rate (FDR): large circle = FDR < 1%, small circle = 1% < FDR < 5%. Genes with FDR < 5% are color coded according to their functional annotation and genes corresponding to the HS biosynthesis pathway are additionally named. The HS biosynthesis pathway is depicted in the right panel with the genes identified in the loss-of-function approach highlighted. Similar results were obtained in HEL cells (not shown). (C) G6b-B binding to HEK293 cells was measured by flow cytometry in the presence or absence of the indicated concentration of heparin or chondroitin sulfate. One representative out of three experiments is shown. (D) G6b-B loses its binding to cell lines when SLC35B2, encoding a transporter required for the sulfation of glycosaminoglycans (GAGs), is targeted. To ensure that the KO cells lack GAGs, a known HS binding protein, FGFRL1, is used as a control that confirms the loss of binding on these cell lines. Source data for the genomic screens in HEK293 and HEL cells are available in Figure 3—source data files 1–2 and 3–4, respectively.
-
Figure 3—source data 1
Raw read counts from the screen carried out in HEK293 cells.
- https://doi.org/10.7554/eLife.46840.014
-
Figure 3—source data 2
MAGeCK output for gene-wise ranking from the screen carried out in HEK293 cells.
- https://doi.org/10.7554/eLife.46840.015
-
Figure 3—source data 3
Raw read counts from the screen carried out in HEL cells.
- https://doi.org/10.7554/eLife.46840.016
-
Figure 3—source data 4
MAGeCK output for gene-wise ranking from the screen carried out in HEL cells.
- https://doi.org/10.7554/eLife.46840.017
Figure 4 with 3 supplements
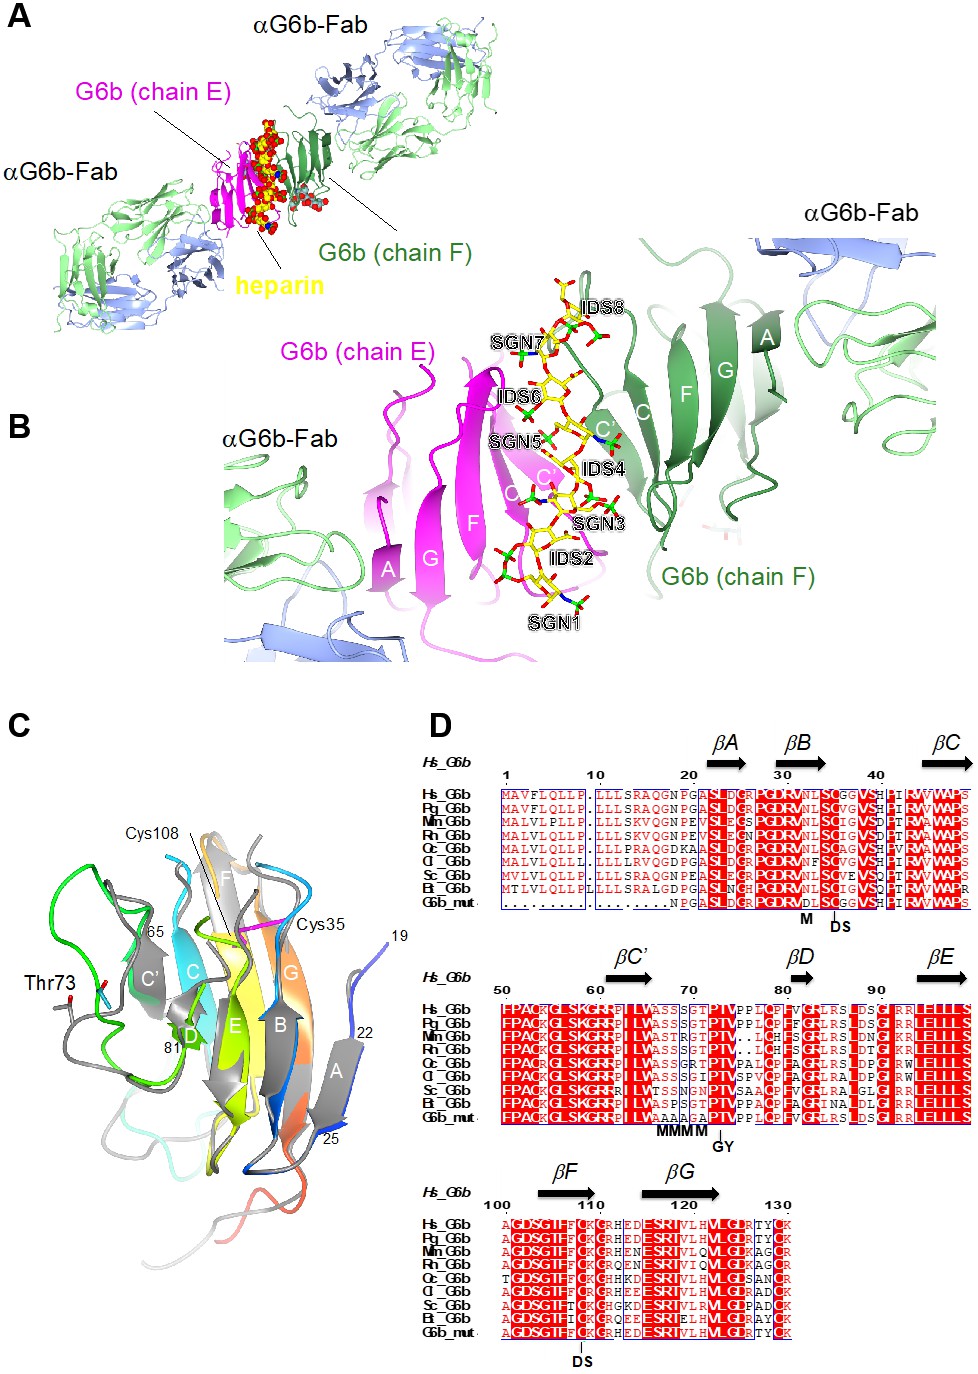
Ribbon representation of the ternary complex of the extracellular domain (ECD) of human G6b-B bound to heparin and the Fab fragment of a G6b-B-specific antibody.
(A) Overview of the structure, with G6b-B colored in magenta and dark green, heparin shown as spheres, and the Fab fragment chains in light green/light blue, respectively. The assembly represents the asymmetric unit of the crystal lattice (space group C2). (B) Close-up view illustrating the position of the heparin ligand relative to the secondary structure of the G6b-B dimer. Heparin residues (shown as sticks) are sulfated D-glucosamine (SGN) and L-iduronic acid (IDS). The color coding of heparin atoms is: C, yellow; O, red; N, blue; and S, green. β-strands in G6b-B are labeled according to the canonical Ig-fold. (C) Superposition of chains F (various colors) and E (gray) of the G6b-B ECD. Strands are labeled according to the canonical β-sandwich topology of the variable Ig domain. The fold of G6b-B deviates from the canonical Ig fold in missing strand C′′, and as strand A is part of the β-sheet of strands B, E and D. Chain F is color ramped from blue (N-terminus) to red (C-terminus), and the position of the disulfide bond (Cys35–Cys108) is indicated by sticks in magenta. The glycosylation site Thr73 is shown (sticks) with glycosyl groups omitted from the view. (D) Multiple sequence alignment of G6b-B orthologs across mammalian species with secondary structure elements indicated above the sequence. Residue numbers refer to the sequence of human G6b. Conserved residues are boxed, with identities shown as white letters on a red background. Species abbreviations are: Hs, Homo sapiens; Pg, Pan troglodytes (chimpanzee); Mm, Mus musculus (mouse); Rn, Rattus norvegicus (rat); Oc, Oryctolagus cuniculus (rabbit); Cl, Canis lupus familiaris (dog); Sc, Sos scroftus (wild boar); and Bt, Bos taurus (cattle). G6b_mut is the sequence of the recombinant human G6b-B ECD used in crystallization, with mutations of the five putative glycosylation sites (marked with M). GY indicates the retained O-glycosylation site and DS indicates the disulfide cysteine residues.
Figure 4—figure supplement 1

Mutations in G6b-B abolish heparin binding.
(A) G6b-B model. (i) Ribbon representation showing predicted locations of basic residues K54, K58, R60 and R61 in green. (ii) Superposition of the G6b-B model (dark blue) with Siglec-7 (cyan) in complex with its sialic acid ligand (yellow). (iii) and (iv) Electrostatic surface potentials as calculated by ABPS for both the wild-type G6b-B model and the G6b-B K54D, K58D, R60E, R61E mutant, respectively. Positively charged surfaces are blue and negatively charged are red. (B, C) CHO cells were transiently transfected with wild-type (WT) or mutant G6b-B and analyzed by flow cytometry. (B) Staining of cells with an anti-G6b-B antibody confirms similar transfection efficacy and G6b-B expression. (C) CHO cells were incubated with biotinylated heparin, followed by PE-labeled streptavidin. Heparin-biotin binding of all cells (left) and G6b-B+ cells (right) was measured. As there are no G6b-B+ mock transfected cells, the histogram from the entire cell population is shown in the right panel for comparison. Representative results from two independent experiments are shown.
Figure 4—figure supplement 2
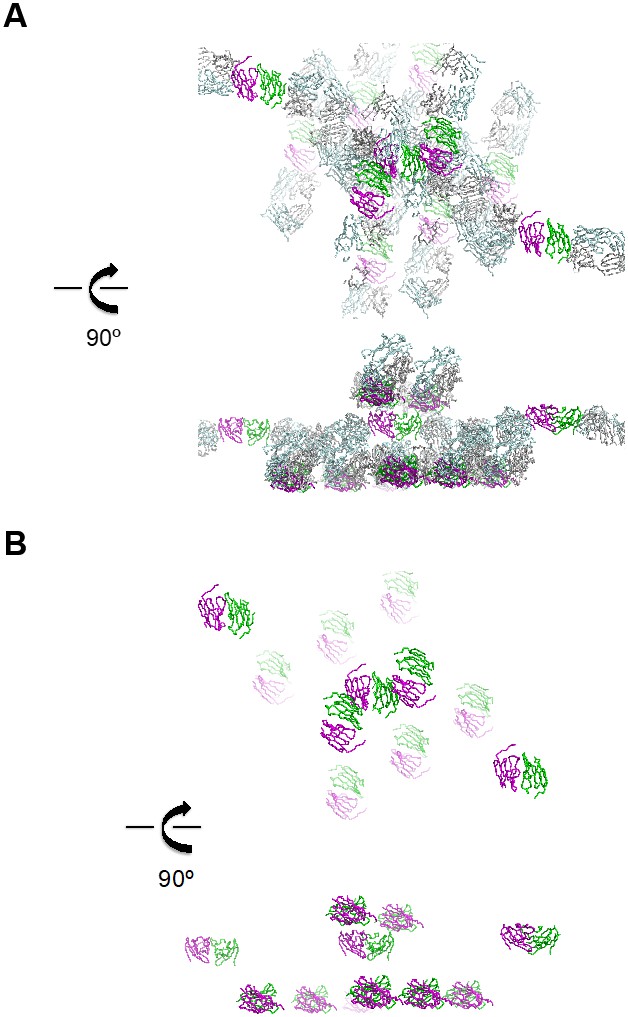
Representation of the crystal lattice.
(A) Crystal lattice of the ternary complex of G6b-B bound to heparin and the G6b-B-specific Fab fragment. The top and bottom halves of the view are related by a 90° rotation about the horizontal axis. Proteins are shown as Cα traces, with G6b-B in magenta and dark green, and the Fab fragment chains in light blue and light gray, respectively. (B) Illustration of crystal lattice contacts by the G6b-B ECD dimer. The view shown is the same as in (A), but omitting the Fab fragment chains. The top and bottom views are related by a 90° rotation about the horizontal axis.
Figure 4—figure supplement 3
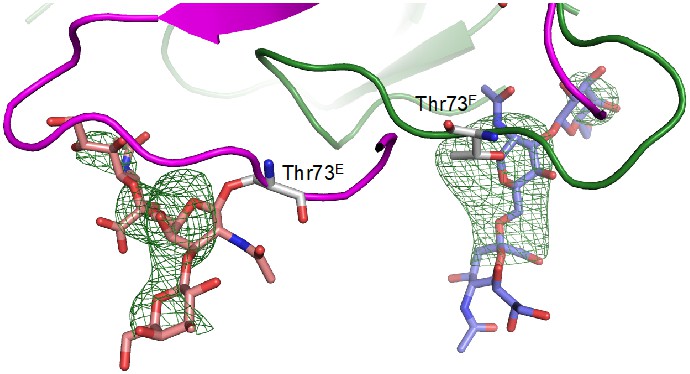
Unbiased σA-weighted difference density map demonstrating the presence of the O-linked glycosyl groups at Thr73.
https://doi.org/10.7554/eLife.46840.021
Figure 5
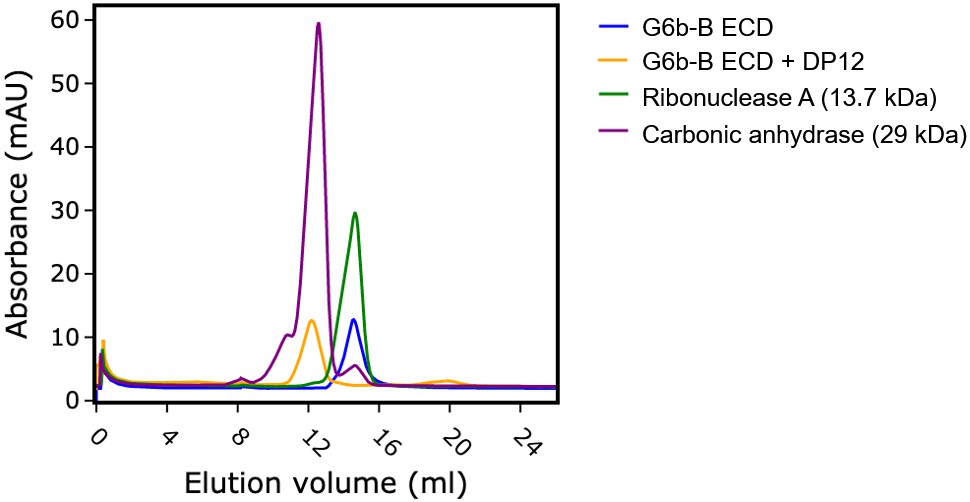
Heparin induces G6b-B dimer formation.
Size exclusion chromatography of G6b-B ECD. Protein was either analyzed immediately or incubated at 4°C for 1.5 hr in the presence of dp12 before analysis on a Superdex 75 10/300 GL column. Molecular weights were estimated using a calibration curve. Values of 30.8 kDa and 12.9 kDa were obtained for G6b-B ECD in the presence and absence of dp12 (approx. 3.6 kDa), respectively. Ribonuclease A (13.7 kDa) and carbonic anhydrase (29 kDa) are shown for comparison.
Figure 6 with 1 supplement
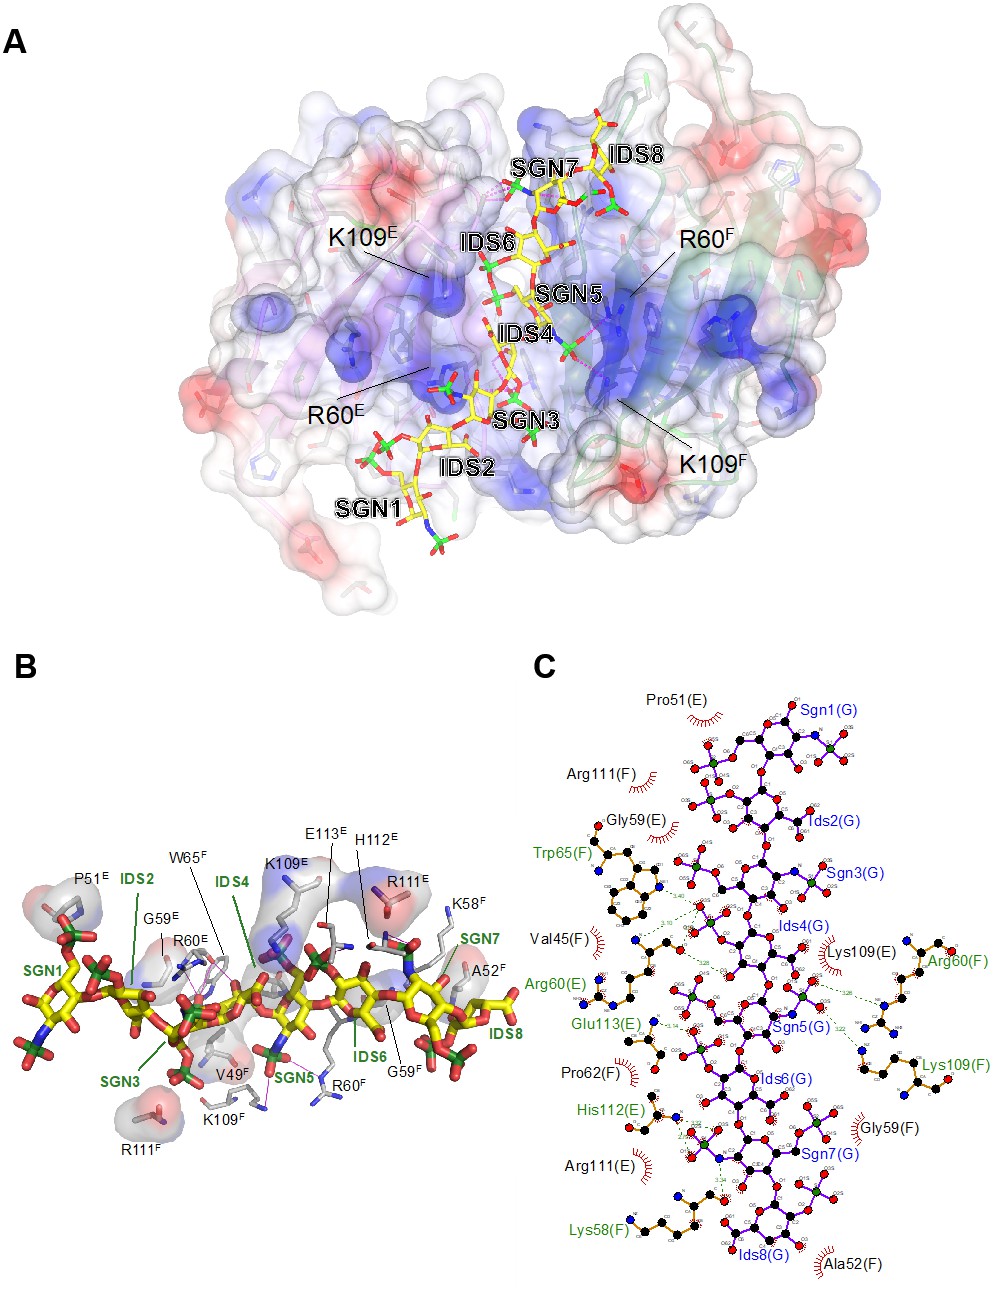
Electrostatic surface potential of the G6b-B ECD and representation of non-covalent contacts between heparin and G6b.
(A) The G6b-B dimer is shown with a translucent surface colored according to electrostatic surface potential (calculated using CCP4mg). The heparin ligand is shown as a stick model and polar contacts are indicated by dashed lines in magenta. Selected residues are labeled with superscripts indicating the relevant G6b-B protein chain. (B, C) Representation of non-covalent contacts between heparin and the G6b dimer. (B) Residues of G6b-B forming non-covalent contacts with heparin. Polar contacts are indicated by dashed lines in magenta, van der Waals interactions are visualized by showing the relevant residues with their (transparent) molecular surface. Superscript capitals designate the G6b-B protein chain. (C) LigPlot representation of the heparin–G6b-B contacts, with van der Waals or hydrophobic interactions indicated by the bent comb symbol, and polar contacts shown as dashed lines with distance indicated in units of Å.
Figure 6—figure supplement 1

Unbiased σA-weighted difference density map demonstrating the presence of the heparin ligand.
The electron map has been calculated with phases from a structure model lacking the heparin atoms and with amplitudes (Fo – Fc), contouring the map at 2.8 σ above the mean.
Figure 7
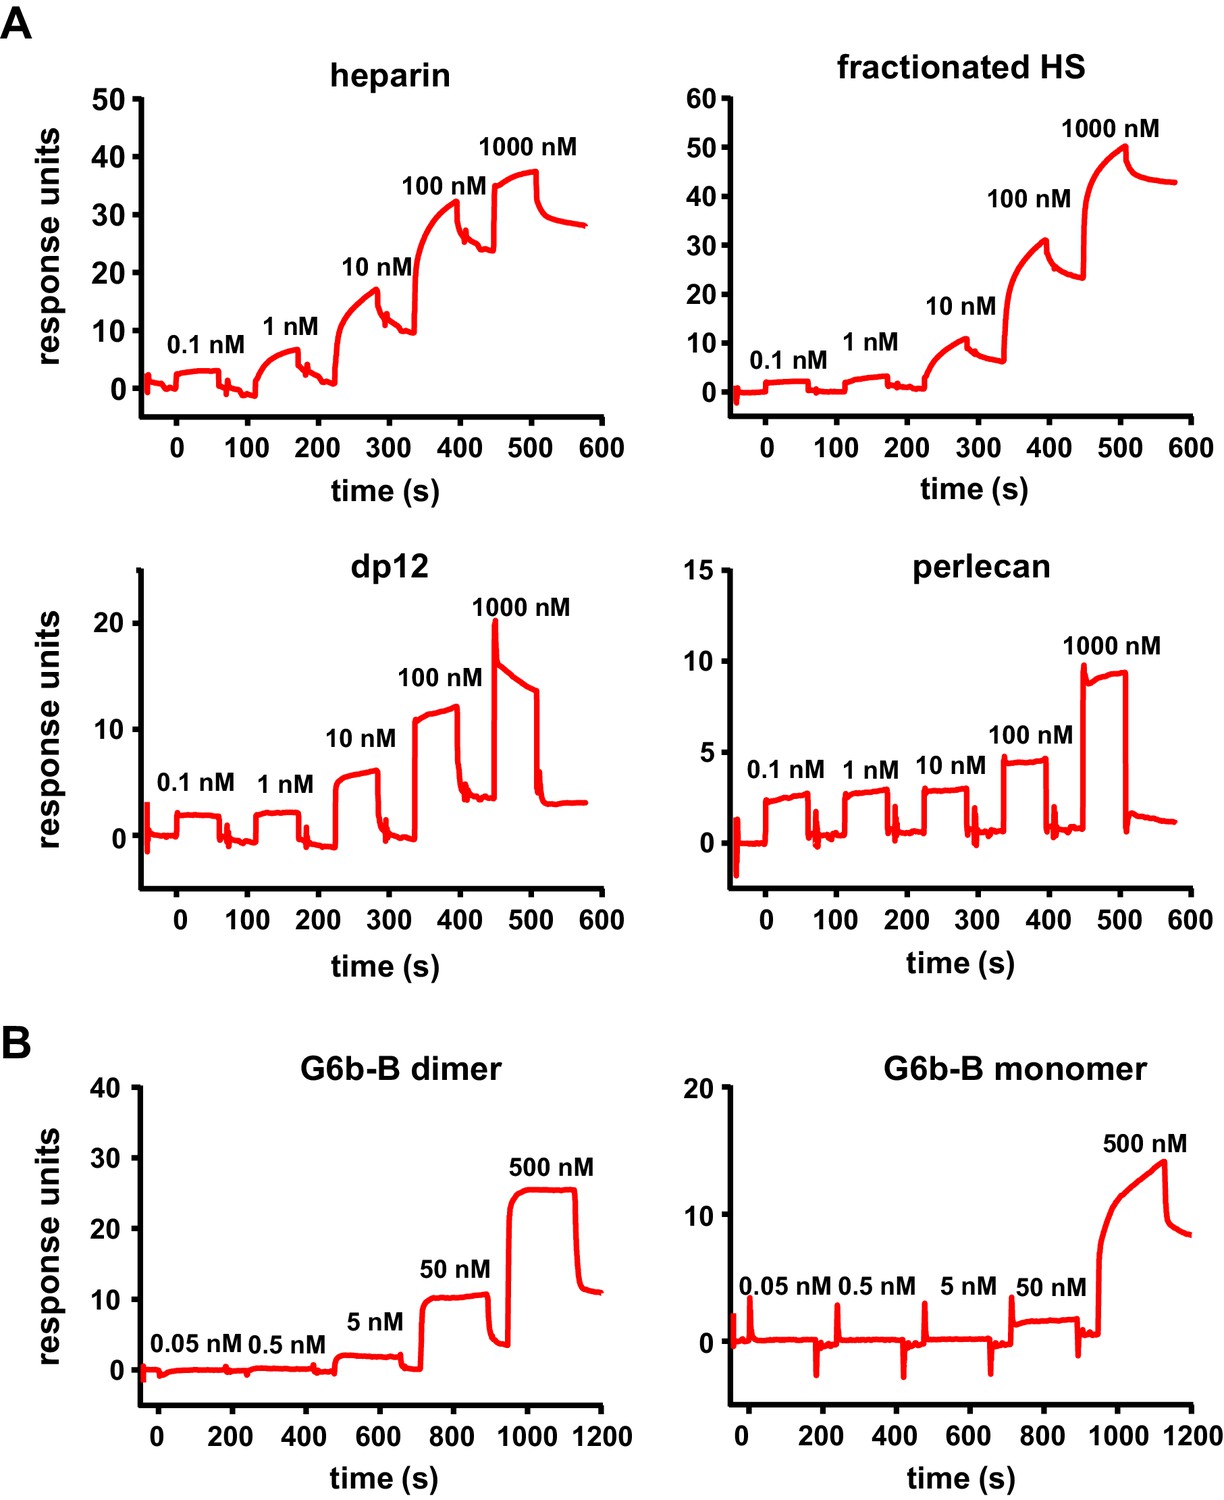
High-affinity interaction between G6b-B and its ligands.
Representative traces of the surface plasmon resonance experiments, results of which are presented in Table 3. (A) Binding of the indicated compound to immobilized dimeric G6b-B in the standard configuration. (B) Results from the reversed configuration, depicting traces of dimeric and monomeric G6b-B binding to immobilized heparin.
Figure 8 with 1 supplement
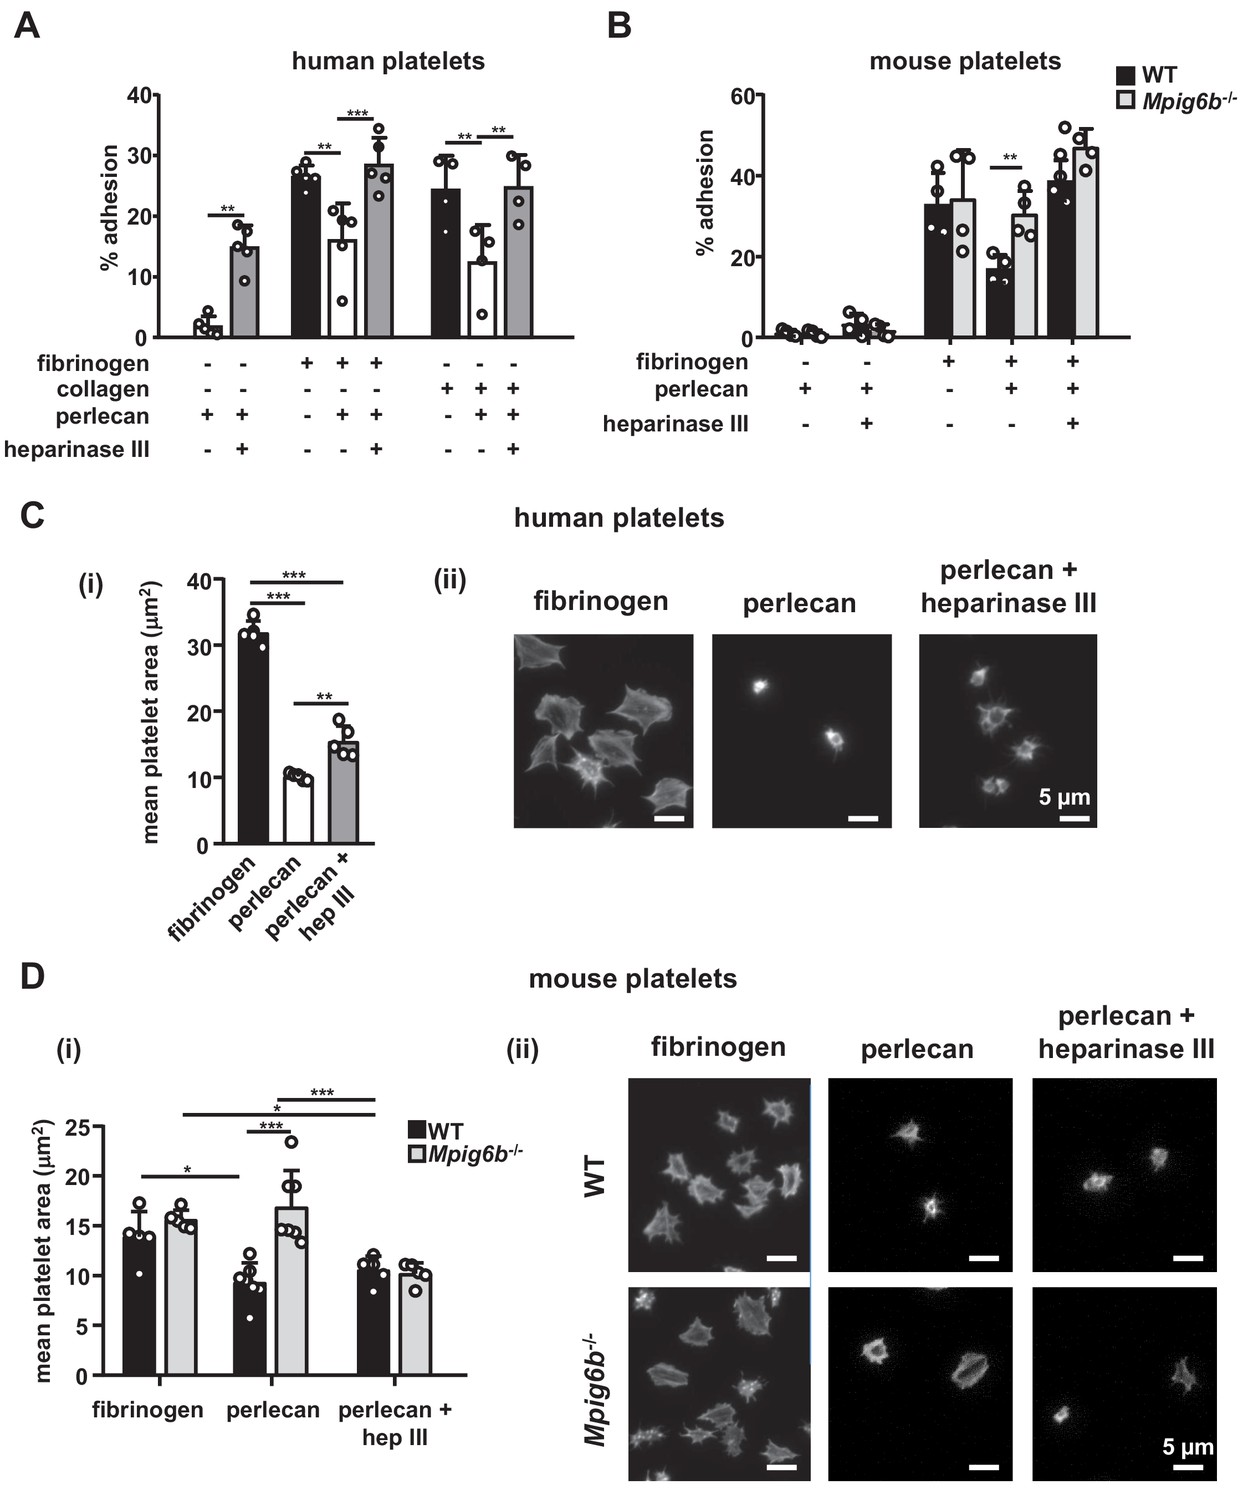
Heparan sulfate removal of perlecan facilitates platelet adhesion.
The indicated substrates were coated alone or in combination onto wells in 96-well plates (2.5 µg/ml collagen and 10 µg/ml for all other substrates) overnight. Where indicated, wells were treated with 5 mU/ml heparinase III. Platelets from (A) humans or (B) mice were allowed to adhere for 1 hr and adhesion was quantified colorimetrically with 4-nitrophenyl phosphate(pNPP). (A) Human, platelets; n = 4–5 individual donors from 3 to 4 independent experiments; P-values were calculated using one-way ANOVA with Sidak’s post-hoc test. (B) Mouse platelets; n = 4 samples/condition/genotype from two independent experiments. Owing to severe thrombocytopenia, platelets from up to five mice were pooled for one KO sample. P-values for differences between WT and Mpig6b–/–mice were calculated using two-way ANOVA with Sidak’s post-hoc test. (C, D) Adhesion of (C) human or (D) WT and G6b–/–platelets on fibrinogen and perlecan. (i) Mean surface area of individual platelets quantified by KNIME software analysis. In panel (C) (i) n = 5 donors from two independent experiments. P-values were calculated using one-way ANOVA with Sidak’s post-hoc test. Total number of cells analyzed: fibrinogen, 1957; perlecan, 239; perlecan + heparinase III, 686. In panel (D) (i) n = 5–7 mice/condition/genotype from 2 to 3 independent experiments. P-values were calculated using two-way ANOVA with Sidak’s post-hoc test. Total number of cells analyzed: 134–176 for perlecan conditions, and 913–1277 for fibrinogen conditions. *, p<0.05; **, p<0.01; and ***, p<0.001. (ii) Representative images of platelets stained for actin with phalloidin-Alexa-488; scale bar: 5 µm; hep III, heparinase III.
Figure 8—figure supplement 1
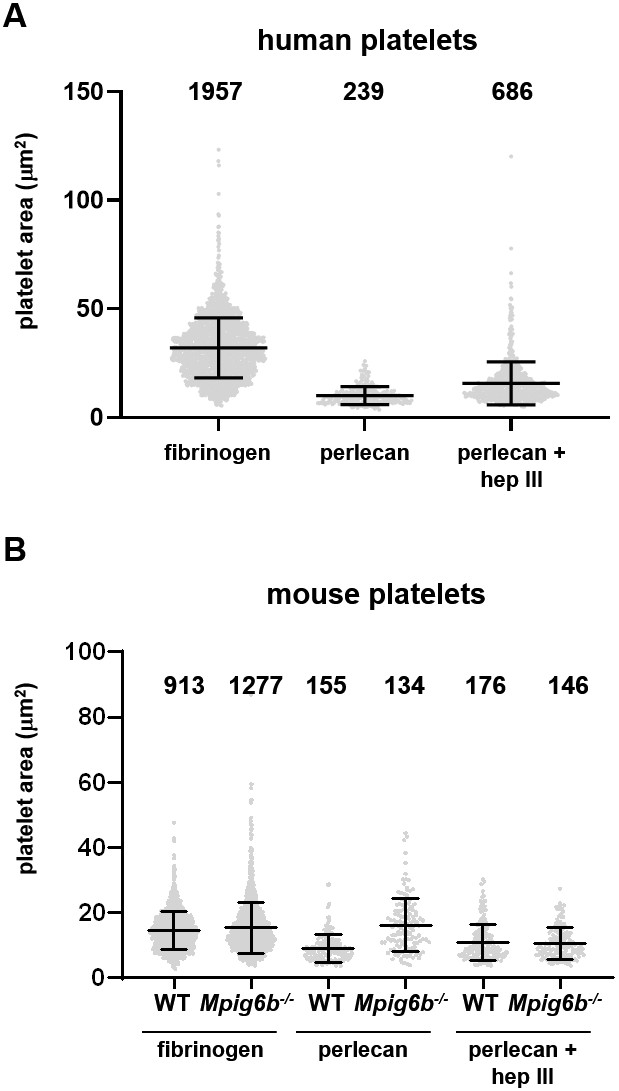
Mean surface area of individual adherent platelets.
Mean surface area of the individual platelets analyzed in Figure 8C,D. Each dot represents an individual platelet from a total of (A) five human donors or (B) 5–7 mice/condition/genotype from 2 to 3 independent experiments. Numbers indicate the absolute number of platelets analyzed. Mean ± SD are overlaid.
Figure 9 with 2 supplements
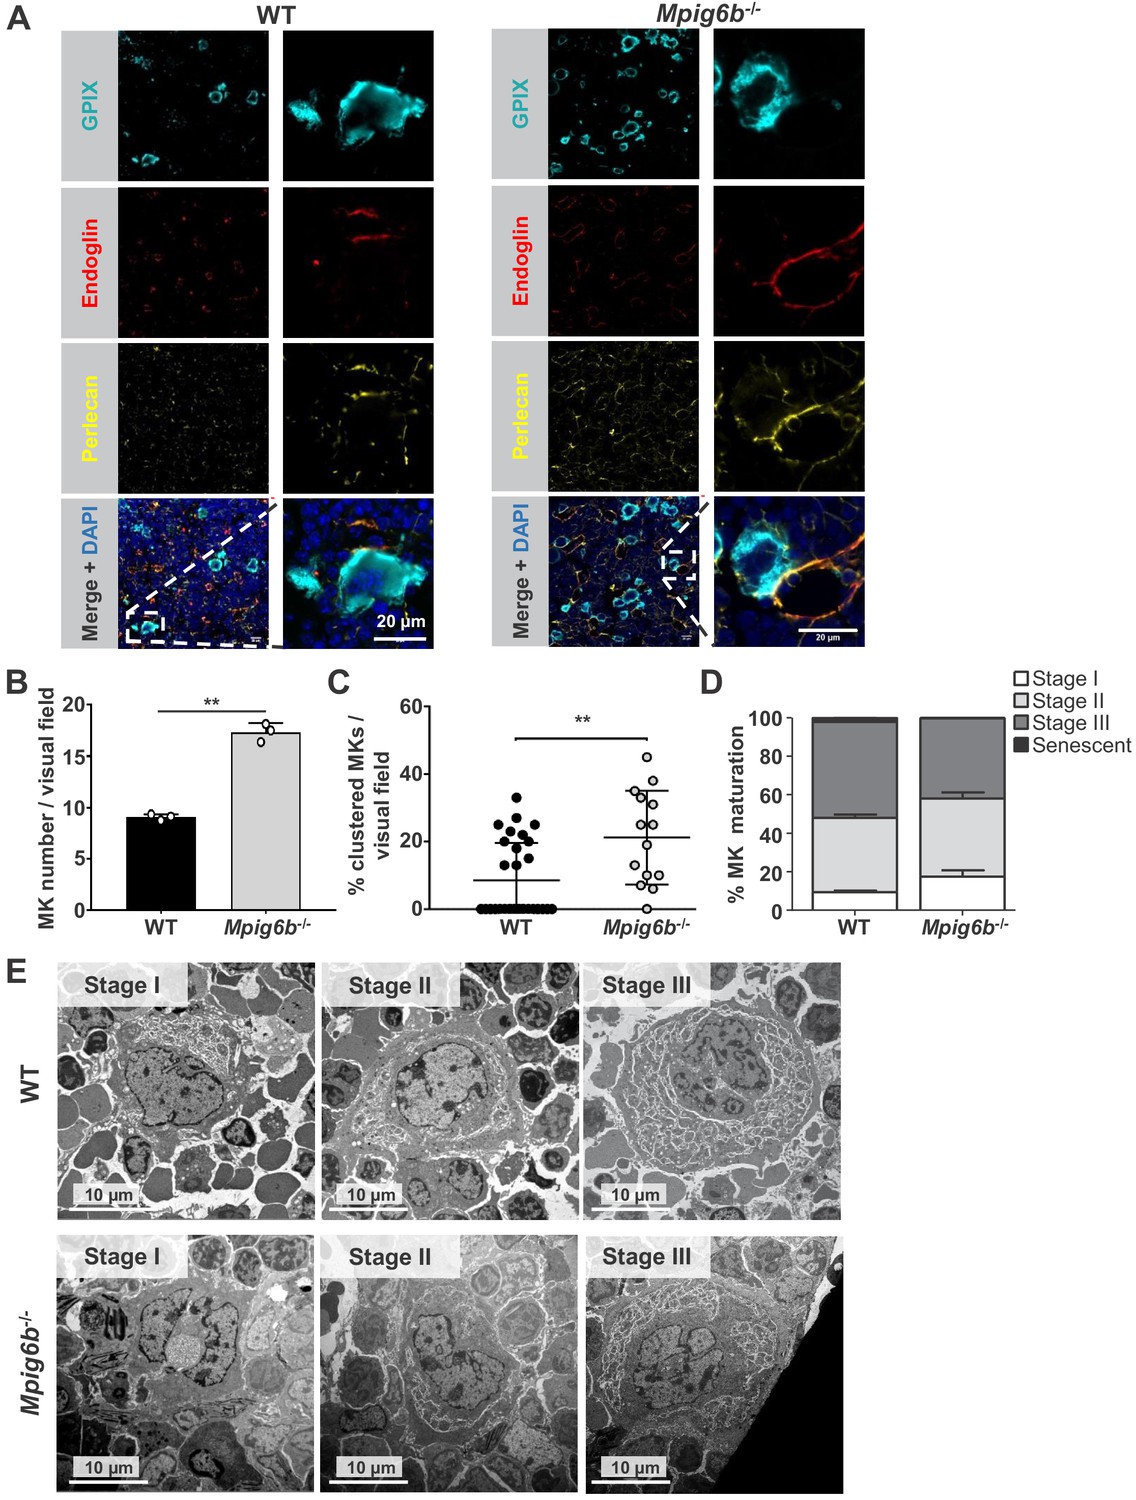
Megakaryocytes come into contact with perlecan in the bone marrow.
(A) Analysis of immunofluorescent images of murine femur sections from WT and Mpig6b–/–mice. Sinusoids were marked using anti-endoglin (CD105) and MKs by anti-GPIX antibodies. Perlecan is abundantly expressed within the bone marrow cavity, present in intersinusoidal spaces and part of basement membranes in sinusoids and arterioles. MKs come into contact with perlecan. Scale bar: 20 µm. (B) Quantification of MKs in the bone marrow of WT and Mpig6b–/–mice; three animals of each genotype with five images per animal were analyzed. (C) Analysis of MK clustering, with % of clustered MKs per visual field with a total number of three mice per genotype analyzed; P values were calculated with Mann-Whitney U-test **, p<0.01. (D) Classification of the MK according to their maturation stage: stage I (absence of granules), stage II (granules and developing demarcation membrane system (DMS) not yet organized), stage III (DMS organized in cytoplasmic territories). Data are reported as the percentage of the total number of MK. Bars represent the mean ± SEM in three bone marrow samples (total number of MK counted 395–469). (E) Representative transmission electron microscopy (TEM) images of bone marrow from WT and Mpig6b−/− mice. Bars: 10 µm.
Figure 9—figure supplement 1

Overview sections of the bone marrow from WT and Mpig6b–/–mice.
Overview sections of the bone marrow in femora of WT and Mpig6b–/–depicted in Figure 9A are shown.
Figure 9—figure supplement 2
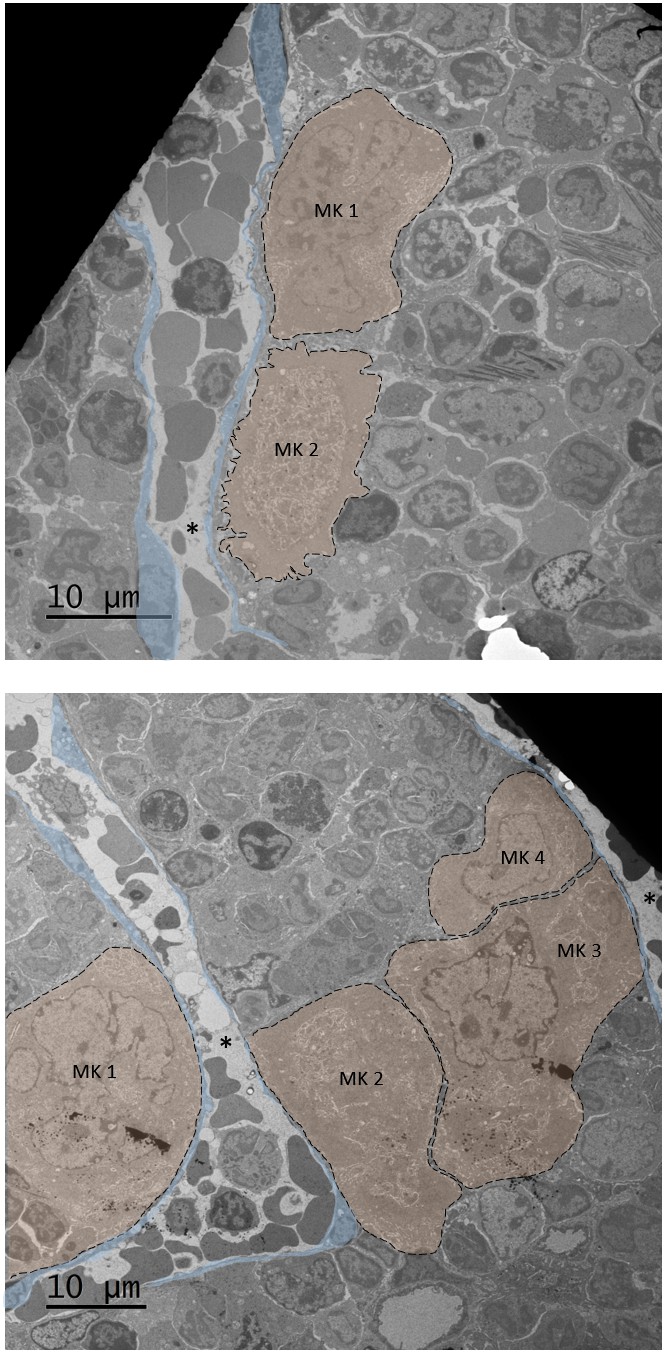
Mpig6b–/–megakaryocytes form clusters.
Megakaryocytes are indicated with a transparent orange overlay and endothelial cells with a transparent blue overlay. *indicates the sinusoidal lumen; MK, megakaryocyte. Bars: 10 µm.
Figure 10

G6b knockout megakaryocytes show enhanced spreading on perlecan.
Adhesion of WT and Mpig6b–/–MKs on perlecan. (i) Mean surface area of MKs was quantified with ImageJ. n = 4–6 mice/condition/genotype from three independent experiments; total cell numbers analyzed per condition/genotype were 77–188 for conditions with perlecan only and 1671–2866 for conditions with fibrinogen. P values were calculated using two-way ANOVA with Sidak’s post-hoc test, ***, p<0.001; *, p<0.05. (ii) Representative images of platelets stained for tubulin (green) and DAPI (blue); scale bar: 20 µm.
Figure 11

Effects of G6b-B ligands on platelet aggregation.
Human platelet rich plasma (PRP) was incubated with the indicated compound for 90 s prior to agonist addition. Aggregation traces were recorded on a Chronolog four channel aggregometer. Averaged aggregation traces (left) and area under the curve (AUC) quantification (right) of platelet aggregation (n = 3–5 per condition). P-values were calculated using one-way ANOVA with Dunnett’s post-hoc test and refer to the untreated control. ***, p<0.001; **, p<0.01; and *, p<0.05.
Figure 12
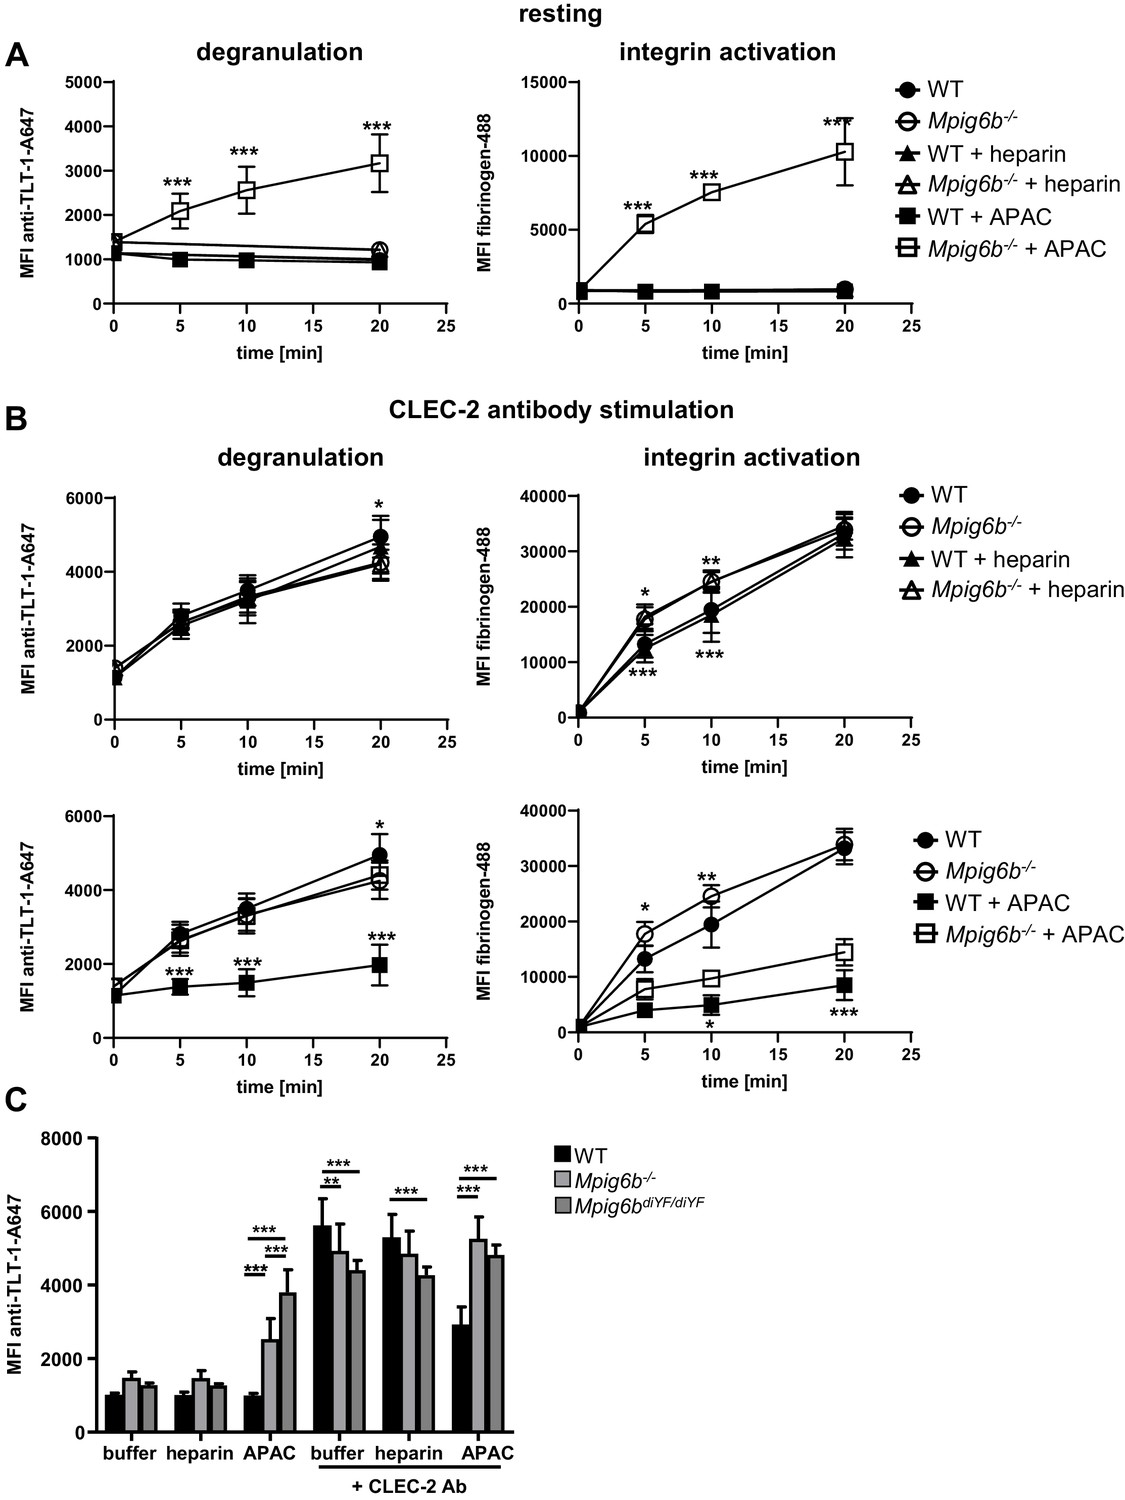
APAC inhibits CLEC-2-mediated degranulation in WT but not Mpig6b KO platelets.
Mouse blood, diluted 1:10 in Tyrode’s buffer was incubated with the indicated compounds (0.05 µM) in the (A) absence or (B) presence of a stimulating CLEC-2 (3 µg/ml) for the indicated time. Samples were fixed and TLT-1 surface levels, a marker for platelet degranulation or fibrinogen-Alexa488 binding (a measure of integrin activation), were determined by flow cytometry. n = 5–6 mice/condition/genotype from two independent experiments. P-values were calculated using (A) two-way ANOVA with Sidak’s post-hoc test (comparison of WT APAC vs Mpig6b–/– APAC) or (B) two-way ANOVA with Tukey’s post-hoc test, and refer to the difference between WT and Mpig6b–/–. ***, p<0.001; **, p<0.01; and *, p<0.05. (C) Mouse blood was incubated with the indicated compounds for 20 min. Samples were fixed and TLT-1 surface levels were determined by flow cytometry. n = 6–8 mice/condition/genotype from three independent experiments. P-values were calculated using two-way ANOVA with Tukey’s post-hoc test. ***, p<0.001; and **p<0.01. Source data are available in Figure 12—source data 1.
-
Figure 12—source data 1
Source data for graphs shown in Figure 12A–C.
- https://doi.org/10.7554/eLife.46840.036
Figure 13 with 1 supplement
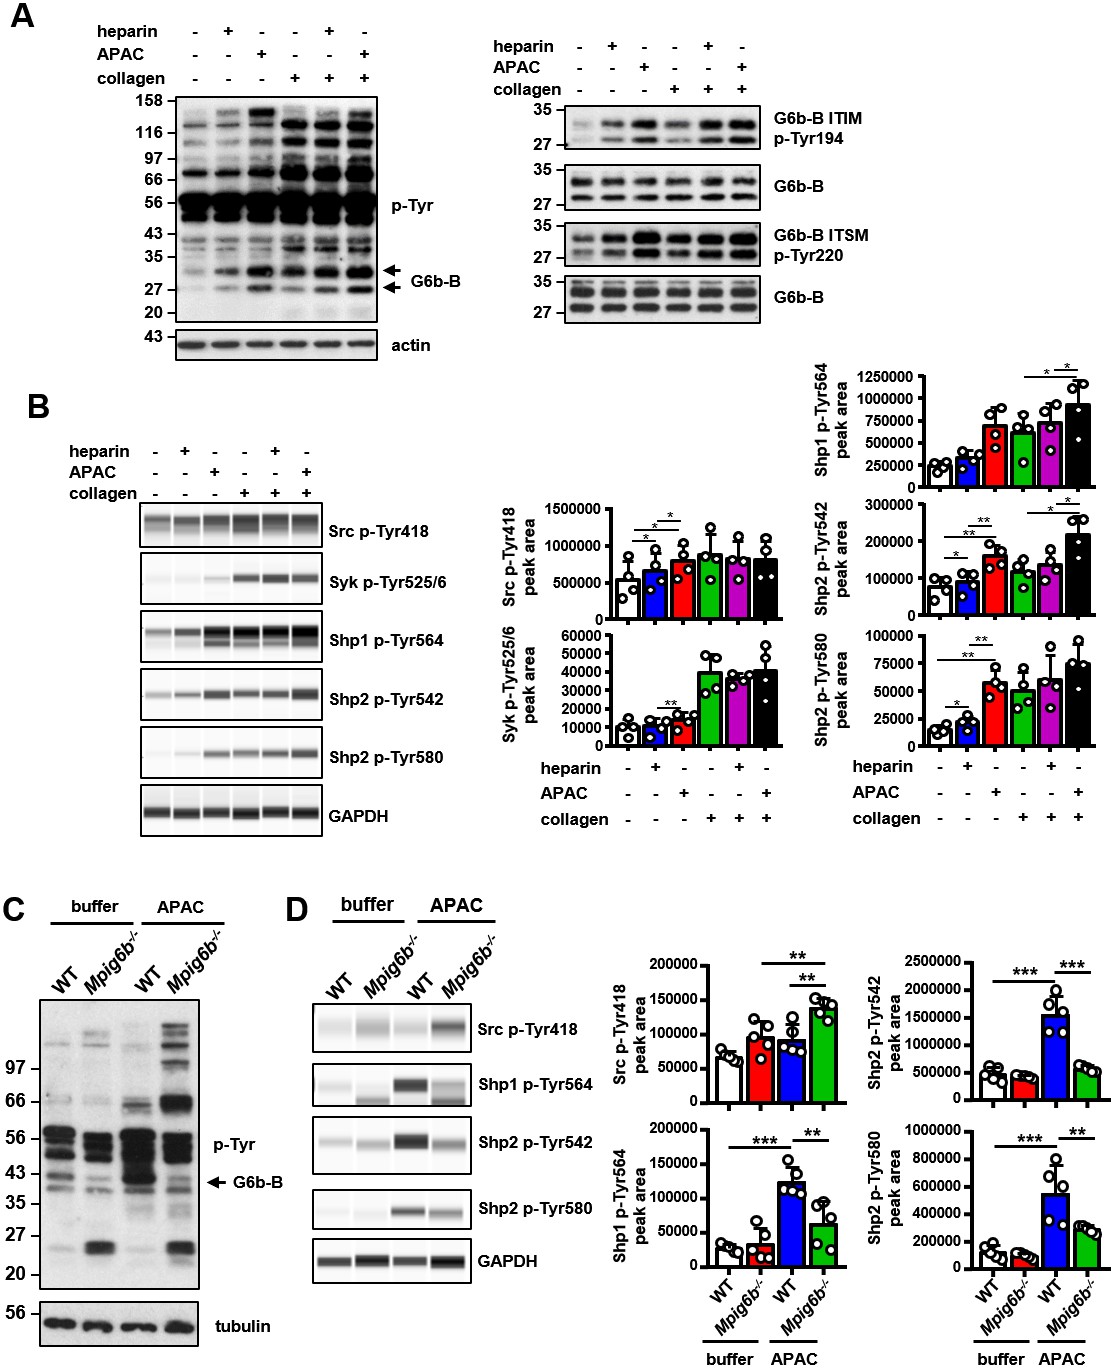
APAC induces G6b-B phosphorylation and downstream signaling.
(A) Washed human platelets (5 × 10⁸/ml) were incubated for 90 s with 0.05 µM APAC, 0.7 µM heparin or buffer in the presence of 10 µM integrilin. Where indicated, platelets were additionally stimulated with 3 µg/ml collagen for 90 s following compound treatment. Samples were lysed and whole cell lysates (WCL) were analyzed by western blotting. Representative western blots are from n = 3–5 independent experiments. (B) Lysates were also analyzed by quantitative capillary-based gel electrophoresis with the indicated antibodies. Representative data are displayed as blots on the left and as quantified peak areas on the right. (C, D) Washed mouse platelets (5 × 10⁸/ml) were incubated for 90 s with 0.05 µM APAC or buffer in the presence of 10 µM lotrafiban. Samples were analyzed as described above. The Mpig6b–/–samples show IgG light chain fragments, which result from IgG binding to the platelet surface. P-values were calculated using one-way ANOVA with Sidak’s post-hoc test. ***, p<0.001; **, p<0.01; and *, p<0.05. p-Tyr, anti-phosphotyrosine (4G10).
Figure 13—figure supplement 1
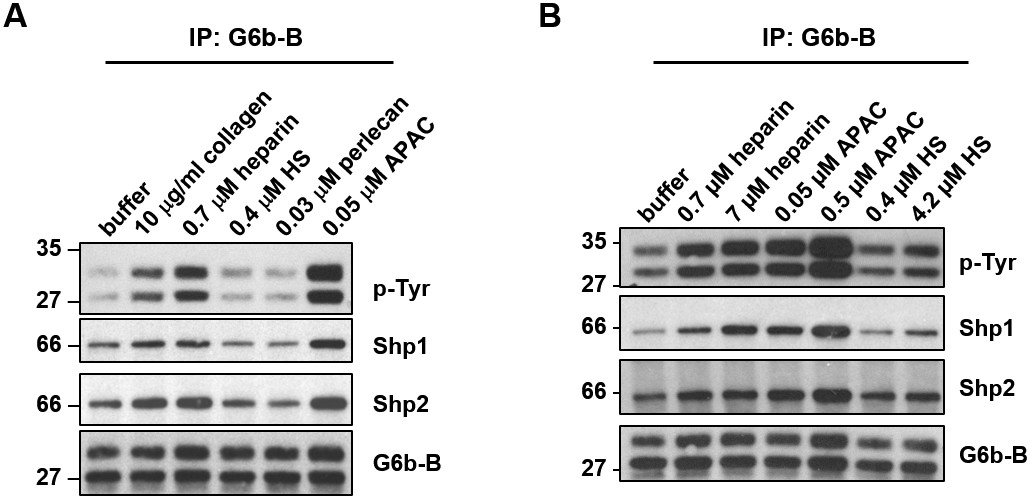
Effects of G6b-B ligands on G6b-B phosphorylation.
(A,B) Washed human platelets (5 × 10⁸/ml) were incubated for 90 s with the indicated compounds in the presence of 10 µM integrillin. Whole cell lysates (WCL) subjected to immunoprecipitation (IP) with an anti-human G6b-B antibody, followed by western blotting.
Figure 14 with 1 supplement
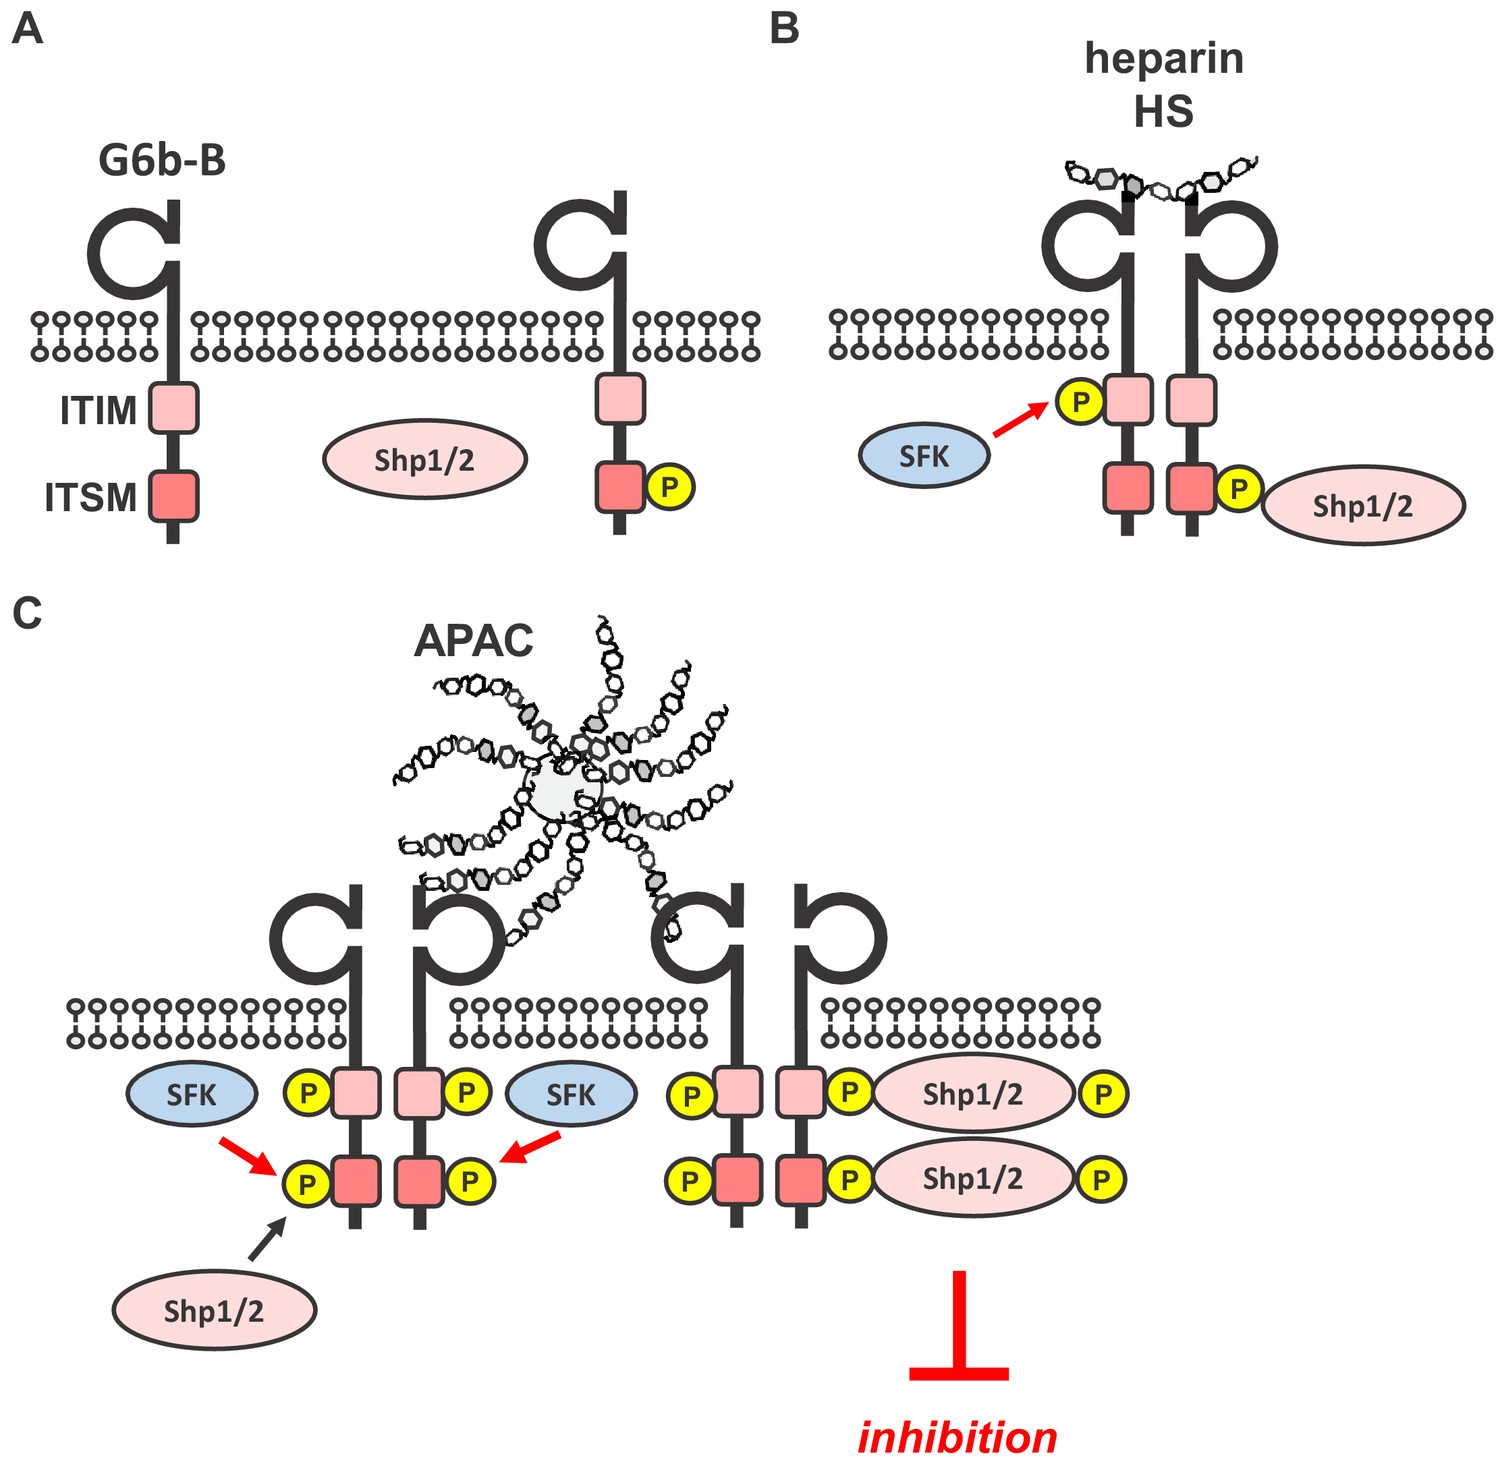
Simplified model of glycan-mediated regulation of G6b-B function.
(A) In the absence of any ligand, G6b-B is mainly present in a monomeric state and phosphorylated to a low degree. (B) Small soluble ligands, for example heparin, induce the dimerization of the receptor, but induce only mild G6b-B phosphorylation and downstream signaling. (C) Multivalent ligands, for example the HS chains of vessel-wall perlecan (not shown) or the heparin molecules in APAC, cluster G6b-B dimers into higher-order oligomers. Hence, they facilitate downstream signaling of G6b-B, including robust phosphorylation of G6b-B and downstream Shp1 and Shp2 phosphatases, resulting in the inhibition of platelet activation. SFK, src family kinase.
Figure 14—figure supplement 1
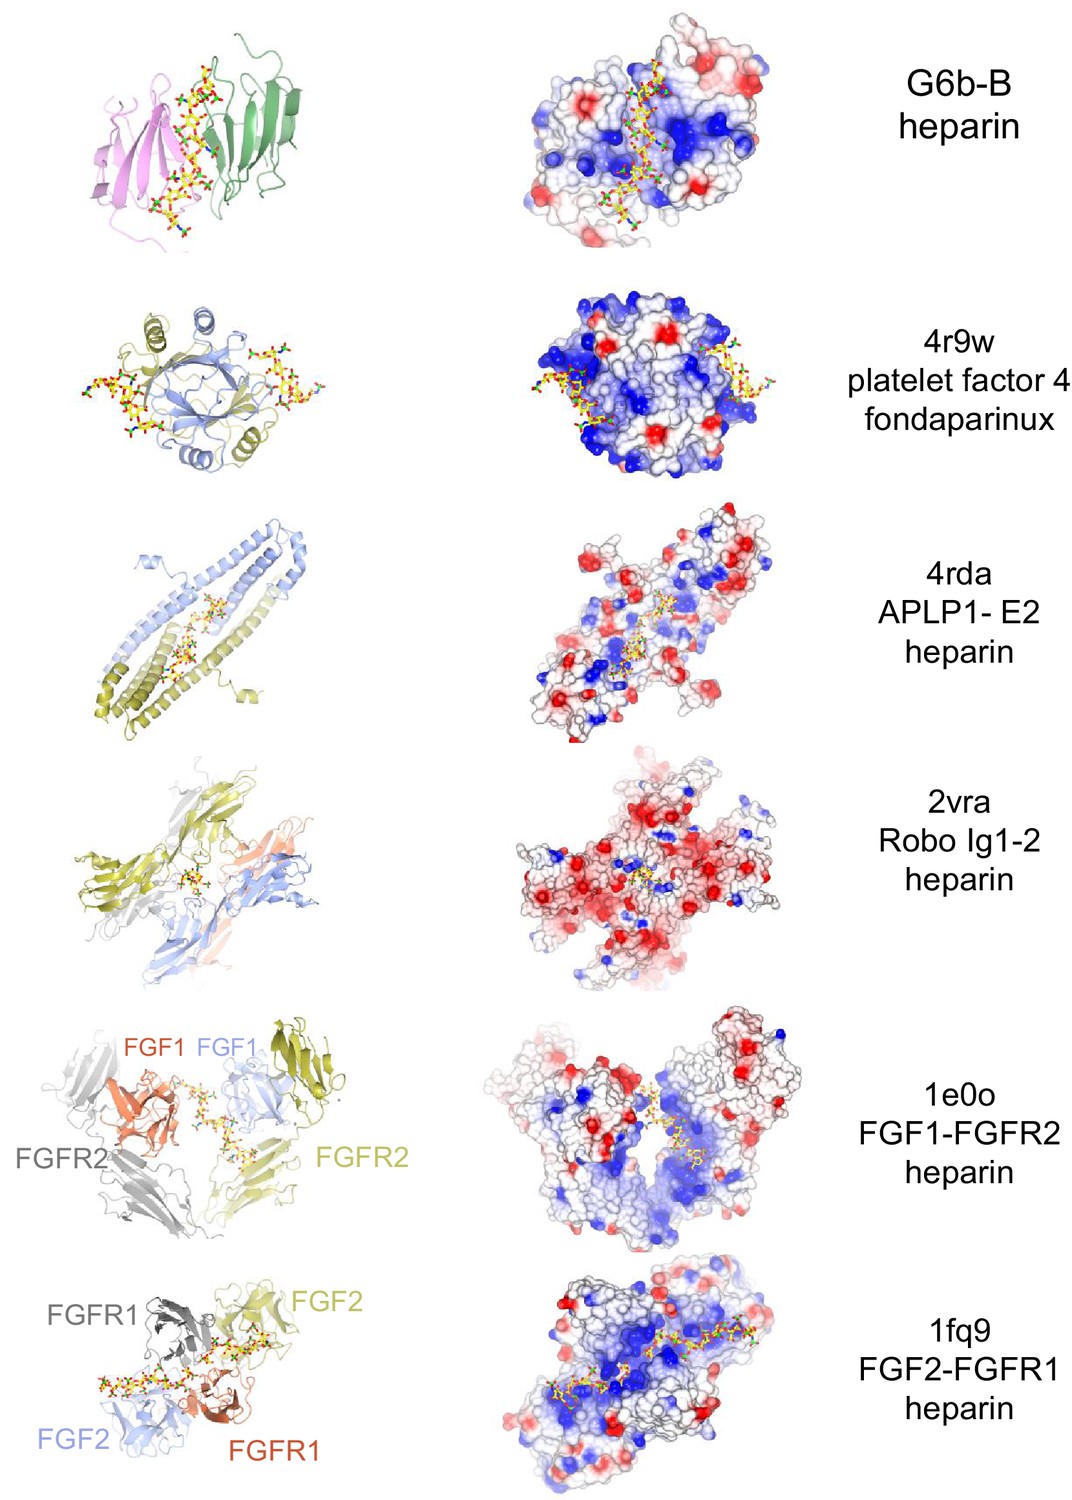
Selected structures of proteins with a heparin ligand.
Side-by-side views of Cα traces (ribbon representation) and electrostatic surfaces of proteins bound to heparin or a heparin analog. The subset includes structures in which the heparin ligand bridges two or more subunits. At the time of writing, the PDB contained 33 proteins structures with heparin as a ligand, in addition to a few structures with heparin analogs. From top to bottom: G6b-B (Fab fragments and glycosyl chains omitted from view); 4r9w, i.e. platelet factor four bound to fondaparinux (synthetic heparin analogue) (Cai et al., 2015); 4rda. i.e. the E2 domain of amyloid precursor protein-like protein 1 (APLP1) (Dahms et al., 2015); 2vra, i.e. immunoglobulin-like domains 1 and 2 of Drosophila Robo (Fukuhara et al., 2008); 1e0o, the ternary complex of FGF1, FGFR2 and heparin (Pellegrini et al., 2000); and 1fq9, the ternary complex of FGF2, FGFR1 and heparin (Schlessinger et al., 2000). The coloring of the electrostatic surfaces show a potential scale from –0.5 V (−19.5 kT/e, red) to +0.5 V (+19.5 kT/e, blue). The ribbon representations are colored by peptide chain, and heparin is shown as a stick model with color code: C, yellow; O, red; N, blue; and S, green.
Author response image 1
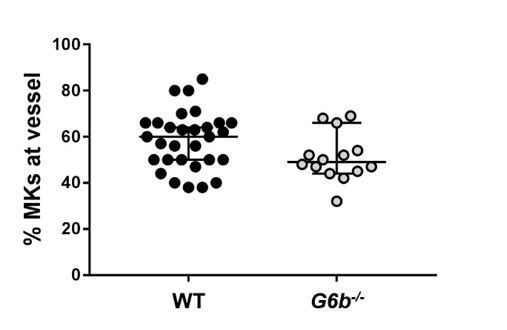
Relative numbers of MKs located at the vessel.
https://doi.org/10.7554/eLife.46840.043
Author response image 2

A pentameric version of the G6b-B protein is used.
CBFH refers to the COMP-β-lactamase-FLAG-3XHis tag. Binding assay was performed nine days post transduction with a sgRNA targeting EXTL3 as described before (Sharma et al., Genome Res., 2018). Two separate batches of cells were infected with the same lentiviral preparation. Representative binding from one experiments is shown. APLP2 is a known HS-binding protein.
Author response image 3
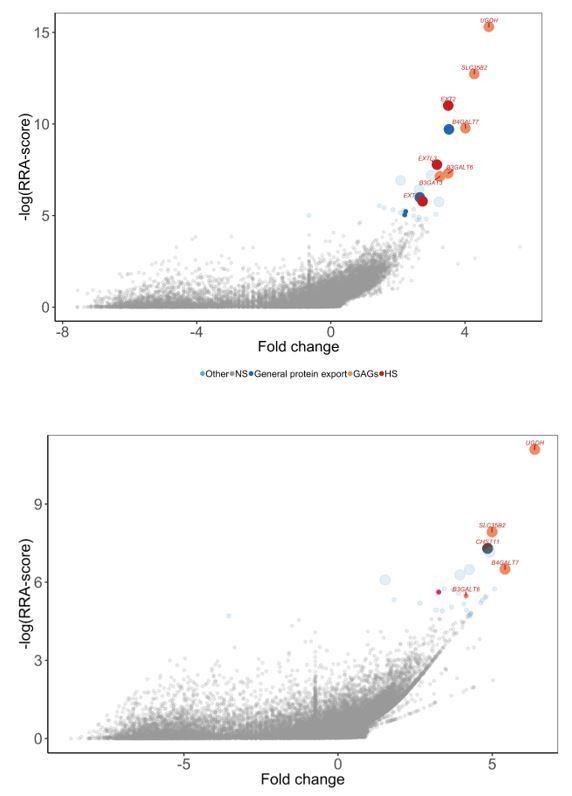
Comparison of genome-wide screens performed for G6b-B (top panel) vs a CS-binding protein (bottom panel).
G6B-BLH screened on HEL cells. Note the presence of HS-specific genes (EXTL3, EXT1, EXT2) only for G6B and CHST11 only for the CS-binding protein.
Author response image 4
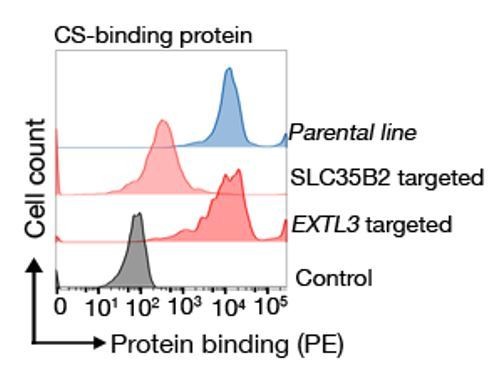
Binding behaviour of a CS binding protein.
Targeting EXTL3 has no effect on binding whereas targeting SLC35B2 clearly abrogates binding.
Tables
Table 1
List of proteins immunoprecipitated with mG6b-B-Fc from vena cava lysates
https://doi.org/10.7554/eLife.46840.006| Accession number | Name | Peptides | Protein score | Protein score negative control | FE |
|---|---|---|---|---|---|
| E9PZ16 | Basement membrane-specific heparan sulfate proteoglycan core protein (perlecan) | 131 | 607.22 | n.d. | |
| E9QPE7 | Myosin-11 | 103 | 468.02 | 719.71 | 0.7 |
| F8VQJ3 | Laminin subunit gamma-1 | 75 | 434.43 | 9.66 | 45.0 |
| Q5SX39 | Myosin-4 | 80 | 328.62 | 587.14 | 0.6 |
| Q8VDD5 | Myosin-9 | 81 | 318.18 | 513.68 | 0.6 |
| P97927 | Laminin subunit alpha-4 | 56 | 285.20 | n.d. | |
| Q61292 | Laminin subunit beta-2 | 63 | 262.37 | n.d. | |
| B2RWX0 | Myosin, heavy polypeptide 1, skeletal muscle, adult | 61 | 244.66 | 446.14 | 0.5 |
| P02469 | Laminin subunit beta-1 | 57 | 236.87 | n.d. | |
| J3QQ16 | Protein Col6a3 | 61 | 232.99 | 14.76 | 15.8 |
| G3UW82 | MCG140437, isoform CRA_d | 54 | 214.75 | 378.87 | 0.6 |
| B7FAU9 | Filamin, alpha | 58 | 202.67 | 139.51 | 1.5 |
| Q3UHL6 | Putative uncharacterized protein — fibronectin | 48 | 192.76 | n.d. | |
| Q9JKF1 | Ras GTPase-activating-like protein IQGAP1 | 31 | 107.79 | 68.57 | 1.6 |
| M0QWP1 | Agrin | 21 | 84.47 | n.d. | |
| P19096 | Fatty acid synthase | 27 | 74.68 | 23.81 | 3.1 |
| Q61001 | Laminin subunit alpha-5 | 23 | 73.24 | n.d. | |
| E9QPX1 | Collagen alpha-1(XVIII) chain | 16 | 59.16 | n.d. | |
| A2AJY2 | Collagen alpha-1(XV) chain | 14 | 53.53 | n.d. | |
| B7ZNH7 | Collagen alpha-1(XIV) chain | 15 | 43.27 | 3.09 | 14.0 |
| P26039 | Talin-1 | 11 | 42.29 | 29.93 | 1.4 |
-
Fold enrichment (FE)=score G6b-B-FC precipitation/score negative control; n.d. = not detectable. Proteins that are prominently present in the negative control (FE < 2) are shown in italic. The protein score was calculated using the SEQUEST HT search algorithm and is the sum of all peptide Xcorr values above the specified score threshold (0.8 + peptide_charge × peptide_relevance_factor where peptide_relevance_factor is a parameter with a default value of 0.4). The full data set, including the mass spectrometry result for the respective band of a G6b-B-FC only sample, is found in Table 1—source data 1–3. A picture of a gel and the bands excised for mass-spectrometric analysis are shown in Figure 1—figure supplement 3.
-
Table 1—source data 1
Mass spectrometry results for proteins precipitated from vena cava lysates with mG6b-B-Fc.
- https://doi.org/10.7554/eLife.46840.007
-
Table 1—source data 2
Mass spectrometry results for proteins precipitated from vena cava lysates with Fc control protein.
- https://doi.org/10.7554/eLife.46840.008
-
Table 1—source data 3
Mass spectrometry results for the proteins detected at the respective height after loading mG6b-B-Fc only (no vena cava lysate).
- https://doi.org/10.7554/eLife.46840.009
Table 2
Crystallographic data collection and refinement statistics for the G6b-B ECD–dp12–Fab complex.
https://doi.org/10.7554/eLife.46840.022| X-ray diffraction data | |
|---|---|
| Beamline | I03, Diamond Light Source |
| Wavelength (Å) | 0.97624 |
| Space group | C2 |
| Cell parameters (Å) | 183.8, 72.34, 131.0, β = 124.5° |
| Complexes per asymmetric unit | 1 |
| Resolution range (Å) | 65.27–3.13 |
| High resolution shell (Å) | 3.18–3.13 |
| Rmerge (%)* | 17.0 (146.6) |
| Total observations, unique reflections | 74,255/24,543 |
| I/σ(I)* | 4.0 (0.7) |
| Completeness (%)* | 97.2 (98.2) |
| Multiplicity* | 3.0 (3.1) |
| CC1/2*, † | 0.991 (0.348) |
| Refinement | |
| Resolution range | 63.1–3.13 |
| Unique reflections | 24,543 |
| Rcryst, Rfree (%) | 22.6, 26.0 |
| Number of non-H atoms | 7852 |
| RMSD bonds (Å) | 0.01 |
| RMSD angles (°) | 1.18 |
| B-factors | |
| Wilson (Å2) | 77.5 |
| Average overall (Å2) | 84.7 |
| RMSD B-factors (Å2) | 5.737 |
| Ramachandran statistics‡ | |
| Favored regions (%) | 91.2 |
| Allowed regions (%) | 8.3 |
| Disallowed (%) | 0.5 |
-
* parentheses refer to the high resolution shell.
† as defined in Karplus and Diederichs (2012).
-
‡ calculated using molprobity (Williams et al., 2018).
Table 3
Surface plasmon resonance affinities.
https://doi.org/10.7554/eLife.46840.027| Immobilized G6b-B receptor (standard configuration) | ||||
|---|---|---|---|---|
| Ligand | G6b-B | Kon | Koff | KD (M) |
| Heparin | Monomer | 1.12 ± 0.39×10⁶ | 2.01 ± 0.54×10⁻³ | 2.00 ± 1.17×10⁻⁹ |
| Dimer | 0.60 ± 0.56×10⁶ | 3.16 ± 1.17×10⁻³ | 7.76 ± 5.30×10⁻⁹ | |
| Fractionated HS | Monomer | 1.33 ± 0.01×10⁵ | 9.99 ± 0.16×10⁻⁴ | 7.47 ± 0.17×10⁻⁹ |
| Dimer | 1.20 ± 0.08×10⁵ | 1.71 ± 1.11×10⁻³ | 14.0 ± 8.26×10⁻⁹ | |
| Perlecan | Monomer | 1.94 ± 1.72×10² | 1.01 ± 0.37×10⁻⁴ | 7.32 ± 4.64×10⁻⁷ |
| Dimer | 5.79 ± 6.94×10³ | 2.28 ± 2.51×10⁻³ | 4.74 ± 1.34×10⁻⁷ | |
| dp12 | Monomer | 0.31 ± 0.27×10⁶ | 2.39 ± 1.79×10⁻³ | 8.12 ± 1.22×10⁻⁹ |
| Dimer | 2.50 ± 2.72×10⁶ | 4.60 ± 5.01×10⁻³ | 1.84 ± 0.01×10⁻⁹ | |
| Immobilized ligand (reversed configuration) | ||||
| Ligand | G6b-B | Kon | Koff | KD (M) |
| Heparin | Monomer | 1.30 ± 0.29×10⁵ | 8.85 ± 0.40×10⁻² | 6.99 ± 1.25×10⁻⁷ |
| Dimer | 3.28 ± 0.53×10⁵ | 1.73 ± 0.04×10⁻³ | 5.33 ± 0.75×10⁻⁹ | |
| Fractionated HS | Monomer | 9.22 ± 2.67×10³ | 6.40 ± 0.33×10⁻³ | 7.31 ± 2.47×10⁻⁷ |
| Dimer | 3.76 ± 4.69×10⁴ | 4.58 ± 6.32×10⁻⁴ | 7.70 ± 7.21×10⁻⁹ | |
| Perlecan | Monomer | 6.73 ± 3.38×10³ | 1.28 ± 0.24×10⁻³ | 2.28 ± 1.51×10⁻⁷ |
| Dimer | 4.90 ± 2.16×10⁴ | 6.78 ± 2.57×10⁻⁴ | 1.41 ± 0.09×10⁻⁸ | |
-
Values are means ± SD from two independent experiments.
Key resources table
| Reagent type (species) or resource | Designation | Source or reference | Identifiers | Additional information |
|---|---|---|---|---|
| Genetic reagent (Mus musculus) | Mpig6b–/– | PMID: 23112346 | Dr. Yotis Senis (University of Birmingham and EFS Grand Est, Inserm UMR-S1255) | |
| Genetic reagent (M. musculus) | Mpig6bdiYF/diYF | PMID: 29891536 | Dr. Yotis Senis (University of Birmingham and EFS Grand Est, Inserm UMR-S1255) | |
| Cell line (Cricetulus griseus) | A5 CHO | other | provided by Dr. Ana Kasirer-Friede and Dr. Sanford Shattil (University of California, San Diego) | |
| Antibody | anti-perlecan (rat monoclonal) | Santa Cruz Biotechnologies | clone A7L6; sc-33707; RRID:AB_627714 | (1:100); used for IF staining of bone marrow (BM) |
| Antibody | anti-mouse CD105 (Endoglin) (rat monoclonal) | eBioscience/Thermo Fisher Scientific | #MA5-17943; clone MJ7/18; RRID:AB_2539327 | (1:100); used for IF staining of BM |
| Antibody | anti-GPIX-Alexa488 (rat monoclonal) | other | clone 56F8 | 1.4 µg/ml; used for IF staining of BM, custom made lab reagent |
| Antibody | anti rat IgG Alexa 647 (goat polyclonal) | Invitrogen | #A-21247; RRID:AB_141778 | (1:300); used for IF staining of BM |
| Antibody | anti rat IgG Alexa 546 (goat polyclonal) | Invitrogen | #A-11081; RRID:AB_141738 | (1:300); used for IF staining of BM |
| Antibody | anti-actin (mouse monoclonal) | Sigma-Aldrich | #A4700, clone AC-40; RRID:AB_476730 | (1:1000) |
| Antibody | Anti-α-tubulin (mouse monoclonal) | Sigma-Aldrich | #T6199, clone DM1A; RRID:AB_477583 | (1:1000) |
| Antibody | anti-GAPDH (rabbit monoclonal) | Cell Signaling Technology | #2118, clone: 14C10; RRID:AB_561053 | (1:10) dilution, on 0.05 mg/ml lysates for Wes |
| Antibody | anti-Src p-Tyr418 (rabbit polyclonal) | Sigma-Aldrich | #44660G; RRID:AB_1500523 | (1:10) dilution, on 0.05 mg/ml lysates for Wes |
| Antibody | anti-Shp1 p-Tyr564 (rabbit monoclonal) | Cell Signaling Technology | #8849, clone: D11G5; RRID:AB_11141050 | (1:10) dilution, on 0.2 mg/ml lysates for Wes |
| Antibody | anti-Shp2 p-Tyr542 (rabbit polyclonal) | Cell Signaling Technology | #3751; RRID:AB_330825 | (1:10) dilution, on 0.2 mg/ml lysates for Wes |
| Antibody | anti-Shp2 p-Tyr580 (rabbit polyclonal) | Cell Signaling Technology | #3703; RRID:AB_2174962 | (1:10) dilution, on 0.2 mg/ml lysates for Wes |
| Antibody | anti-Syk p-Tyr525/6 (rabbit polyclonal) | Cell Signaling Technology | #2711; RRID:AB_2197215 | (1:50) dilution, on 0.2 mg/ml lysates for Wes |
| Antibody | anti-SH-PTP1/Shp-1 (rabbit polyclonal) | Santa Cruz | sc-287 (C19); RRID:AB_2173829 | (1:1000) |
| Antibody | anti-SH-PTP2/Shp-2 (rabbit polyclonal) | Santa Cruz | sc-280 (C18); RRID:AB_632401 | (1:1000) |
| Antibody | anti-phosphotyrosine (mouse monoclonal) | Merck-Millipore | 05–321, clone 4G10; RRID:AB_309678 | (1:1000) |
| Antibody | anti-human G6b-B (mouse monoclonal) | other | clone 17–4 | 10 µg/ml, custom-made lab reagent |
| Peptide, recombinant protein | purified human IgG-Fc fragment | Bethyl Laboratories | P80-104 | |
| Peptide, recombinant protein | recombinant Mouse Syndecan-2/CD362 protein, CF | R&D Systems | 6585-SD-050 | |
| Peptide, recombinant protein | recombinanthuman Agrin protein, N-terminal, CF | R&D Systems | 8909-AG-050 | |
| Peptide, recombinant protein | rec. human laminin 111 | Biolamina | LN111-02 | |
| Peptide, recombinant protein | rec. human laminin 411 | Biolamina | LN411-02 | |
| Peptide, recombinant protein | rec. human laminin 421 | Biolamina | LN421-02 | |
| Peptide, recombinant protein | rec. human laminin 511 | Biolamina | LN511-02 | |
| Peptide, recombinant protein | rec. human laminin 521 | Biolamina | LN521-02 | |
| Chemical compound, drug | heparan sulfate proteoglycan | Sigma-Aldrich | H4777 | alternative name: perlecan |
| Chemical compound, drug | heparin | Iduron | HEP001 | https://iduron.co.uk/product/Heparin-1 |
| Chemical compound, drug | heparin oligosaccharide dp4 | Iduron | HO04 | https://iduron.co.uk/product/Heparin-1 |
| Chemical compound, drug | heparin oligosaccharide dp8 | Iduron | HO08 | https://iduron.co.uk/product/Heparin-1 |
| Chemical compound, drug | heparin oligosaccharide dp12 | Iduron | HO12 | https://iduron.co.uk/product/Heparin-1 |
| Chemical compound, drug | heparin oligosaccharide dp20 | Iduron | HO20 | https://iduron.co.uk/product/Heparin-1 |
| Chemical compound, drug | 2-O-desulphated heparin | Iduron | DSH001/2 | |
| Chemical compound, drug | 6-O-desulphated heparin | Iduron | DSH002/6 | |
| Chemical compound, drug | N desulphated heparin | Iduron | DSH003/N | |
| Chemical compound, drug | N-desulphated re N-acetylated heparin | Iduron | DSH004/Nac | |
| Chemical compound, drug | heparan sulphate | Iduron | GAG-HS01 | |
| Chemical compound, drug | HS fraction III approx. mol. wt. 9 kDa | Iduron | GAG-HS III | |
| Chemical compound, drug | APAC | Aplagon Oy | ||
| Chemical compound, drug | heparinase III (heparitinase I) Flavobacterium heparinum (EC 4.2.2.8) | AMSBiotechnology | AMS.HEP-ENZ III | |
| Chemical compound, drug | Heparin−biotin sodium salt | Sigma-Aldrich | B9806-10MG | |
| Chemical compound, drug | fibronectin | Cabiochem | Cat #341631 | |
| Chemical compound, drug | fibrinogen | Enzyme Research Laboratories | Fib 3 3496L | |
| Chemical compound, drug | collagen I | Takeda | 1130630 | collagen reagens horms |
| Chemical compound, drug | Cultrex Mouse Collagen IV | Trevigen | 3410-010-01 | purchased via R & D Systems |
| Chemical compound, drug | Laminin from EHS murine sarcoma basement membrane | Sigma-Aldrich | L2020 | refers to mouse laminin-111 in this study |
| Chemical compound, drug | streptavidin | Sigma-Aldrich | S4762 | |
| Software | Cell Profiler (2.2.0) | Broad Institute | http://cellprofiler.org/ RRID:SCR_007358 | |
| Software | Fiji | PMID: 22743772 | https://imagej.net/Fiji; RRID:SCR_002285 |
Additional files
-
Transparent reporting form
- https://doi.org/10.7554/eLife.46840.041
Download links
A two-part list of links to download the article, or parts of the article, in various formats.
Downloads (link to download the article as PDF)
Open citations (links to open the citations from this article in various online reference manager services)
Cite this article (links to download the citations from this article in formats compatible with various reference manager tools)
Heparan sulfates are critical regulators of the inhibitory megakaryocyte-platelet receptor G6b-B
eLife 8:e46840.
https://doi.org/10.7554/eLife.46840


