Cerebellar climbing fibers encode expected reward size
- The Hebrew University of Jerusalem, Israel
Figures
Figure 1 with 2 supplements
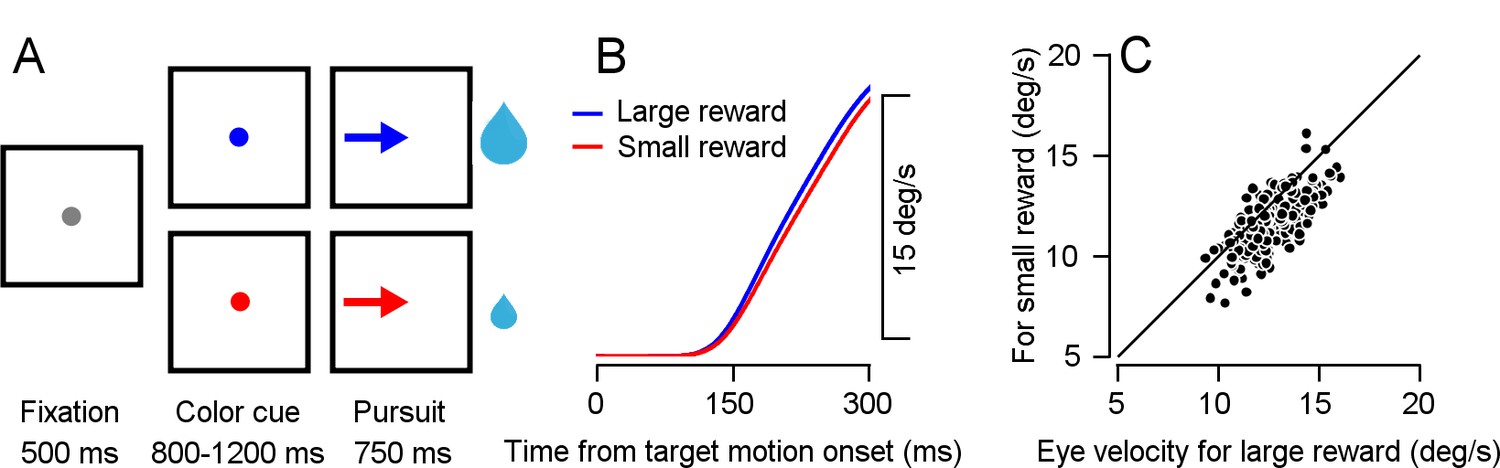
Smooth pursuit eye-movement task.
(A) Eye movement task temporally separates reward expectation, pursuit behavior and reward delivery. (B) Traces of average eye speed, in the first 300 ms after target motion onset. Target velocity was 20 °/s. (C) Each dot represents the average speed for an individual session 250 ms after target movement onset for the large (horizontal) and small (vertical) reward cue (Signed-rank, p = 8.6*10−24, n = 208).
Figure 1—figure supplement 1
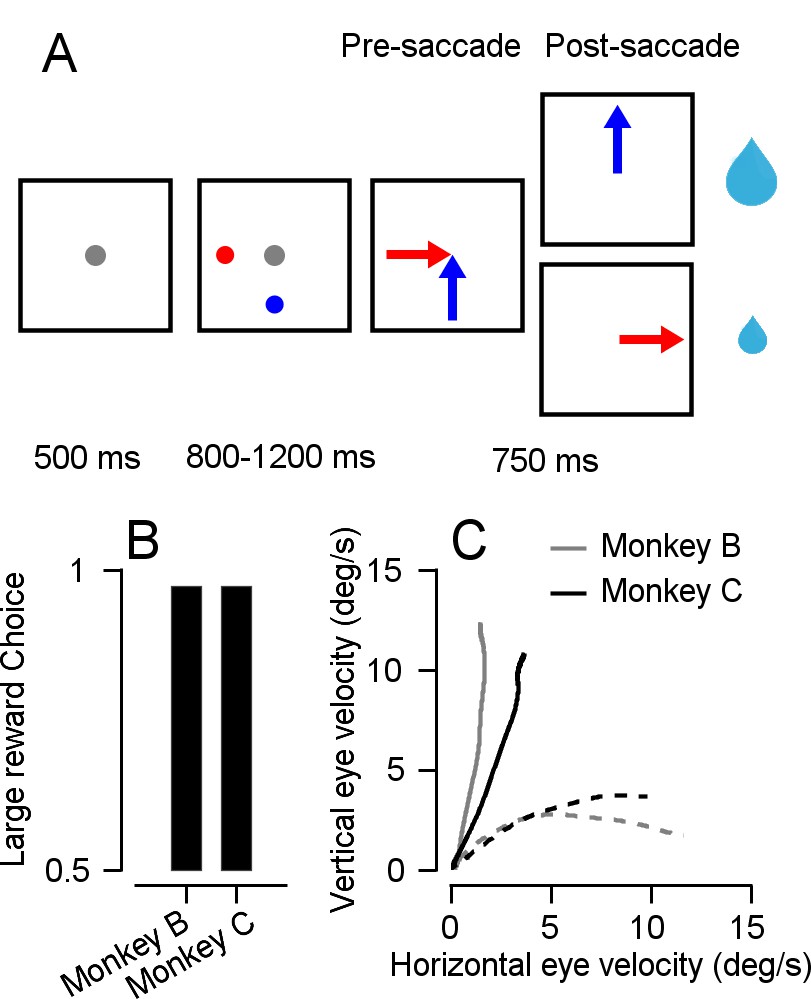
Monkeys associate reward size with target color.
(A) Schematics of the target selection task (Joshua and Lisberger, 2012). The dots represent the different targets and the arrows represent the target motion direction. The size of the reward was determined by the target selected by the monkey. (B) Fraction of trials in which the monkey selected the large reward target. Bars show the averages across sessions. SEMs were smaller than the line width and therefore cannot be presented. (C) Eye velocity in the vertical versus horizontal direction during the first 300 ms after motion onset of the targets. Time begins with eye velocity at the origin, as time progresses toward 300 ms, eye velocity moves outward along each trace in the graph. Solid traces show trials in which the large reward target moved vertically, and dashed traces show trials in which the large reward target moved horizontally. The adjacency of the traces to the axes indicates the bias in pursuit towards the large reward target (Joshua and Lisberger, 2012). Gray and black traces show the averages for monkey B and C.
Figure 1—figure supplement 2

MRI and examples of extracellular recordings of Cspks.
(A) MRI of the sagittal section 11 mm lateral to the midline. Chambers were placed above the floccular complex and neighboring areas. The cyan ellipses represent the approximate location of the Flocculus and the yellow ellipses the approximate location of the Paraflocculus. (B) Histogram of the average firing rate of cells. The histogram is centered around 1 Hz with is typical for Cspks. (C) Example of extracellular recordings of Cspks from two neurons. Each column shows Cspks from the same neuron. (D) The cross-correlation of simple spikes to complex spikes, which is essentially a PSTH of Sspks aligned to the event of a Cspk occurrence. The prolonged decrease in Sspk rate following a Cspk is consistent with the literature (Schonewille et al., 2006; Yang and Lisberger, 2014).
Figure 2 with 1 supplement
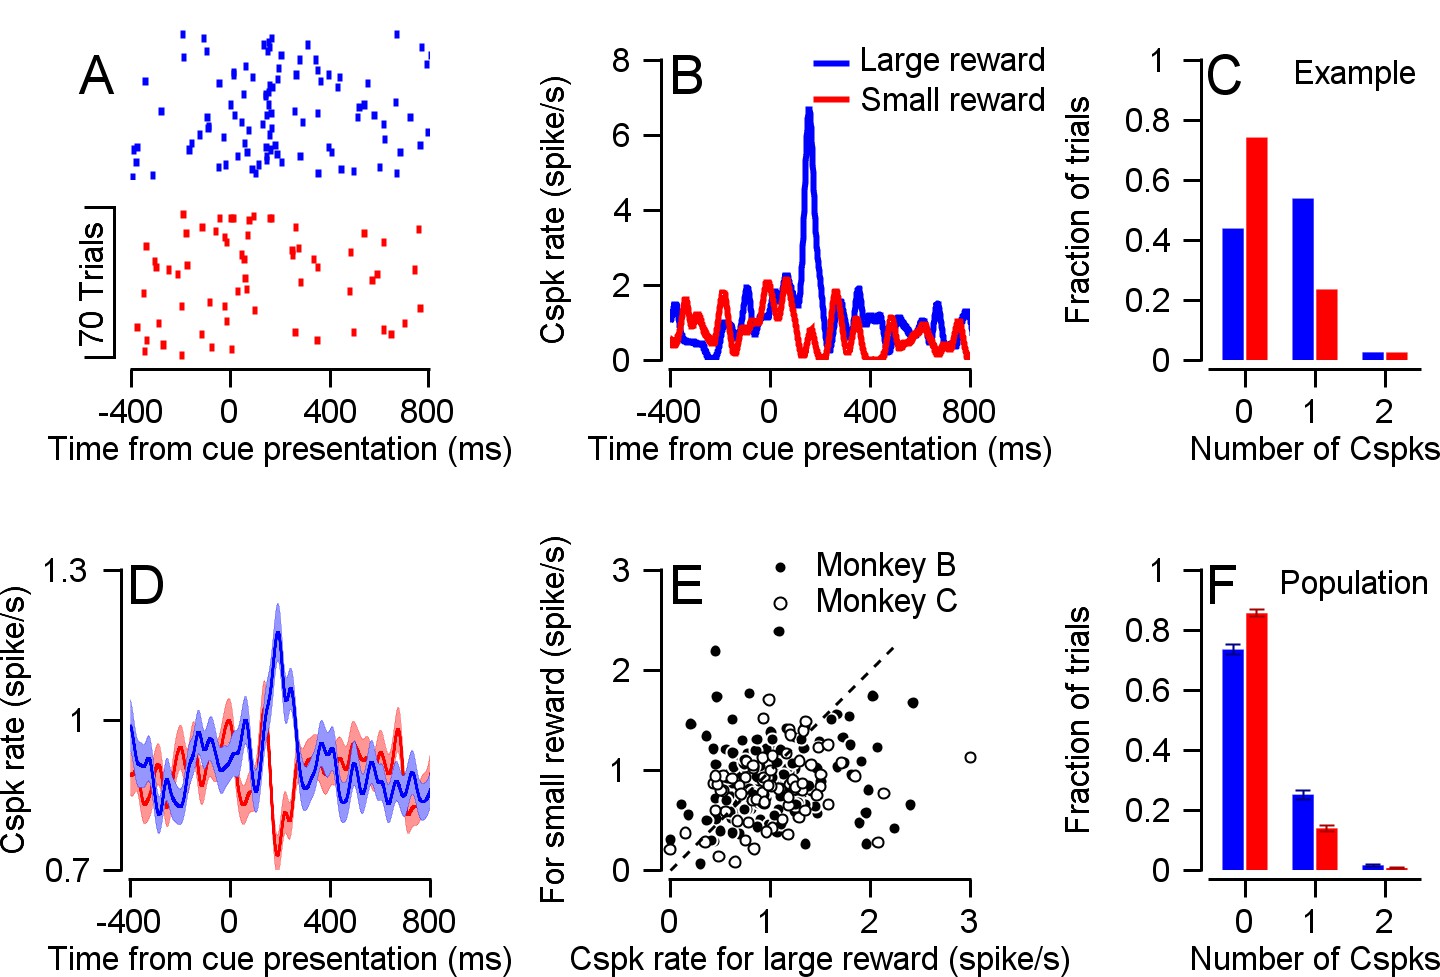
Cspk rate differentiates reward conditions during cue presentation.
(A) Raster plot of an example cell in the two reward conditions, aligned to cue presentation. (B) PSTH of the cell in A. (C) Histogram of the number of Cspks that occurred in the 100–300 ms time window following cue presentation, in the same example cell. (D) Population PSTH. In all figures the error bars represent SEM. (E), Each dot represents the average Cspk rate of an individual cell 100–300 ms after the display of the large (horizontal) and small (vertical) reward cue (Signed-rank, Monkey B: p = 0.01, n = 148, Monkey C: p = 3.35*10−4, n = 72). (F) Histogram of the number of Cspks that occurred in the 100–300 ms time window following cue presentation, in the entire population (fraction of trials with 1 Cspks: Signed-rank, p = 5.1*10−4, n = 40; fraction of trials with two Cspks: Signed-rank, p = 0.03, n = 40).
Figure 2—figure supplement 1
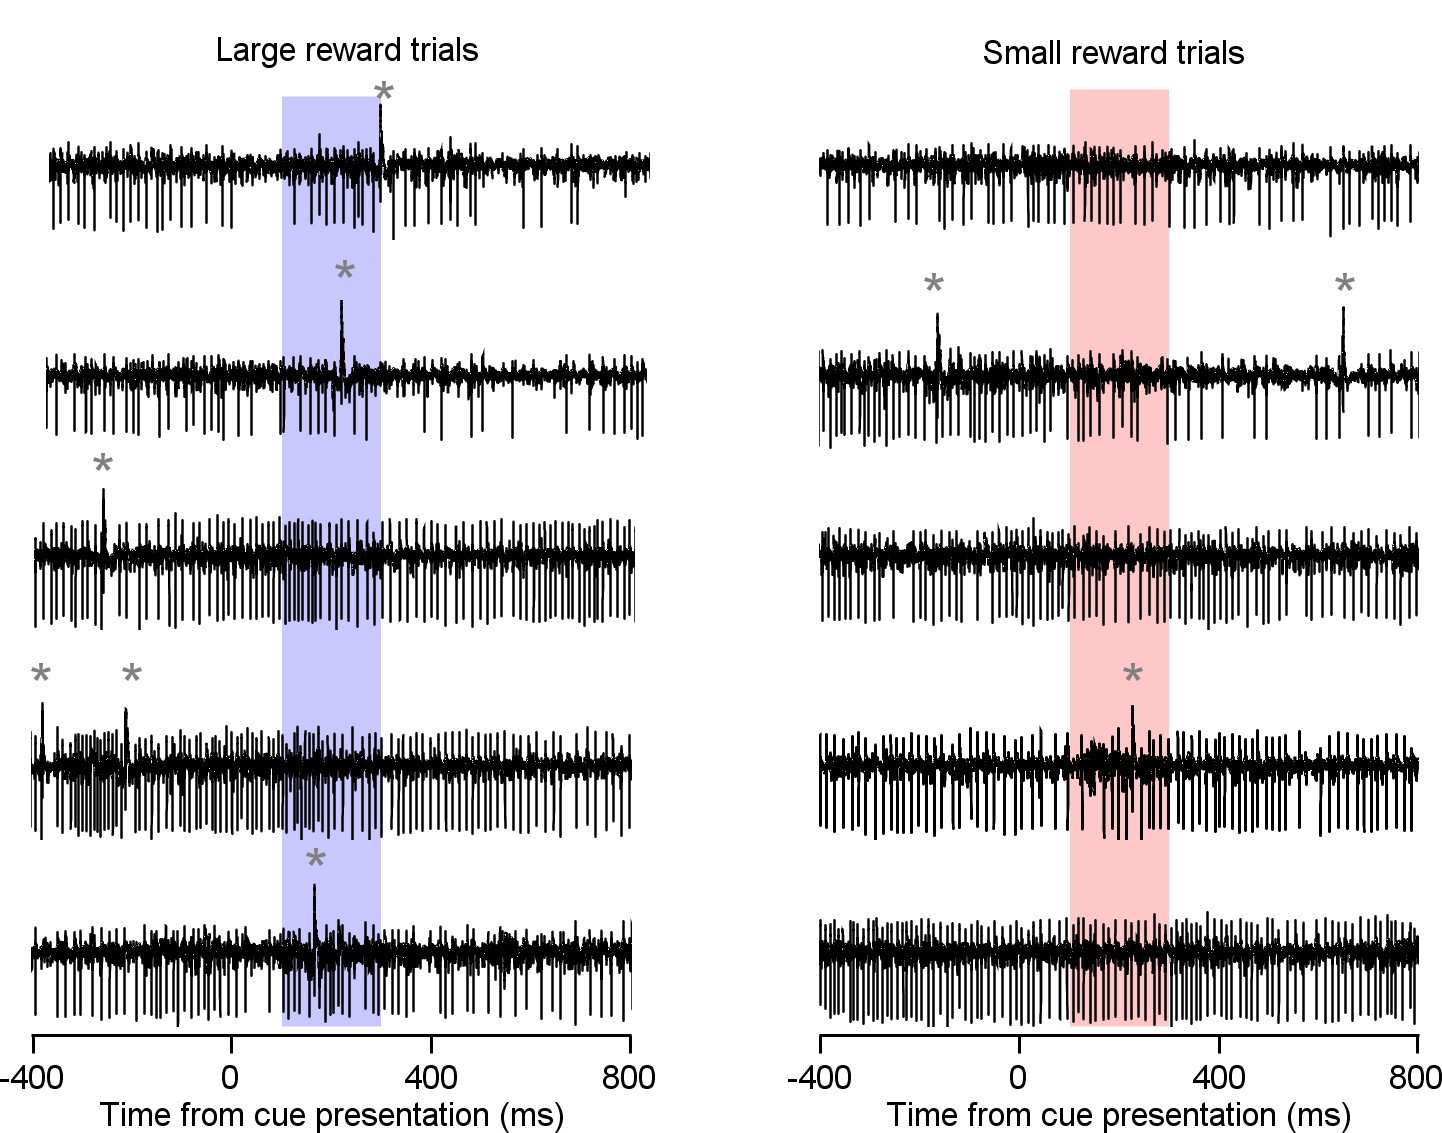
Fraction of trials with Cspks following the cue presentation is higher in the large reward condition than in the small reward condition.
Examples of raw data traces of individual trials for the example cell in Figure 2A in the large (right) and small (left) reward conditions. The gray asterisks mark a Cspk and the colored rectangle marks the 100–300 ms time bin following the cue. Trials with more than a single spike in the analysis window were very rare.
Figure 3 with 2 supplements
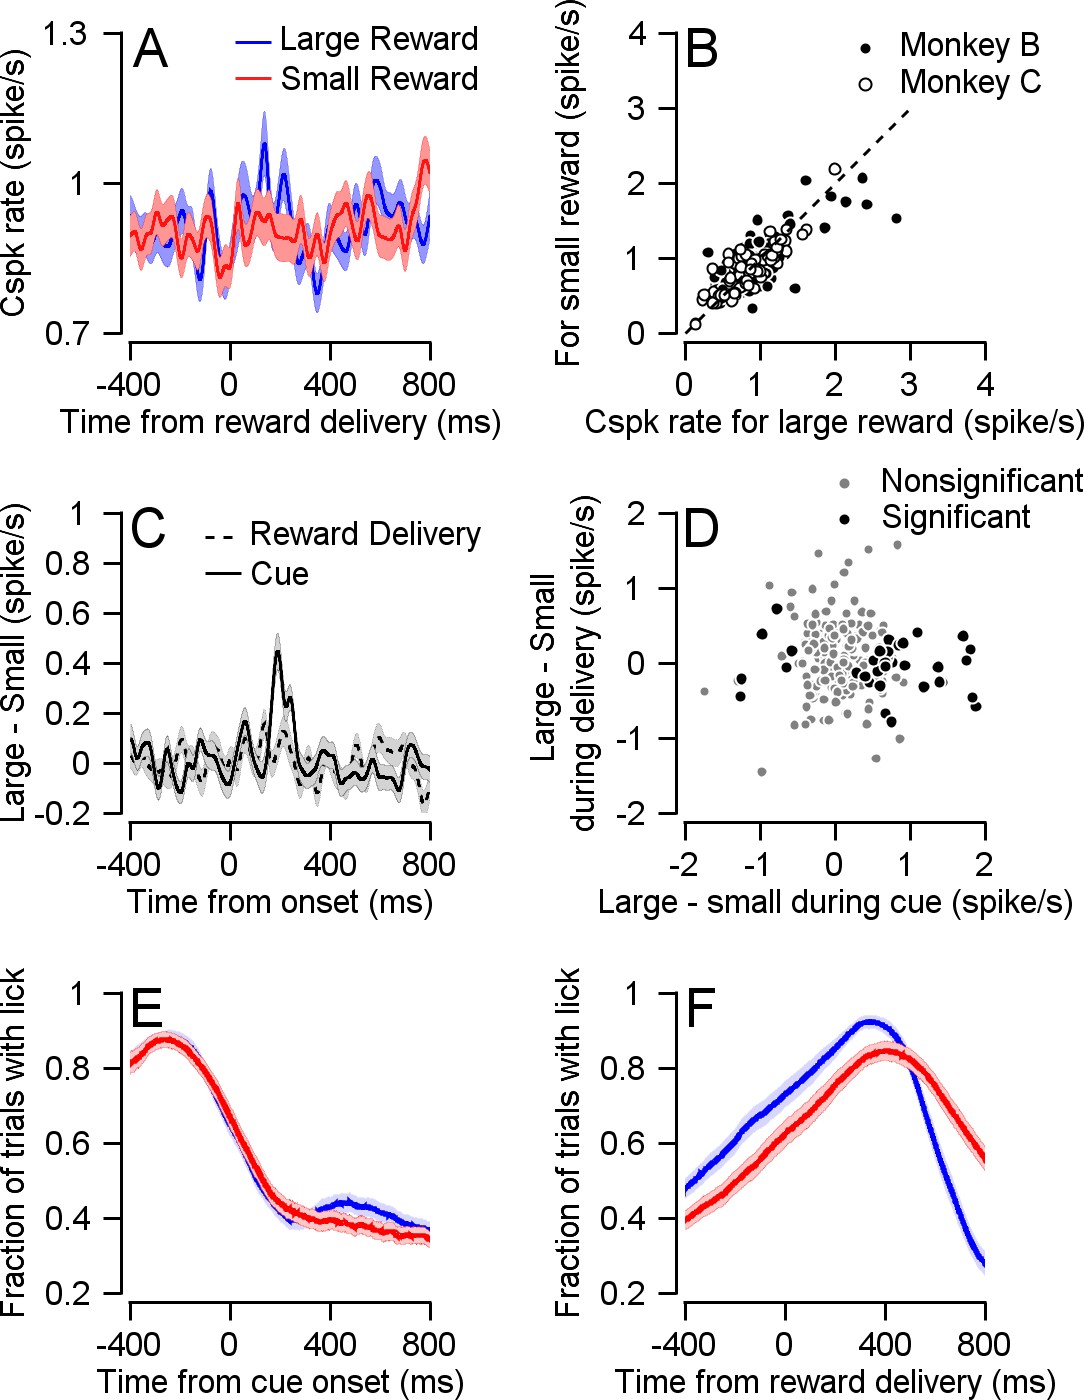
Cspk is not modulated by reward size during reward delivery.
(A) Population PSTHs for different reward conditions aligned to reward delivery. (B) Each dot represents the average Cspk rate of an individual cell 100–300 ms large (horizontal) and small (vertical) reward delivery (Signed-rank, Monkey B: p = 0.339, n = 148; Monkey C: p = 0.719, n = 72). (C) The differences between the PSTH for large and small rewards aligned to cue or to reward delivery. (D) Each dot represents the average Cspk rate of an individual cell 100–300 ms after the cue (horizontal) and reward delivery (vertical; Spearman correlation of all cells: r = −0.069, p = 0.304, n = 220; Spearman correlation of cells that responded to reward size during cue: r = −0.056, p = 0.727, n = 40). (E) and (F) Fraction of trials with licks, during cue and reward delivery.
Figure 3—figure supplement 1
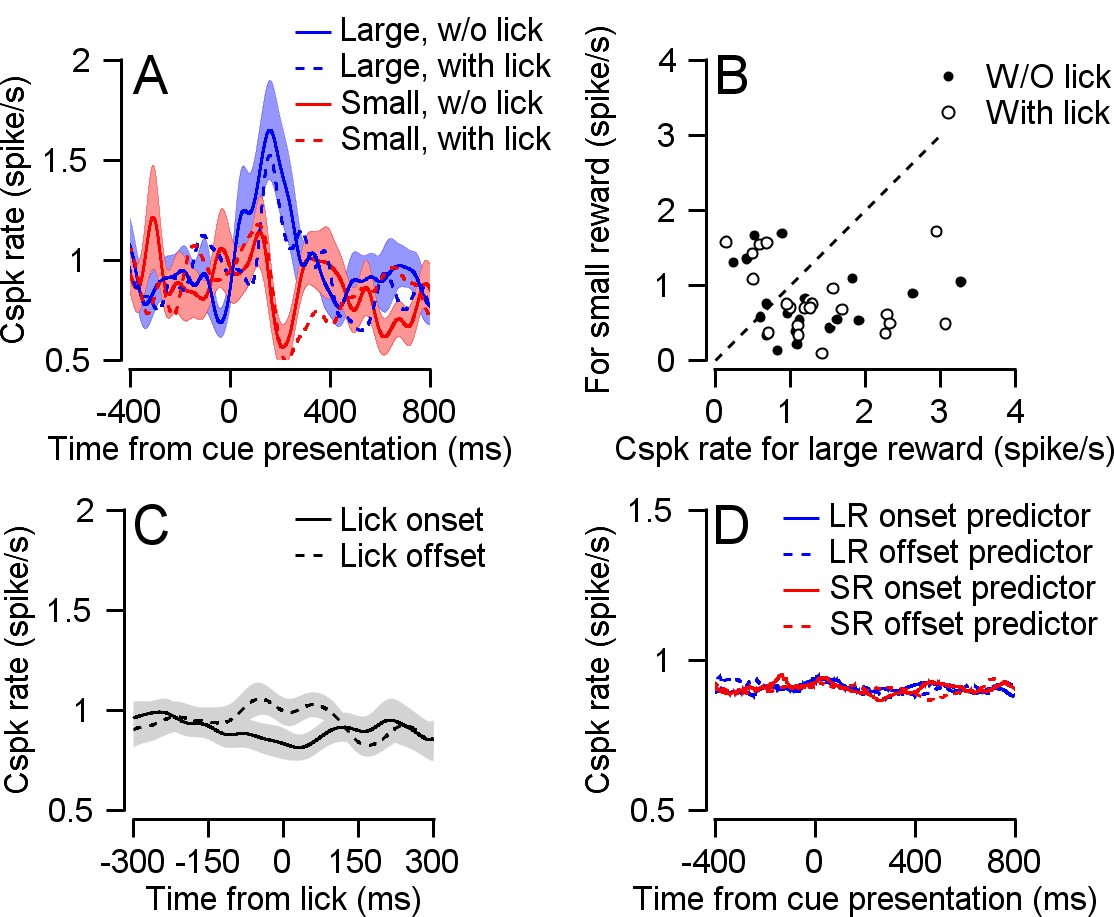
Licking behavior does not underpin the Cspk rate difference during the cue.
(A) Dashed and solid traces show large (blue) and small (red) reward trials with and without a lick initiation in the first 500 ms after the onset of the cue. (B) Each dot represents the average Cspk rate of an individual cell 100–300 ms following large (horizontal) and small (vertical) reward delivery. Filled dots show the averages for trials with a lick and empty dots without a lick (Signed-rank, with lick: p = 0.068, n = 21; without lick: p = 0.04, n = 21). (C) PETH aligned to either the onset of a lick (solid) or the offset of a lick (dashed). (D) Predicted PSTH based on the timing of lick onset and offset, and the PETHs in C for large and small rewards (see Materials and methods).
Figure 3—figure supplement 2
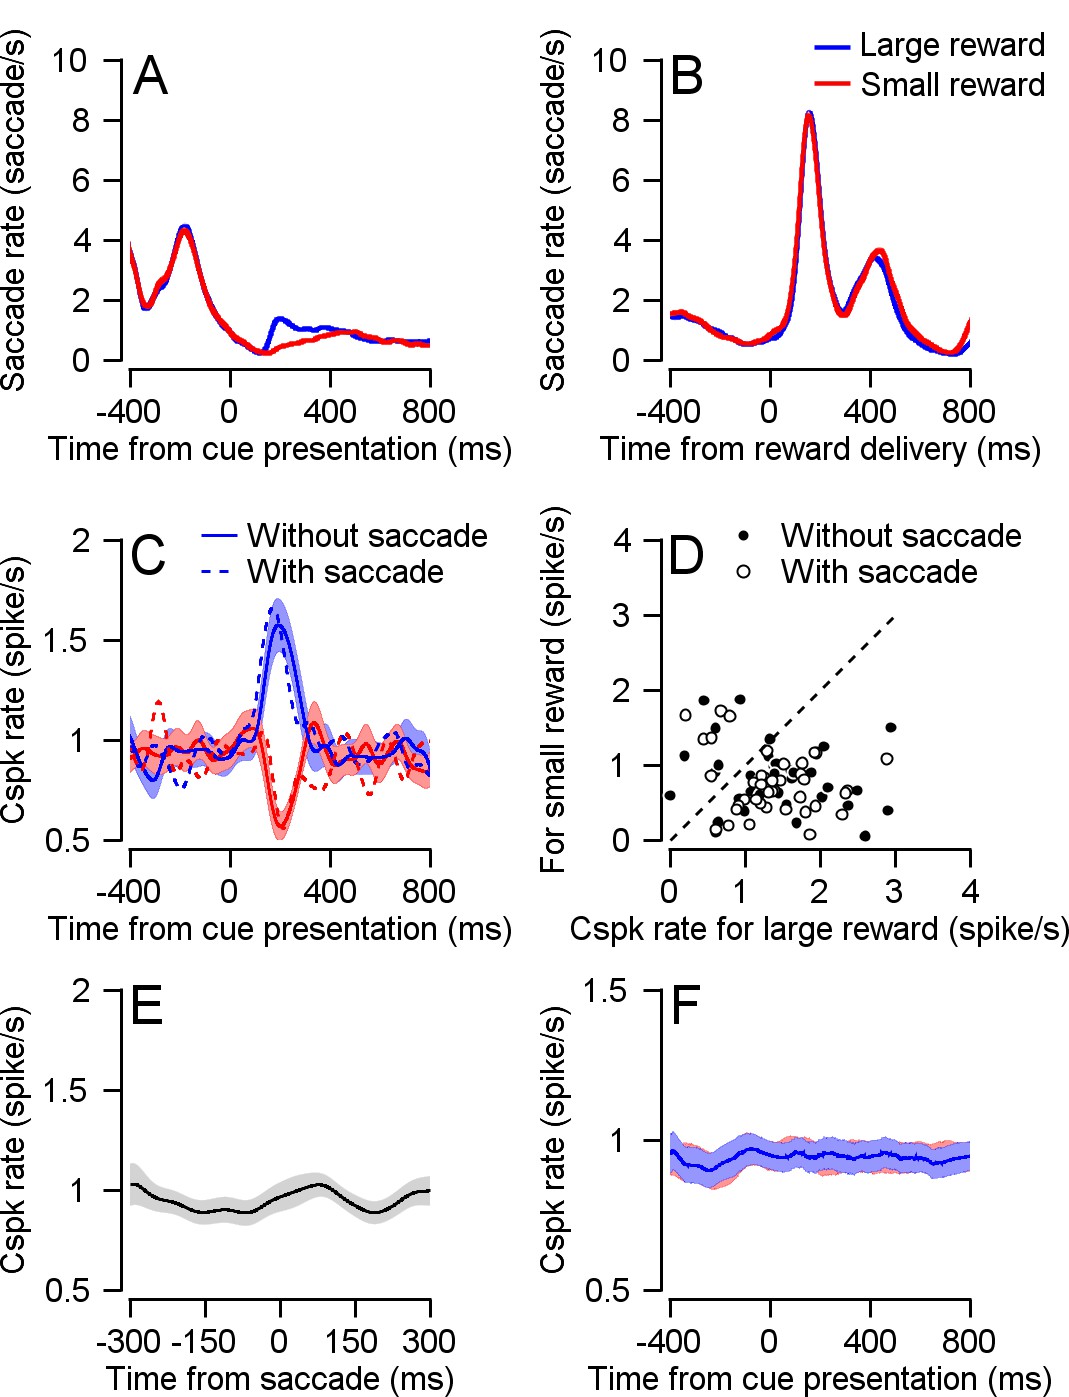
Saccades and microsaccades do not underpin the Cspk rate difference during the cue.
(A and B) The saccade rate as a function of time from the cue onset (A) and reward delivery (B) for trials with large (blue) and small (red) rewards. After cue onset, the monkeys made more fixational saccades in the large reward condition (Joshua et al., 2015). The large increase after reward delivery is a result of the monkeys' saccade back to the center of the screen from the eccentric position of the eye. (C) Large and small reward trials with (dashed) and without (solid) saccades in the first 500 ms after the onset of the cue. (D) Each dot represents the average Cspk rate of an individual cell 100–300 ms large (horizontal) and small (vertical) following reward delivery. Filled dots show the averages for trials with a saccade and empty dots without a saccade (Signed-rank, with saccade: p = 3.4*10−4, n = 40; without saccade: p = 3.15*10−4, n = 40). (E) PETH aligned to the occurrence of a saccade. (F) Predicted PSTH based on the timing of saccades, and the PETH in E for large and small rewards (see Materials and methods).
Figure 4 with 2 supplements
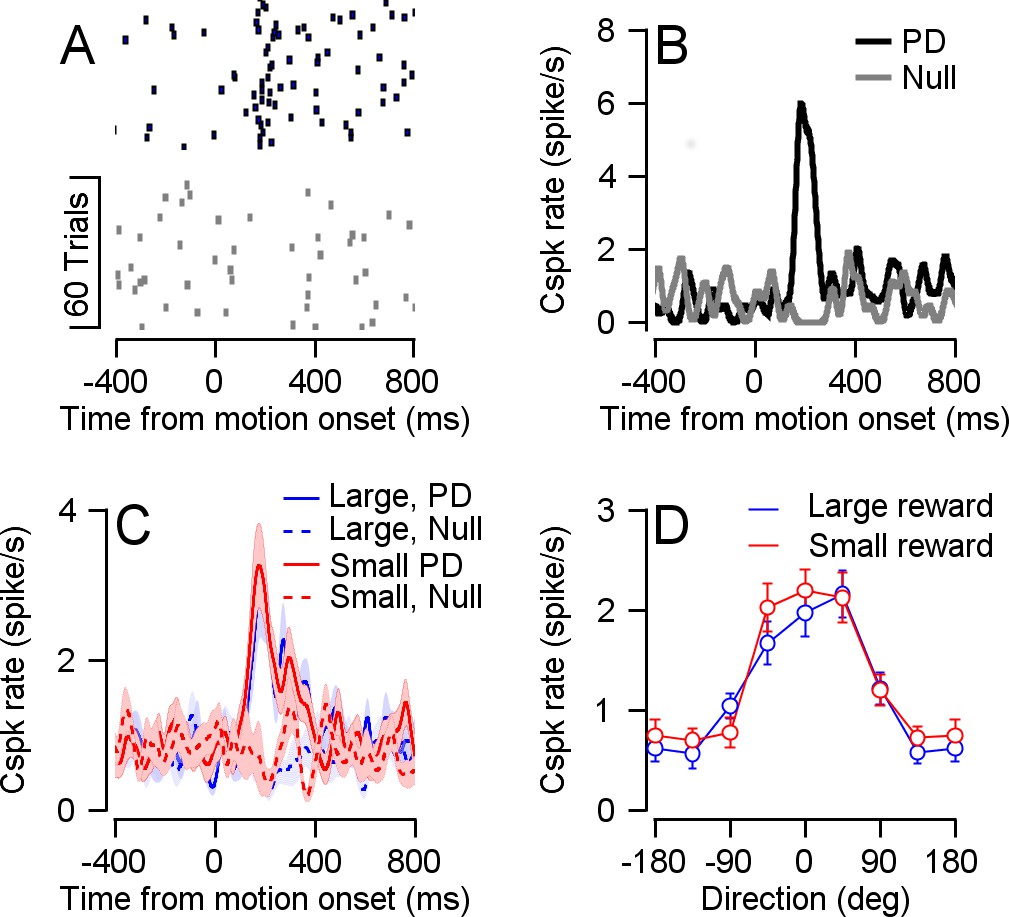
Reward did not modulate Cspk direction tuning.
(A) Raster plot of an example cell in its preferred (black) and null (gray) directions, aligned to target movement onset. (B) PSTH of the cell in A. (C) Population PSTH for different reward conditions, in the preferred (solid) and null (dashed) directions. (D) Population direction tuning curve (Permutation test: p = 0.2156, n = 33).
Figure 4—figure supplement 1

Examples of cells Cspk responses to cue and target movement.
(A, D and G) PSTH following cue presentation. (B, E and H) PSTH following target movement onset in the different directions relative to the preferred direction of the cell. (C, F and I): Tuning curve 100–300 ms after target motion onset aligned to the PD of the cell. (A–C) Responses of the example cell in Figure 4. (D–F), Responses of the cell in Figure 2. (G–I) An additional cell.
Figure 4—figure supplement 2
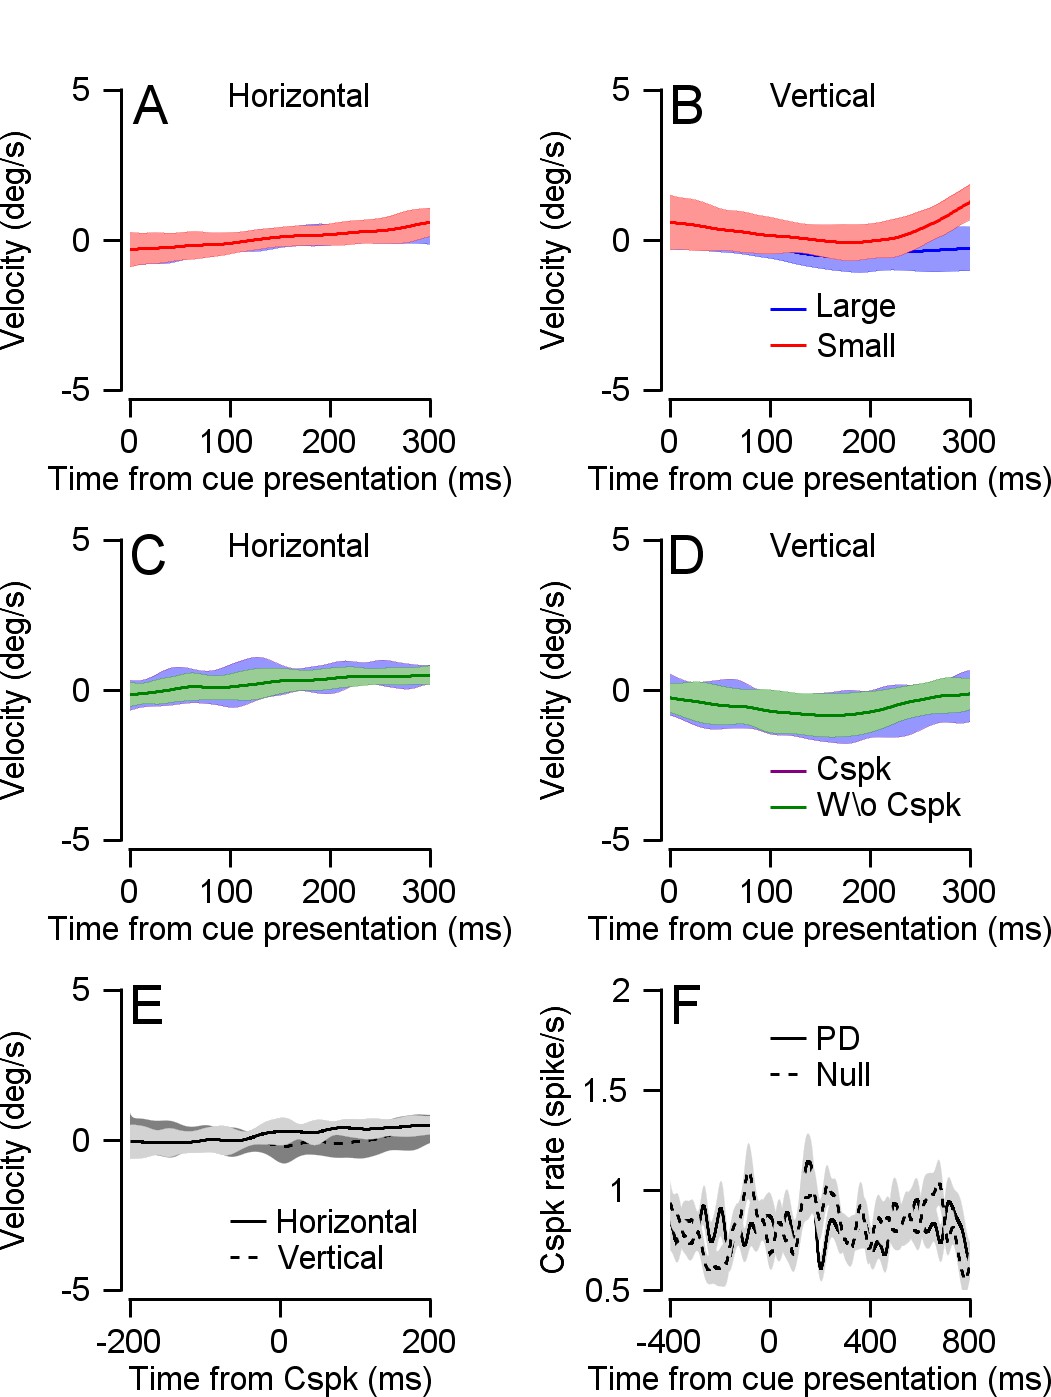
Retinal slip due to drift eye movement does not underpin the Cspk rate difference during the cue.
(A and B) Drift velocity in the horizontal (A) and vertical (B) direction in the large (blue) and small (red) reward conditions after cue presentation. All drift velocities recorded using an eye tracker were corrected for pupil size (see Materials and methods). Error bars represent STDs. (C and D) Horizontal (C) and vertical (D) drift velocities for trials with and without a Cspk in cells that responded to reward size during the cue. Error bars represent STDs. (E) Horizontal (solid) and vertical (dashed) drift velocities aligned to the occurrence of a Cspk in cells that responded to reward size during the cue. We included Cspks that occurred up to 400 ms after cue presentation. (F) Cspk population PSTH of directionally tuned cells for trials with drift in the PD (solid) and null (dashed) directions (signed-rank of all cells: p = 0.44, n = 33; signed-rank of cells that responded to reward size during the cue: p = 0.9, n = 12).
Figure 5
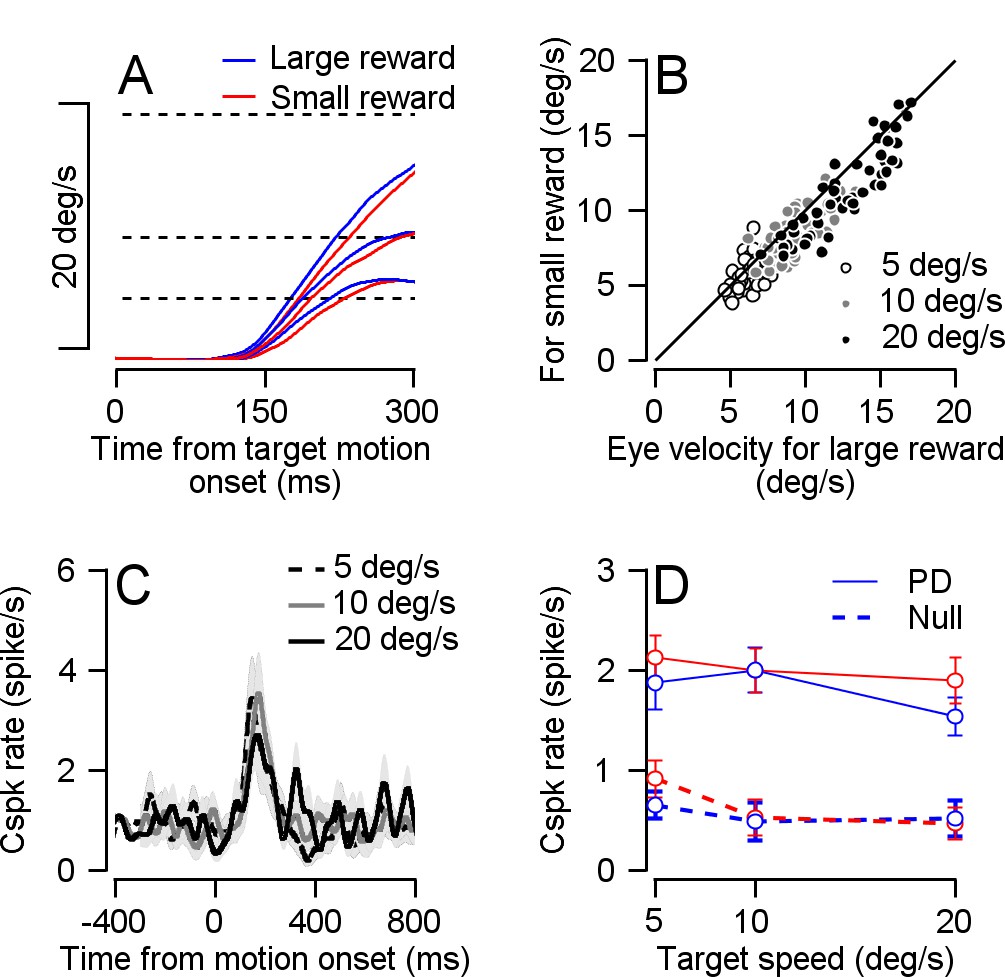
Cspk rate was not modulated by reward size at target motion onset in the speed tuning task.
(A) Average eye velocity traces for experiments in which the color cue signaled a large (blue) or small (red) reward and the target speed was 5 °/s, 10 °/s and 20 °/s. Slower traces correspond to slower target speeds. Dotted lines represent target velocity. (B) Individual session average eye velocity 250 ms after target movement onset for large (horizontal) and small (vertical) reward, in the different target velocity conditions (Signed-rank: p = 6*10−16, n = 56). (C) population PSTHs of cells in their PD for the different speed conditions. (D) Population speed tuning curve in the PD (solid) and null (dashed) directions (Permutation test: p = 0.4541, n = 16).
Figure 6

Sspk modulations following cue presentation.
(A-C) Examples of cells' Sspks responses to cue presentation in each reward condition. (D) Fraction of cells with a higher Sspk rate in the large reward condition (blue) or small reward condition (red) as a function of time. The dashed line represents the 0.05 false positive chance level. (E) Population PSTH, the average Sspk rate of each cell was subtracted. (F) Each dot represents the average Sspk rate of an individual cell 100–300 ms following large (horizontal) and small (vertical) reward delivery (Signed-rank, Monkey B: p = 0.142, n = 155; Monkey C: p=0.09, n = 75).
Figure 7
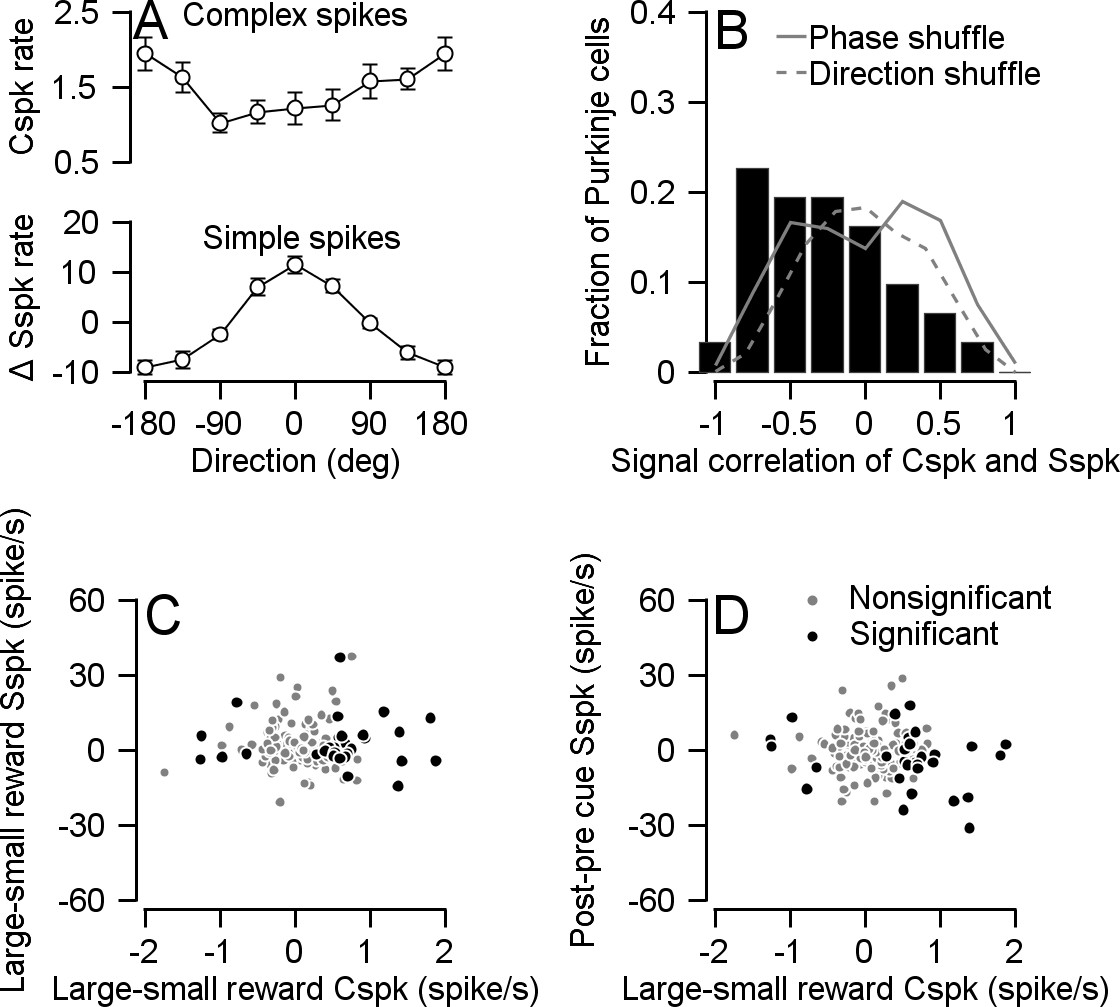
Cspk rate negatively correlated with Sspk rate during movement but not during cue presentation.
(A) Population tuning curve of Cspks (up) and Sspks (bottom), both aligned to the preferred direction of Sspks (Spearman r = −0.3087, p = 7*10−7, n = 31). (B) Histogram of signal correlations of simple and complex spikes in the population. Solid and dashed lines show the correlations for phased and direction shuffled data (Signed-rank: p=0.002, n = 31). (C) Each dot shows individual cell differences in average rate between reward conditions 100–300 ms after cue, in Cspks (horizontal) and Sspks (vertical; Spearman correlation of all cells r = −0.07, p = 0.32, n = 172; Spearman correlation of cells that responded to reward size during cue: r = −0.003, p = 0.98, n = 30) (D) Similar to C the horizontal position of each dot shows individual cell differences in average Cspk rate between reward conditions 100–300 ms after cue. The vertical axis shows the difference in Sspk firing rate in the time window 100–300 ms after the cue and 100–300 ms before the cue (vertical; Spearman correlation of all cells r = −0.03, p = 0.63, n = 172; Spearman correlation of cells that responded to reward size during cue: r = −0.19, p = 0.31, n = 30).
Author response image 1

Analysis of saccade velocity and direction during the cue.
(A) The distribution of saccade velocity in the 700 ms following the cue and proceeding target motion in both reward conditions. (B) The distribution of saccade directions in the same time period as A. (C) PSTHs aligned to cue for trials with slow and fast saccades (below the 40th and above the 60th percentile respectively). (D) The Cspk response following the cue in trials with different saccade directions. The right direction represents the PD of simple spikes for the same cell.
Author response image 2
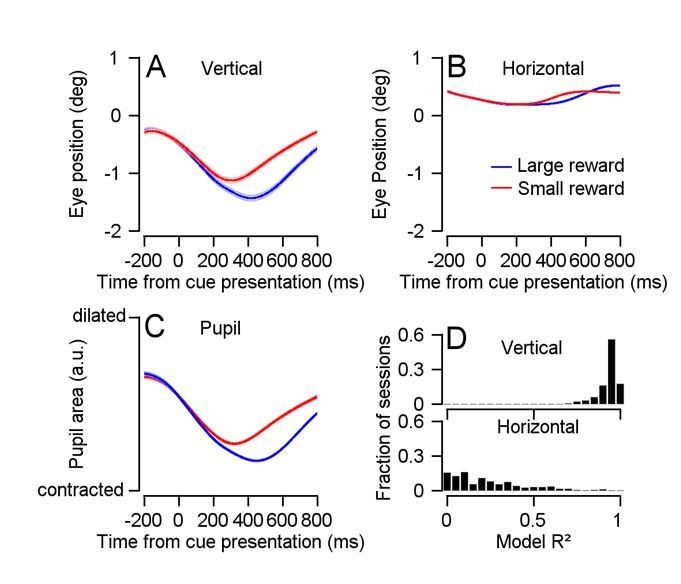
Correcting the influence of pupil size on eye position measurements.
(A) Vertical eye position aligned to cue presentation, for each reward condition. (B) Horizontal eye position aligned to cue presentation, for each reward condition. (C) Pupil area in arbitrary units aligned to cue presentation, for each reward condition. (D) Distribution of R2s for models fitting pupil area to vertical (up) or horizontal (down) eye position for each recording session (vertical median = 0.94, horizontal median = 0.17, n = 208).
Author response image 3
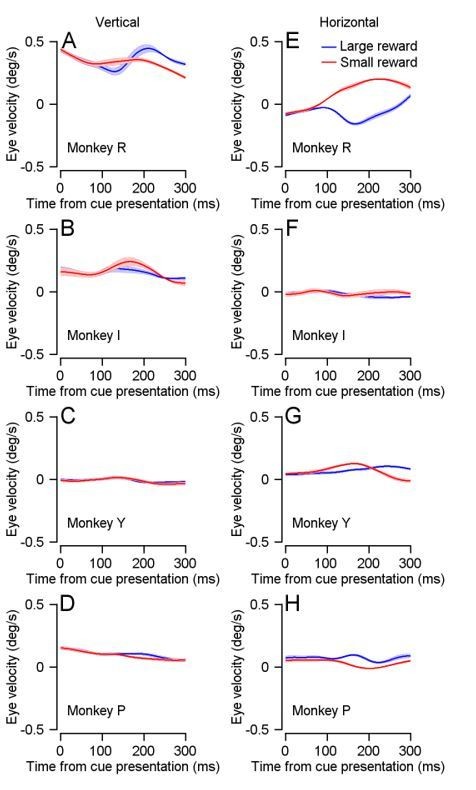
Drift following reward size cue presentation, measured using a coil.
(A-D) Vertical drift velocity measured using coil following reward cue presentation. (E-H) Horizontal drift velocity measured using coil following reward cue presentation.
Additional files
-
Transparent reporting form
- https://doi.org/10.7554/eLife.46870.016
Download links
A two-part list of links to download the article, or parts of the article, in various formats.
Downloads (link to download the article as PDF)
Open citations (links to open the citations from this article in various online reference manager services)
Cite this article (links to download the citations from this article in formats compatible with various reference manager tools)
Cerebellar climbing fibers encode expected reward size
eLife 8:e46870.
https://doi.org/10.7554/eLife.46870


