Short-term synaptic dynamics control the activity phase of neurons in an oscillatory network
- New Jersey Institute of Technology and Rutgers University, United States
- New Jersey Institute of Technology, United States
Figures
Figure 1

Latency constancy and phase constancy as a function of period.
(A1) Schematic diagram showing that a follower neuron (F) strongly inhibited by a bursting oscillatory neuron (O) with period P can produce rebound bursts with the same period at a latency Δt. (A2) If the period of O changes to a new value (P2), the new F burst latency (Δt2) typically falls between two extremes: it could stay constant (top trace) or change proportionally to P2, so that the burst phase (Δt/P) remains constant (middle trace). (B) Example traces of the pyloric pacemaker PD neuron and the follower LP neuron represent the O and F relationship in panel A. Here, the PD neuron is voltage clamped and a pre-recorded waveform of the same neuron is used to drive this neuron to follow different cycle periods. The LP neuron follows the same period because of the synaptic input it receives. (C) A measurement of the LP neuron burst onset time (Δt) with respect to the onset of the PD neuron burst shows that Δt falls between the two limits of constant latency and constant phase. Dotted curves represent constant latency matched to the latencies at the two extreme P values.
Figure 2

Inputs to the LP neuron influence burst time, spike number and interval.
(A) Simultaneous intracellular recording of the LP neuron and extracellular recording of the lateral ventricular nerve (lvn), containing the axons of the LP, PD and PY neurons (arrows). Period (P) and the burst onset time (Δt) of the LP neuron are defined in reference to the pacemaker group (PD) burst. (B) Blocking the AB and PY synaptic inputs (10 µM picrotoxin) to the LP neuron disrupts its bursting oscillations. (C) The LP neuron, in picrotoxin, was driven with a noise current input (Inoise) for 60 min. In response, the LP neuron produced an irregular pattern of bursting. Specific inter-burst intervals (IBIs) were tagged and used for burst-triggered averaging. (D) Example of burst-trigger-averaged input current (IBTA, green). Individual traces are shown in gray. (E) For each IBI (300, 500, 700, 900 ms), IBTA was calculated and normalized to the (negative) peak value of IBTA for IBI = 300 ms. Different traces in each panel show the IBTA of different preparations. (F) The mean (across preparations) of the normalized IBTAs shown in panel E. (G) Traces in panel F normalized by IBI. (H–K) Four parameters define the shape of the IBTA: peak amplitude Iamp (H), peak phase Δpeak (I), slopeup (J) and slopedown (K) across preparations. IBI had a significant effect on amplitude Iamp (p<0.001), peak phase Δpeak (p<0.001), slopeup (p<0.001) and slopedown (p=0.002).
-
Figure 2—source data 1
This Excel file contains four sheets, including all measured attributes of the burst-triggered average current (IBTA) for different IBIs (N = 23) as shown in Figure 2H–2K.
- https://doi.org/10.7554/eLife.46911.004
Figure 3
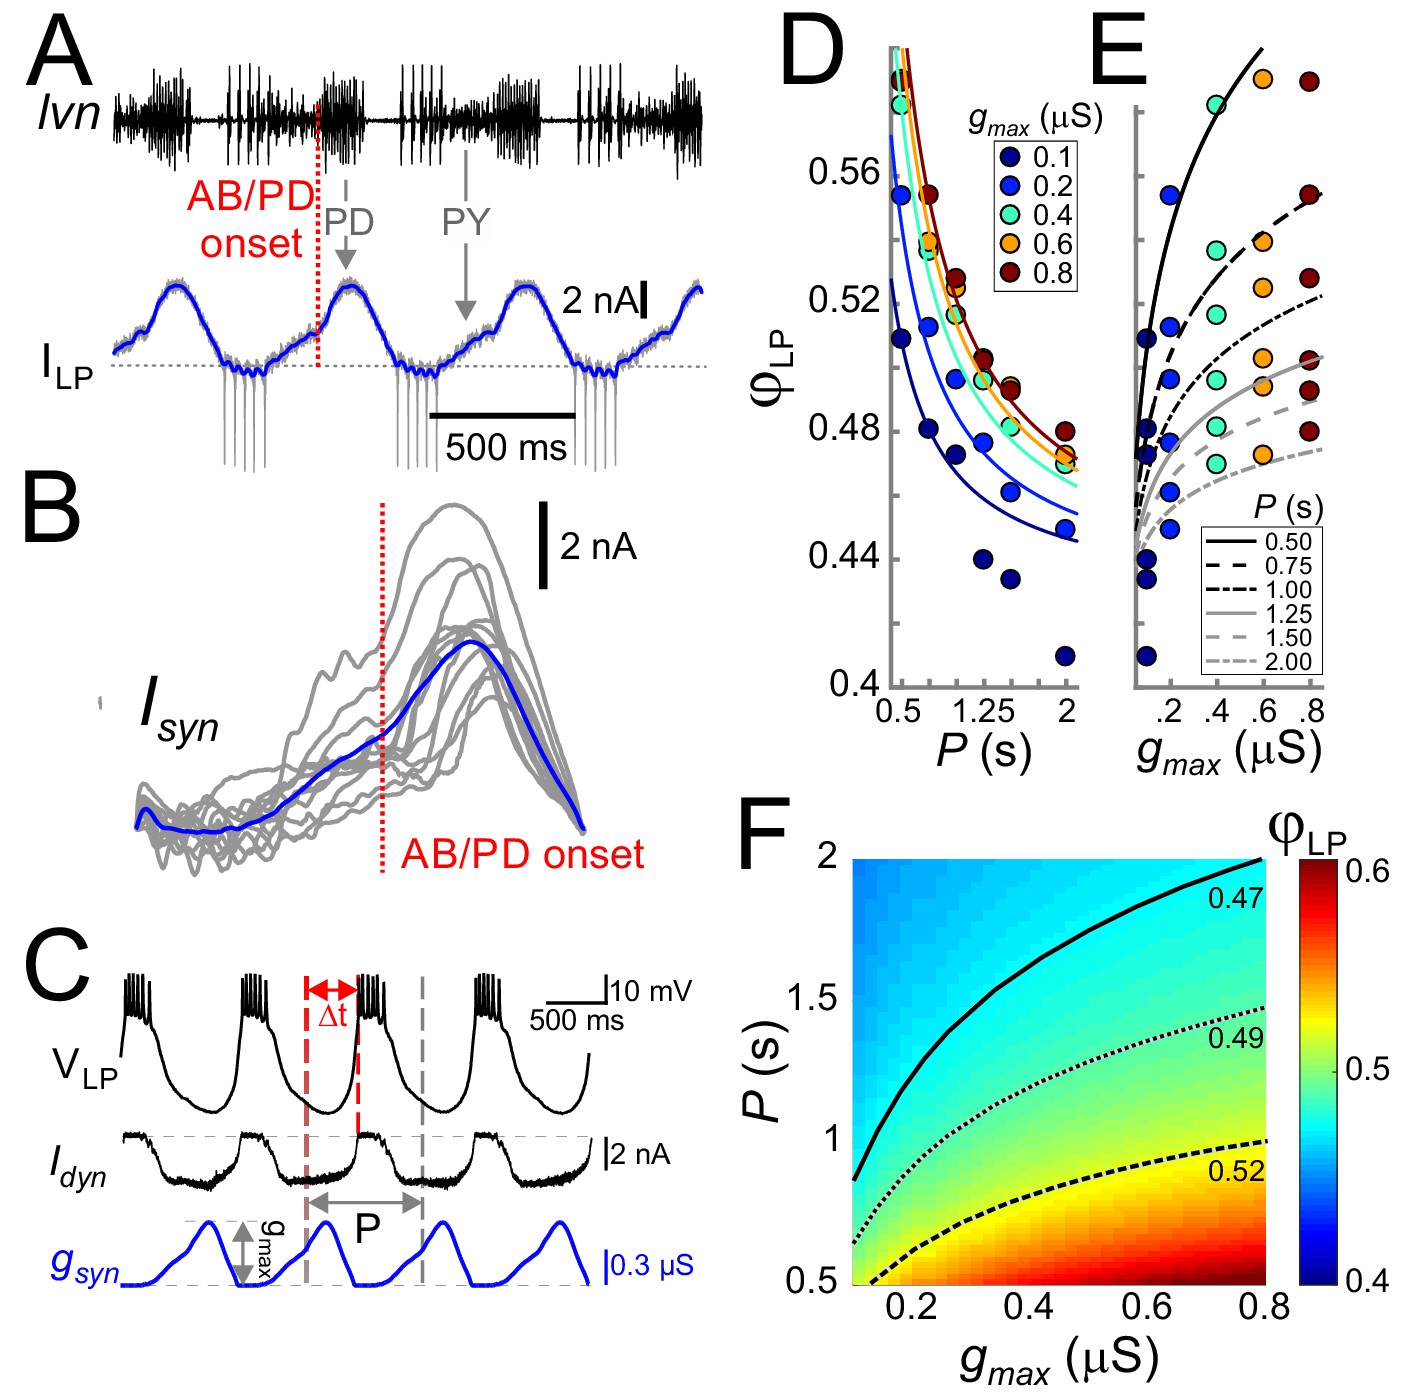
Cycle period and synaptic strength affect the phase of LP burst onset in opposite directions.
(A) The synaptic input to the LP neuron was measured by voltage clamping it at a holding potential of −50 mV during ongoing oscillations. The onset of the pacemaker (AB/PD) activity is seen as a kink in the synaptic current (ILP, blue). Dashed line: 0 nA. (B) Synaptic input averaged across (last 5 of 30) cycles from nine different LP neurons. Traces are aligned to the onset of the PD neuron burst (dotted vertical red line; see panel A), normalized by the cycle period and terminated at the end of the downslope (coincident with the first LP action potential when present). The blue trace shows the average. (C) An example of the LP neuron driven by the realistic synaptic waveform in dynamic clamp. The burst onset time (Δt) was measured relative to the AB/PD onset and used to measure the LP phase (φLP). gmax denotes the conductance amplitude. (D) Mean φLP (N = 9 preparations) shown as a function of P and fit with the function given by Equation (8) (fit values τs=26.0 ms, g*=0.021 µS and Δpeak·DC = 0.43). (E) Mean φLP plotted against gmax also shown with the fit to Equation (8) . (F) Heat map, obtained from fitting Equation (8) to the data in panels D and E, shows φLP as a function of both gmax and P. Black curves show the level sets of phase constancy for three values of φLP (0.47, 0.49, and 0.52).
Figure 4
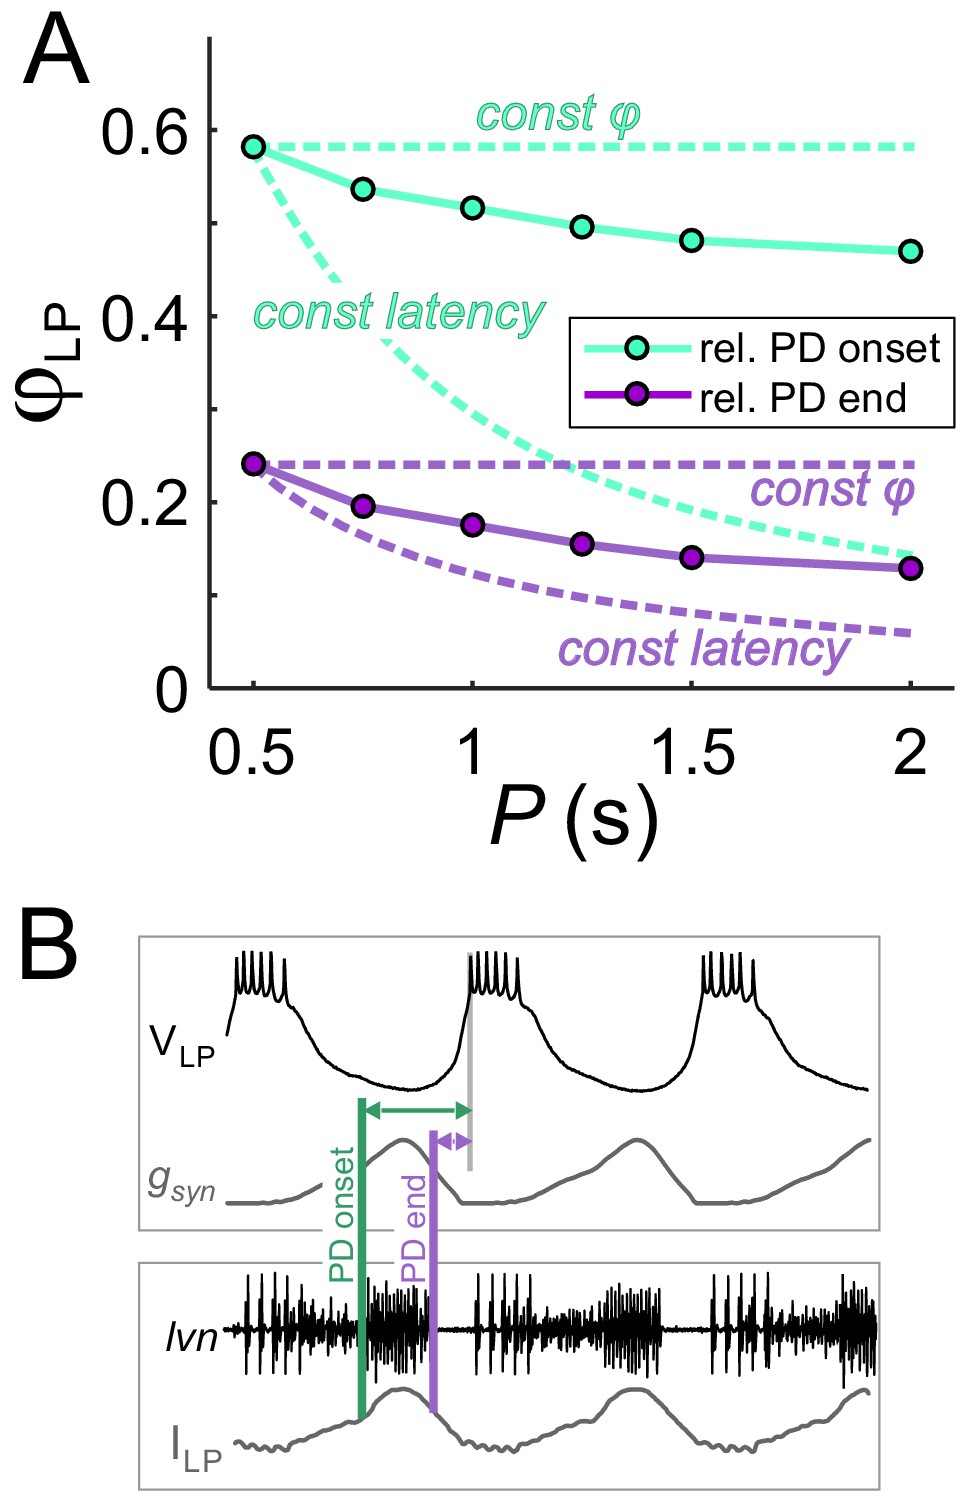
The constant duty cycle of synaptic conductance is a major factor in phase maintenance.
(A) The change in φLP values with P are compared with the constant phase (solid curve) and constant latency (dashed curve) extremes. Lime traces show the usual values of φLP, calculated from the LP burst onset latency with respect to the onset of the PD burst. Lavender traces show φLP calculated from the LP burst onset latency with respect to the end of the PD burst. Data shown are the same as in Figure 3D for gmax = 0.4 µS. (B) Schematic diagram shows the latency of LP burst onset measured with respect to the (estimated) onset and end of the PD burst in the dynamic clamp experiments (see Materials and methods). Bottom panel shows the synaptic current waveform measured in the voltage-clamped LP neuron during ongoing pyloric activity. Top panel shows the dynamic clamp injection of the synaptic conductance waveform into the LP neuron. The current waveform of the bottom panel is aligned to the conductance waveform of the top panel for the comparison used in determining the PD burst onset and end in the top panel.
Figure 5
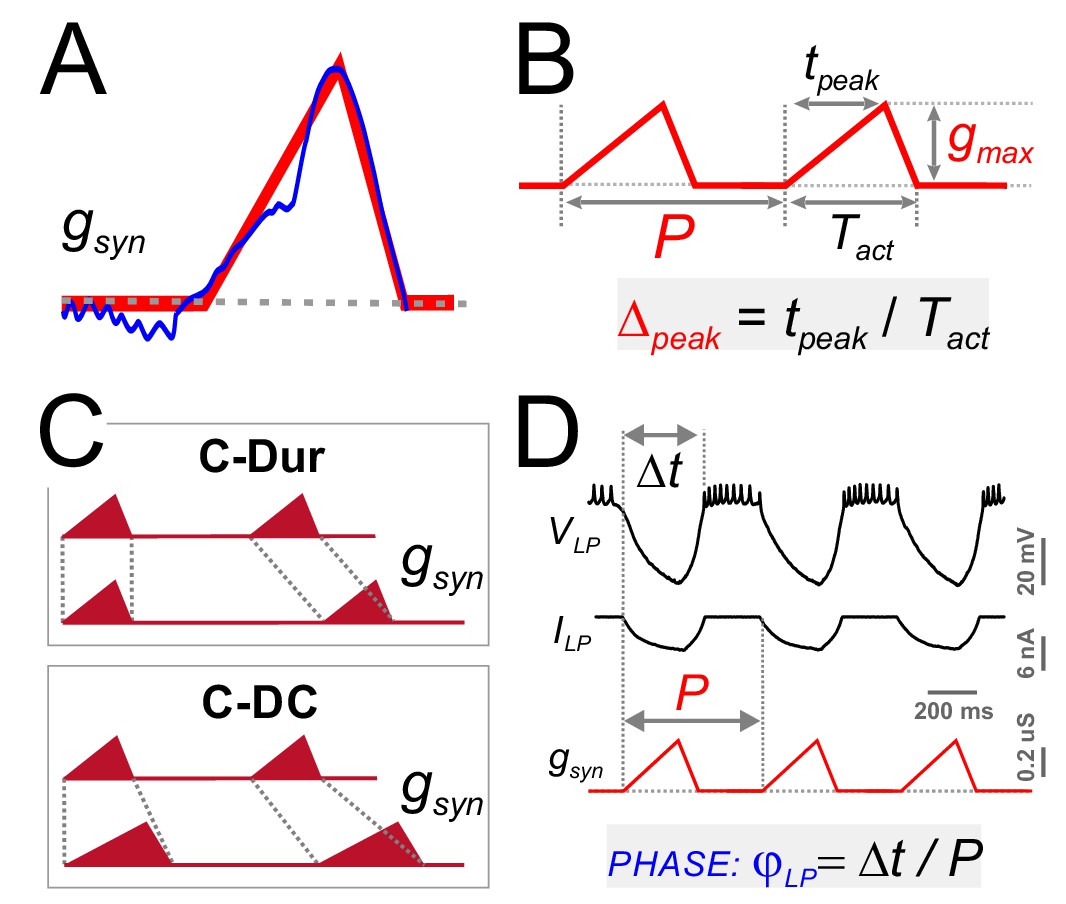
Four parameters describing synaptic shape were varied in the experimental paradigm.
(A) A triangle-shaped conductance was used to mimic the synaptic input to the LP neuron. (B) The triangular waveform can be described by period (P), duration (Tact), peak time (tpeak) and amplitude (gmax). (C) In dynamic clamp runs, the synapse duration Tact was kept constant at 300 ms (C-Dur) or maintained at a constant duty cycle (Tact/P) of 0.3 (C–DC) across all values of P. (D) Intracellular voltage recording of the LP neuron during a dynamic clamp stimulation run using the triangle conductance (in picrotoxin). The burst onset time (Δt, calculated in reference to the synaptic conductance onset) was used to calculate the activity phase (φLP = Δt/P).
Figure 6
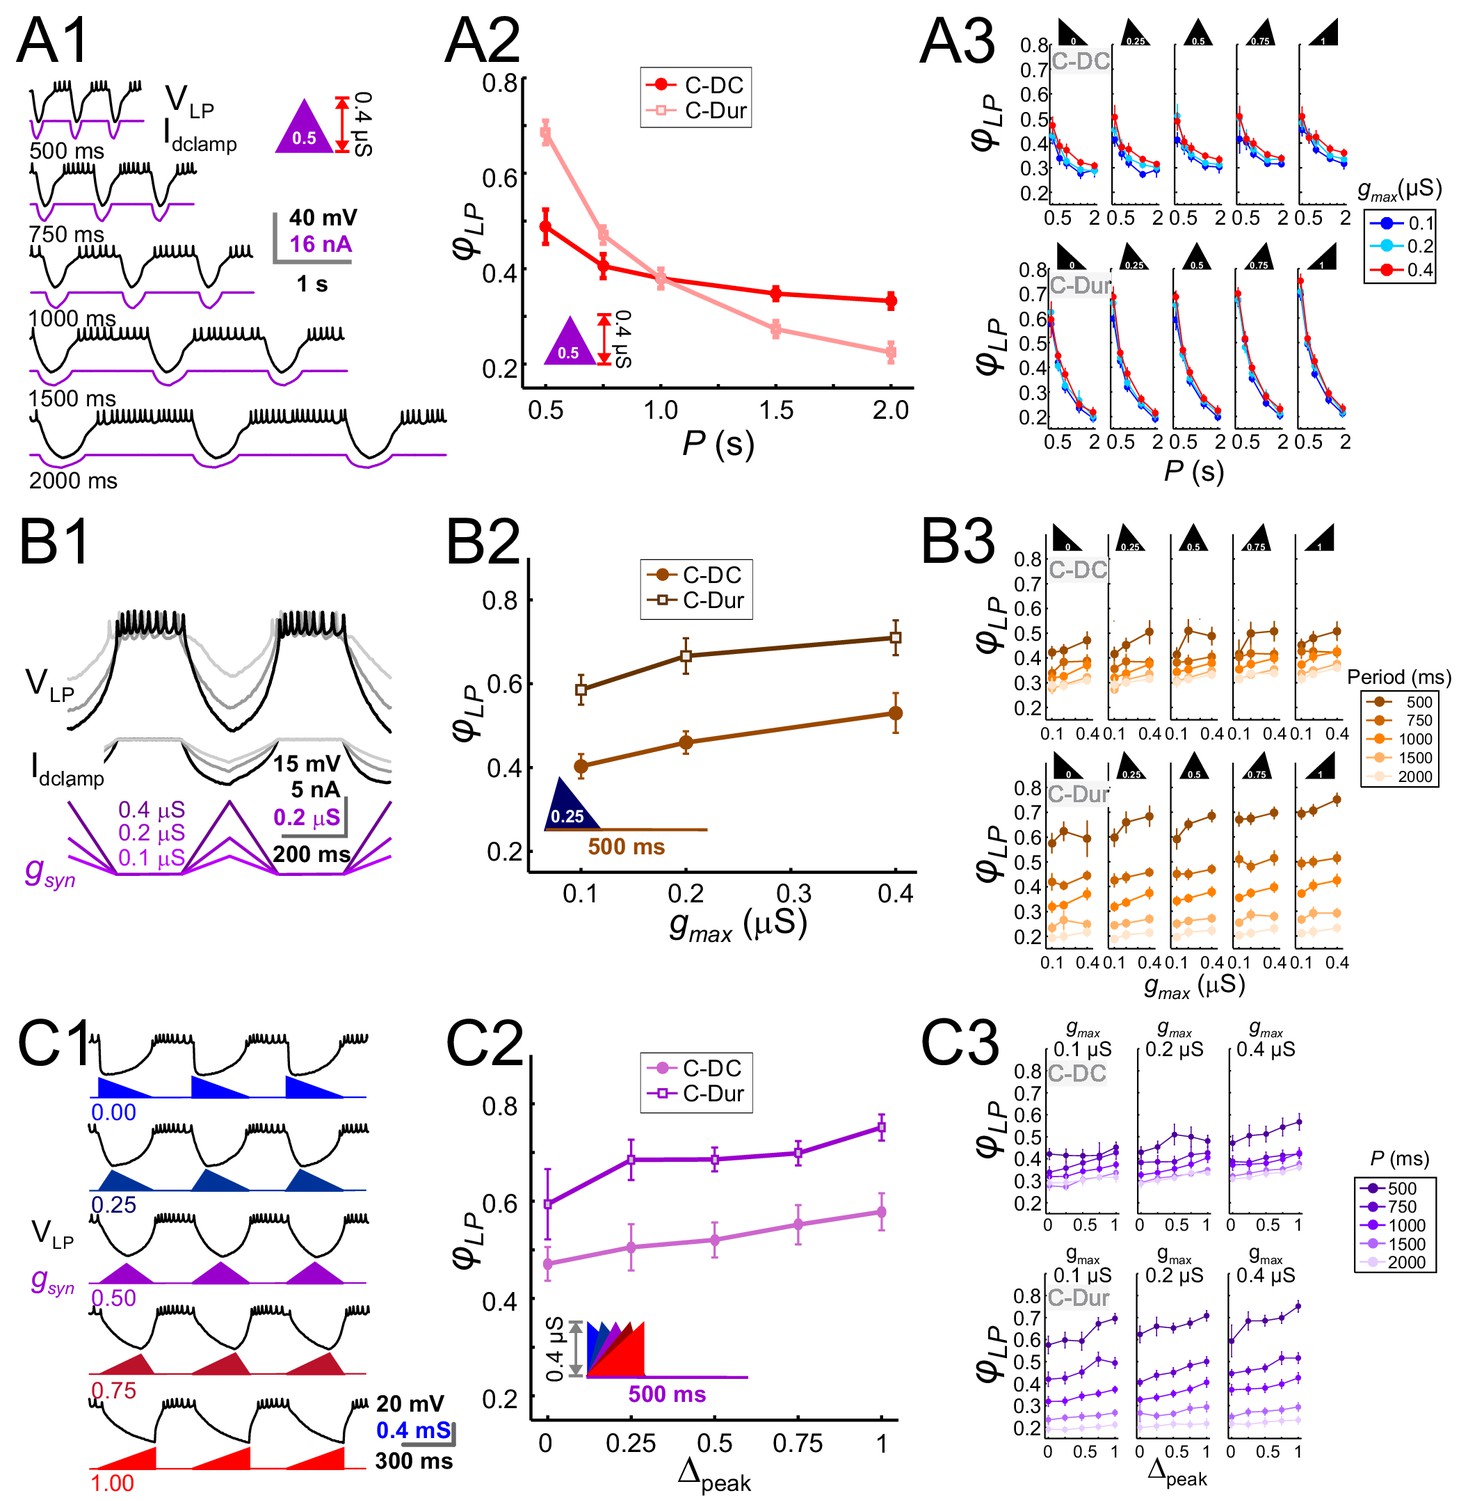
The LP burst onset phase decreases as a function of P, but increases as a function of gmax and Δpeak.
Periodic injection of an inhibitory triangular waveform conductance into the LP neuron (in picrotoxin) produced bursting activity from which φLP was calculated. The parameters gmax, Δpeak and P were varied across runs for both C-Dur and C-DC cases. (A) φLP decreases as a function of P. (A1) Intracellular recording of an LP neuron showing a C-DC conductance input across five periods. (A2) φLP for the example shown in A1 plotted as a function of P (for gmax = 0.4 μS, Δpeak=0.5) for both C-Dur and C-DC cases. φLP decreases rapidly with P and the drop is larger for the C-Dur case. (A3) φLP decreased with P in both the C-DC case (three-way RM ANOVA, p<0.001, F = 100.7) and the C-Dur case (three-way RM ANOVA, p<0.001, F = 466.4) for all values of Δpeak. The range of φLP drop was greater for the C-Dur case compared to the C-DC case. (B) φLP increases as a function of gmax. (B1) Intracellular recording of an LP neuron showing the conductance input across three values of gmax. (B2) φLP for the example shown in B1 plotted as a function of P (for p=500 ms, Δpeak=0.25) shows a small increase for both C-Dur and C-DC cases. (B3) φLP increased with gmax in almost all trials for both C-DC and C-Dur cases and all values of Δpeak. (C) φLP increases as a function of Δpeak. (C1) Intracellular recording of the LP neuron showing the conductance input for five values of Δpeak. (C2) φLP for the example neuron in C1 plotted as a function of Δpeak (for p=500 ms, gmax = 0.4 μS) for both C-DC and C-Dur cases. (C3) φLP increased with Δpeak for both C-DC and C-Dur cases and for all values of gmax. In all panels, error bars show standard deviation.
Figure 7
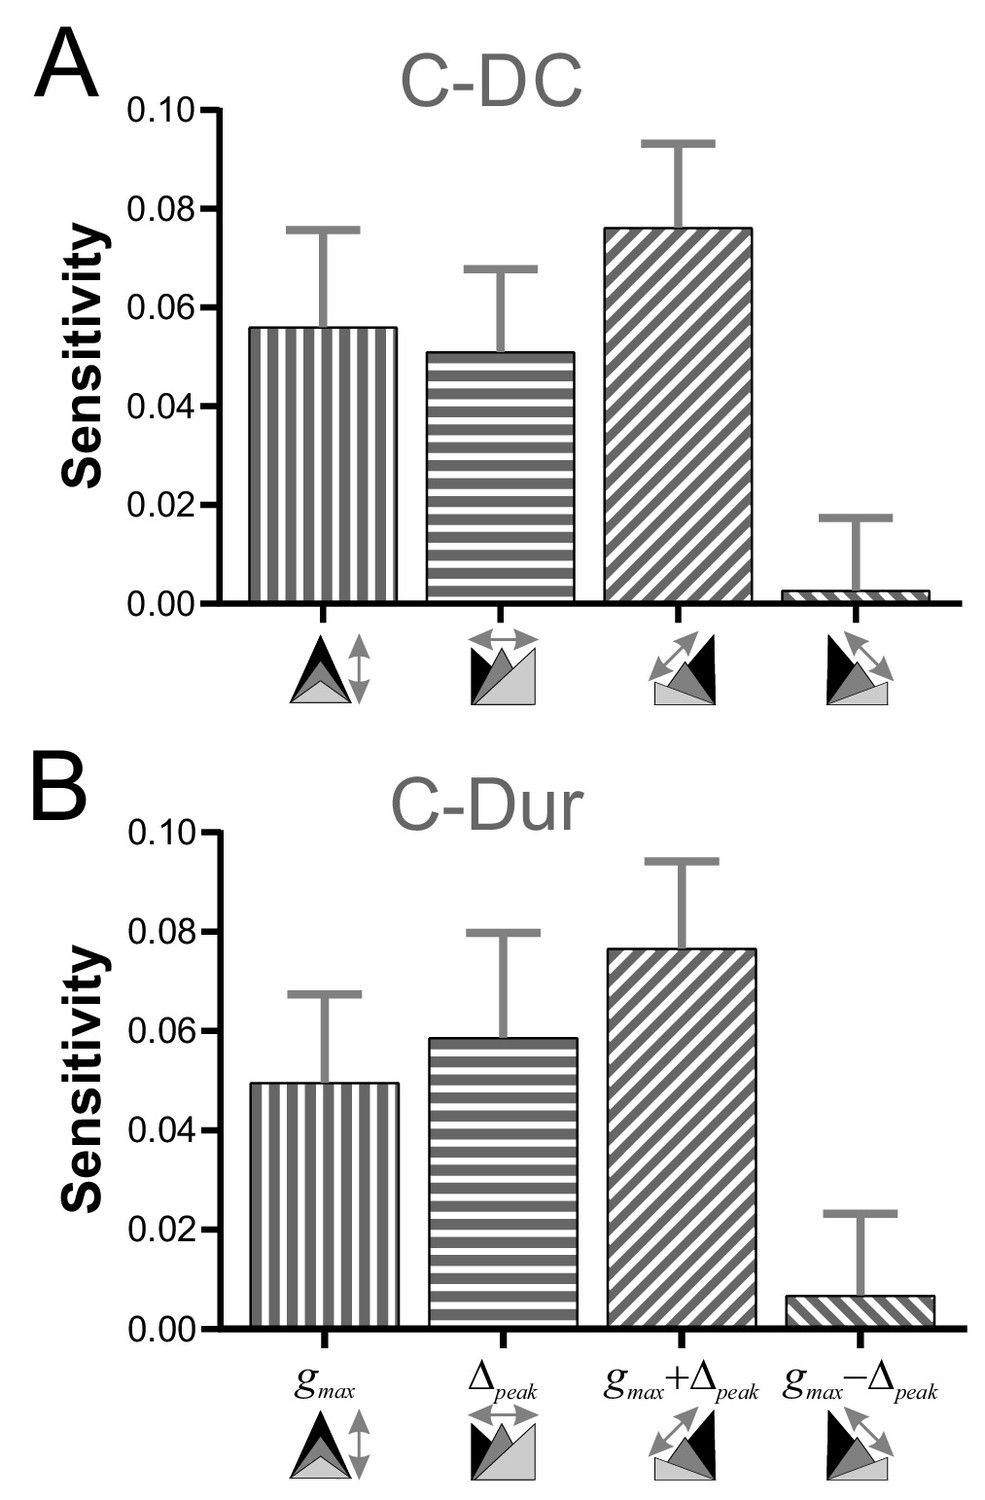
Sensitivity analysis shows that φLP increases more effectively if gmax and Δpeak increase together.
(A) The sensitivity of φLP to local changes in gmax and Δpeak was averaged across all values of P for the C-DC case. Sensitivity was largest if both parameters were increased together (gmax + Δpeak) and smallest if they were varied in opposite directions (gmax - Δpeak; one-way RM-ANOVA, p<0.001, F = 3.330). (B) The same sensitivity analysis in the C-Dur case shows similar results (one-way RM-ANOVA, p<0.001, F = 2.892). In both panels, error bars show standard deviation.
-
Figure 7—source data 1
This Excel file contains two sheets for the C-DC and C-Dur cases.
These sheets include all sensitivity values for each value of P, at each gmax and each Δpeak in all eight directions: (+gmax, +Δpeak, –gmax, –Δpeak,+gmax & +Δpeak, –gmax & –Δpeak,+gmax & –Δpeak,+gmax & –Δpeak). Figure 7 shows the sensitivities, averaged across all P values, and averaged across aligned directions: [+gmax and –gmax]; [+Δpeak and –Δpeak]; [+gmax & +Δpeak and –gmax & –Δpeak]; [+gmax & –Δpeak and +gmax & –Δpeak].
- https://doi.org/10.7554/eLife.46911.010
Figure 8

Simultaneous increase of both Δpeak and gmax across their range of values can produce phase maintenance across a large P range in the C-DC case and a much smaller P range in the C-Dur case.
(A) Heat map plots of the function Φ (see Materials and methods), plotted for the range of values of P and Δpeak and 4 values of gmax for the C-DC (A1) and C-Dur (A2) cases. The white curves show the level set of φLP=0.34, shown as an example of phase constancy. The color maps are interpolated from sampled data (see Materials and methods; N = 9 experiments). The locations of the sampled data are marked by black dots. (B) Heat map for the level sets φLP=0.34 for the C-DC (B1) and C-Dur (B2) cases. Range of colors in each panel indicate the range of P values for which φLP could remain constant at 0.34 for each case, as indicated by the gray arrows on the side of the heatmap color legend. (C) The range (ΔP) of P values for which φLP could remain constant at any value between 0.2 and 0.8 for the C-DC (C1) and C-Dur cases (C2). Filled circles show the values shown in panel B. The LP neuron cannot achieve φLP values below 0.3 in the C-DC case. For φLP values between 0.3 and ~0.65, the range was larger in C-DC case.
Figure 9
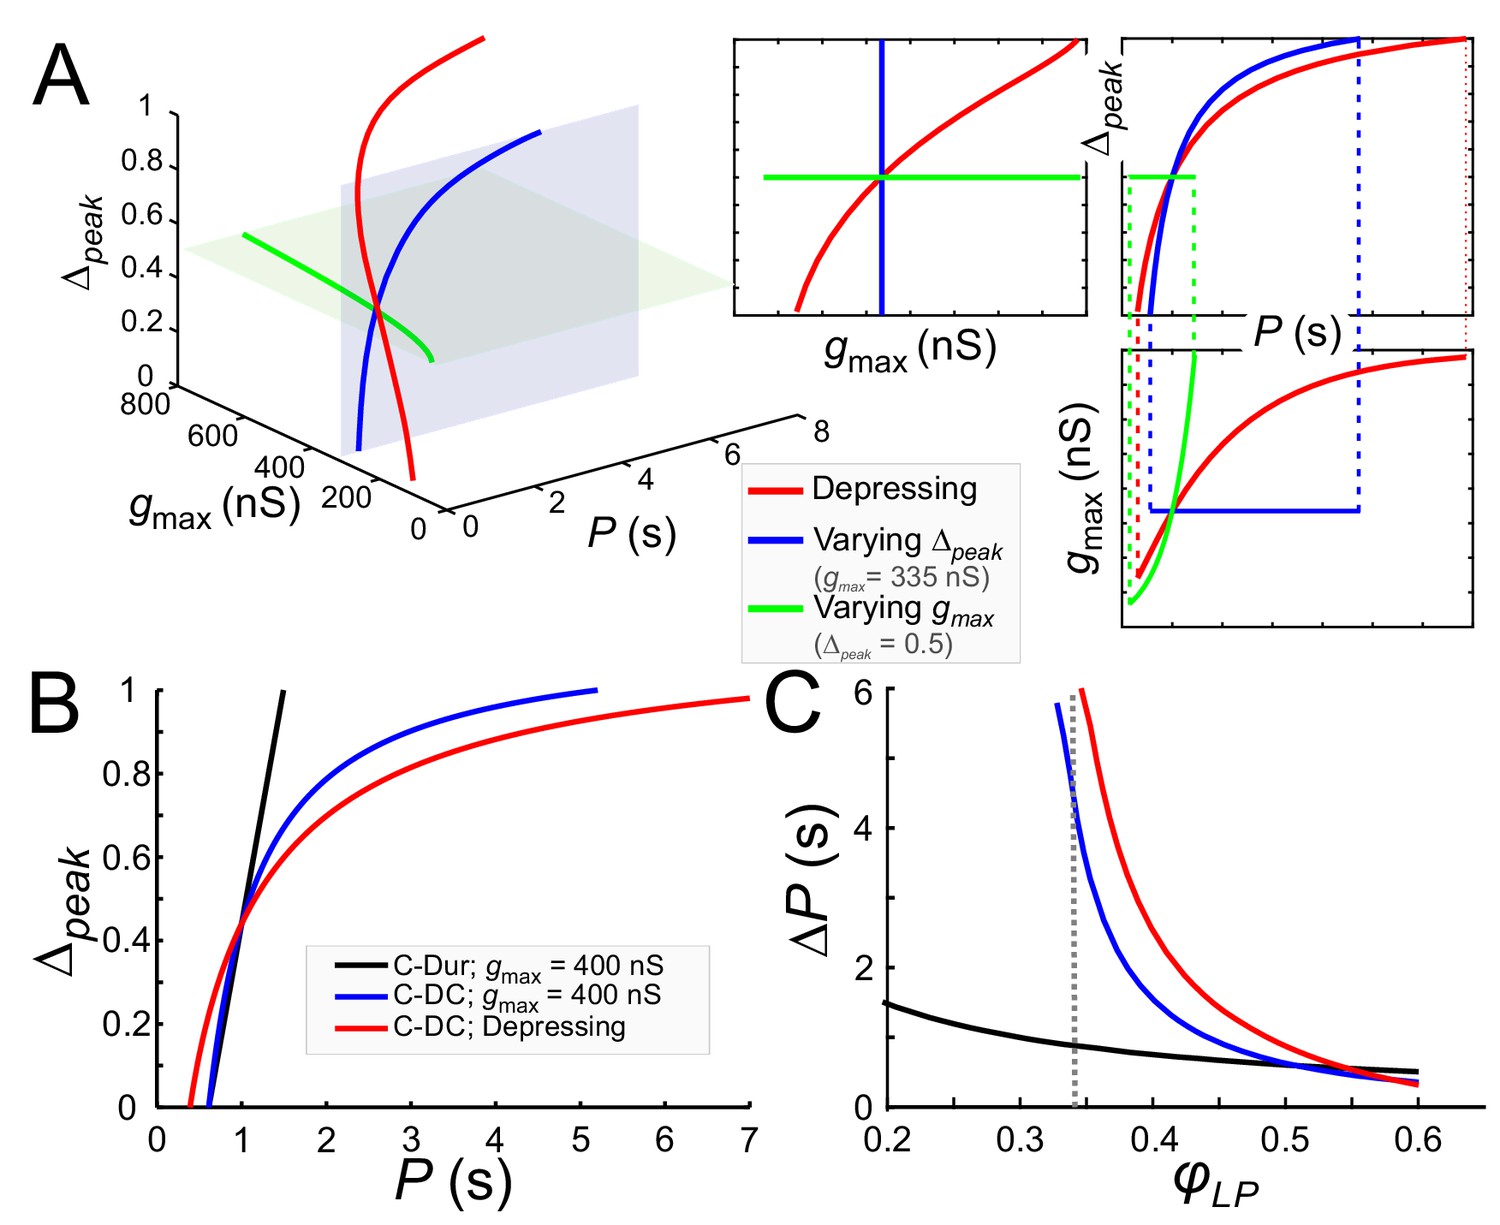
Model prediction of the range of phase constancy.
(A) For the C-DC case, a constant phase of φLP=0.34 can be maintained across a range of cycle periods P when gmax is constant (at 335 nS; blue plane) and Δpeak varies from 0 to 1 according to Equation (11) (blue), or when Δpeak is fixed (at 0.5; green plane) and gmax varies from 200 to 800 nS according to Equation (10). Alternatively, gmax and Δpeak can covary to maintain phase, as in a depressing synapse, where gmax varies with P according to Equation (16) , and Δpeak is calculated for each P and gmax value according to Equation (11). As seen in the 2D coordinate-plane projections of the 3D graph (right three graphs), the range of P values for which phase constancy is achieved is largest when gmax and Δpeak covary (dotted lines show limits of P for phase constancy). The depressing synapse conductance value is chosen to be 335 nS at P = 1 s. (B, C) A comparison between the C-DC and C-Dur cases shows that in the latter case a constant phase of φLP can be maintained across a larger range of P values when Δpeak increases with P (and gmax is fixed at 400 nS) according to Equation (11). The relationship of Δpeak and P is shown in B for φLP=0.34. (C) shows the range of P values (ΔP) of cycle periods for which phase remains constant at any value of φLP. If gmax also varies with P, as in a depressing synapse (red; Equation (16)), the range of P values for which phase is constant is further increased. (Dotted line: φLP=0.34.).
Download links
A two-part list of links to download the article, or parts of the article, in various formats.
Downloads (link to download the article as PDF)
Open citations (links to open the citations from this article in various online reference manager services)
Cite this article (links to download the citations from this article in formats compatible with various reference manager tools)
Short-term synaptic dynamics control the activity phase of neurons in an oscillatory network
eLife 8:e46911.
https://doi.org/10.7554/eLife.46911


