Mechanisms of virus dissemination in bone marrow of HIV-1–infected humanized BLT mice
- California Institute of Technology, United States
- University of California, Los Angeles, United States
Figures
Figure 1 with 1 supplement
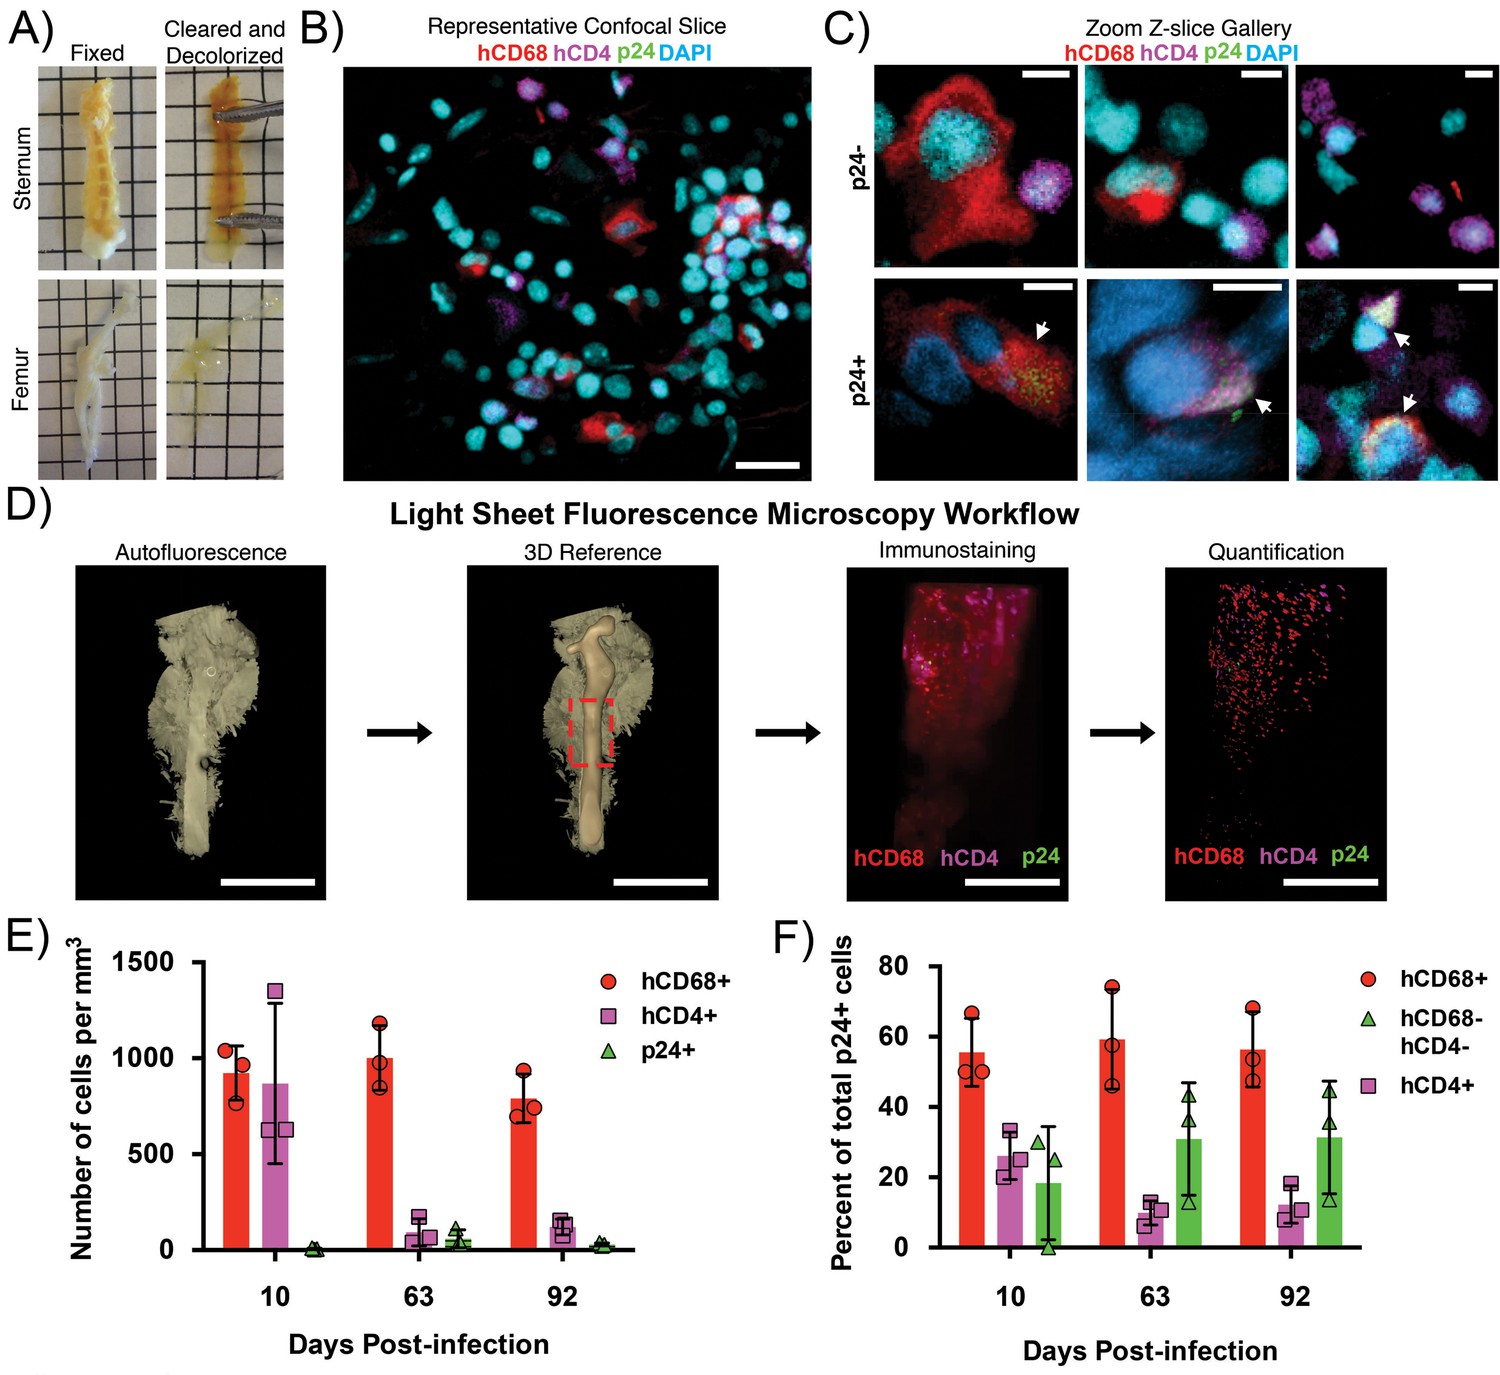
Clearing and imaging of HIV-1–infected BLT BM.
(A) Examples of fixed (left) and cleared/decolorized (right) sternums and femurs from HIV-1-infected BLT hu-mice. Squares are 5 mm by 5 mm. Images of tissues before and after clearing were captured on an iPhone 5 (Apple). (B) Representative confocal Z-slice of cleared sternum from an HIV-1–infected hu-mouse 63 days post-infection immunostained for hCD4 (magenta), hCD68 (red), HIV-1 p24 (green), and nuclei (blue). (C) Gallery of zoomed confocal Z-slices showing characteristic sizes and morphologies of hCD4+ cells (magenta), hCD68+ cells (red), and p24+ cells (green). Arrows indicate p24+ cells. (D) Volume of autofluorescence from cleared femur of an HIV-1 infected hu-mouse 10 days post-infection captured with light sheet microscope (left). Segmented model of bone from the same volume (center left). Dashed red box shows region of interest for subsequent panels. Light sheet volume of a region of BM immunostained for hCD4 (magenta), hCD68 (red), and HIV-1 p24 (green) (center right). Segmented model from the same dataset showing individual cell distributions within BM (right). (E) Quantification of individual cell population densities over time. (F) Percent of total p24+ cells co-localizing with hCD68+ cells (red), hCD4+ cells (magenta), or not co-localized with hCD68+ or hCD4+ cells (green) at specific times post-infection. Error bars represent standard deviations from the mean of 3 measurements from separate volumes of tissue greater than 0.5 mm3 each. Scale bars: (B = 20 μm; C = 5 μm; D = 4 mm, left panels; 500 μm, right panels).
Figure 1—figure supplement 1

Human cell reconstitution and HIV-1 infection in BLT hu-mice.
(A) Representative flow analysis plots showing side scatter (SSC-A) and forward scatter (FSC-A), human CD45+ hematopoietic cell population, human CD3+ T lymphocyte and CD19+ B lymphocyte, and human CD4+ T and CD8+ T lymphocyte populations in peripheral blood at 13 weeks post-BLT transplant. (B) Percentage of reconstituted human hematopoietic cell populations in peripheral blood in all BLT mice. (C) Schematic for infection and analysis of BLT hu-mice. Animals were euthanized at days 0, 5, 10, 63, and 92 post-HIV-1 injection for analysis of blood and bone marrow. (D) Human CD4/CD8 ratios were monitored in peripheral blood by flow cytometry. (E) Quantification of HIV-1 viral load in peripheral blood at the time of euthanasia.
Figure 2 with 2 supplements
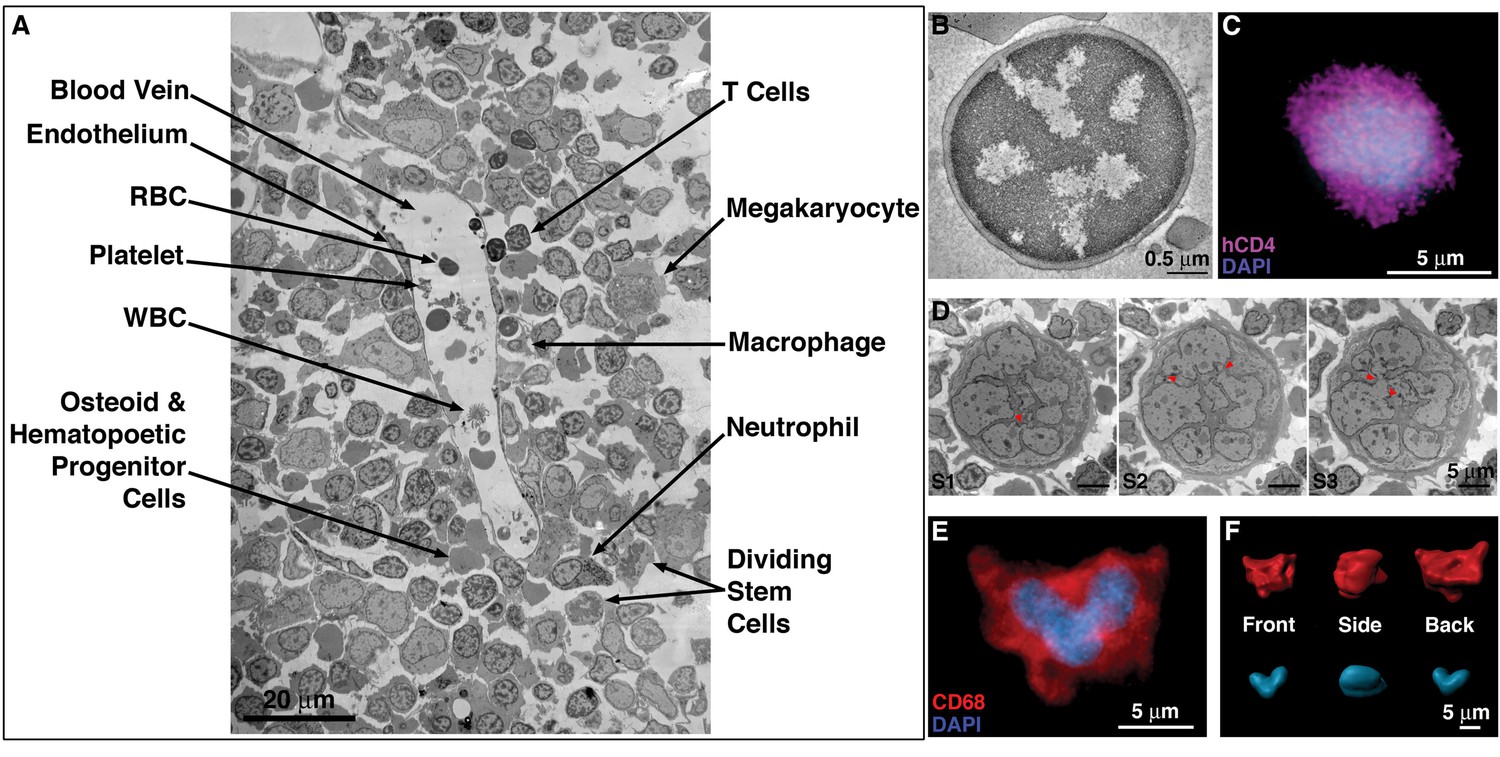
EM and LM imaging of cell types found in BM.
(A) EM overview of a vascularized region, showing a variety of resident cell types within BM (labeled). (B) EM tomographic slice showing typical morphology of a BM T-cell (spherical shape and large nucleus-to-cytoplasm ratio). (C) Confocal IF image showing an hCD4+ cell with a spherical shape and large nucleus-to-cytoplasm ratio. (D) Montaged projection EM overviews of a polymorphonuclear BM macrophage in three serial 400 nm sections, demonstrating connectivity between the various lobes of the complex nucleus (arrowheads). (E) Representative confocal slice of an hCD68+ cell (red) showing a multilobed nucleus (blue). Distinctly multinuclear macrophages were not observed in BM. (F) Segmented 3-D volume of the cell in (E) showing the complex surface morphology (red) and a single nucleus (blue) with multiple interconnected lobes.
Figure 2—figure supplement 1
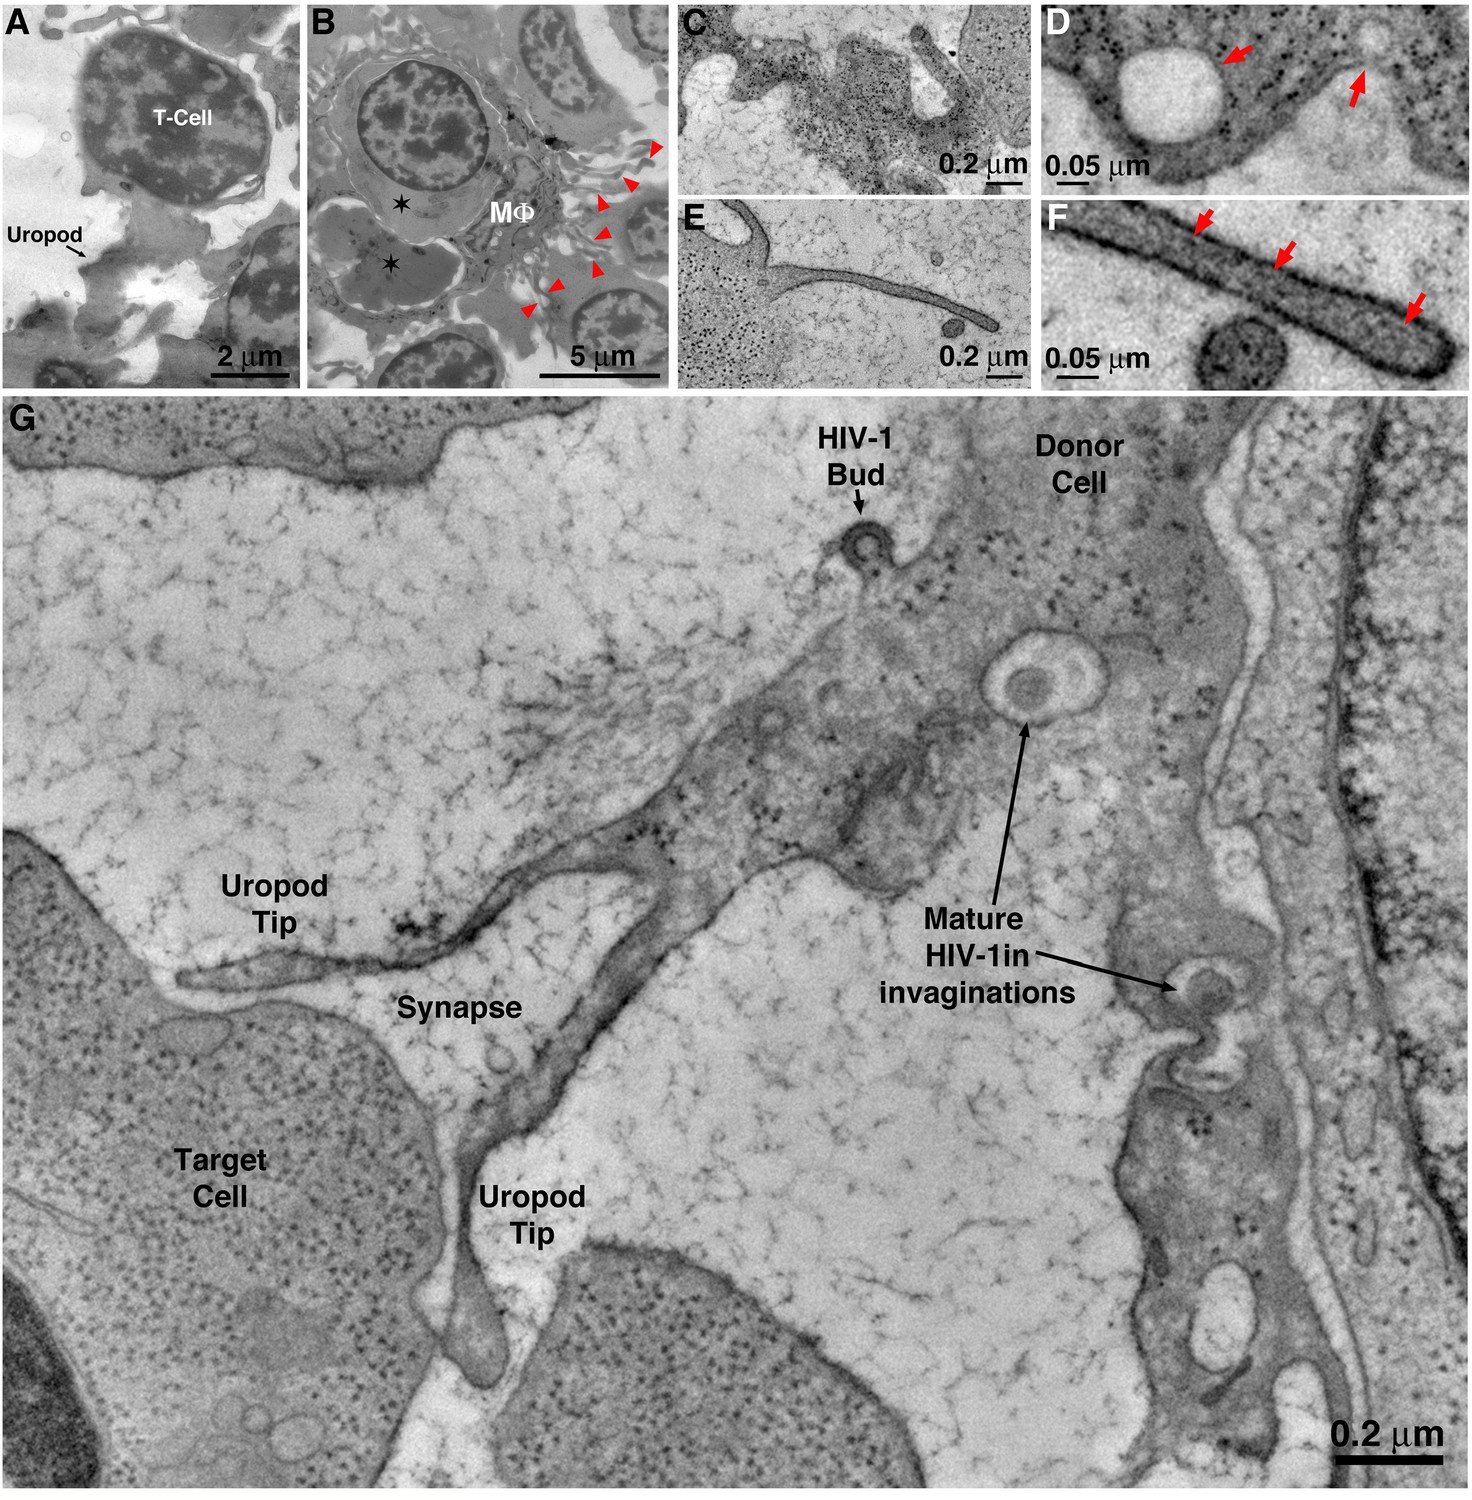
T-cells and macrophages display different modes of cell-to-cell contact for potential virus transfer.
(A) Projection EM image of a T-cell in BM exhibiting a uropod that is contacting other cells. (B) Projection EM image of a macrophage in BM (MΦ) engulfing other cells (stars). Numerous pseudopods (red arrowheads) are emanating from the MΦ surface. (C) Tomographic slice of a T-cell uropod. (D) Detail of the uropod in C showing pleomorphic shape and presence of cytoplasmic organelles such as ribosomes and endocytic compartments (red arrows). (E) Tomographic slice of a macrophage pseudopod. (F) Detail of the pseudopod in E, showing its thin profile and presence of actin filaments (red arrows). (G) Tomography of an HIV-1–associated uropod forming a virological synapse with a target cell. A nascent HIV-1 virion is budding from the uropod surface and mature HIV-1 are present within surface invaginations.
Figure 2—figure supplement 2
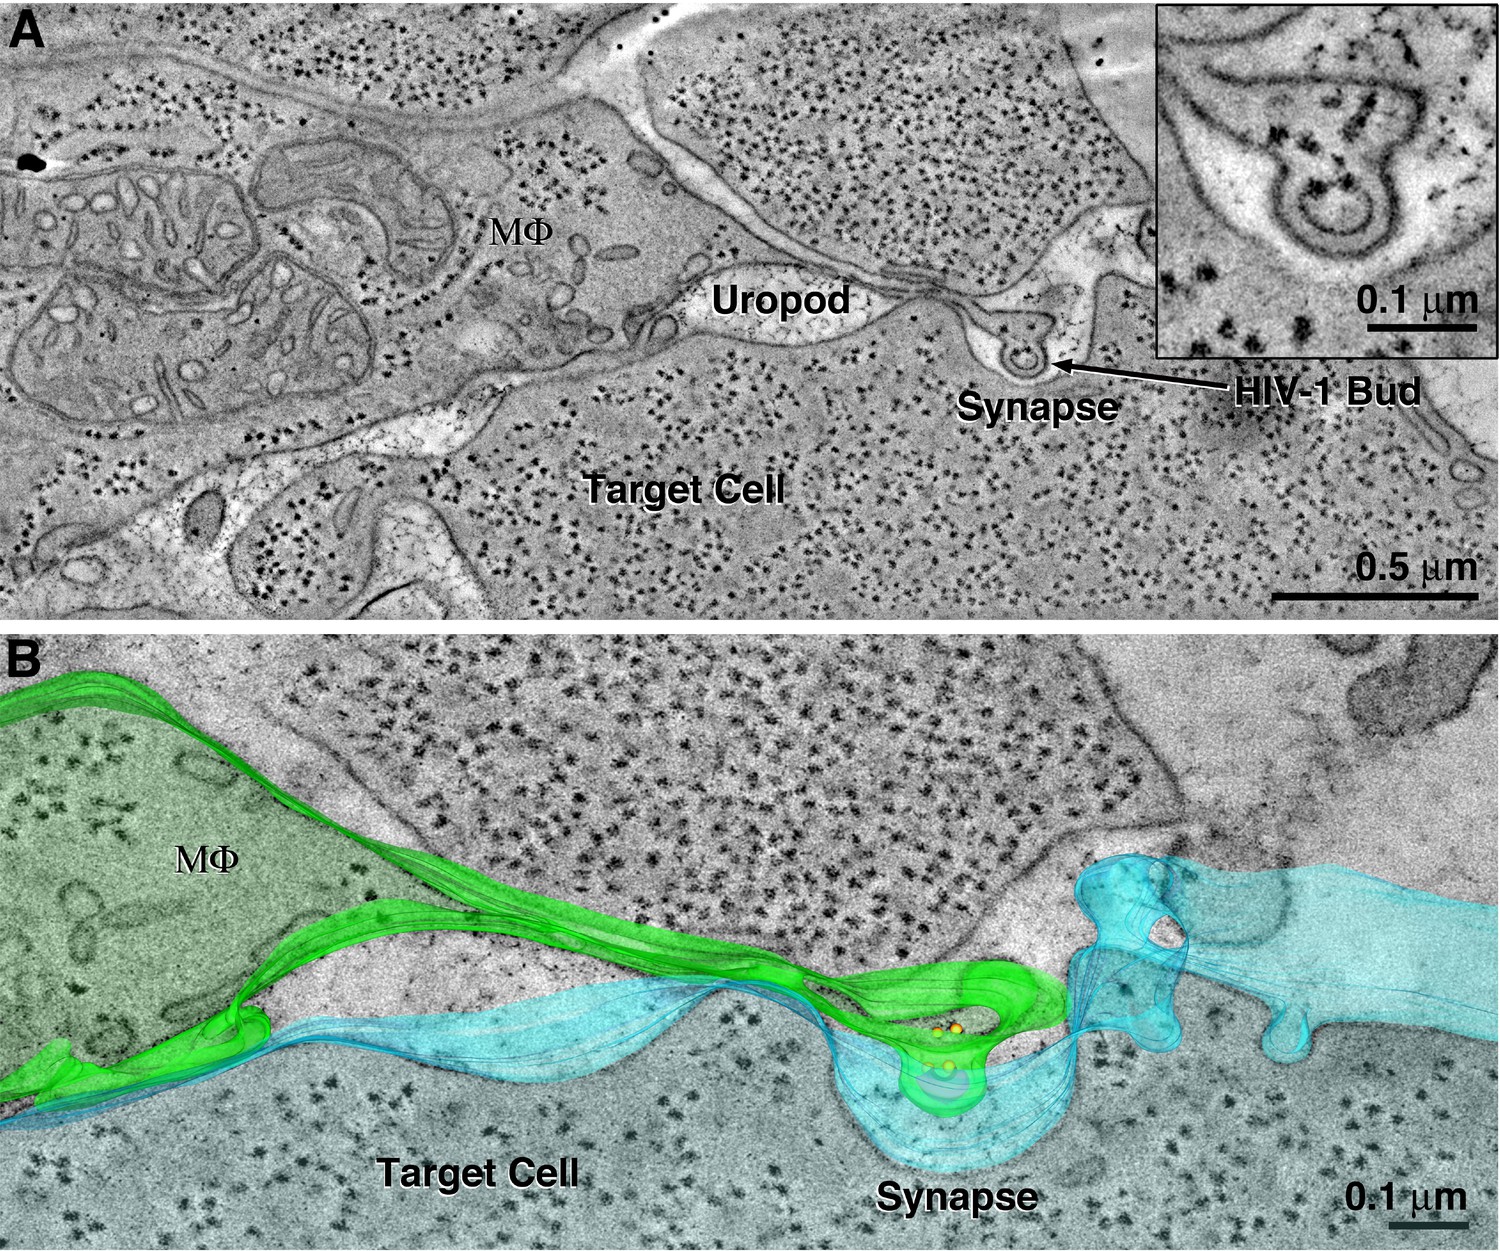
HIV-1–bearing uropods are associated with macrophages.
(A) Tomographic slice showing example of uropod extending from a macrophage that contains a budding HIV-1 virion. Uropods were more commonly seen associated with T-cells than with macrophages. (B) Segmented model.
Figure 3 with 1 supplement
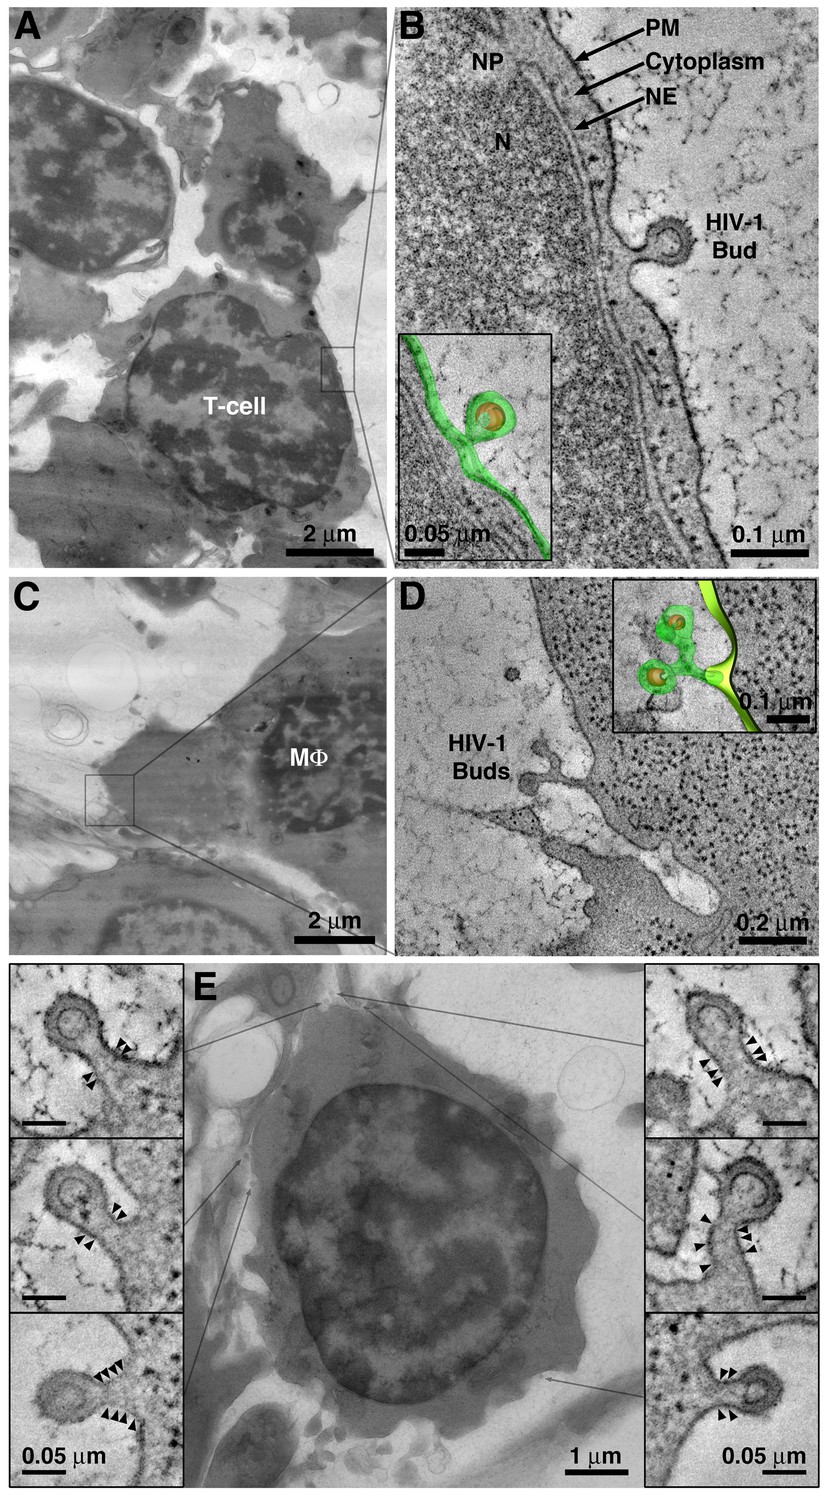
Detection of viruses budding from cells in BM.
(A) EM overview of a BM region containing a virus-producing T-cell. (B) Tomogram of an HIV-1 budding profile emanating from the surface of a T-cell showing little cytoplasm between the nuclear envelope (NE) and the budding plasma membrane (PM). N = nucleus; NP = nuclear pore. Inset: 3-D model of the HIV-1 bud (green; plasma membrane; orange, immature HIV-1 core). (C) EM overview of a BM region containing a virus-producing macrophage (MΦ). (D) Tomogram showing two HIV-1 budding profiles emanating from a single stalk. Macrophages often exhibited multiple (up to 5) viruses emanating from a single stalk. (E) Projection EM image showing HIV-1 budding profiles emanating from a virus-producing T-cell in BM (center). Six budding profiles were present on the cell within the volume of the reconstructed tomogram. Each bud had a similar neck diameter and discernable bands of electron density (arrowheads) potentially representing polymerized ESCRT-III fission machinery.
Figure 3—figure supplement 1
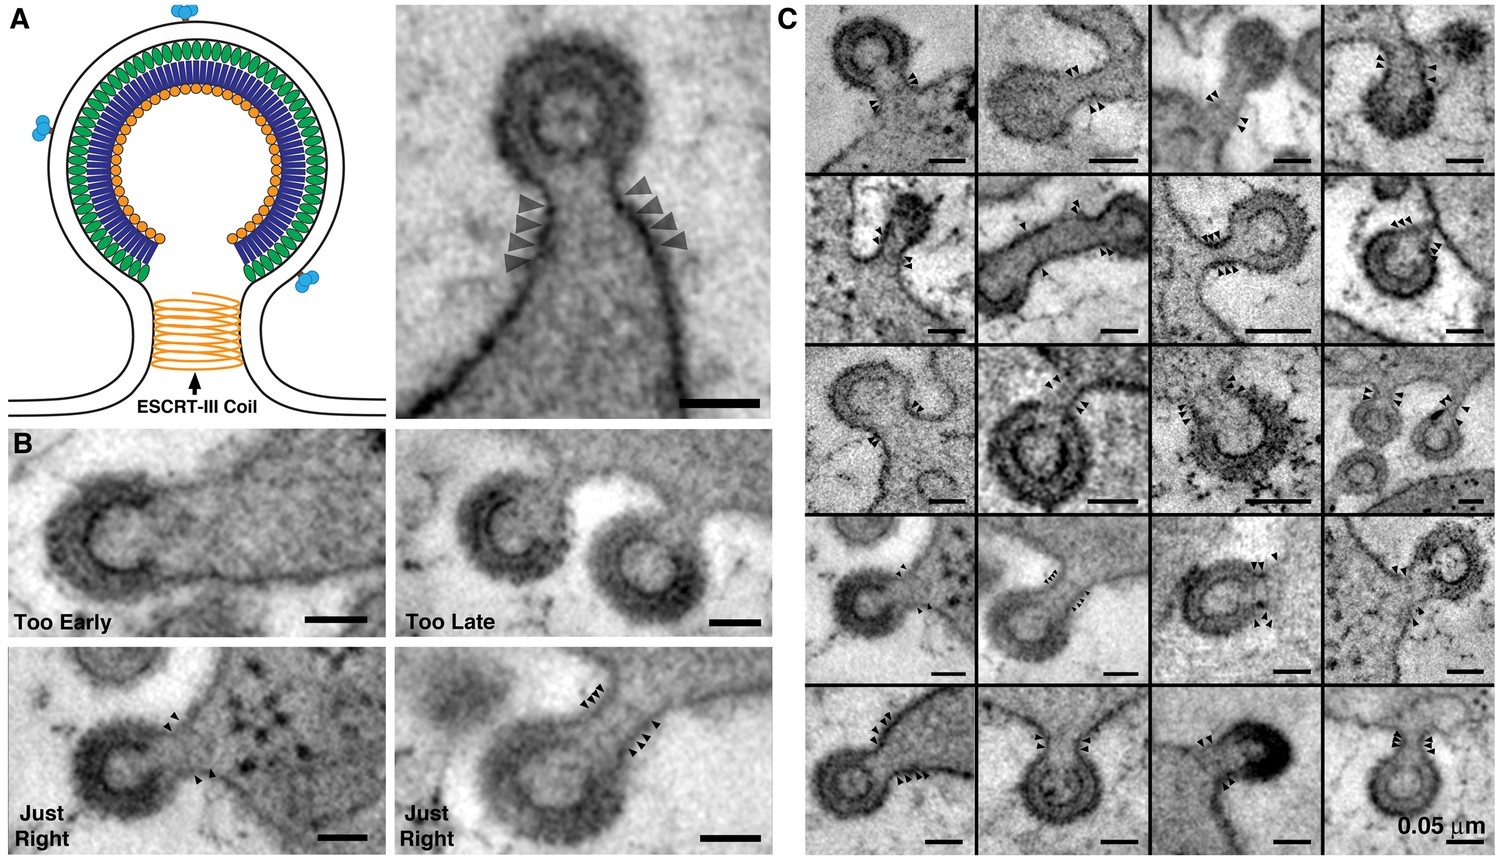
HIV-1 budding profiles displaying ESCRT-III spirals.
(A) Left; Schematic diagram of an HIV-1 budding profile showing a coil of ESCRT-III constricting the bud neck prior to scission (adapted from Sundquist and Krausslich, 2012). Right; Tomographic slice of an HIV-1 budding profile in a BM cell, displaying thin bands on the bud neck (arrowheads) that correspond to the ESCRT-III coil. Inset: Tomographic slice with ESCRT-III bands highlighted as segmented orange contours. (B) ESCRT-III bands (arrowheads) are discernable at a stage of budding when the bud neck is ~50–80% the diameter of the bud (Just Right), but not at earlier stages (Too Early) when the neck is >80% of the bud, or later stages (Too Late) when the neck is <50% of the bud. (C) Gallery of HIV-1 budding profiles, each showing 2–4 coils of the ESCRT-III bands at the contracting neck of the nascent virion. All scale bars are 0.05 μm.
Figure 4
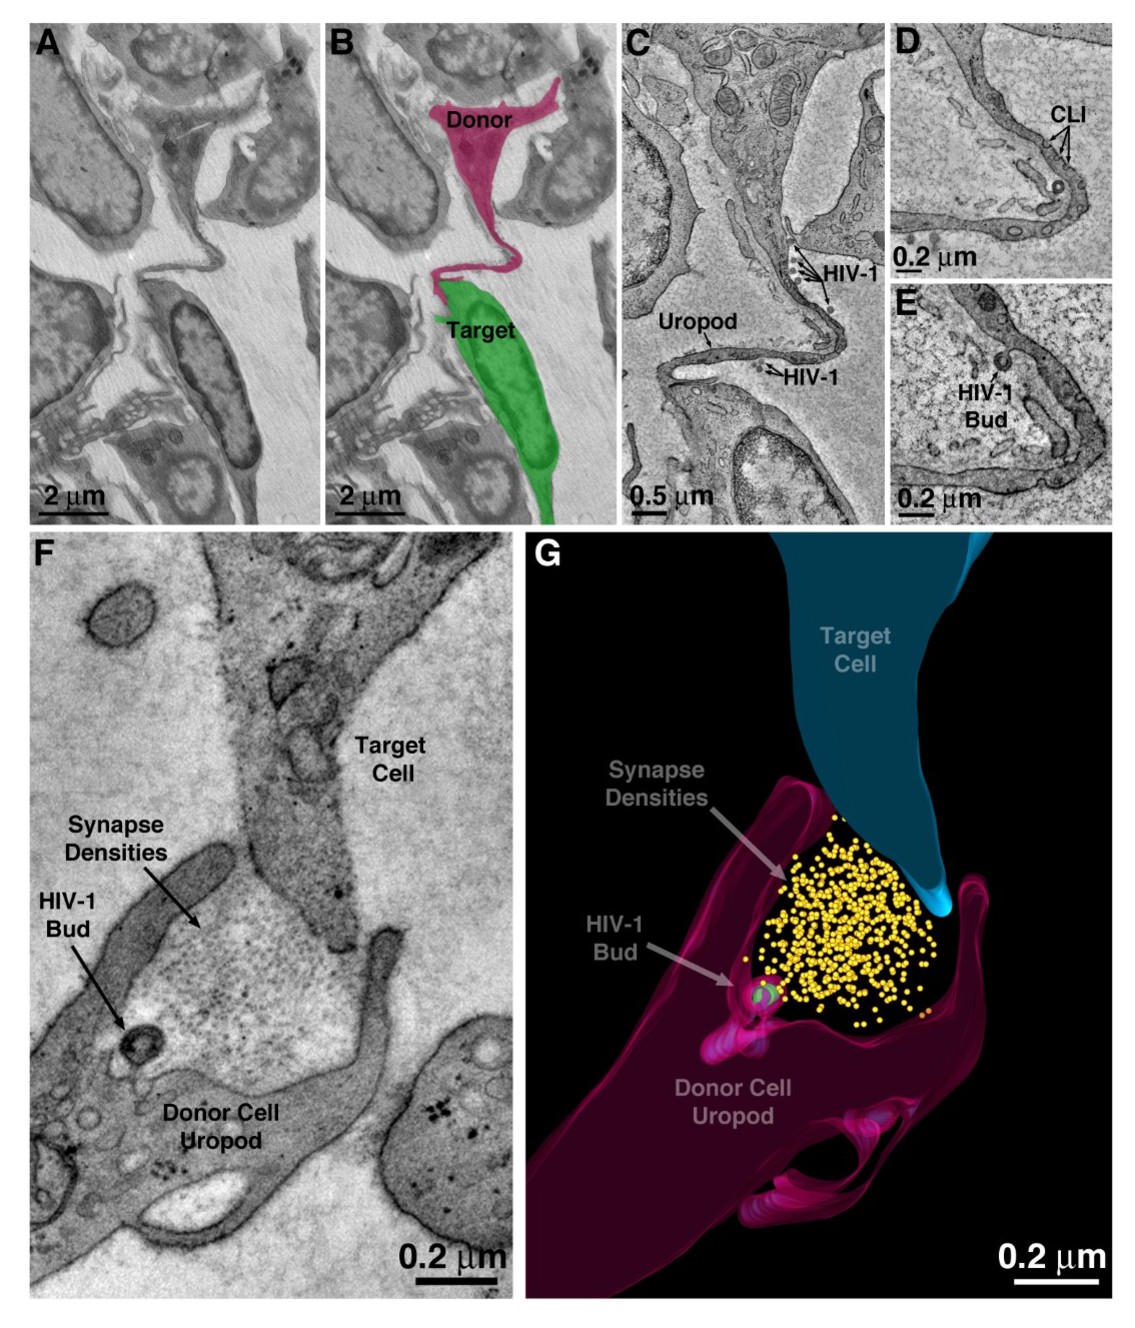
HIV-1 transfer via uropod.
(A–B) Projection EM image of cell-cell contact via uropod in BM (panel A) with modeled donor cell uropod (magenta) and target cell (green) (panel B). (C) Tomographic slice of the zone of contact between the donor uropod and target cell. Several free HIV-1 virions are visible along the length of the uropod. (D) Caveolae-like invaginations (CLI) along the uropod. (E) A virus budding from the plasma membrane of the uropod. (F) A virus budding from a uropod in contact with a potential target cell and possibly forming a virological synapse.
Figure 5
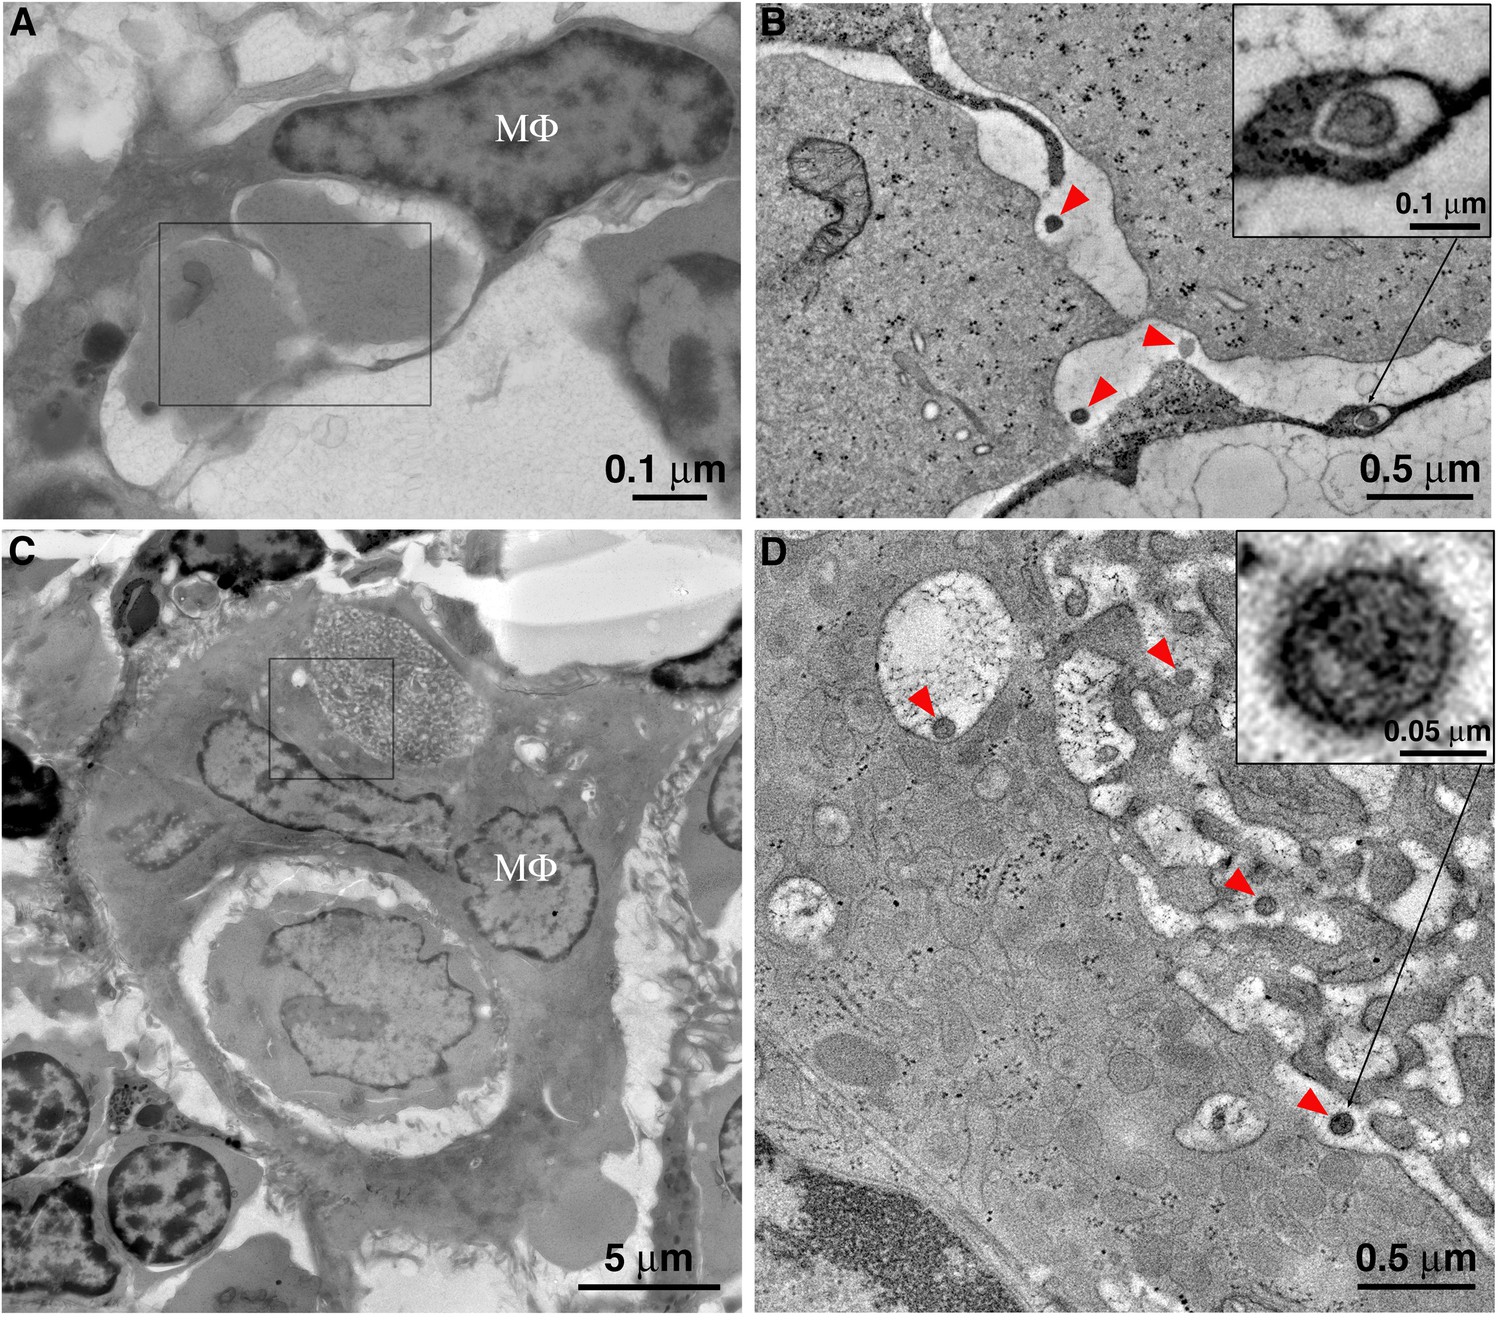
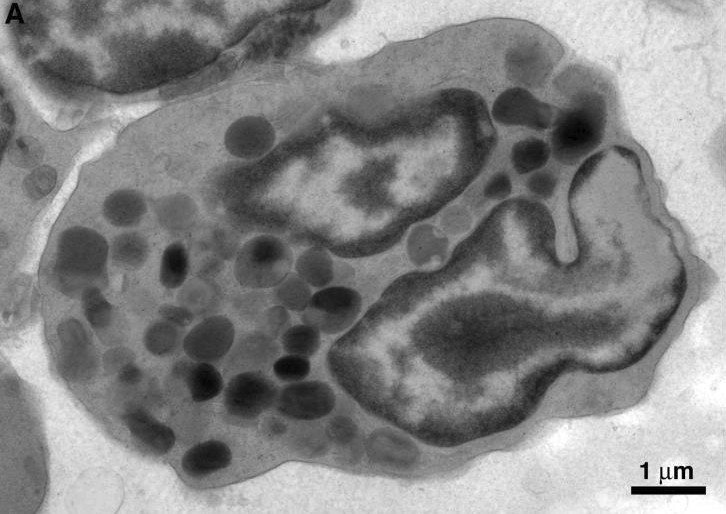
Macrophages phagocytose virus-producing cells within BM, and mature HIV-1 survives phagocytic degradation.
(A) A typical BM macrophage with a partially degraded cell within a phagosome. (B) Tomogram detail of the region indicated by the rectangle in A, showing mature HIV-1 virions (red arrowheads) within the phagosome, adjacent to the degrading cells. Inset: Mature HIV-1 virion within an endocytic compartment adjacent to the phagosome. (C) An enlarged polymorphonuclear macrophage with two phagocytosed cells at different stages of degradation. The cell in the upper phagosome is nearly completely degraded. (D) Tomogram detail of the region indicated by the square in C, showing a portion of the upper phagosome region. Mature HIV-1 virions (red arrowheads) are present within the phagosome and within an adjacent endocytic compartment that is continuous with the phagosome. Inset (upper right): higher magnification detail of an HIV-1 virion, confirming its identity by the presence of a cone-shaped core. Inset (lower left): Detail of a free, immature HIV-1 virion demonstrating an incomplete ‘C-shaped’ core.
Figure 6 with 3 supplements

Comparison of HIV-1–containing enclosed compartments and virus-containing compartments accessible to the extracellular space.
(A) Segmentation of an HIV-1-containing enclosed compartment from a tomographic reconstruction of a BM macrophage. Left to right: Tomographic slice, segmentation contours on a tomographic slice (green: enclosed compartment boundary; red: nascent HIV-1 core) showing that the compartment is completely contained within the section volume and there are no associated structures connecting with the cell surface (Figure 6—video 1). (B) HIV-1–containing enclosed compartments are distinguished from surface invaginations by their lumenal density (gray for enclosed compartments versus white for surface-accessible compartments) (Figure 6—video 2). (C) Tomographic slice demonstrating fusion of an HIV-1–containing enclosed compartment with a surface invagination. Electron density is slightly higher at the point of fusion (red arrows), suggesting diffusion of the compartment’s contents and a possible route of HIV-1 dissemination from the macrophage (Figure 6—video 3). All scale bars are 0.1 μm.
Figure 6—video 1
HIV-1 buds into completely enclosed compartments in macrophages.
Tomography of a region of a HIV-1 producing macrophage shows two mature virions contained within a completely enclosed compartment. The membrane surrounding the virions is completely intact throughout the volume in all directions and is not connected to the extracellular space in any way (i.e. thin membranous connections, ‘microchannels’, etc.). Segmentation and 3D modelling show the entire volume of the enclosed compartment (green) containing two virions (magenta) with mature capsids (white). Overview scale bar = 500 nm; zoomed scale bar = 100 nm.
Figure 6—video 2
Tomography of intracellular compartments from BM macrophages to correlate reduced luminal electron density with access to the extracellular space.
TEM overview showing a macrophage with a pleomorphic nucleus and a large number of plasma membrane invaginations. Red outline indicates the region imaged by ET showing invaginations with white luminal density are connected to the extracellular space in 3D.
Figure 6—video 3
Fusion of completely enclosed intracellular compartments with surface invaginations as a mechanism for virus dissemination by macrophages.
ET volume showing an electron dense enclosed compartment from a macrophage containing a single virion after fusion with an electron lucent plasma membrane invagination that extends towards the periphery of the cell. Scale bar = 100 nm.
Figure 7 with 1 supplement
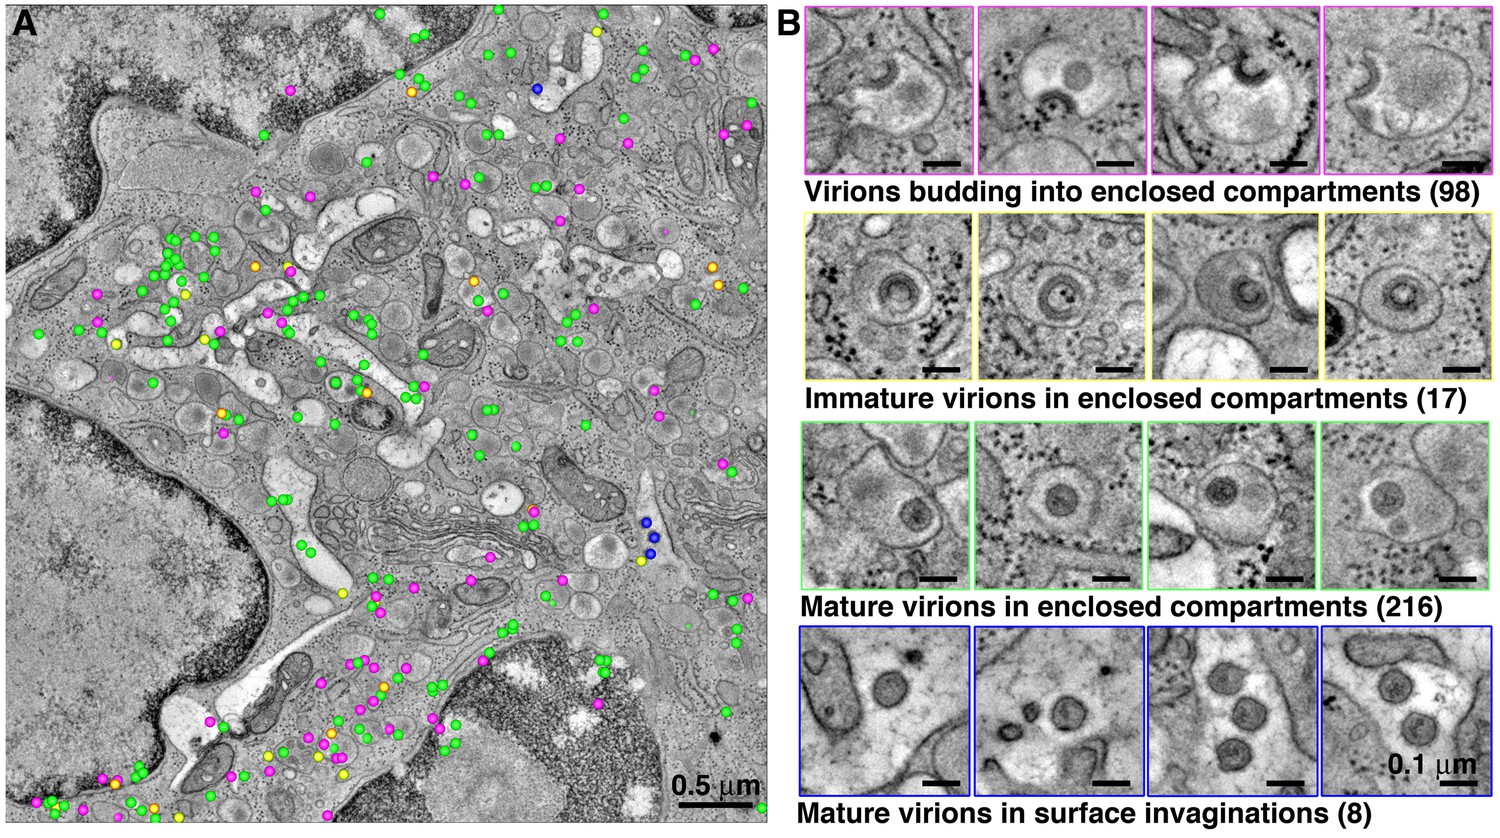
Quantification of HIV-1 virions associated with enclosed compartments in a BM macrophage.
All HIV-1 particles were located and tabulated within a tomographic reconstruction representing a 5.5 μm x 5.5 μm x 1.5 μm volume of an enlarged, polymorphonuclear BM macrophage. (A) Representative slice from the montaged tomogram, indicating the relative positions of virions budding into enclosed compartments (magenta), free immature (yellow) and mature (green) virions within enclosed compartments, and mature virions within surface invaginations (blue). (B) Gallery of examples of each class of virion from the tomogram.
Figure 7—figure supplement 1
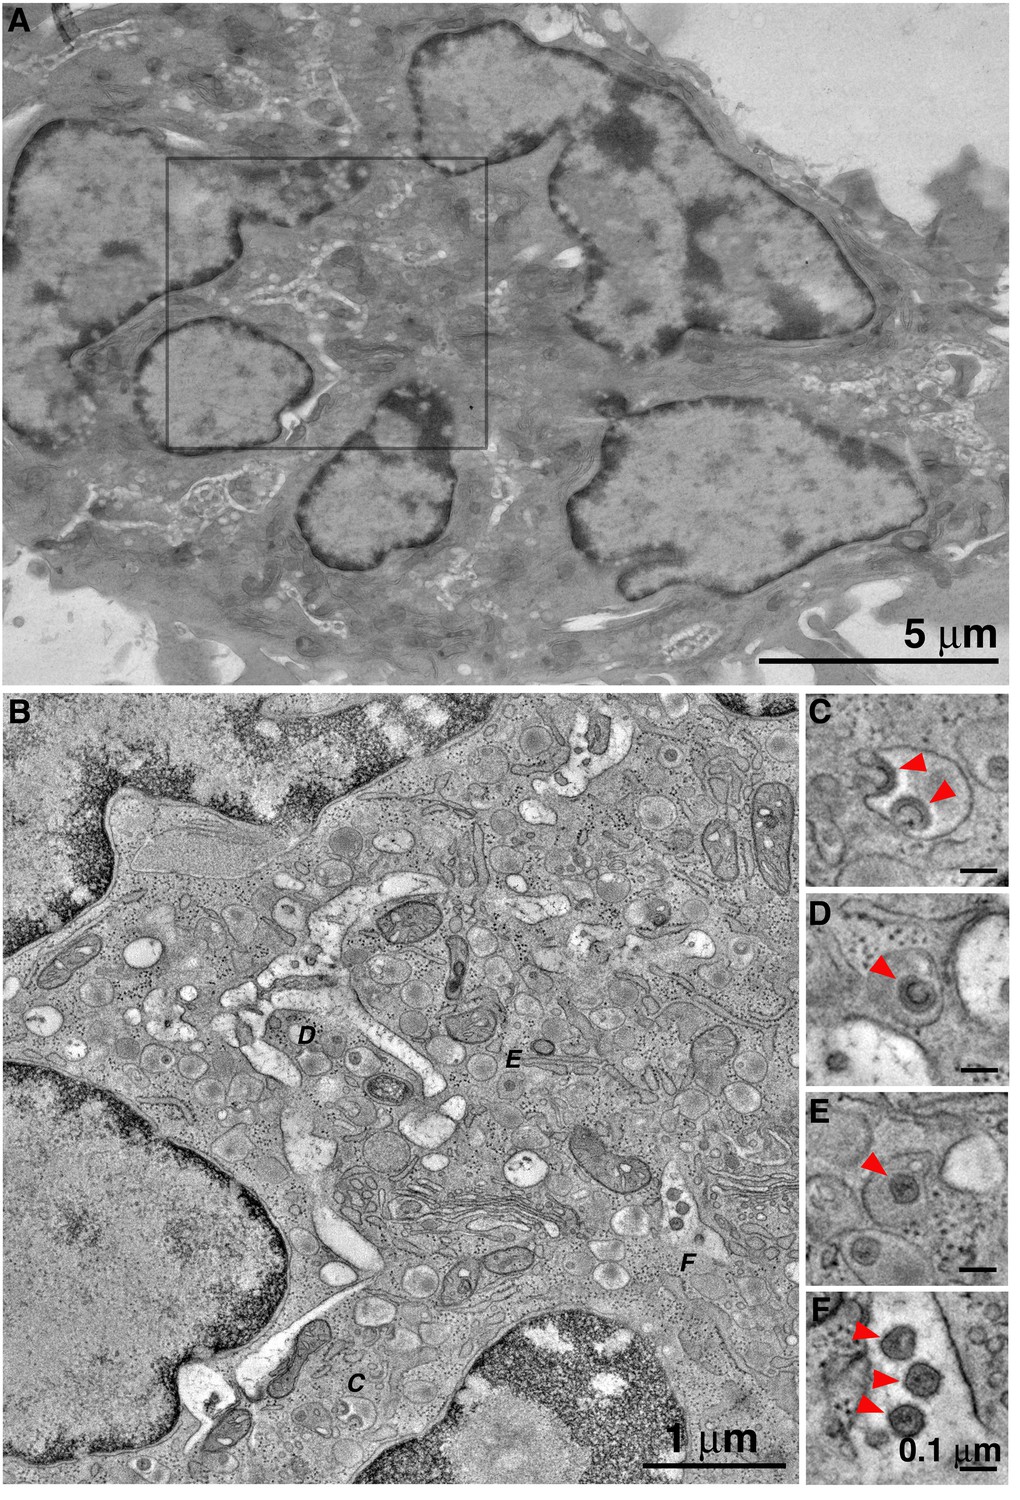
HIV-1 buds into, and matures within, enclosed compartments in BM macrophages.
(A) Projection overview of a polymorphonuclear macrophage in BM. (B) Slice from a montaged tomographic reconstruction of a region corresponding to the square in A. (C–F) Details from the tomogram corresponding to lettered positions in B, showing (C) nascent HIV-1 budding into an enclosed compartment; (D) a free immature HIV-1 virion within an enclosed compartment; (E) mature HIV-1 virions in two adjacent enclosed compartments; (F) Mature HIV-1 virions within an invagination of the macrophage surface.
Author response image 1
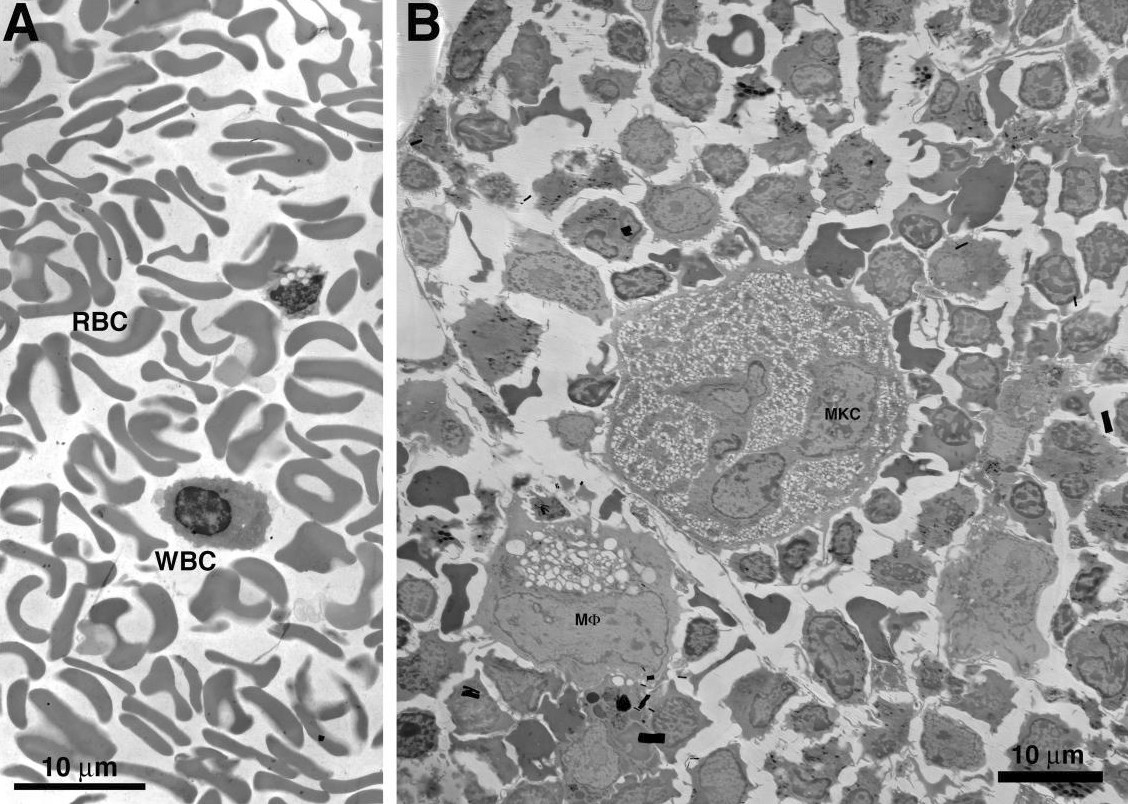
Comparison of macaque BM extracted by needle aspiration vs. direct removal from a long bone.
(A) EM overview of a typical field of macaque BM, extracted from femur by needle aspiration. The field is composed entirely of red (RBC) and white (WBC) blood cells in proportions similar to that of whole blood. Regions containing typical BM resident cells were not found. (B) EM overview of a typical field of macaque BM, extracted directly from dissected sternum. The field is composed of typical BM resident cells, including osteocytes, stem cells, macrophages (MF) and megakaryocytes (MKC). The field is similar to that of the BLT mouse BM samples shown in our paper.
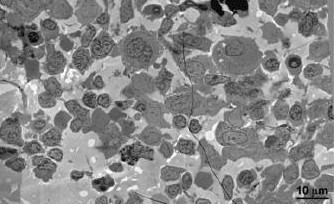
Author response image 2
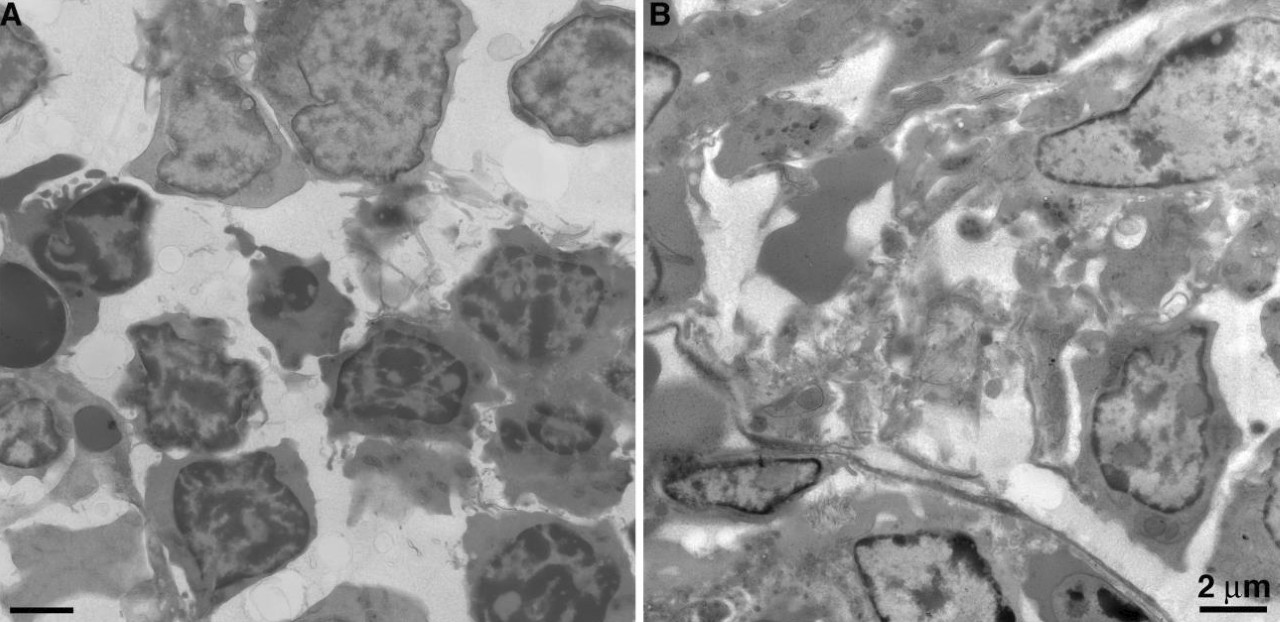
Comparison of freshly prepared BLT mouse BM vs. similar sample prepared after longer than one day.
(A) Overview of BM from a sample processed within 1 day of extraction. Cells are well preserved with even contrast and density of cellular components. (B) Overview of BM from a sample processed >1 day after extraction. Cellular degradation is evident as disruption and/or distortion of cells, variable contrast, and density of cellular components (particular nuclei).
Author response image 3
Electron microscopy of neutrophils.
Polymorphonuclear neutrophil from HIV-infected BLT mouse BM.
Author response image 4
EM of BM.
EM overview of BLT hu-mouse BM.
Author response image 5
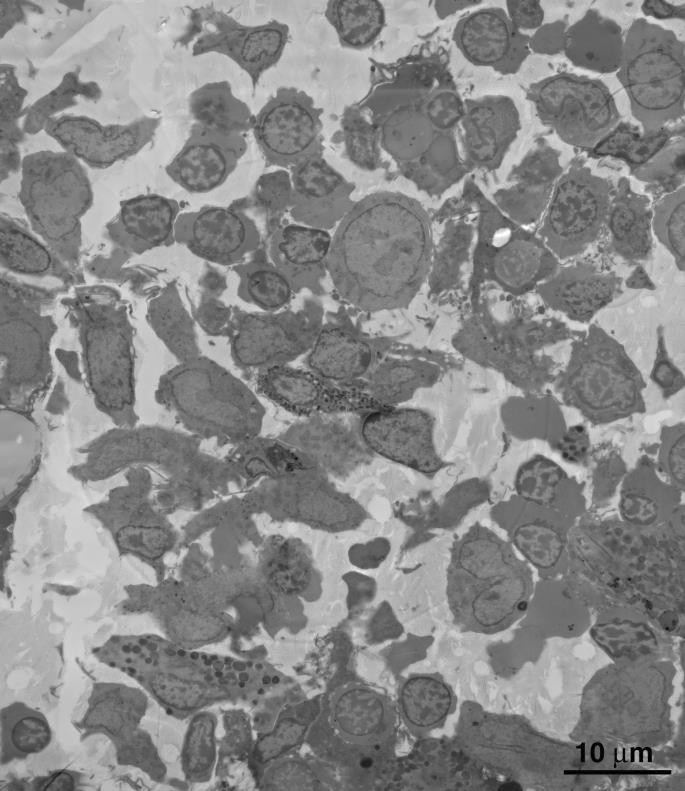
Montaged overview of a typical field of BM from an uninfected BLT mouse.
Cell density and distribution of cell types are indistinguishable from that of similar HIV-infected BM tissue.
Tables
Key resources table
| Reagent type (species) or resource | Designation | Source or reference | Identifiers | Additional information |
|---|---|---|---|---|
| NOD.Cg-PrkdcscidIl2rgtm1Wjl/SzJ (Mus musculus) | NSG | UCLA CFAR Humanized Mouse Core laboratory | ||
| NFNSX (HIV-1) | NFNSX | O'Brien et al., 1990 | ||
| Biological sample (Homo sapiens) | Human fetal thymus and liver | Advanced Bioscience Resources (ABR) | Freshly isolated from de-identified human fetus | |
| Antibody | anti-human CD34+ (Mouse monoclonal) | Miltenyi Biotec | Catalog # 130-100-453 | FACS (100 µL for up to 1e8 cells. |
| Antibody | anti-human CD45-eFluor 450 (mouse monoclonal, clone HI30) | eBiosciences | Catalog # 48-0459-42 | 5 µL (0.5 µg)/test |
| Antibody | anti-human CD3-APC H7 (mouse monoclonal, clone SK7) | BD Pharmingen | Cat# 340440 | 10 µL / 100 µL test |
| Antibody | anti-human CD4-APC (mouse monoclonal, clone OKT4) | eBiosciences | Catalog # 17-0048-42 | 5 µL (0.06 µg)/test |
| Antibody | anti-human CD8-PerCP Cy5.5 (mouse monoclonal, clone SK1) | BioLegend | Catalog # 344710 | 5 µl per million cells in 100 µl |
| Antibody | anti-human CD19-Brilliant Violet 605 (mouse monoclonal, clone HIB19) | BioLegend | Catalog # 302244 | 5 µl per million cells in 100 µl |
| Antibody | anti-mouse FcR (CD16/32); (rat monoclonal, clone 93) | BioLegend | Catalog # 101302 | 1:100 |
| Antibody | anti-human CD68 (mouse monoclonal,clone PG-M1 | Dako | Catalog # M0876 | 1:200 |
| Antibody | anti-p24 (HIV-1); (mouse monoclonal,clone Kal-1) | Dako | Catalog # M0857 | 1:200 |
| Antibody | anti-human CD4 (mouse monoclonal,clone 4B12) | Dako | Catalog # M7310 | 1:200 |
| Antibody | anti-p24 (HIV-1); (goat polyclonal) | Creative Diagnostics | Catalog # DPATB-H81692 | 1:200 |
| Antibody | Anti-goat IgG Alexa Fluor 633 (Donkey polyclonal) | Life Technologies | Catalog # A21082 | 1:1000 |
| Sequence-based reagent | HIV-1 NFNSXGag Forward | This paper | PCR primer | 5’-CCCTACCAGCATTCTGGACATAAG-3’ |
| Sequenced-based reagent | HIV-1 NFNSXGag Reverse | This paper | PCR primer | 5’-GCTTGCTCGGCTCTTAGAGTT-3’ |
| Sequenced-based reagent | HIV-1 NFNSXGag qRT-PCR Probe | This paper | qRT-PCR Probe | 5'-FAM-ACAAGGACCAAAGGAACCCTT-BHQ1-3' |
| Software, algorithm | FlowJo | TreeStar software | V10 | |
| Software, algorithm | Fiji (Image J) | Schindelin et al., 2012 | ||
| Software, algorithm | Imaris (Bitplane) | Oxford Instruments | V8.4–9.2 | |
| Software, algorithm | IMOD | (Kremer et al., 1996; Mastronarde, 2008) |
Additional files
-
Transparent reporting form
- https://doi.org/10.7554/eLife.46916.017
Download links
A two-part list of links to download the article, or parts of the article, in various formats.
Downloads (link to download the article as PDF)
Open citations (links to open the citations from this article in various online reference manager services)
Cite this article (links to download the citations from this article in formats compatible with various reference manager tools)
Mechanisms of virus dissemination in bone marrow of HIV-1–infected humanized BLT mice
eLife 8:e46916.
https://doi.org/10.7554/eLife.46916


