FMRP has a cell-type-specific role in CA1 pyramidal neurons to regulate autism-related transcripts and circadian memory
- The Rockefeller University, United States
- Howard Hughes Medical Institute, United States
Figures
Figure 1 with 1 supplement

CA1 pyramidal neuron specific FMRP CLIP.
(A) Schematic of the Fmr1-cTag conditional knock-in mouse. The final exon of the Fmr1 gene is flanked by loxP sites and a second copy of this exon with an additional AcGFP sequence at the end of the coding region is cloned downstream. In the absence of Cre-dependent recombination the endogenous untagged protein is expressed. Cre-dependent recombination causes usage of the alternative final exon and expression of the GFP-tagged FMRP. (B) The Fmr1-cTag mouse was crossed with a Camk2a-Cre mouse line. Cre-dependent recombination and expression of the GFP-tagged FMRP occurs predominantly in the CA1 region. Brain sections were prepared from P29 Fmr1-cTagCamk2a-Cre mice (Camk2a-Cre) or Fmr1-cTag mice (Cre Negative). Immunofluorescence was performed using a GFP antibody and an antibody to the neuronal marker NeuN, shown in green and magenta respectively in merged image. Higher magnification image of the Fmr1-cTagCamk2a-Cre mice GFP staining shows presence of the GFP-tagged FMRP in the cytoplasm and proximal dendrites of the CA1 neurons. (C) Three biological replicates of CA1 FMRP cTag CLIP from P28-32 male Fmr1-cTagCamk2a-Cre mice are well correlated. The scatter plots of read counts per million per transcript (CPM) for each pairwise comparison are shown. Numbers represent Pearson R2 correlation between the replicates. (D) CLIP read distribution across genic regions from three biological replicates shows that FMRP predominantly binds the coding sequence with some binding within 3’UTRs. Counts of reads mapping to each region were normalized for the overall sequence length of each feature. (E) Meta-transcript coverage profile showing the relative CLIP read coverage upstream and downstream of the start and stop codons. Coverage was calculated from the 1000 transcripts with highest CLIP tag density and plotted relative to the coding region. The coding region is highlighted in gray. (F) Coverage plots for four well-established FMRP targets showing the total number of CLIP reads from all three replicates that overlap each nucleotide in the transcript.
Figure 1—figure supplement 1
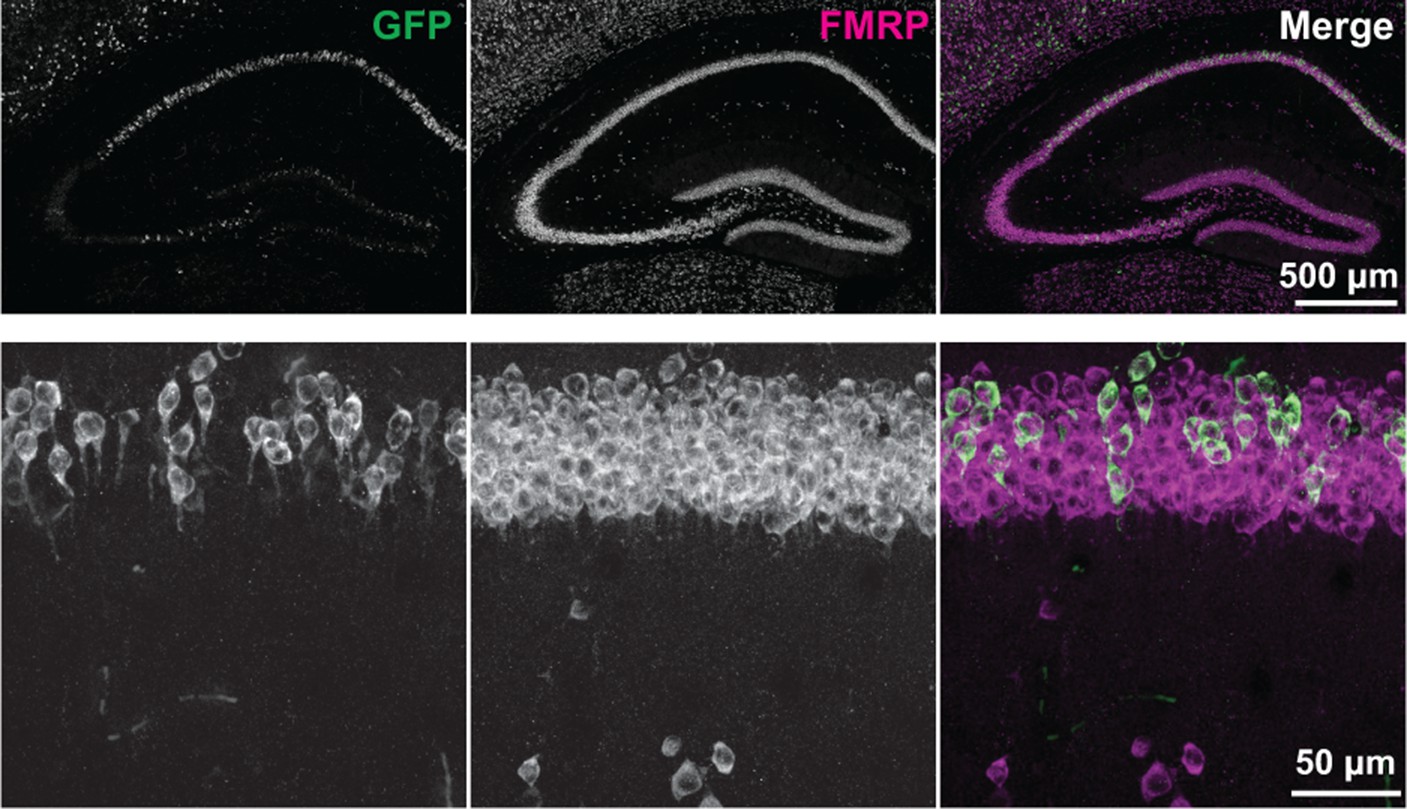
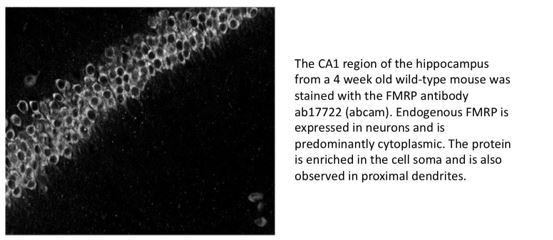
Expression of AcGFP-tagged FMRP protein.
Endogenous and GFP-tagged FMRP protein were detected in brain sections from P29 Fmr1-cTagCamk2a-Cre mice by immunofluorescence using antibodies against FMRP and GFP. The FMRP antibody (shown in magenta in the merged image) detects both the endogenous and GFP-tagged protein. The GFP antibody (shown in green in the merged image) detects only the GFP-tagged version of the protein present in cells where recombination has occurred. A higher magnification image of the CA1 region is also shown.
Figure 2 with 4 supplements
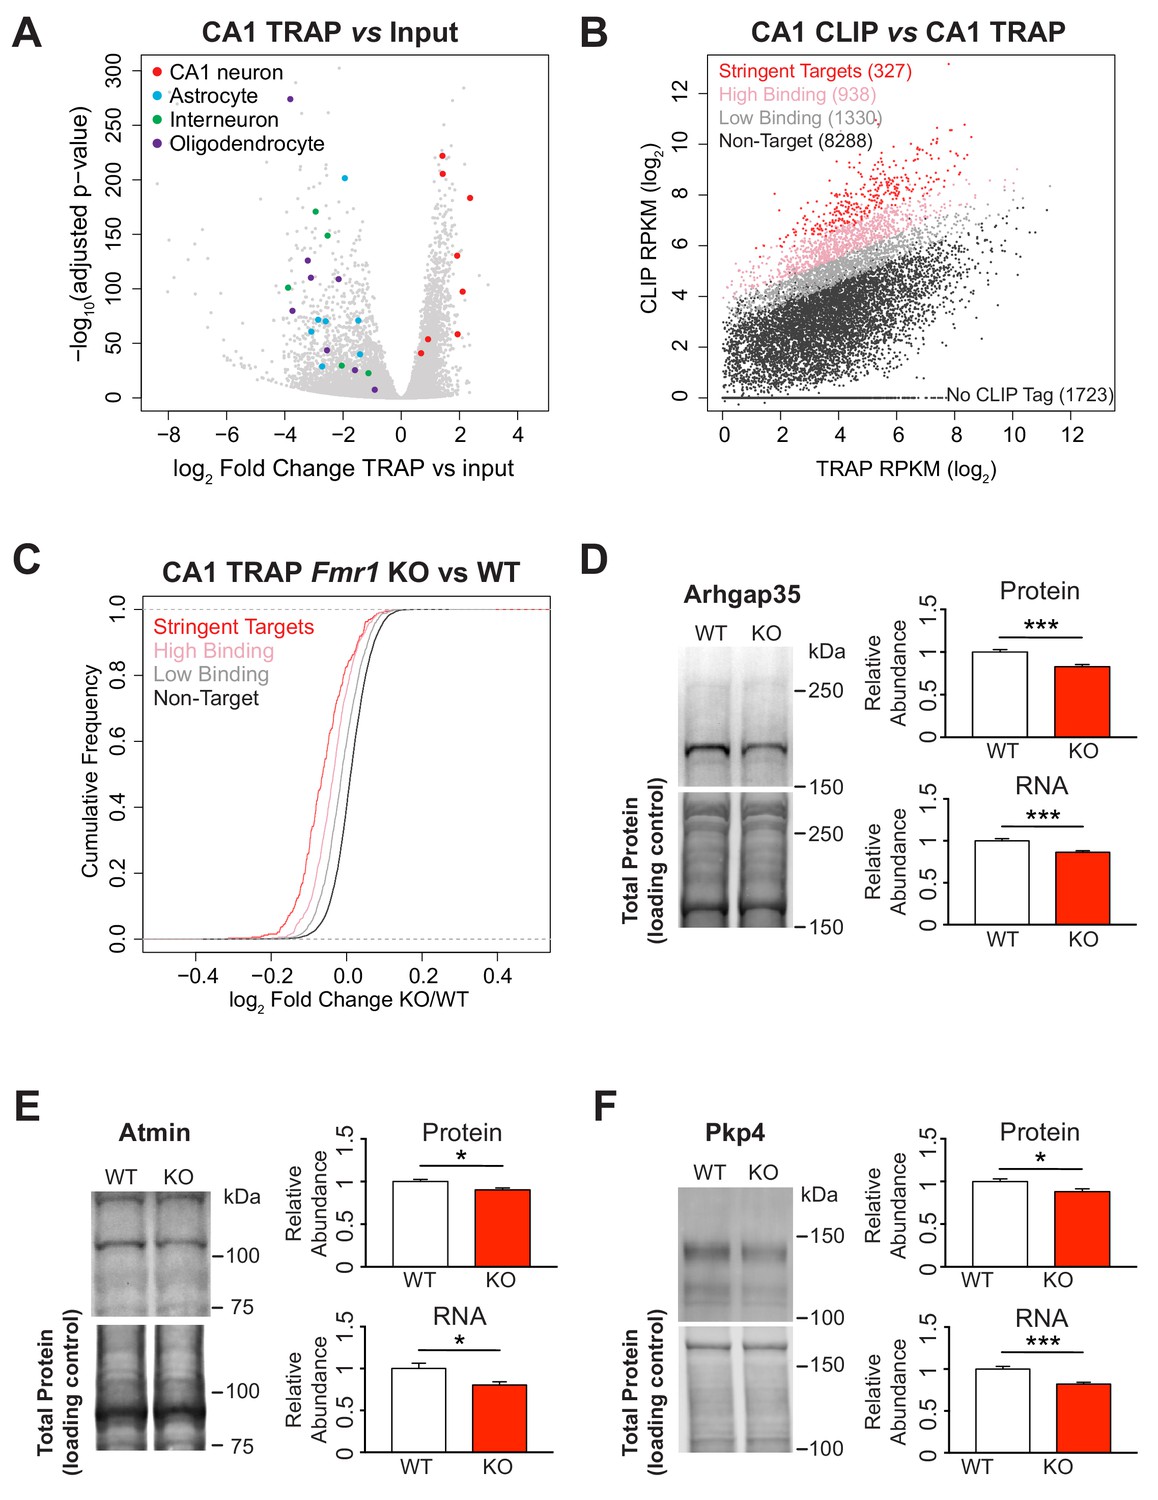
Identification of FMRP targets and CA1 neuron specific TRAP in the Fmr1 KO.
(A) Immunoprecipitation of ribosome associated RNA from CA1 neurons from WT and Fmr1 KO animals. Differential analysis of counts per gene from TRAP RNA compared to input RNA showing fold change and statistical significance as determined by DESeq2. CA1 markers (Wfs1, Pou3f1, Nov, Man1a, Mpped1, Cds1, Fibcd1, Satb2) are enriched in the IP whereas markers for other cell types are depleted (Astrocytes: Slc1a2, Gjb6, Gfap, Slc1a3, Aqp4, Aldoc, Aldh1l1; Interneurons: Slc6a1, Slc32a1, Gad1, Gad2, Pvalb; Oligodendrocytes: Cnp, Mog, Mag, Olig2, Olig1, Mobp, Mbp, Mal). (B) FMRP targets were defined by normalizing CLIP tag density across the coding region to the relative abundance of the transcript as measured by TRAP. A CLIP score per transcript was calculated independently for each replicate of the CLIP experiment. Stringent targets were defined as those with a CLIP score > 2 in every replicate, targets with high binding were defined as those with an average CLIP score > 1 and targets with low binding were defined as those with an average CLIP score between 0 and 1. Scatter plot of average density of CLIP tags across the coding region (CLIP RPKM) vs transcript abundance calculated as TRAP read density across the full transcript (TRAP RPKM). Targets of each subclass are highlighted in the plot and the number of genes within each subclass is indicated. (C) FMRP targets are down-regulated in the Fmr1 KO, with the magnitude of the effect being proportional to the amount of FMRP binding. Cumulative density function plots of the log2 fold change between Fmr1 KO TRAP and WT TRAP for each FMRP target subclass. All subclasses have a significant shift compared to the unbound group (Kolmogorov-Smirnov test, p-value<2.2×10⁻¹⁶ for all pairwise comparisons) and there are also significant differences between each subclass (stringent binding vs high binding: p-value=5.78×10⁻⁹; high binding vs low binding: p-value<2.2×10⁻¹⁶). (D–F) Quantitative western blot and PCR validation of TRAP results. Protein and RNA levels of the FMRP targets Arhgap35 (D), Atmin (E) and Pkp4 (F) are decreased in hippocampal lysates from Fmr1 KO mice relative to WT. A representative western blot is shown for one pair of WT and KO littermates. Western blots were normalized to total protein per lane visualized with REVERT total protein stain. qPCR data was normalized to Gapdh, Actin and Hprt housekeeping genes. Data are from 6 to 9 animals per genotype and mean ± SEM is shown. p-values were calculated using Student’s t-test (*p<0.05, ***p<0.001).
Figure 2—figure supplement 1
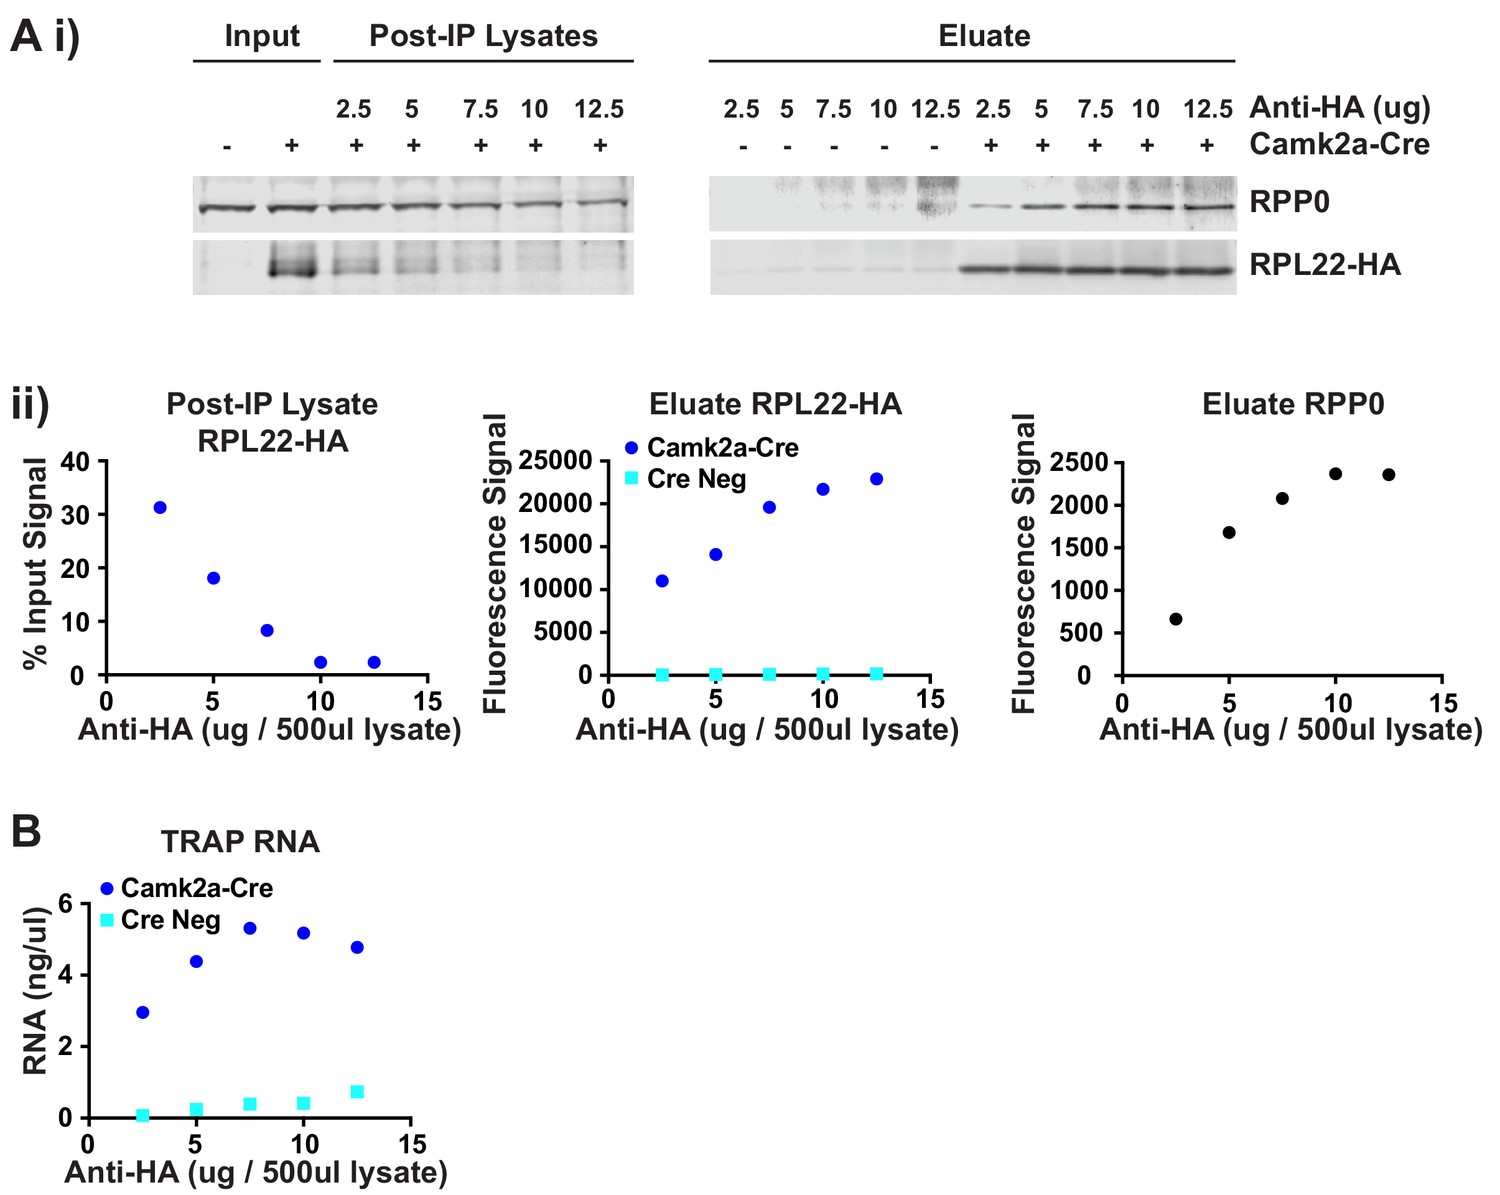
Optimization of TRAP immunoprecipitation.
The amount of antibody required for the TRAP IP was determined by titration. 500 μl hippocampal lysate was incubated with varying amounts of anti-HA antibody from 2.5 to 12.5 μg, followed by pull down of the antibody-ribosome-mRNA complex with protein A dynabeads. After washing, half the beads were used for protein extraction while the other half were used RNA isolation. (A) Protein concentration in the input lysate and remaining in the supernatant after IP (Post-IP Lysate) as well as the amount of protein eluted from the beads was determined by Western blotting. Western blots for the ribosomal protein RPP0 and the HA-tagged RPL22 ribosomal protein are shown (i) along with the quantification of the protein bands (ii). (B) Concentration of RNA eluted from the beads is shown for each IP. Based on these combined results 10 μg antibody per 500 μl lysate was determined to be the optimal concentration to ensure maximal depletion of the HA-tagged polysomes and give the best signal-to-noise.
Figure 2—figure supplement 2
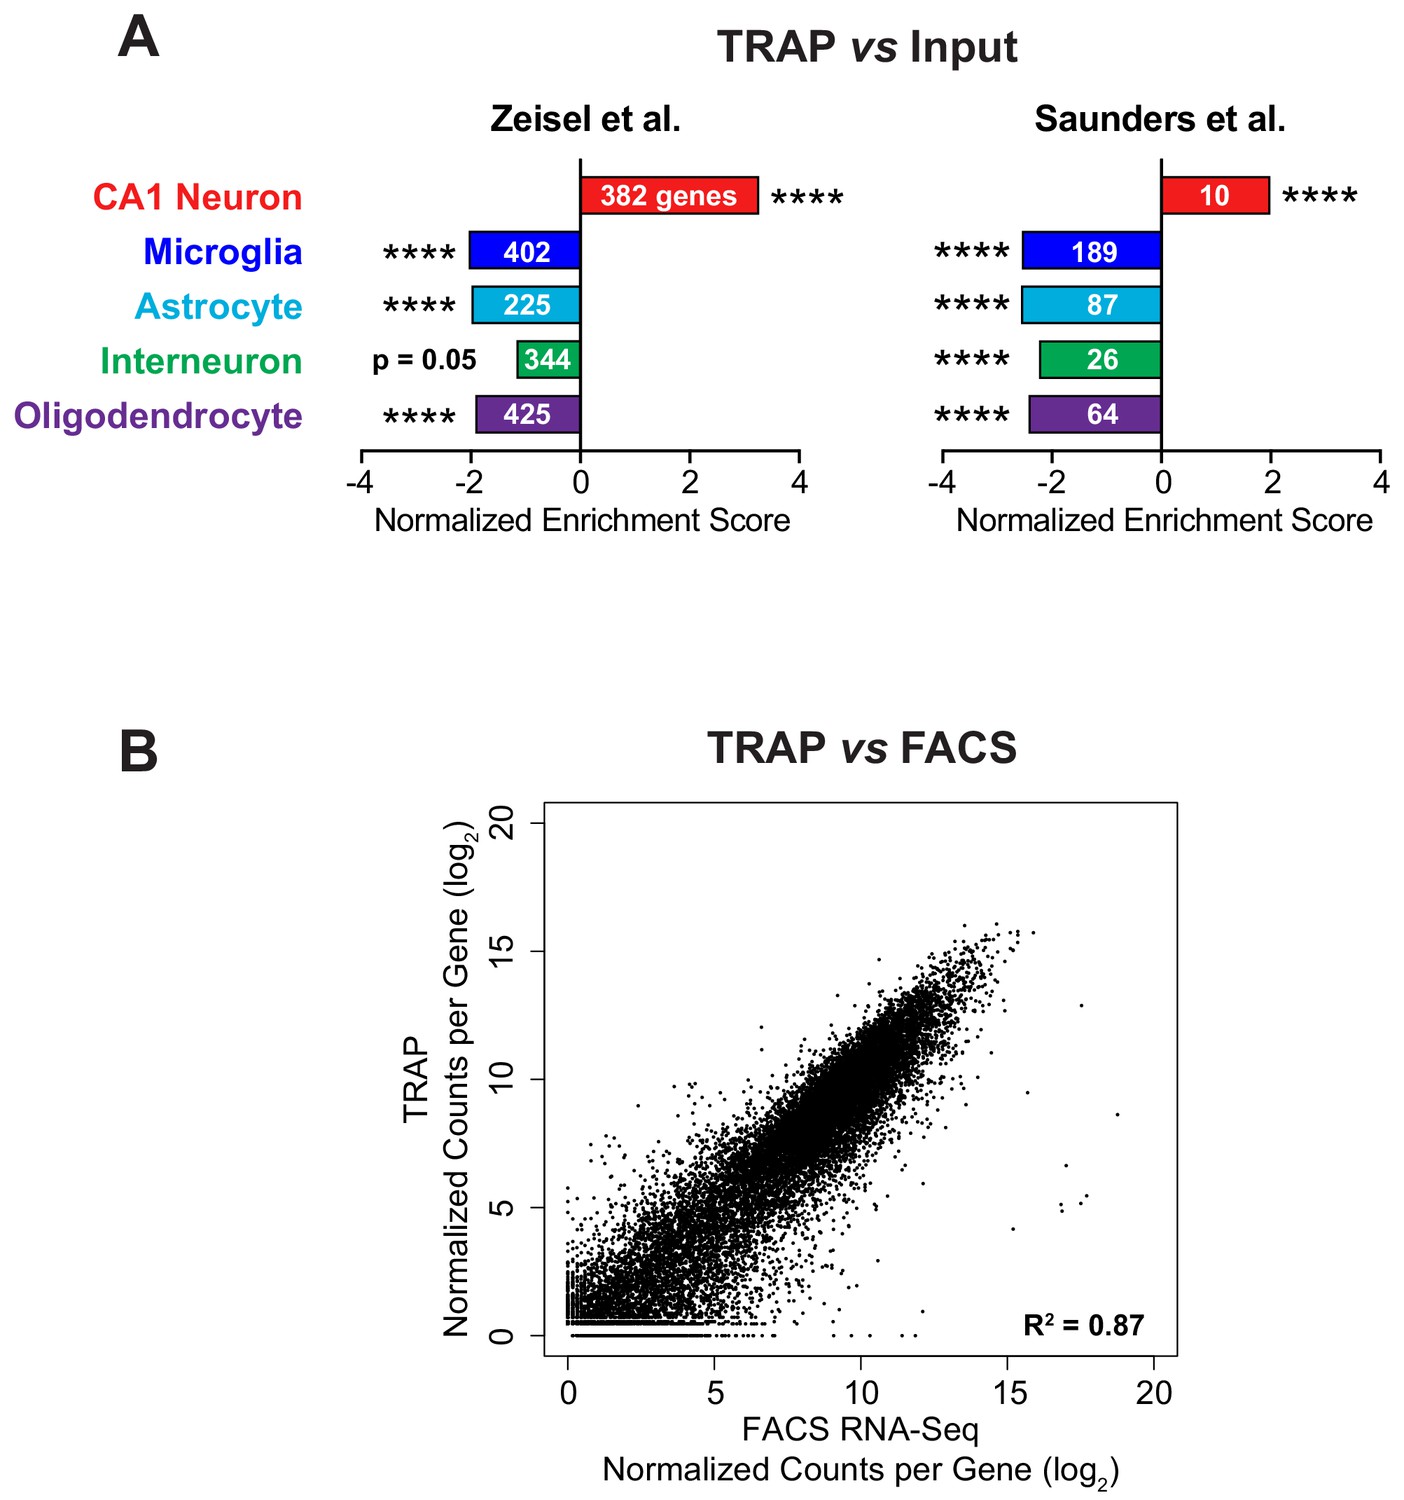
Validation of TRAP method.
(A) Enrichment and depletion of relevant cell type markers in the immunoprecipitated TRAP mRNA compared to the input mRNA was confirmed using Gene Set Enrichment Analysis (GSEA). Cell type specific markers were determined from available mouse brain single-cell RNA-Seq data (Saunders et al., 2018; Zeisel et al., 2015). The normalized enrichment score from GSEA is plotted, indicating the enrichment or depletion of the cell type markers in TRAP vs input RNA-Seq. The FDR value (estimated probability that the normalized enrichment score represents a false positive finding) is shown along with the number of genes in each gene set (**** FDR < 0.0001). (B) TRAP is comparable to RNA-Seq from FACS-isolated CA1 pyramidal neurons indicating good isolation of the entire transcriptome by TRAP. The same Camk2a-Cre mouse line was crossed with either the conditional RiboTag (TRAP) or tdTomato (FACS) mouse line. RNA-Seq from TRAP was compared with RNA-Seq from sorted tdTomato-positive cells. Normalized counts per gene from three biological replicates of both experiments are well correlated (Pearson correlation, R2 = 0.87).
Figure 2—figure supplement 3
Identification of FMRP targets and comparison with other published data and cell types.
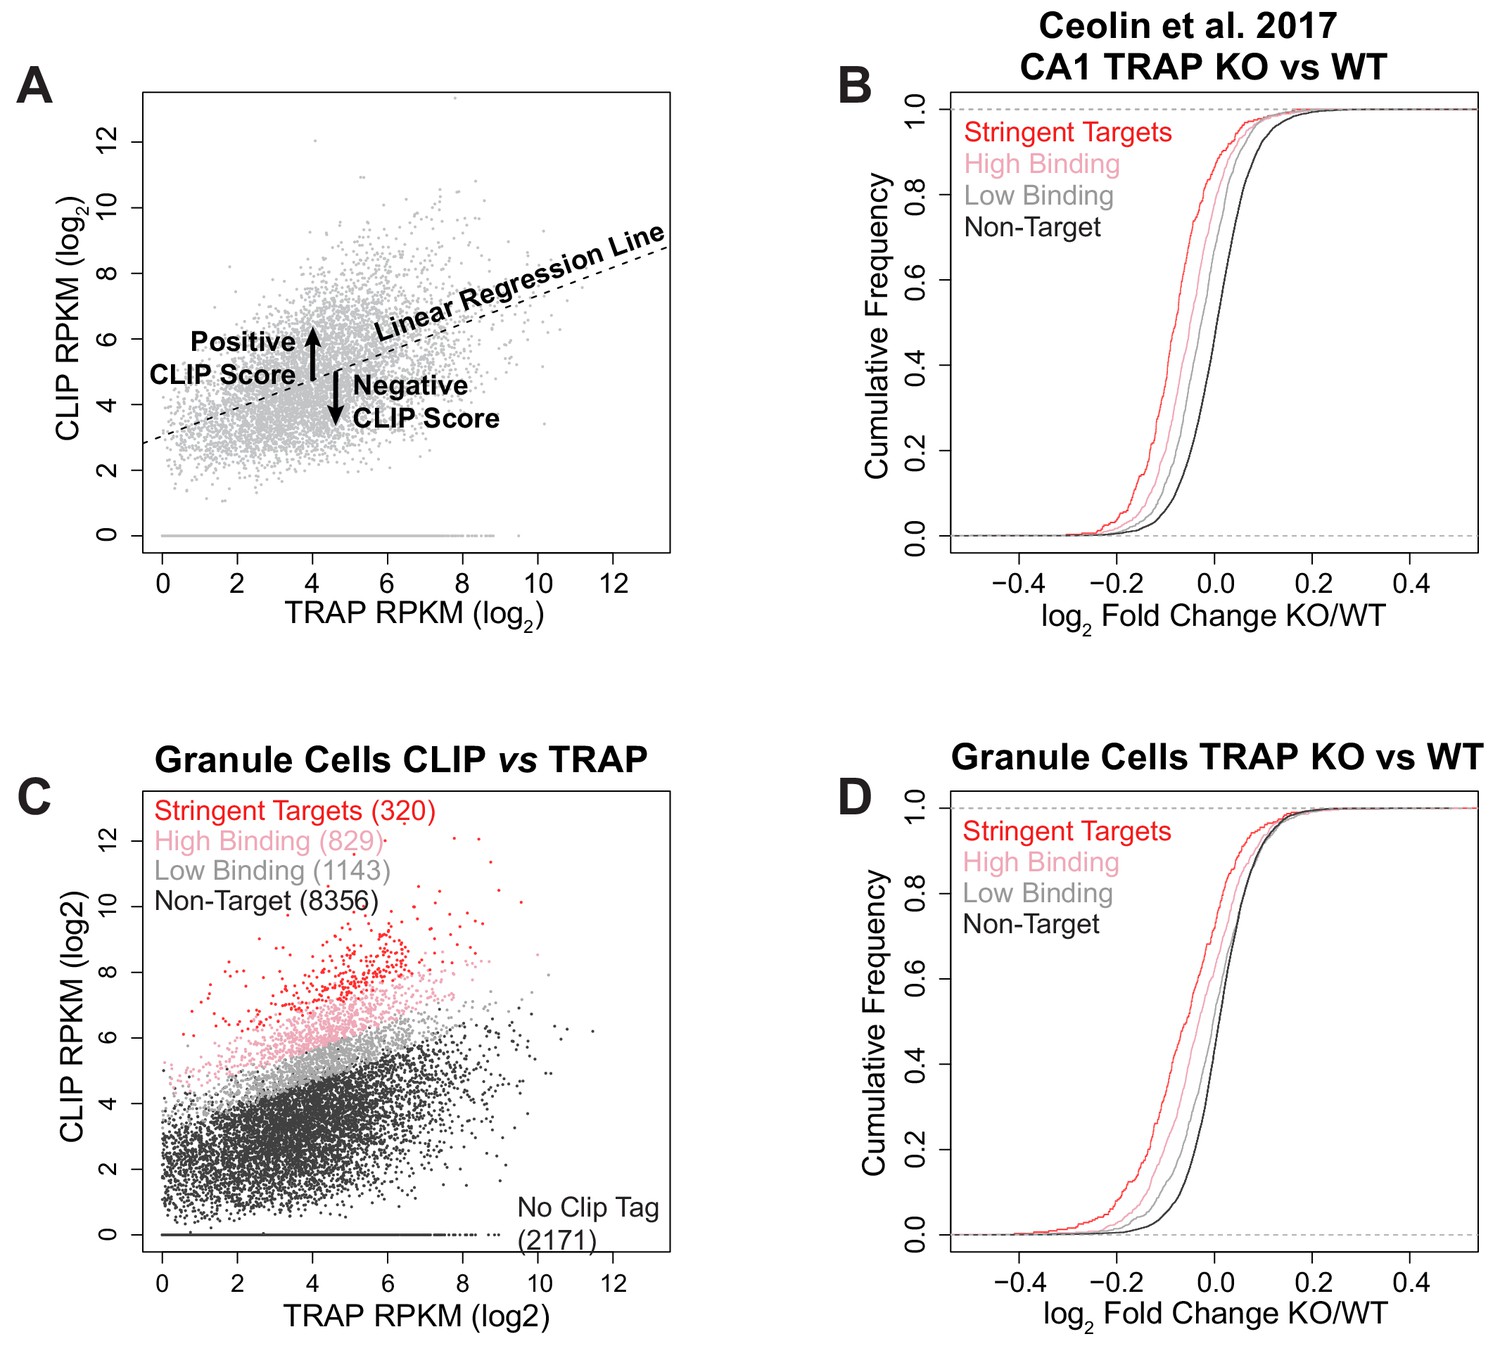
(A) Illustration of the CLIP score metric. For each biological replicate of CLIP, the density of CLIP tags across the coding region (log2 CLIP RPKM) of each transcript was plotted against the transcript abundance as determined by TRAP from the same cell type (log2 TRAP RPKM). A linear regression line was fitted to the data and for each transcript the vertical deviation from this line was calculated as CLIP score = [log2 CLIP RPKM – (slope of fitted line x log2 TRAP RPKM) + intercept of fitted line]. Thus, a positive CLIP score indicates a higher representation of the transcript in the CLIP data than expected for a transcript of that abundance and preferential binding of FMRP to the transcript. (B) Reanalysis of CA1 TRAP data from Fmr1 KO RiboTagWfs1-CreERT2 adult mice following tamoxifen induction published in Ceolin et al. (2017): Cumulative density function plots of the log2 fold change between Fmr1 KO TRAP and WT TRAP for each FMRP target subclass. Equivalent to Figure 2C. The results are the same as seen in our own data with FMRP targets being down-regulated in the Fmr1 KO relative to the amount of FMRP binding. (C) FMRP targets were defined for cerebellar granule cells in the same way as for CA1 neurons. Stringent targets are those with a CLIP score > 2 in every replicate, targets with high binding are those with an average CLIP score > 1 and targets with low binding are those with an average CLIP score between 0 and 1. Scatter plot of average density of CLIP reads across the coding region (CLIP RPKM) vs transcript abundance calculated as TRAP read density across the full transcript (TRAP RPKM). Targets of each subclass are highlighted in the plot and the number of genes within each subclass is indicated. Equivalent to CA1 data plotted in Figure 2B. (D) FMRP targets are also down-regulated in cerebellar granule cells similar to the effect seen in CA1 neurons. Cumulative density function plots of the log2 fold change between Fmr1 KO TRAP and WT TRAP for each FMRP target subclass in cerebellar granule cells. Equivalent to CA1 data plotted in Figure 2C.
Figure 2—figure supplement 4
Comparison of different CLIP score methods.
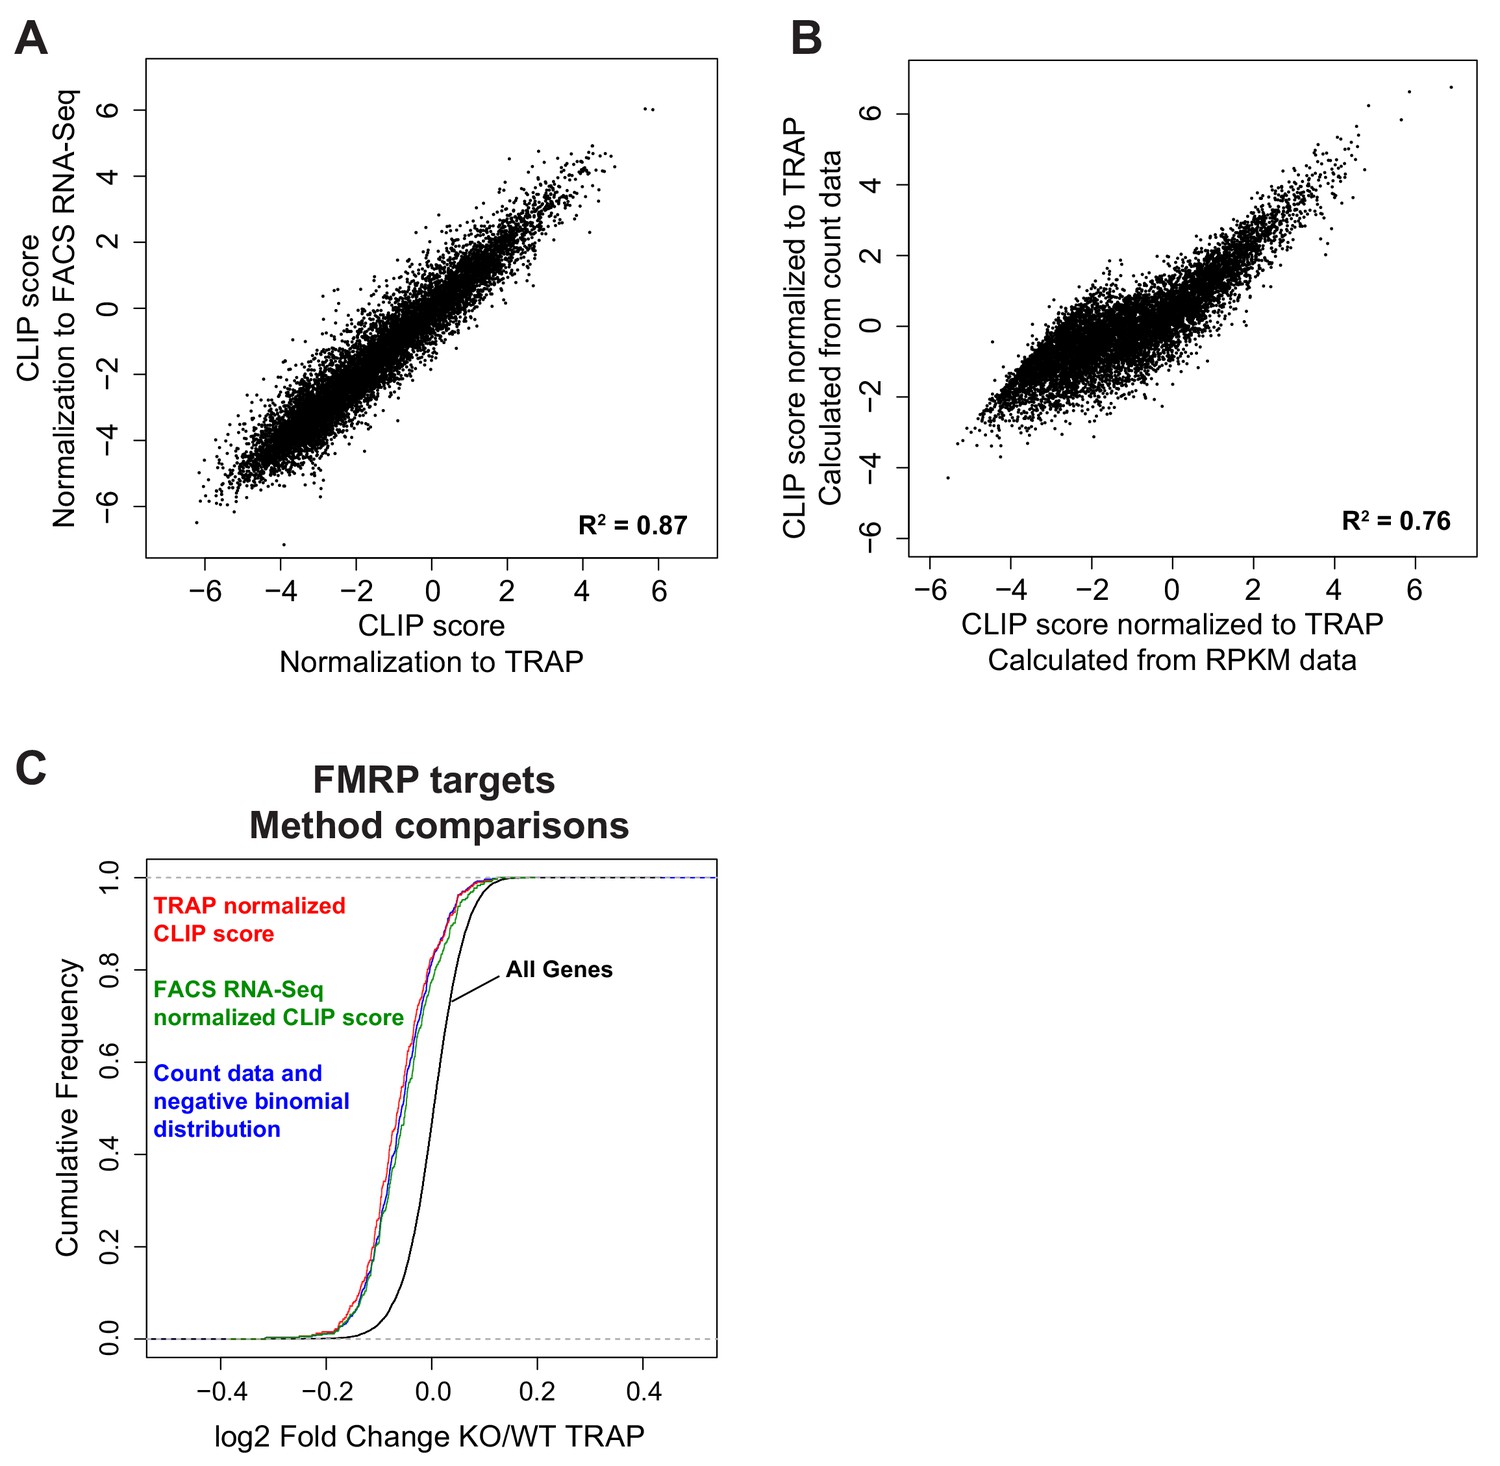
(A) CLIP score was determined either by normalization to mean TRAP RPKM per transcript or by normalization to mean FACS RNA-Seq RPKM per transcript. CLIP scores calculated with both methods were highly comparable (Pearson correlation, R2 = 0.87). (B) CLIP score was determined either by a linear regression method comparing CLIP RPKM per CDS to mean TRAP RPKM per transcript or a linear regression method comparing normalized CLIP and TRAP counts per CDS. CLIP scores calculated with both methods were highly comparable (Pearson correlation, R2 = 0.76). (C) Decrease in expression of FMRP targets in Fmr1 KO CA1 neurons is conserved across FMRP target lists generated by all analysis methods suggesting all methods are equally successful at selecting functionally relevant FMRP targets. Three methods were compared: 1) Linear model of CLIP CDS RPKM vs TRAP transcript RPKM and CLIP score determined from deviation from the fitted model (stringent targets defined as CLIP score > 2 in all three replicates), 2) Linear model of CLIP CDS RPKM vs FACS RNA-Seq transcript RPKM and CLIP score determined from deviation from the fitted model (stringent targets defined as CLIP score > 2 in all three replicates), 3) Linear model of CLIP CDS counts vs TRAP CDS counts incorporating a dispersion estimate and using a negative binomial distribution to determine significance (stringent targets defined as adjusted p-value<0.05). Number of stringent FMRP targets defined by each method was 327, 363, 441, respectively.
Figure 3 with 1 supplement
FMRP binds autism-related mRNAs and long transcripts.
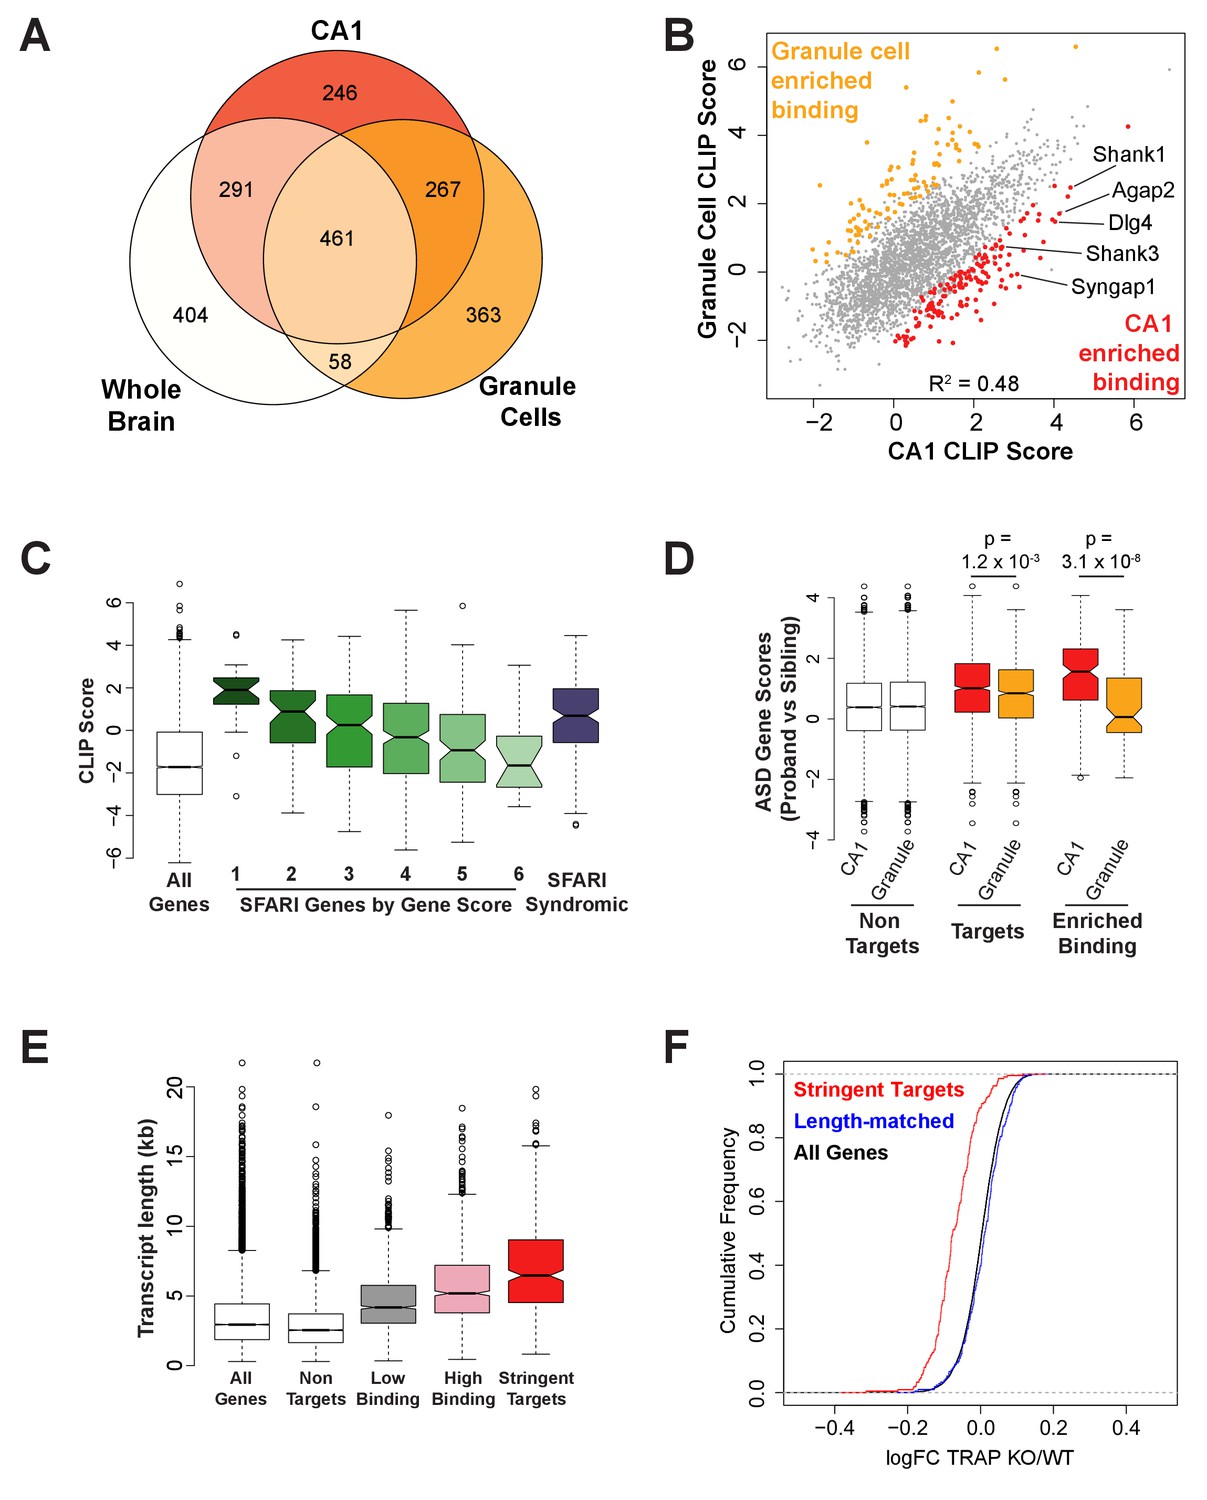
(A) Venn Diagram comparing FMRP targets in CA1 neurons to those determined from whole brain FMRP CLIP and cerebellar granule cell CLIP. Targets were defined as CLIP score >1 for CA1 and granule cells or as false discovery rate (FDR) < 0.05 and detection in at least 6 of 10 experiments for whole brain. (B) Scatter plot of FMRP CLIP score in CA1 neurons compared to FMRP CLIP score in cerebellar granule cells. Transcripts with significantly enriched binding in CA1 (p<0.05) are indicated in red. CA1-enriched targets relevant to Fragile X phenotypes are highlighted. (C) FMRP is highly associated with autism-related transcripts in CA1. SFARI genes associated with Autism Spectrum Disorders, were grouped according to their gene score where a lower gene score indicates a higher strength of the evidence linking candidate genes to ASD. Category 1: High confidence, Category 2: Strong candidate, Category 3: Suggestive evidence, Category 4: Minimal evidence, Category 5: Hypothesized but untested, Category 6: Evidence does not support a role, Syndromic: Genes predisposing to autism in the context of a syndromic disorder. Box and whisker plot of CLIP scores for genes in each class shows greatest association of FMRP with the highest confidence ASD gene candidates. Wilcoxon rank sum test for SFARI gene CLIP scores compared to CLIP scores for all CA1 expressed genes: SFARI category 1, p=8.1×10⁻¹¹, n = 25; SFARI category 2, p=5.2×10⁻¹³, n = 61, SFARI category 3, p=2.3×10⁻¹⁶, n = 184; SFARI category 4, p<2.2×10⁻¹⁶, n = 437; SFARI category 5, p=3.5×10⁻⁴, n = 170; SFARI category 6, p=0.71, n = 24; SFARI Syndromic, p<2.2×10⁻¹⁶, n = 166. (D) FMRP binding to ASD-related transcripts is enriched in CA1 neurons relative to cerebellar granule cells. ASD gene scores were determined by Network-neighborhood Differential Enrichment Analysis of de novo mutations in ASD proband versus unaffected sibling (Zhou et al., 2019) such that genes with higher gene scores are part of a network or pathway predicted to have a significant disease impact. ASD gene scores were compared across FMRP non-targets and targets determined by CA1 and granule cell CLIP. Targets were defined as CLIP score >1. ASD gene scores were also compared between transcripts with enriched binding in either CA1 neurons or cerebellar granule cells. Only transcripts expressed in both cell types were included in the analysis. p-values were calculated by Wilcoxon rank sum test. (E) FMRP preferentially associates with long transcripts. FMRP targets of all classes consist of transcripts of significantly longer than average length with the effect being greatest for the most stringent targets. Stringent targets were defined as those with a CLIP score >2 in every replicate, targets with high binding were defined as those with an average CLIP score >1, targets with low binding were defined as those with an average CLIP score between 0 and 1 and non-targets were all transcripts with a CLIP score <0. All classes of FMRP targets were significantly longer than the full transcriptome (p-value<2.2×10⁻¹⁶ for all pairwise comparisons, Wilcoxon rank sum test). (F) FMRP regulates a specific subset of long transcripts. A set of FMRP stringent targets (CLIP score > 2 in every replicate) and non-targets (CLIP score < 1) were selected that had the same distribution of transcript lengths and TRAP RPKM in the range 10–200. Cumulative density function plots of the log2 fold change between Fmr1 KO TRAP and WT TRAP for these subsets show specific regulation of the bound transcripts. Kolmogorov-Smirnov test: stringent targets vs length-matched non-targets, p-value<2.2×10⁻¹⁶.
Figure 3—figure supplement 1
Comparison of FMRP and MeCP2 targets and controls for length or expression bias.
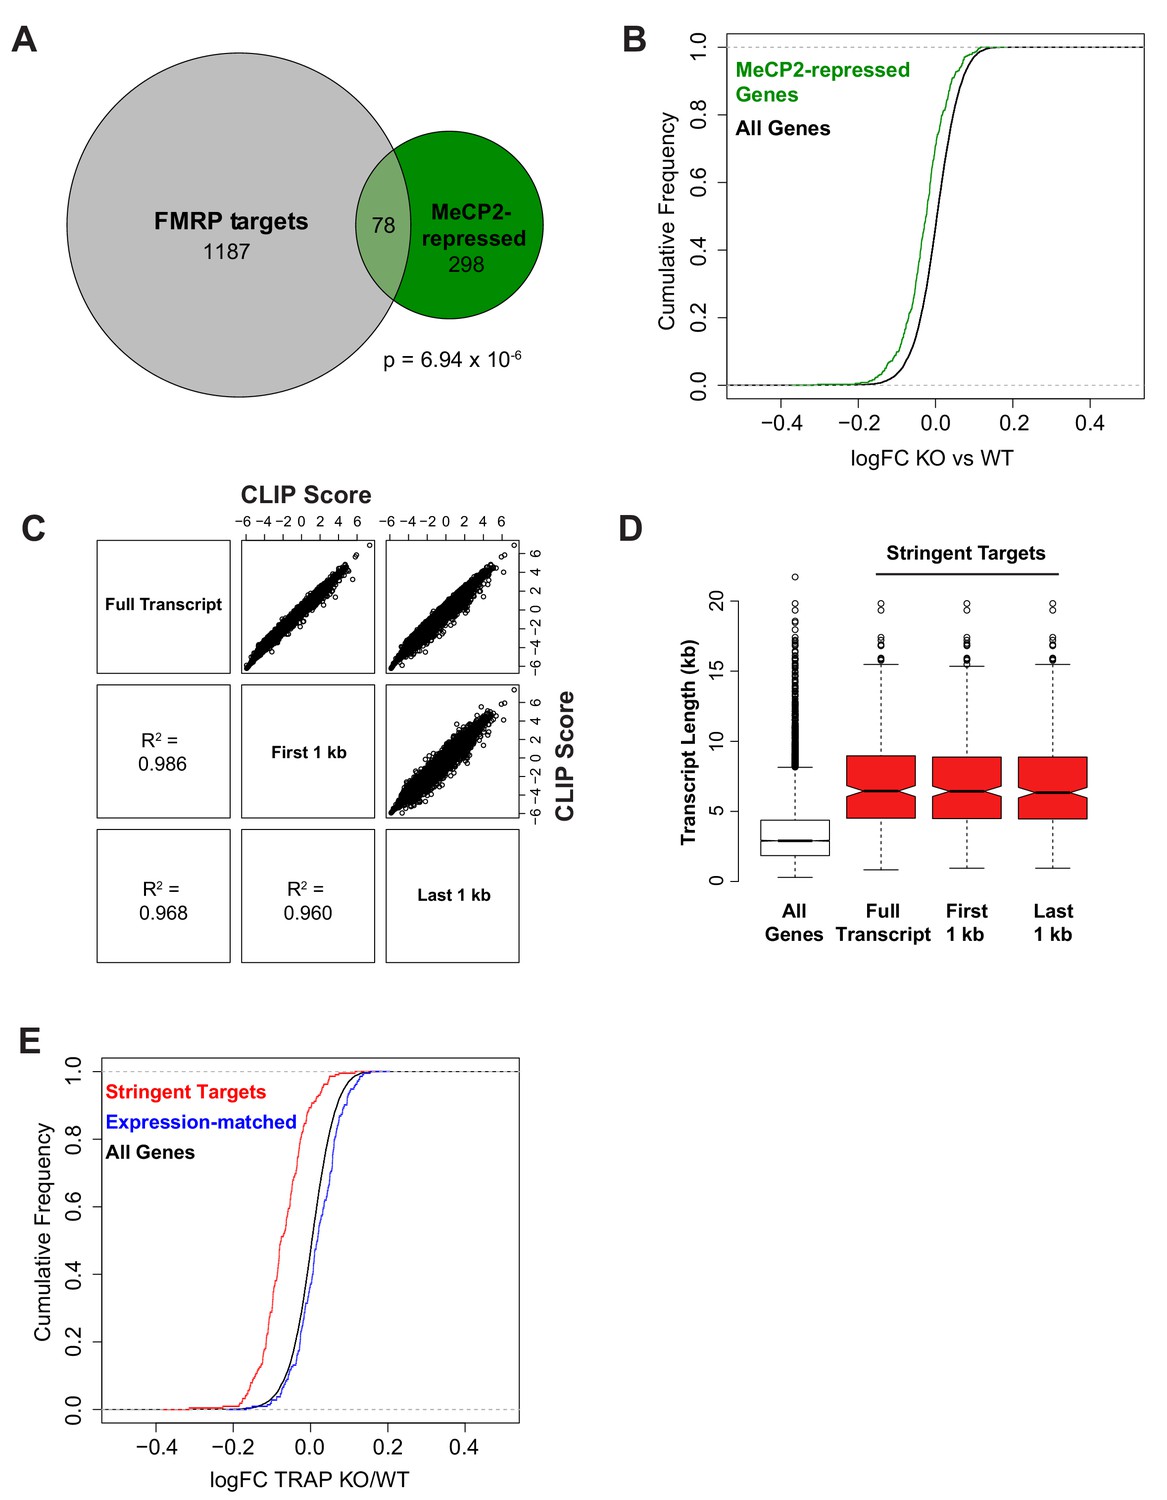
(A) Overlap of MeCP2-repressed genes (Supplementary Table 3 from Gabel et al., 2015) and CA1 FMRP targets with CLIP score > 1. Of the 466 MeCP2-repressed genes, 376 are expressed in CA1 pyramidal neurons and of those 20.7% have a CLIP score > 1 and 5.3% are stringent FMRP targets. Significance of overlap was determined by Fisher’s exact test. (B) Consistent with FMRP binding to transcripts from MeCP2-repressed genes, MeCP2-repressed genes are down-regulated in Fmr1 KO CA1 TRAP. Kolmogorov-Smirnov test, p-value<2.2×10⁻¹⁶. (C) To assess any effect of 5’ or 3’ sequencing bias in TRAP on quantification of transcript abundance and thereby FMRP binding, CLIP scores were calculated based on normalization to TRAP reads mapping to the full transcript, TRAP reads mapping only to the first 1 kb per transcript or TRAP reads mapping only to the last 1 kb per transcript. CLIP scores were highly correlated regardless of transcript region used for FMRP CLIP normalization. Pearson correlation shown for each pairwise comparison. (D) Stringent FMRP targets were defined as transcripts with CLIP score >2 in all replicates from CLIP scores calculated by normalization to TRAP reads from different transcript regions as described for panel C. In all cases, the stringent targets showed the same enrichment in long transcripts compared to all expressed genes. (E) Decrease in FMRP targets in Fmr1 KO mice is independent of transcript expression level. A set of FMRP stringent targets (CLIP score > 2 in every replicate) and non-targets (mean CLIP score < 1) were selected that had the same distribution of TRAP RPKM values. Cumulative density function plots of the log2 fold change between Fmr1 KO TRAP and WT TRAP for these subsets show specific down-regulation of the bound transcripts. Kolmogorov-Smirnov test: stringent targets vs expression-matched non-targets, p-value<2.2×10⁻¹⁶.
Figure 4 with 3 supplements
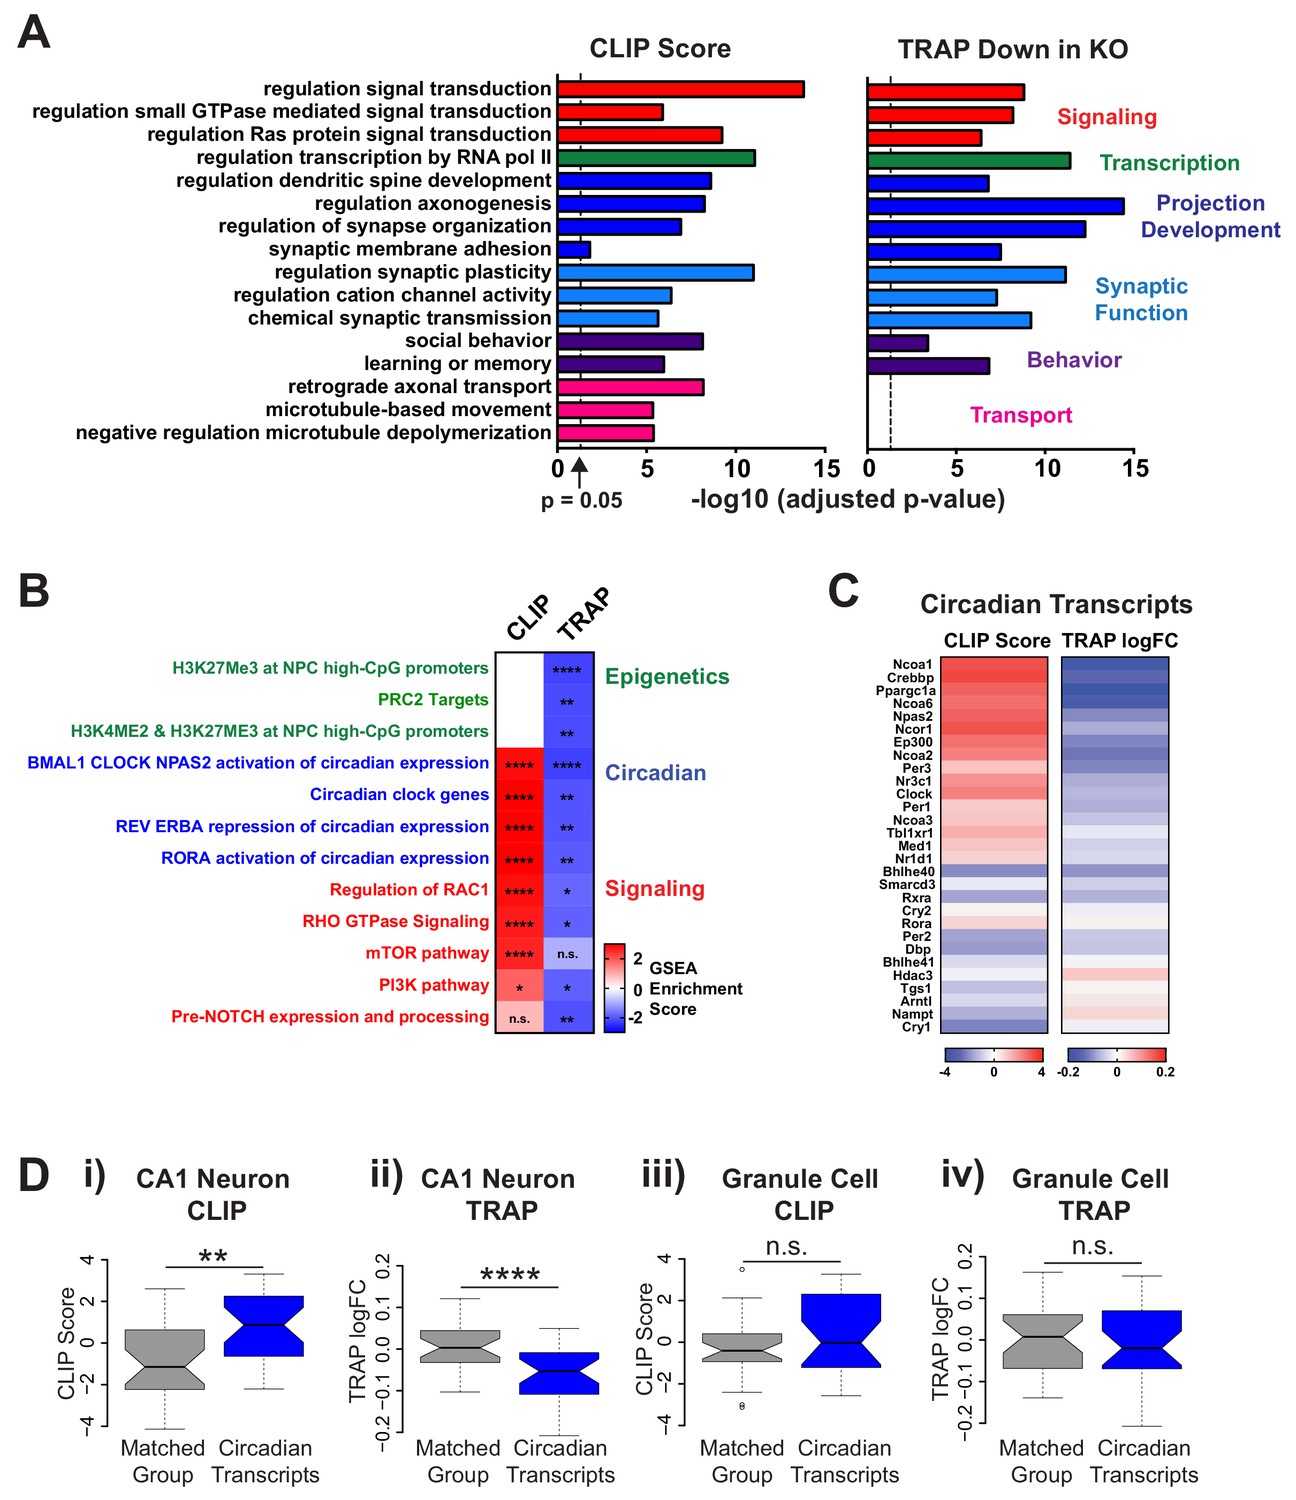
FMRP targets genes involved in neuronal function and circadian rhythm in CA1 neurons.
(A) Selected results from gene ontology analysis of CA1 transcriptome ranked by FMRP binding (CLIP Score) or negative log fold change Fmr1 KO vs WT TRAP. (B) Selected results from gene set enrichment analysis (GSEA) of the same ranked data sets. Heatmap represents normalized enrichment score (NES) with FDR values indicated (* FDR < 0.05; ** FDR < 0.01, *** FDR < 0.001, **** FDR < 0.0001, n.s. not significant). The NES reflects the degree to which a gene set is overrepresented at the top or bottom of a ranked list of genes normalized for differences in gene set sizes. (C) Heatmaps of CLIP score and log2 fold change Fmr1 KO vs WT TRAP for transcripts in the ‘BMAL1 CLOCK NPAS2 activation of circadian expression’ gene set from the Reactome database (Fabregat et al., 2018). (D) Circadian genes encode transcripts that are specifically bound and regulated by FMRP in CA1 neurons. Distribution of CLIP score (i, iii) and log2 fold change Fmr1 KO vs WT TRAP (ii, iv) for circadian genes in the ‘BMAL1 CLOCK NPAS2 activation of circadian expression’ Reactome gene set are shown relative to a set of randomly selected genes from the relevant transcriptome matched both for the number of genes represented and transcript length (Matched Group). Data are show for CA1 neurons (i, ii) and cerebellar granule cells (iii, iv). P-values were calculated using the Wilcoxon rank sum test (**p<0.01, ****p<0.0001, n.s. not significant).
Figure 4—figure supplement 1
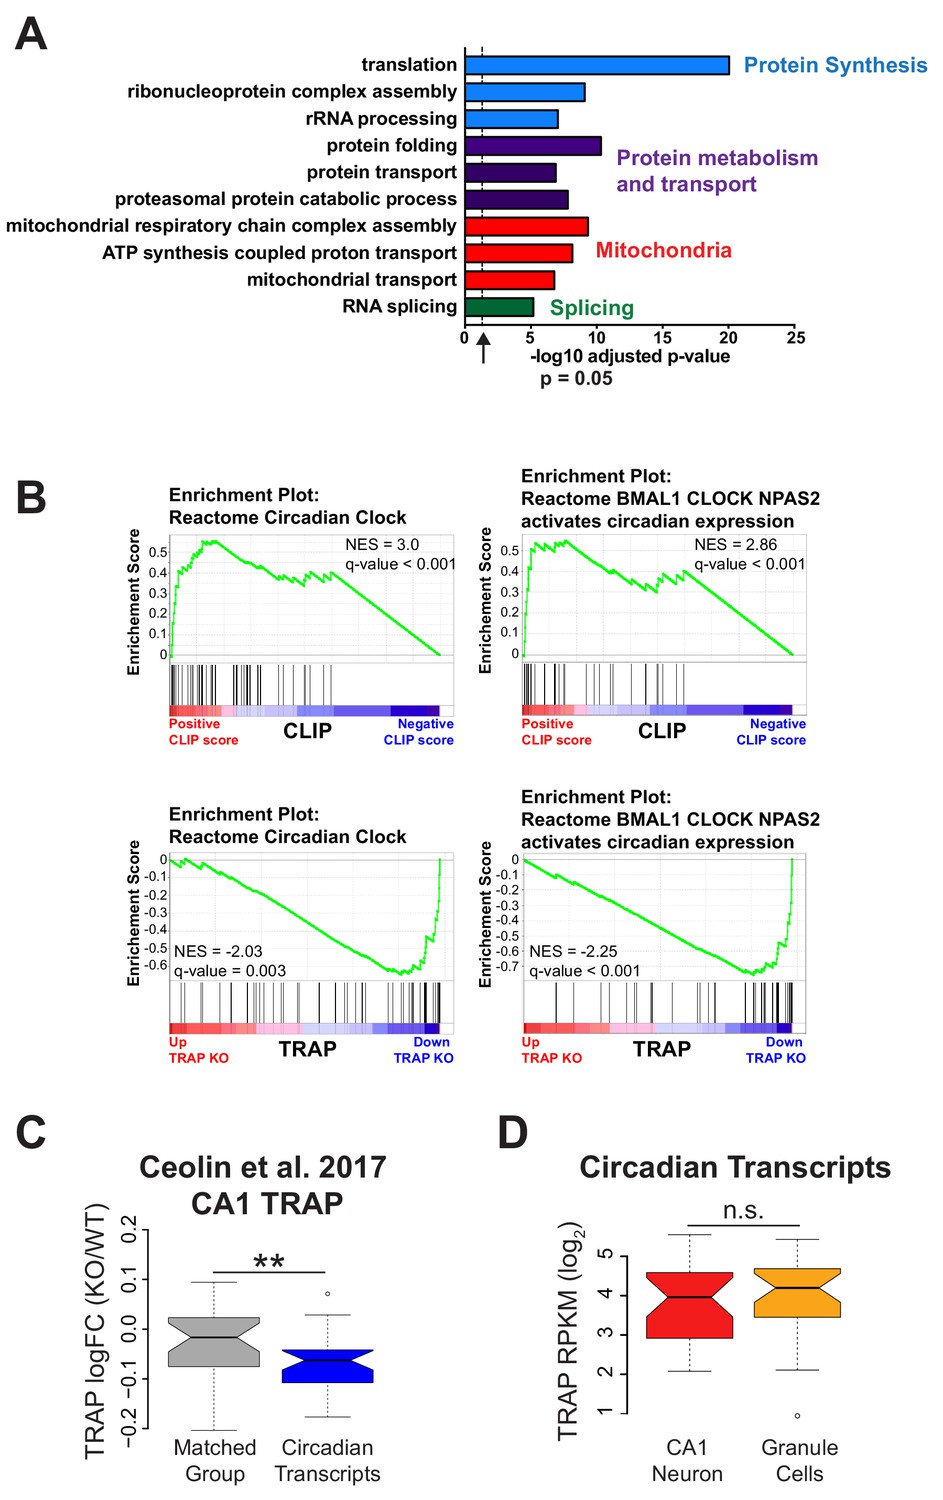
Genes related to protein synthesis and metabolism and mitochondrial function are up-regulated and circadian genes are down-regulated in Fmr1 KO CA1 neurons.
(A) Selected results from gene ontology analysis of up-regulated genes in Fmr1 KO vs WT TRAP showing up-regulation of genes involved in protein synthesis and metabolism, mitochondrial function and RNA splicing. (B) GSEA enrichment plots related to Figure 4B showing that genes in the ‘Circadian Clock’ and the ‘BMAL1 CLOCK NPAS2 activates circadian expression’ gene sets from the Reactome database are enriched for FMRP binding and down-regulated in the Fmr1 KO. Normalized enrichment score (NES) reflects the degree to which a gene set is overrepresented at the top or bottom of a ranked list of genes normalized for differences in gene set sizes and the q-value (false discovery rate) is the estimated probability that a gene set with a given NES represents a false positive finding. Black lines represent the position within the ranked list of each gene in the gene set. (C) Reanalysis of data published in Ceolin et al. (2017): distribution of log2 fold change Fmr1 KO vs WT TRAP. Circadian genes in the ‘BMAL1 CLOCK NPAS2 activation of circadian expression’ gene set from the Reactome database are shown relative to a set of randomly selected genes matched both for the number of genes represented and transcript length (Matched Group). Equivalent to Figure 4D(ii). The results are the same as seen in our own data with circadian genes down-regulated in the Fmr1 KO CA1 neurons. P-value calculated using Wilcoxon rank sum test (p=0.0087). (D) Expression of circadian genes is similar in CA1 neurons and cerebellar granule cells. Expression of circadian genes in the ‘BMAL1 CLOCK NPAS2 activation of circadian expression’ Reactome gene set was calculated from TRAP data in CA1 neurons and cerebellar granule cells from WT animals. One gene, Npas2, is expressed only in CA1 neurons and was removed from the analysis. P-value was calculated using the Wilcoxon rank sum test (p=0.4393, not significant (n.s.)).
Figure 4—figure supplement 2
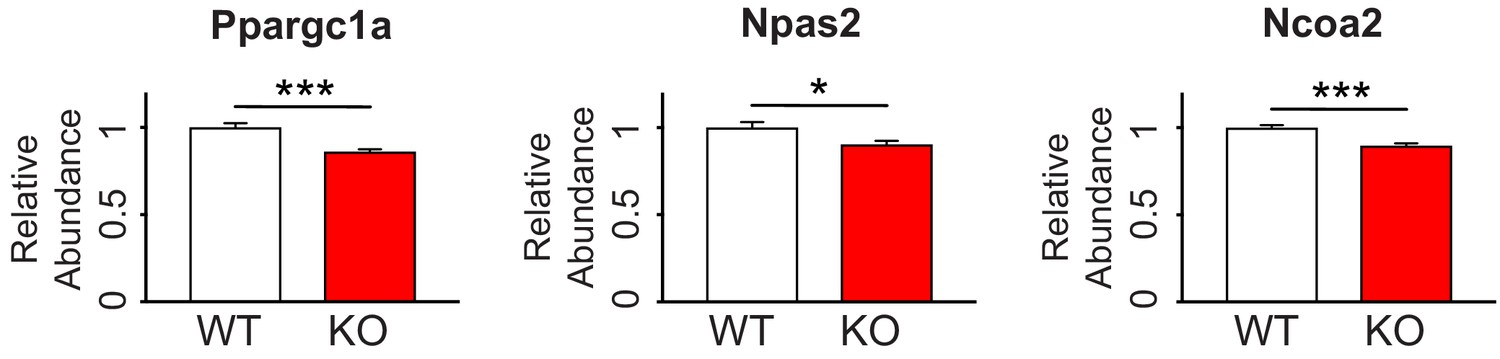
Circadian-relevant FMRP targets are down-regulated by quantitative PCR in Fmr1 KO mouse hippocampus.
RNA levels of the FMRP targets Ppargc1a, Npas2 and Ncoa2 are decreased in hippocampal tissue from Fmr1 KO mice relative to WT confirming TRAP results. Data is from 8 WT mice and 9 Fmr1 KO littermates. Data was normalized to Gapdh, Actin and Hprt housekeeping genes. Mean ± SEM is shown. p-values calculated using Student’s t-test (*p<0.05, ***p<0.001).
Figure 4—figure supplement 3

Loss of FMRP disrupts CA1 circadian oscillations in gene expression.
Fmr1 KO mice and WT littermates were euthanized at different times across the circadian cycle. Quantitative PCR was used to determine RNA abundance from CA1 tissue for four circadian transcripts that oscillate within hippocampus (A-D), a non-circadian FMRP target (E) and a non-circadian CA1 transcript that is not regulated by FMRP (F). Mean ± SEM is shown. Data was analyzed by two-way ANOVA (genotype x time) followed by post hoc Bonferroni’s multiple comparison test to compare genotypes at individual time points (*p<0.05, **p<0.01, ****p<0.0001)].
Figure 5
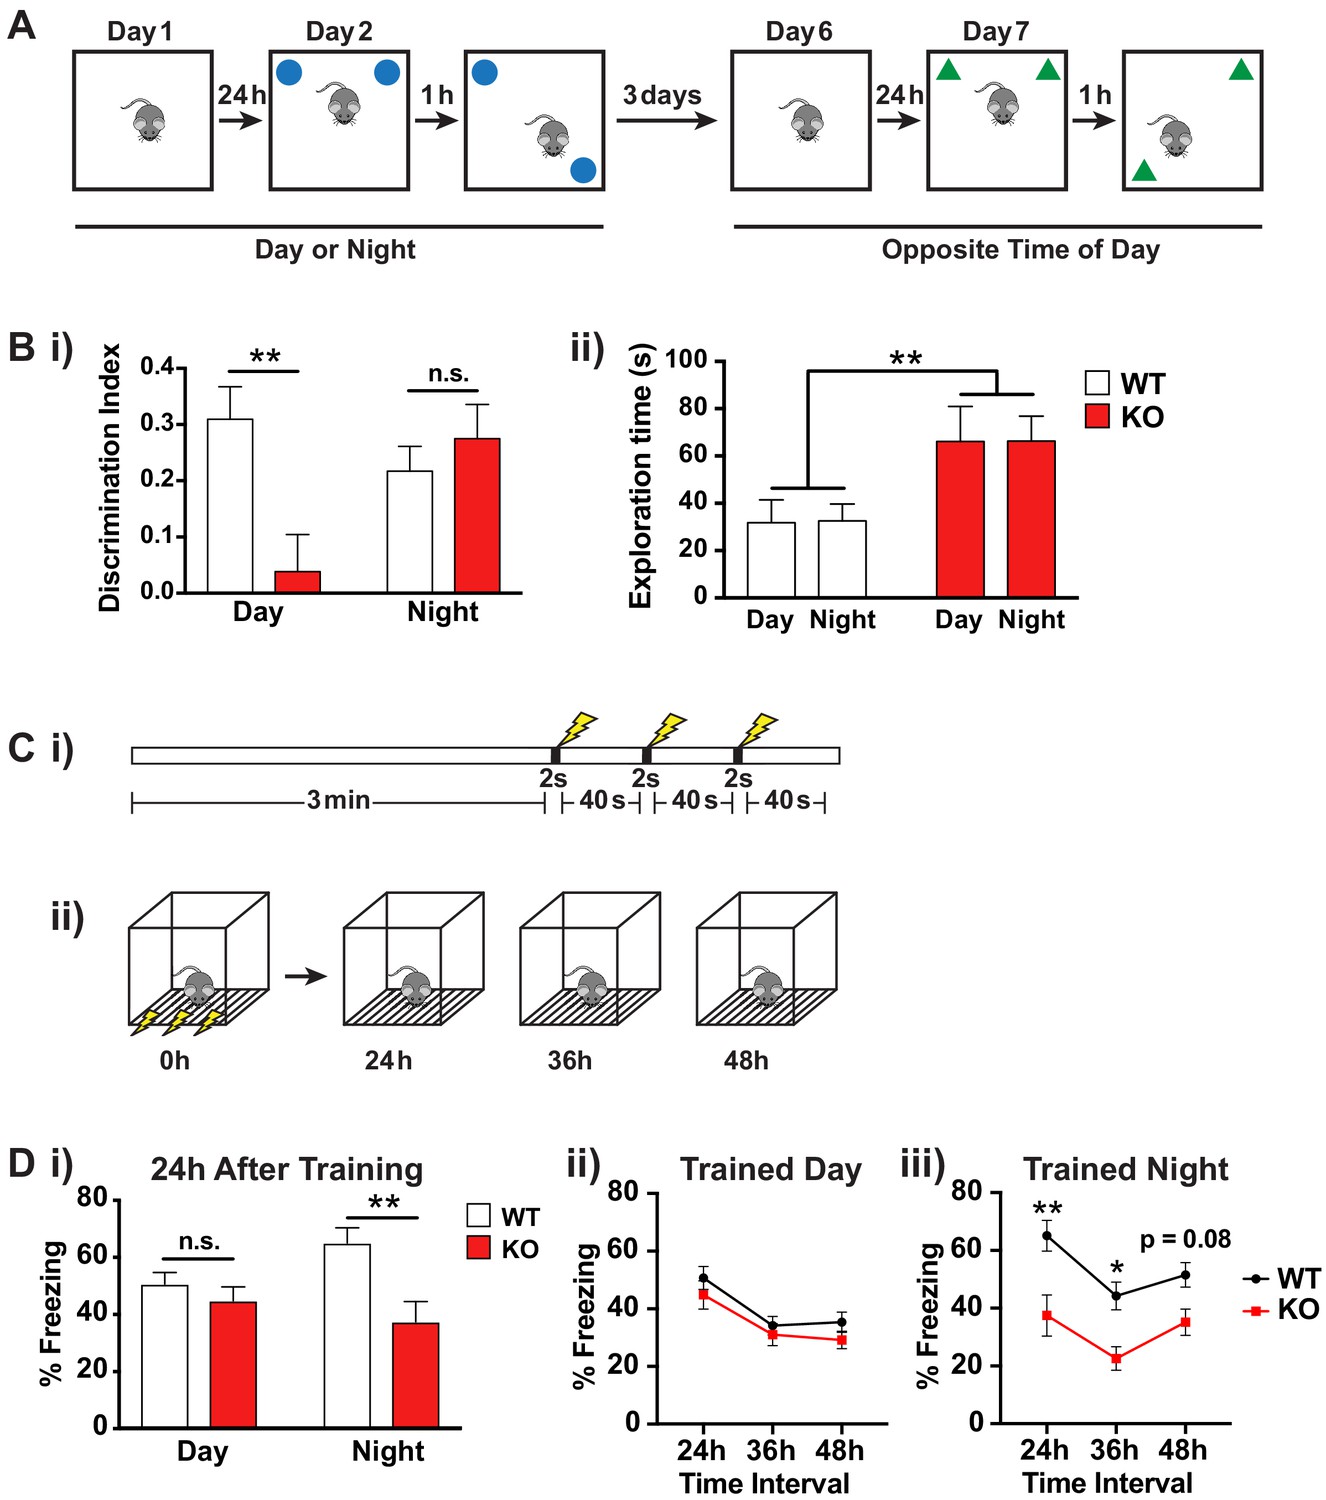
Fmr1 KO mice memory deficits are dependent on time of day.
(A) Schematic of spatial object recognition task. All mice were tested once during the day (9am – 11am) and once during the night (9pm – 11pm). Half of the cohort were tested first during the day and then at night and the other half were tested first at night and then during the day. On day one mice were habituated to the testing arena and allowed to explore for 10 min before being returned to their home cage. On day 2 the mice were presented with two identical objects placed at the NE and NW corners of the arena and allowed to explore for 10 min (sample phase). After a delay of 1 hr the mice were returned to the arena which contained the same two objects but where one of the objects had been moved to the opposite corner of the arena and allowed to explore for 10 min (choice phase). The amount of time the mice spent with the displaced object relative to the unmoved object was scored. This process was repeated after a delay of 3 days at the opposite time of day using a different set of objects. (B) Results of spatial object recognition task. (i) Discrimination index was calculated as (time spent with displaced object – time spent with unmoved object)/ (time spent with displaced object + time spent with unmoved object). A significant positive value indicates a preference for the displaced objects and an effective memory of the original object positions. A specific deficit in spatial memory was observed for Fmr1 KO mice during the day but not at night (One sample t-test vs theoretical 0 mean: WT day p=0.0004, KO day p=0.57, WT night p=0.0012, KO night p=0.0015). Two-way ANOVA showed significant interaction between genotype and time of day (F(1,35) = 7.906, p=0.008, n = 10 mice per genotype). Post hoc Bonferroni’s multiple comparison test was used to compare genotypes at each time of day (**p<0.01, n.s. not significant). (ii) Fmr1 KO mice spent significantly more time exploring the objects than their WT littermates but this effect was independent of the time of day. Two-way ANOVA (genotype x time) showed significant effect of genotype (F(1,36) = 9.729, p=0.0036, n = 10 mice per genotype). (C) Schematic of contextual fear conditioning task. (i) Mice were placed in a novel context and allowed to explore for 3 min before being subjected to three 2 s 0.4mA shocks at 40 s intervals. (ii) 24, 36 and 48 hr after the initial training session the mice were returned to the context and the amount of freezing over a 5 min period was recorded. Mice were returned to their home cages between sessions. (D) Results of contextual fear conditioning task. (i) Fmr1 KO mice showed significantly reduced freezing behavior compared to WT littermates when tested 24 hr after training only when trained during the night. Two-way ANOVA (genotype x time of training) showed significant main effect of genotype (F(1,40) = 9.890, p=0.0031, n = 8–10 mice per genotype) and a significant interaction between genotype and time of day (F(1,40) = 4.150, p=0.048). Post hoc Bonferroni’s multiple comparison test was used to compare genotypes at each time of day (**p<0.01, n.s. not significant). (ii,iii) Both genotypes showed a similar pattern of recall across the three testing sessions suggesting that the time of day of the training event rather than the time of day of recall was the main factor in the observed deficit. A significant effect of genotype was observed only when mice were trained during the night (Two-way ANOVA, main effect of genotype F(1,18) = 12.36, p=0.0025). Post hoc Bonferroni’s multiple comparison test was used to compare genotypes at each time interval (*p<0.05, **p<0.01). Mean ± SEM is shown for all graphs.
Author response image 1

Author response image 2
Tables
Key resources table
| Reagent type (species) or resource | Designation | Source or reference | Identifiers | Additional information |
|---|---|---|---|---|
| Strain (M. musculus),strain background (C57BL6/J) | B6.Cg-Tg(Camk2a-cre)T29-1Stl/J | Jackson Laboratory | RRID:IMSR_JAX:005359 | Referred to as Camk2a-Cre. |
| Strain (M. musculus),strain background (C57BL6/J) | B6N.129-Rpl22tm1.1Psam/J | Jackson Laboratory | RRID:IMSR_JAX:011029 | Referred to as RiboTag. |
| Strain (M. musculus),strain background (C57BL6/J) | B6.Cg-Gt(ROSA)26Sortm14(CAG-tdTomato)Hze/J | Jackson Laboratory | RRID:IMSR_JAX:007914 | Referred to as TdTomato. |
| Strain (M. musculus),strain background (C57BL6/J) | B6.129P2-Fmr1tm1Cgr/J | Gift from W.T. Greenough. | RRID:IMSR_JAX:003025 | Referred to as Fmr1 KO. |
| Strain (M. musculus),strain background (C57BL6/J) | Neurod1-cre (RZ24-CRE) | Gift from M.E. Hatten. | ||
| Strain (M. musculus),strain background (C57BL6/J) | Fmr1-cTag | Van Driesche et al., 2019 | ||
| Antibody | NeuN, guinea pig polyclonal | Millipore | Millipore Cat# ABN90P, RRID:AB_2341095 | For IF (1:2000) |
| Antibody | GFP polyclonal antibody, rabbit | Invitrogen | Molecular Probes Cat# A-11122, RRID:AB_221569 | For IF (1:2000) |
| Antibody | Anti-FMRP antibody, rabbit polyclonal | Abcam | Abcam Cat# ab17722, RRID:AB_2278530 | For IF (1:200) |
| Antibody | Anti-HA tag, rabbit polyclonal | Abcam | Abcam Cat# ab9110, RRID:AB_307019 | For IP (20–80 µg/ml depending on Cre driver) |
| Antibody | anti-GFP antibodies HtzGFP19C8 and HtzGFP19F7, mouse monoclonal | PMID: 19013281 | Heintz Lab; Rockefeller University Cat# Htz-GFP-19C8, RRID:AB_2716737 Heintz Lab; Rockefeller University Cat# Htz-GFP-19F7, RRID:AB_2716736 | For IP (25 µg each antibody for 1.2 ml lysate prepared from 8 to 10 animals) |
| Antibody | Anti-BrdU, mouse monoclonal [IIB5] | Abcam | Abcam Cat# ab8955, RRID:AB_306886 | For IP (5 µg per pooled RT reaction) |
| Antibody | anti-p0071, guinea pig polyclonal | Progen | Progen Cat# GP71 | p0071 is also known as Pkp4. For WB (1:1000) |
| Antibody | Anti-ASCIZ, rabbit polyclonal | Millipore | Millipore Cat# AB3271, RRID:AB_11215293 | ASCIZ is also known as Atmin. For WB (1:5000) |
| Antibody | p190-A RhoGAP, rabbit polyclonal | Cell Signaling | Cell Signaling Technology Cat# 2513, RRID:AB_2232820 | p190-A RhoGAP is also known as Arhgap35. For WB (1:1000) |
| Antibody | Anti-HA tag, goat polyclonal | Abcam | Abcam Cat# ab9134, RRID:AB_307035 or Abcam Cat# ab215069, RRID:AB_2811264 | For WB (1:10,000) |
| Antibody | Anti-Ribosomal P, human polyclonal | US Biological | US Biological Cat# R2031-25A, RRID:AB_2146244 | For WB (1:10,000) |
| Software, algorithm | EthoVision tracking software | Noldus Information Technology | RRID:SCR_000441 | |
| Software, algorithm | Behavioral Observation Research Interactive Software (BORIS) | doi: 10.1111/2041-210X.12584 | ||
| Software, algorithm | FreezeFramethree software | Coulbourn Instruments | RRID:SCR_014429 | |
| Software, algorithm | STAR | PMID: 23104886 | RRID:SCR_015899 | |
| Software, algorithm | featureCounts | PMID: 24227677 | RRID:SCR_012919 | |
| Software, algorithm | DESeq2, Bioconductor | PMID: 25516281 | RRID:SCR_015687 | |
| Software, algorithm | CLIP Tool Kit (CTK) | PMID: 27797762 | ||
| Software, algorithm | RSeQC | PMID: 22743226 | RRID:SCR_005275 | |
| Software, algorithm | GenomicRanges, Bioconductor | PMID: 23950696 | RRID:SCR_000025 | |
| Software, algorithm | Limma, Bioconductor | PMID: 25605792 | RRID:SCR_010943 | |
| Software, algorithm | GOrilla | PMID: 19192299 | RRID:SCR_006848 | |
| Software, algorithm | GSEA | PMID: 16199517 | RRID:SCR_003199 | |
| Commercial assay or kit | Quant-iT RiboGreen RNA Assay Kit | ThermoFisher Scientific | Cat# R11490 | |
| Commercial assay or kit | High Pure RNA isolation kit | Roche | Cat# 11828665001 | |
| Commercial assay or kit | Ribo-Zero rRNA Removal Kit (Human/Mouse/Rat) | Illumina | Cat# MRZH11124 | |
| Commercial assay or kit | Dynabeads mRNA Purification Kit | ThermoFisher Scientific | Cat# 61006 | |
| Commercial assay or kit | TruSeq RNA library prep kit | Illumina | Cat# RS-122–2001 | |
| Commercial assay or kit | iScript cDNA Synthesis Kit | Bio-Rad | Cat# 1708891 | |
| Commercial assay or kit | FastStart SYBR Green Master | Roche | Cat# 04673484001 |
Additional files
-
Supplementary file 1
Summary of CA1 FMRP cTag CLIP read alignment.
Summary of read alignment for each replicate of FMRP cTag CA1 CLIP including Fmr1-cTagCamk2a-Cre and Fmr1-cTag negative control CLIP. The total number of reads obtained after demultiplexing and initial collapse of exact PCR duplicates is given (‘input reads for alignment’) as well as the number of these reads which uniquely mapped to the genome (‘Uniquely mapped to genome’) and transcriptome (‘Mapped within transcriptome and collapsed for PCR duplicates’). Finally, the number of reads which mapped to the positive strand of the CA1 transcriptome (as defined by CA1 TRAP rpkm > 1) is shown (‘Mapped within CA1 TRAP defined transcriptome for CLIP score determination’).
- https://cdn.elifesciences.org/articles/46919/elife-46919-supp1-v1.xlsx
-
Supplementary file 2
Summary of CA1 FMRP cTag CLIP and granule cell.
FMRP cTag CLIP data including counts per transcript, CLIP scores, FMRP target classifications and CA1 or granule cell-enriched binding. CA1 CLIP. CLIP tags that mapped within the coding region of each transcript were counted for each CLIP replicate and the final read count calculated by subtracting the number of CLIP reads in the Cre negative control from the number of CLIP reads from the Camk2a-Cre sample (CDS counts). These counts were converted to RPKM based on the length of the coding region. After normalization to abundance using TRAP RPKM per transcript as a proxy, the CLIP score for the transcript was calculated. CA1 Targets. List of transcripts classified as stringent, high binding or low-binding FMRP Targets in CA1 neurons. Stringent targets have a CLIP score > 2 in all three replicates, high binding targets have a mean CLIP score > 1 and low binding targets have a mean CLIP score between 0 and 1. Granule Cell CLIP. FMRP cTag CLIP was performed from cerebellar granule cells using Neurod1-Cre. Table of transcript information and CLIP scores is reproduced from Van Driesche et al. (2019). Granule Cell Targets. List of transcripts classified as stringent, high binding or low-binding FMRP Targets in cerebellar granule cells. Stringent targets have a CLIP score > 2 in all three replicates, high binding targets have a mean CLIP score > 1 and low binding targets have a mean CLIP score between 0 and 1. Enriched CA1. Transcripts with significantly higher binding in CA1 compared to cerebellar granule cells. Differential CLIP scores were determined using Limma. Log2 fold change and p-values are reported. Enriched Granule Cell. Transcripts with significantly higher binding in cerebellar granule cells compared to CA1 neurons. Differential CLIP scores were determined using Limma. Log2 fold change and p-values are reported.
- https://cdn.elifesciences.org/articles/46919/elife-46919-supp2-v1.xlsx
-
Supplementary file 3
Differential expression analysis of Fmr1 KO vs WT TRAP from CA1 neurons and cerebellar granule cells.
Results from Fmr1 KO vs WT TRAP. Raw counts per gene and statistics from DESeq2 analysis of differential expression between WT and KO are shown. Sawicka CA1 Fmr1 KO TRAP DESeq2. CA1 TRAP data from RiboTagCamk2a-Cre P28-P31 mice presented in this study. Ceolin CA1 Fmr1 KO TRAP DESeq2. CA1 TRAP data from RiboTagWfs1-CreERT22–6 month old mice published by Ceolin et al. (2017). Downloaded from GSE94559. Granule Fmr1 KO TRAP DESeq2. Cerebellar granule cell TRAP data from RiboTagNeurod1-Cre6–8 week mice presented in this study.
- https://cdn.elifesciences.org/articles/46919/elife-46919-supp3-v1.xlsx
-
Supplementary file 4
RT primers for CLIP Sequences for reverse transcription primers each containing a six nucleotide barcode index highlighted in red to allow pooling and multiplexing of samples for BrdU immunoprecipitation, PCR and sequencing.
- https://cdn.elifesciences.org/articles/46919/elife-46919-supp4-v1.xlsx
-
Supplementary file 5
Alternative CLIP normalization methods.
CLIP normalized to FACS RNA-Seq. CLIP scores determined from linear model using FACS RNA-Seq transcript RPKM. This table is equivalent to Supplementary file 2 CA1 CLIP but using RPKM per transcript from RNA-Seq of sorted CA1 pyramidal cells to normalize for abundance instead of TRAP. Counts and negative binomial. FMRP targets determined using a count-based method in which the FMRP CLIP read counts driven by mRNA abundance are modelled as following a negative binomial distribution. Reads from CLIP and TRAP replicates that mapped within the coding region of each transcript were counted. For CLIP the final read count was calculated by subtracting the number of CLIP reads in the Cre negative control (‘Neg CLIP CDS reads’) from the number of CLIP reads from the Camk2a-Cre sample (‘Camk2a CLIP CDS reads’). The mean TRAP counts normalized by library size across all three replicates are shown (‘mean normalized TRAP counts’). CLIP scores were derived from a linear regression model as the difference between the observed and fitted values. An estimated dispersion parameter for each CLIP count is given, along with individual p-values per replicate, combined p-value and FDR per transcript.
- https://cdn.elifesciences.org/articles/46919/elife-46919-supp5-v1.xlsx
-
Transparent reporting form
- https://cdn.elifesciences.org/articles/46919/elife-46919-transrepform-v1.docx
Download links
A two-part list of links to download the article, or parts of the article, in various formats.
Downloads (link to download the article as PDF)
Open citations (links to open the citations from this article in various online reference manager services)
Cite this article (links to download the citations from this article in formats compatible with various reference manager tools)
FMRP has a cell-type-specific role in CA1 pyramidal neurons to regulate autism-related transcripts and circadian memory
eLife 8:e46919.
https://doi.org/10.7554/eLife.46919


