Deep generative models for T cell receptor protein sequences
- University of Washington, United States
- Fred Hutchinson Cancer Research Center, United States
Figures
Figure 1 with 2 supplements
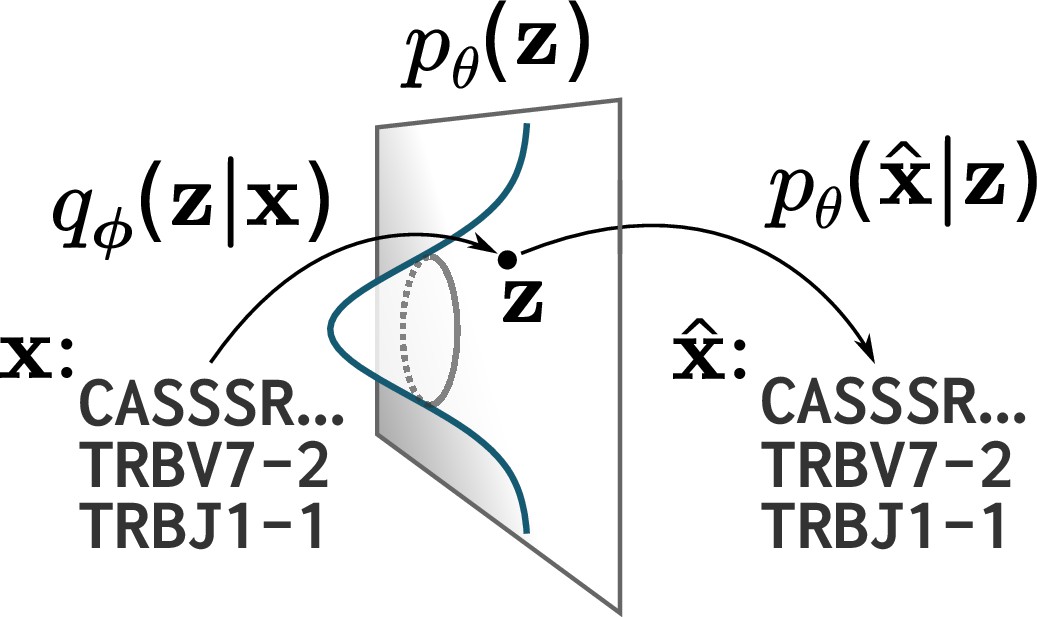
A cartoon of a variational autoencoder (VAE).
A VAE embeds objects of interest (here TCR protein sequences) into an -dimensional latent space, using a probabilistic encoder and decoder that are both parametrized by deep neural networks. The VAE objective is to encode and decode objects with high fidelity () while ensuring the encoder distribution is close to a prior on that latent space, typically taken to be a standard multivariate normal distribution.
Figure 1—figure supplement 1
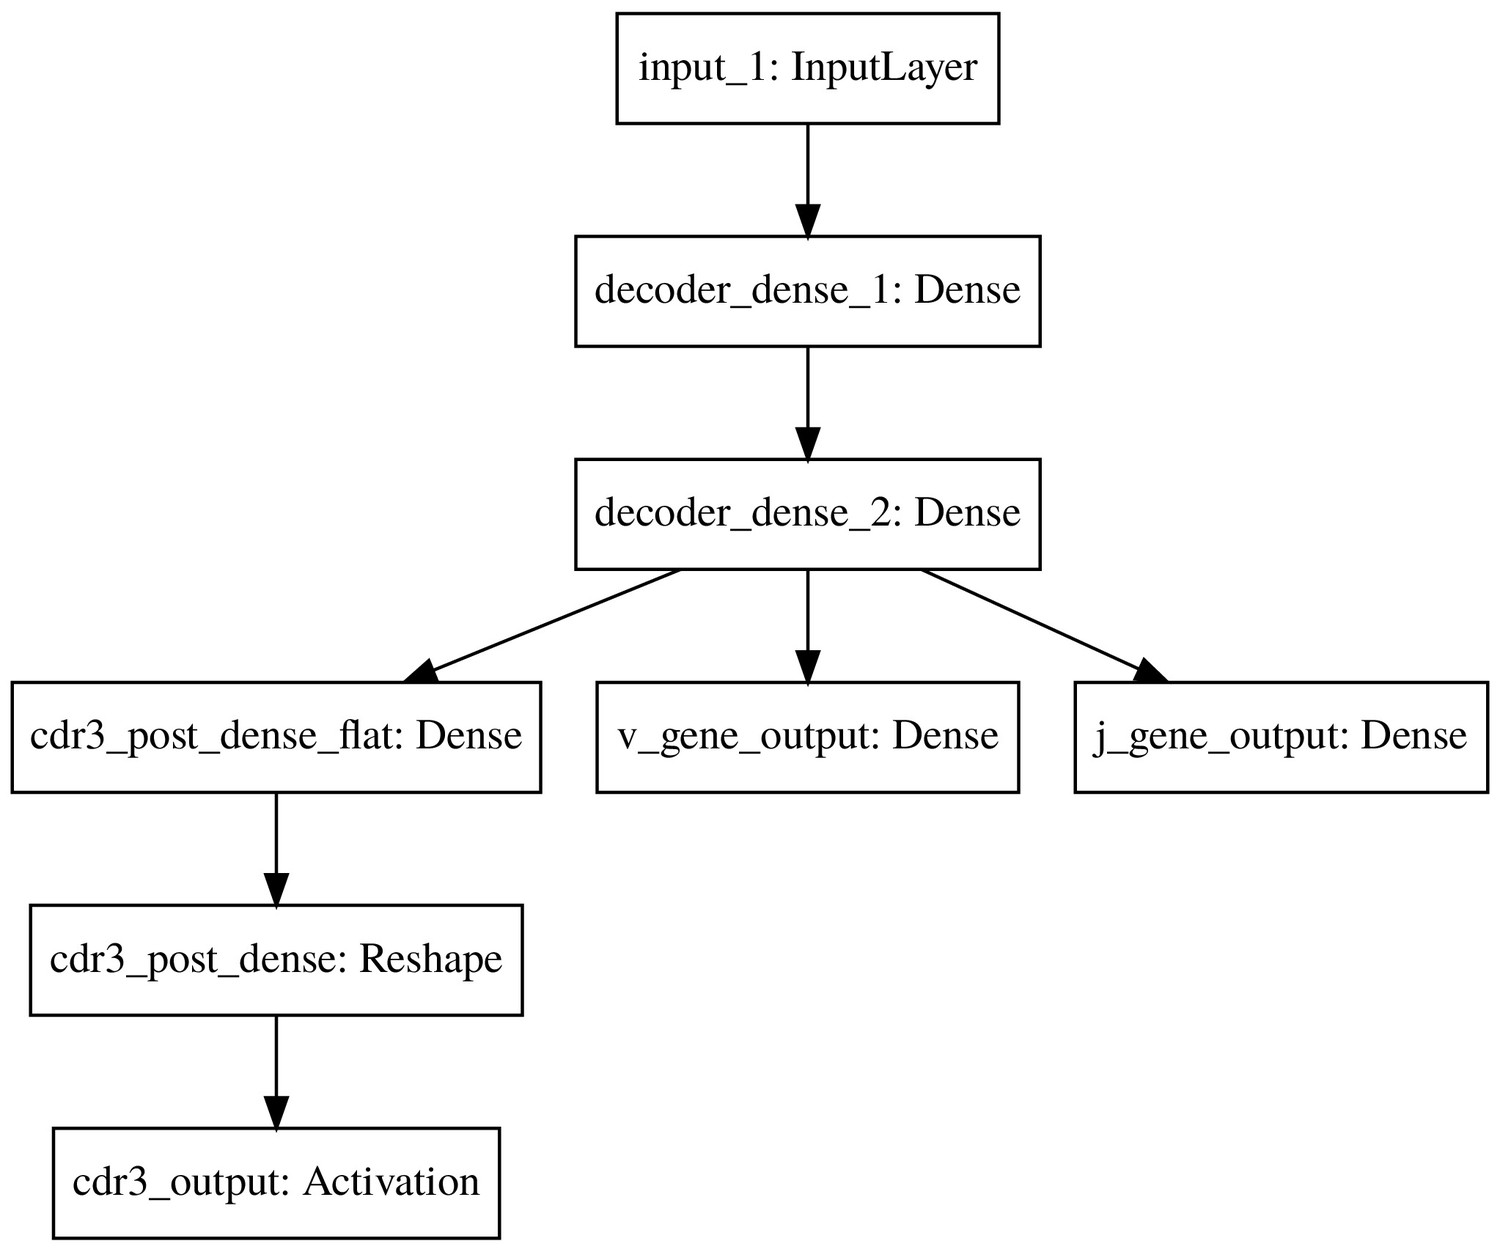
The basic model decoder.
https://doi.org/10.7554/eLife.46935.017
Figure 1—figure supplement 2
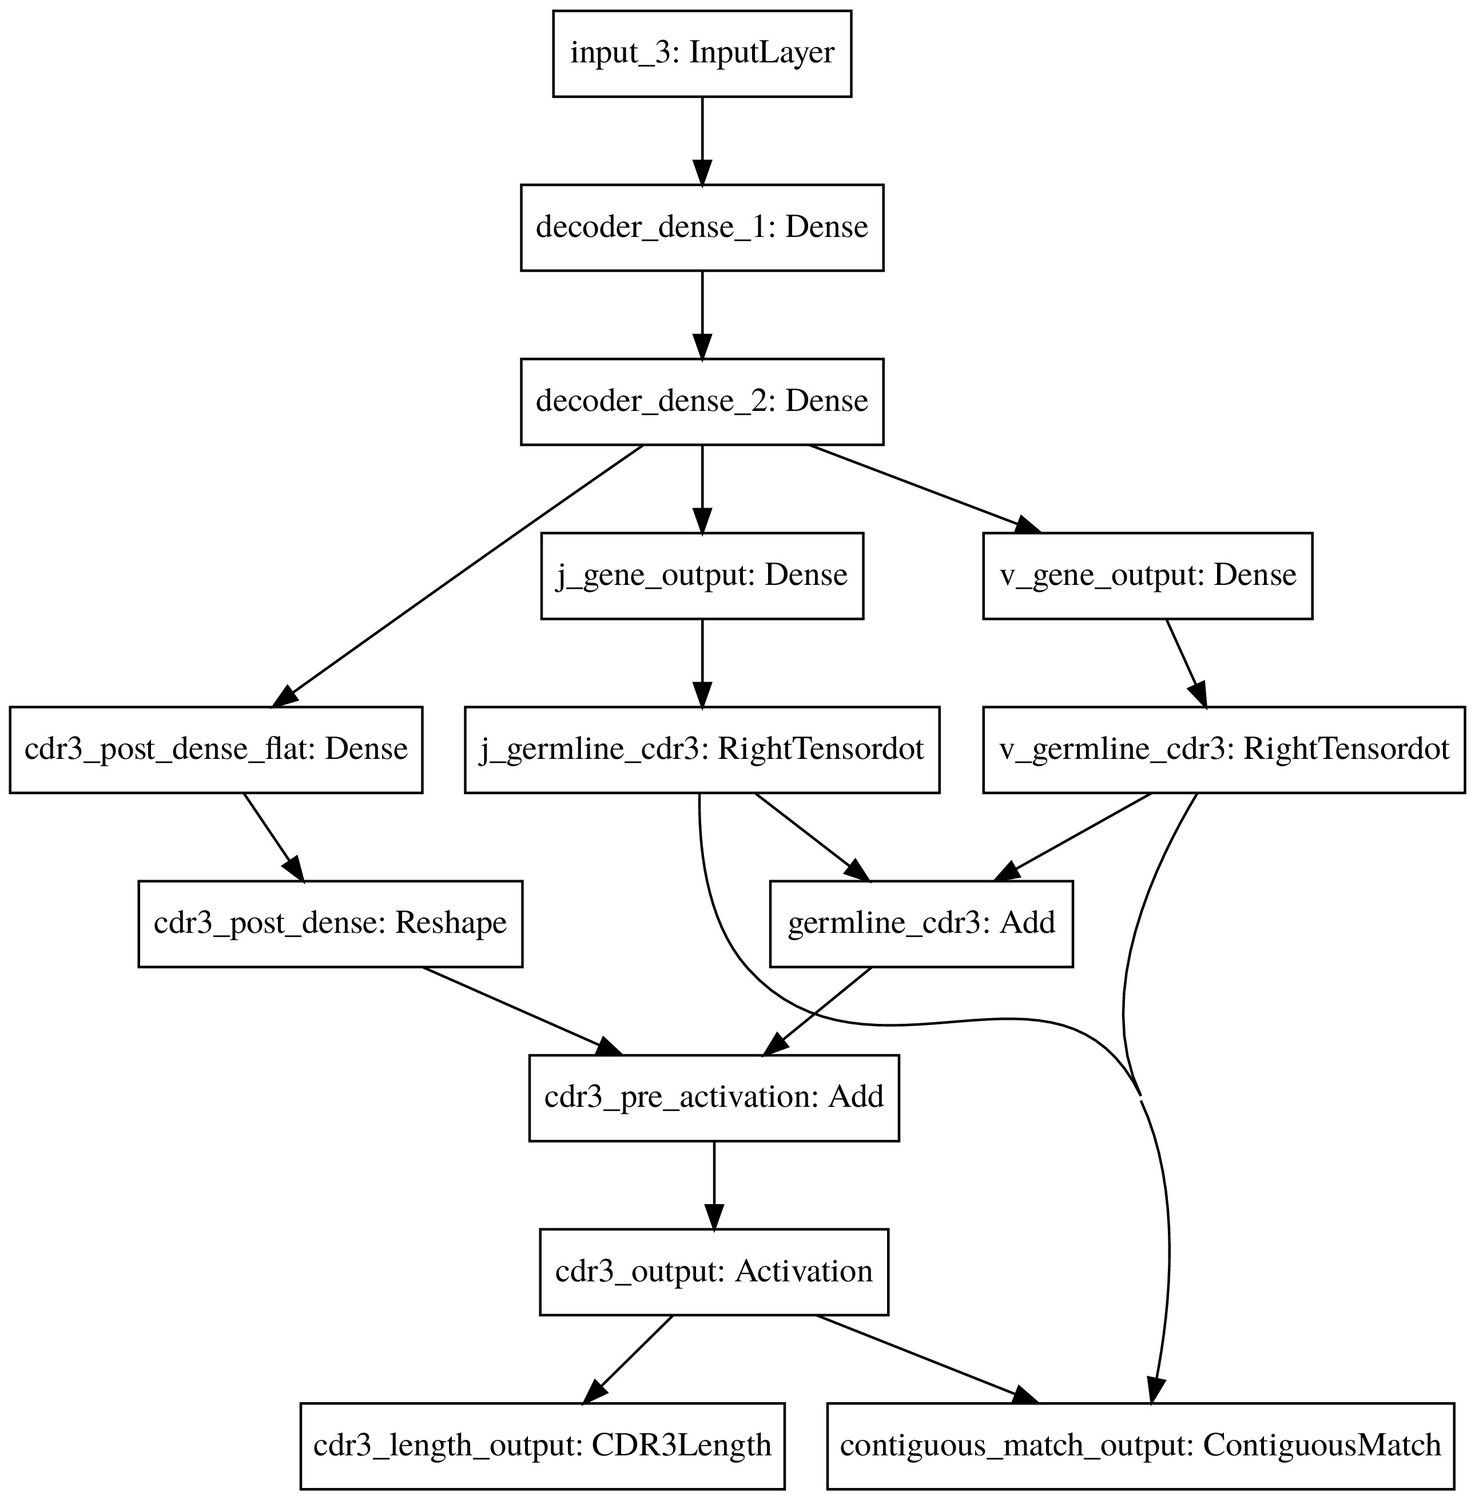
The count_match model decoder.
https://doi.org/10.7554/eLife.46935.018
Figure 2 with 1 supplement
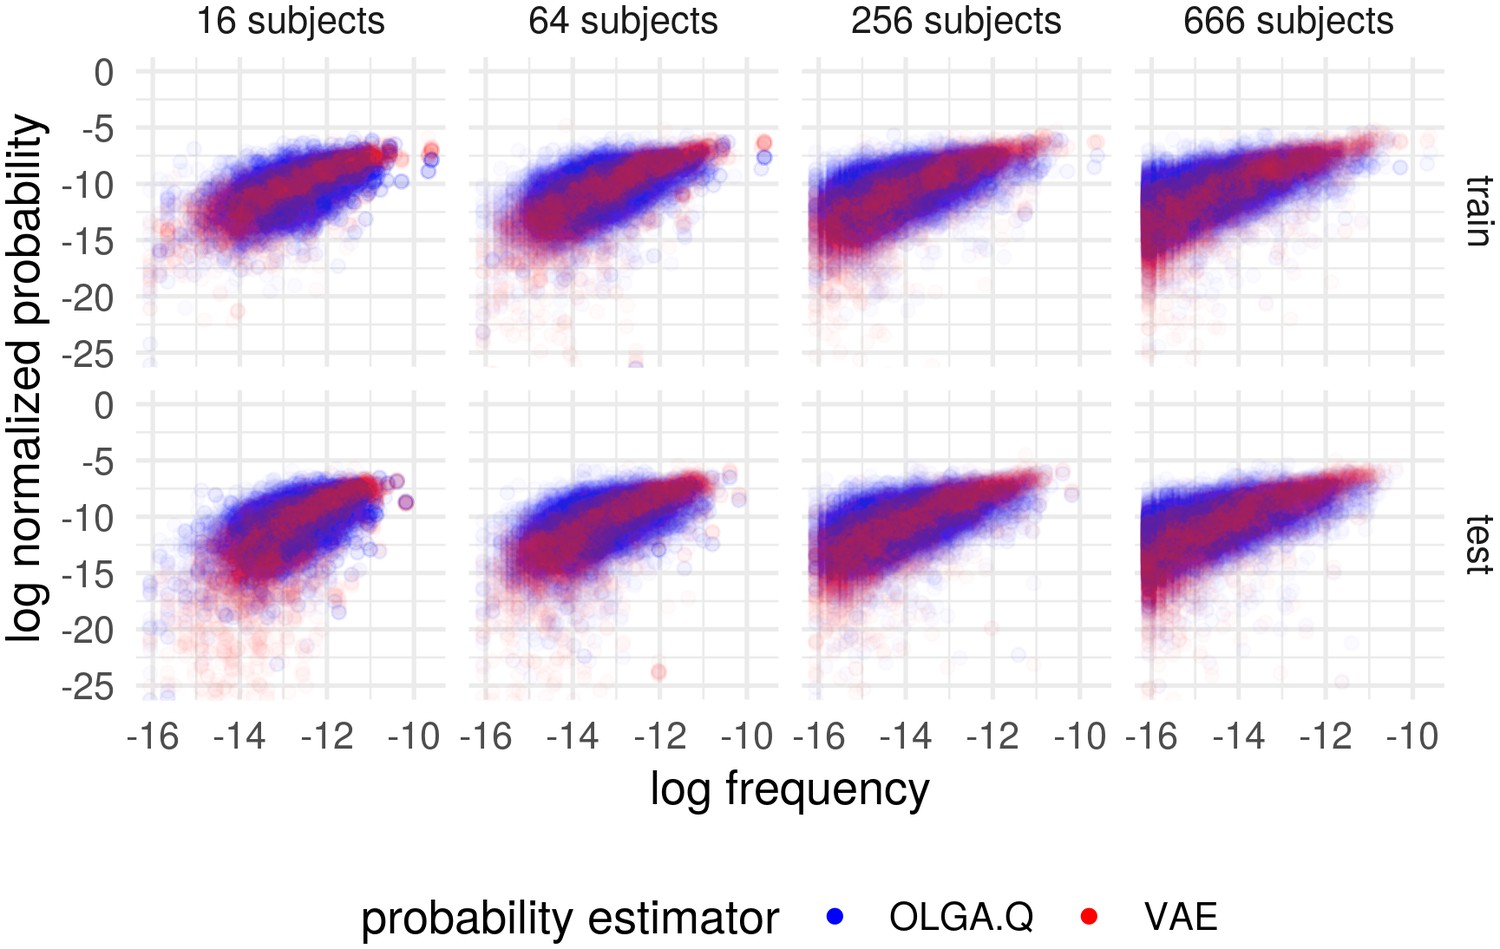
Cohort frequency prediction with two probability estimators.
Plot shows the (natural) log frequency in the entire cohort, restricted to TCRs appearing in the subset of subjects, versus the probability according to OLGA.Q and for the basic model. Results partitioned into when the TCR appeared in the training set (‘train’) and when it did not (‘test’). Probabilities for each estimator normalized to sum to one across the collection of sequences represented in the plots.
Figure 2—figure supplement 1
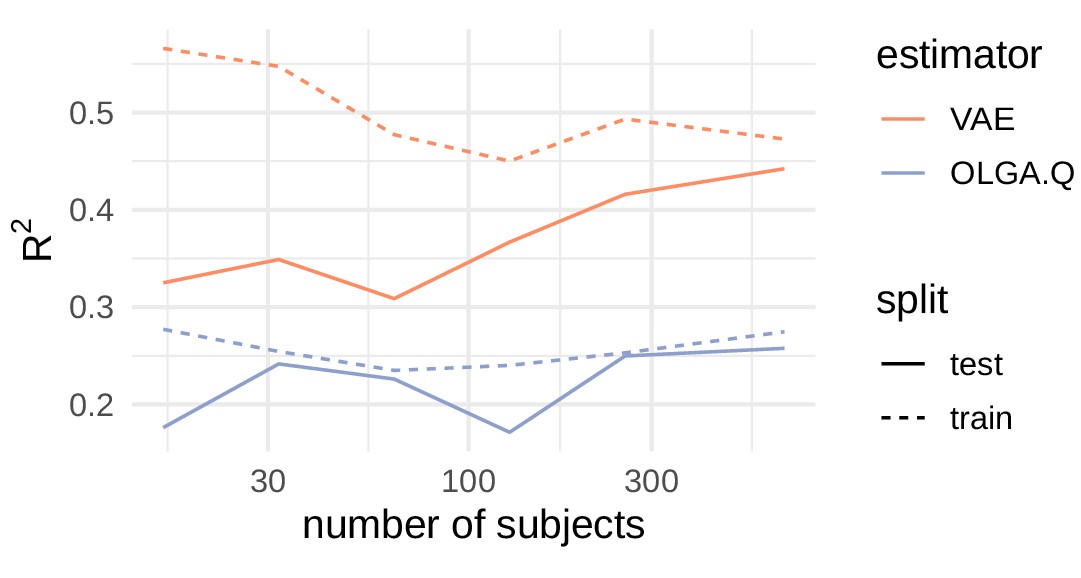
Comparison of R2 values for cohort frequency estimation.
https://doi.org/10.7554/eLife.46935.003
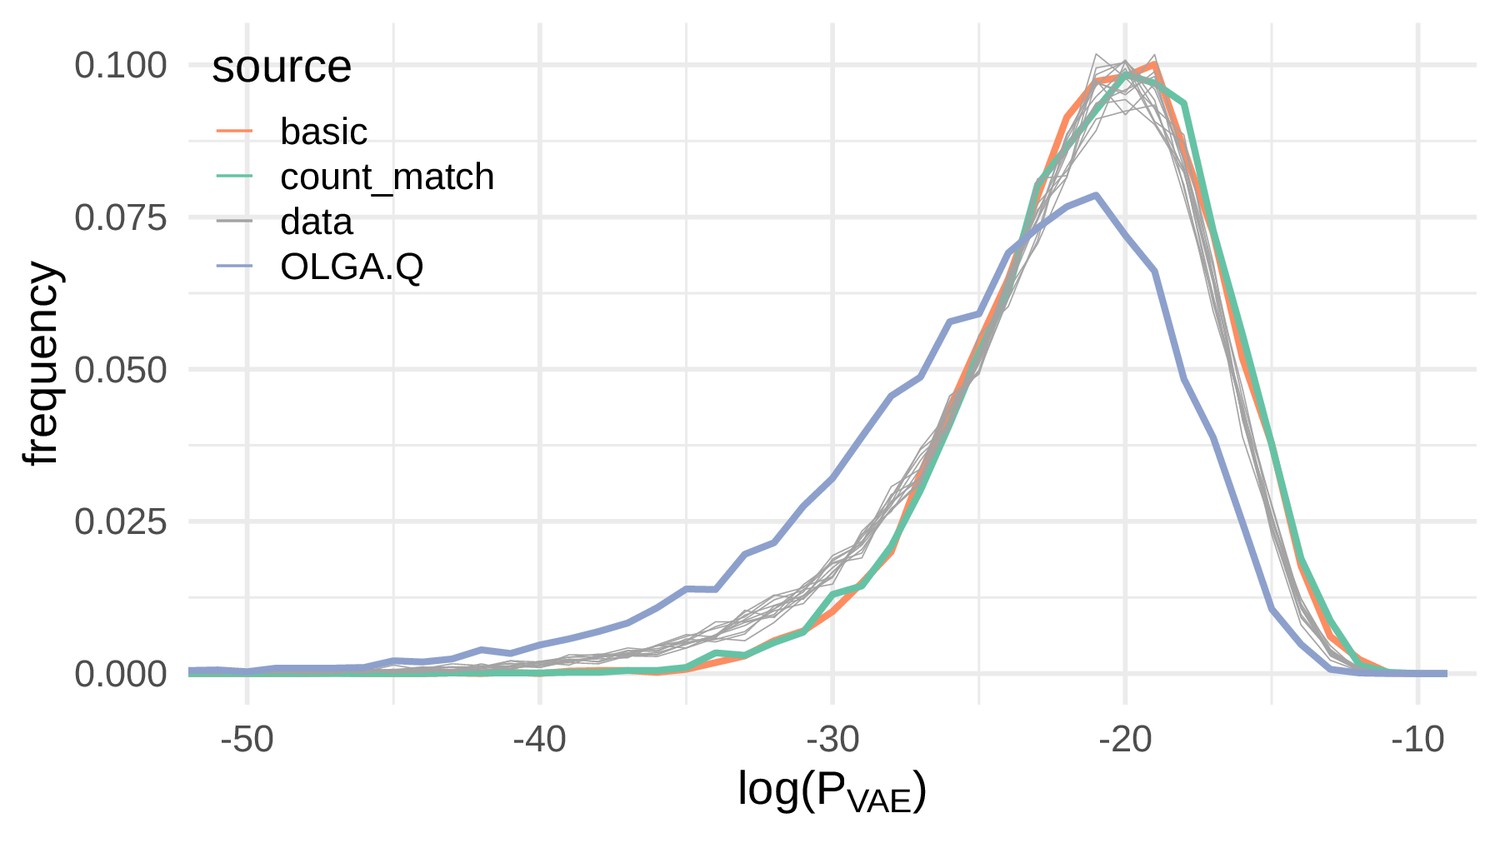
Figure 3
VAE models generate plausible recombinations according to the OLGA.Q model, which is built on a model of VDJ recombination.
Here we show the distribution of log-probability of generation according to the OLGA.Q model for a panel of sequences from 11 test repertoires (gray) as well as simulated sequences from the basic, count_match, and OLGA.Q models.
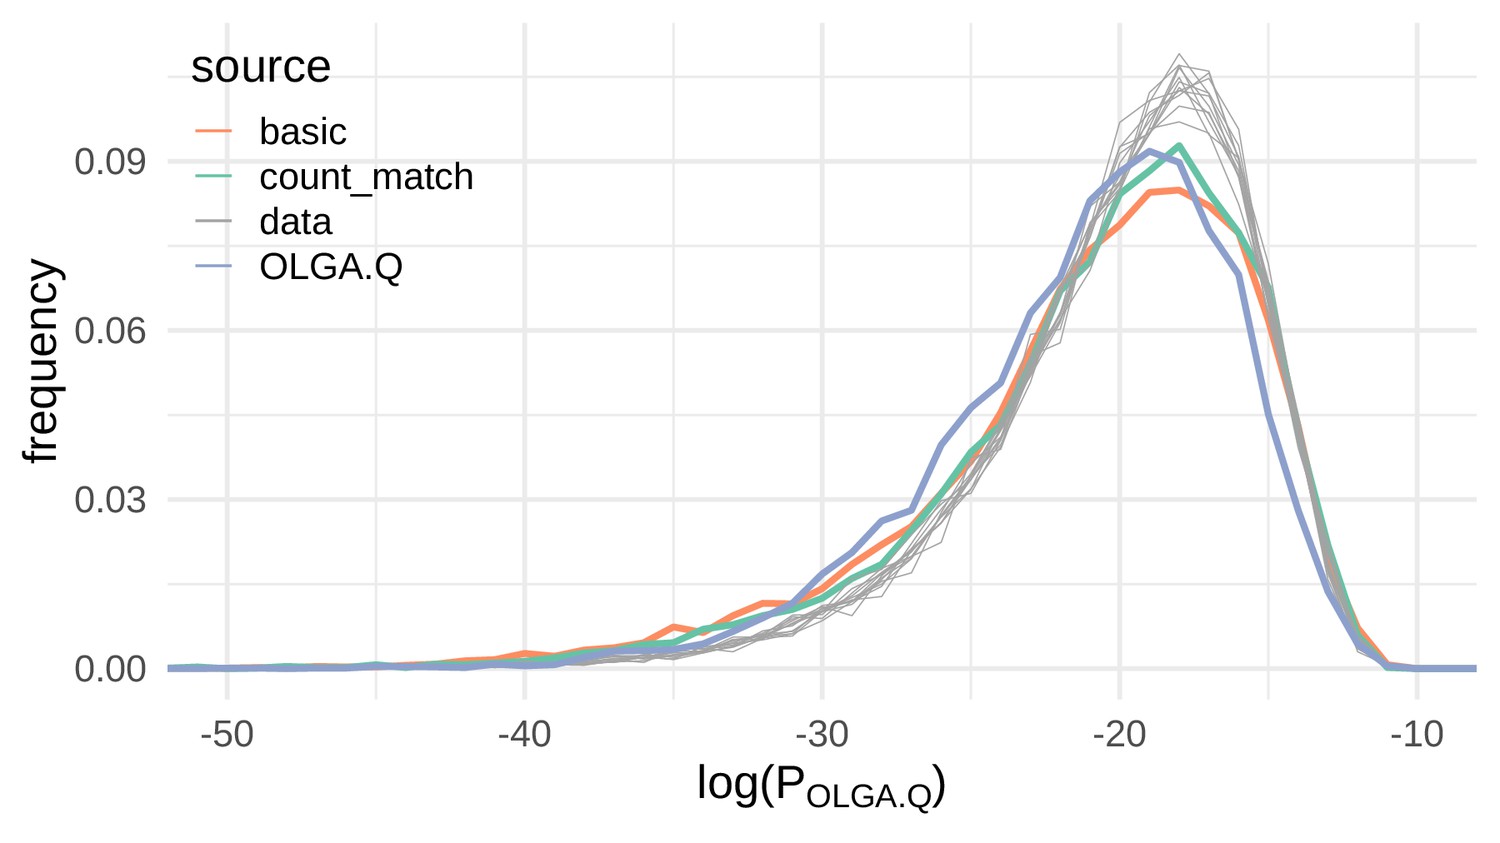
Figure 4
Sequences generated by the VAE models show a similar distribution of compared to real sequences.
Here we show the distribution of the log probability of generation according to the OLGA.Q model for a panel of sequences from 11 test repertoires (gray) as well as simulated sequences from the basic, count_match, and OLGA.Q models.
Figure 5 with 2 supplements
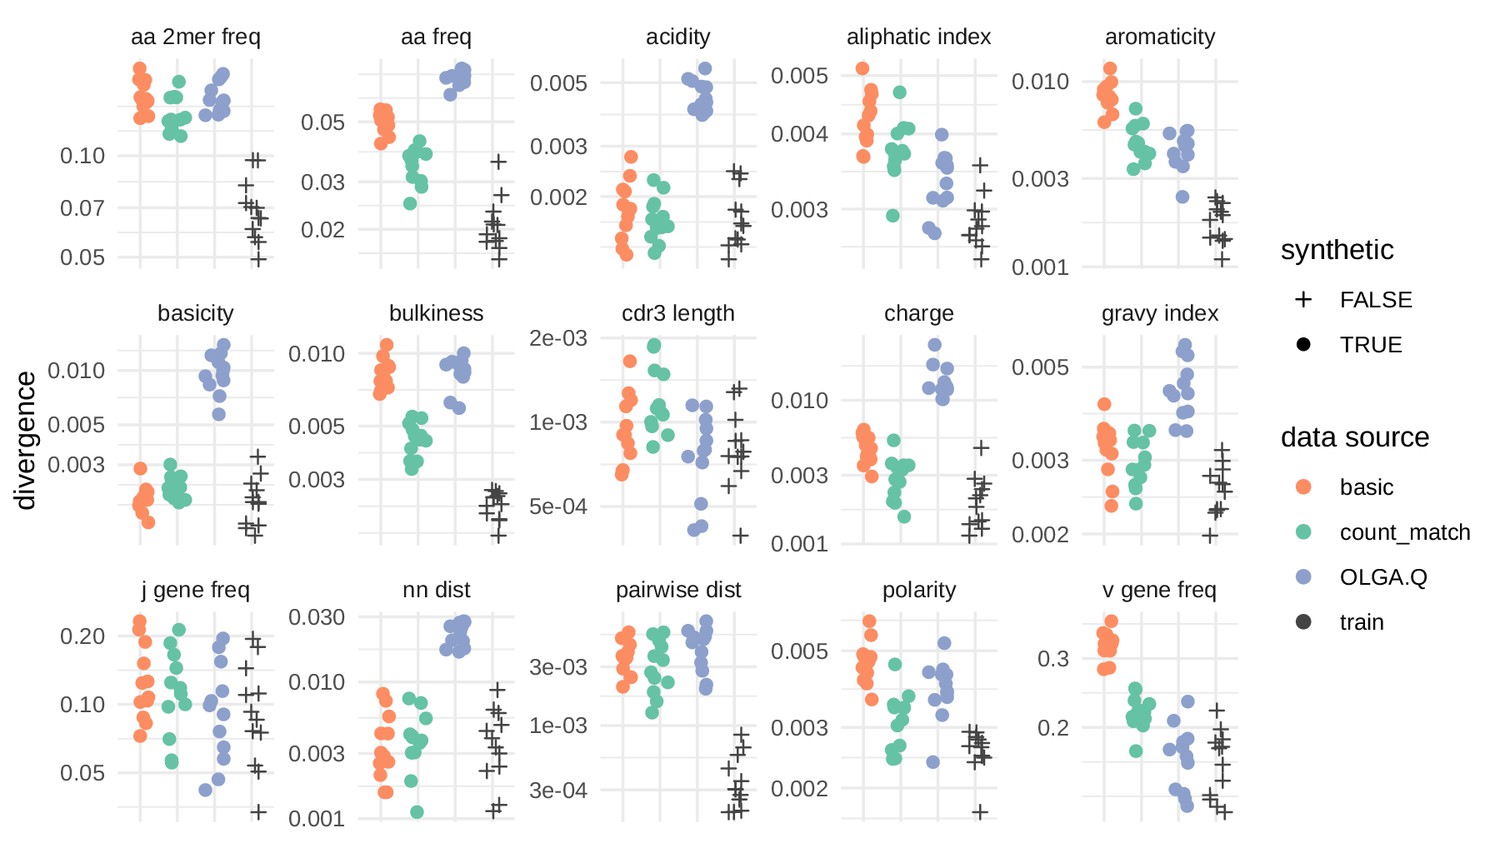
Divergences for summary statistics comparing model-generated sequences to held-out repertoire sequences on the De Neuter et al. (2019) data set.
Each colored point represents the divergence of a summary distribution computed on a simulated pool of sequences to the distribution of the same summary on a set of sequences drawn from one of 11 repertoires (Figure 5—figure supplement 1). Each black '+' represents a similar divergence but with a random selection from the training data rather than a simulated pool of sequences. A lower divergence means more similarity with respect to the given summary. The following summary statistics, applied to the CDR3 amino acid sequence, use Jensen-Shannon divergence: acidity, aliphatic index, aromaticity, basicity, bulkiness, length (in amino acids), charge, GRAVY index, nearest neighbor Levenshtein distance, pairwise Levenshtein distance, and polarity. The following summary statistics use divergence: CDR3 amino acid 2mer frequency, CDR3 amino acid frequency, J gene frequency, and V gene frequency.
Figure 5—figure supplement 1
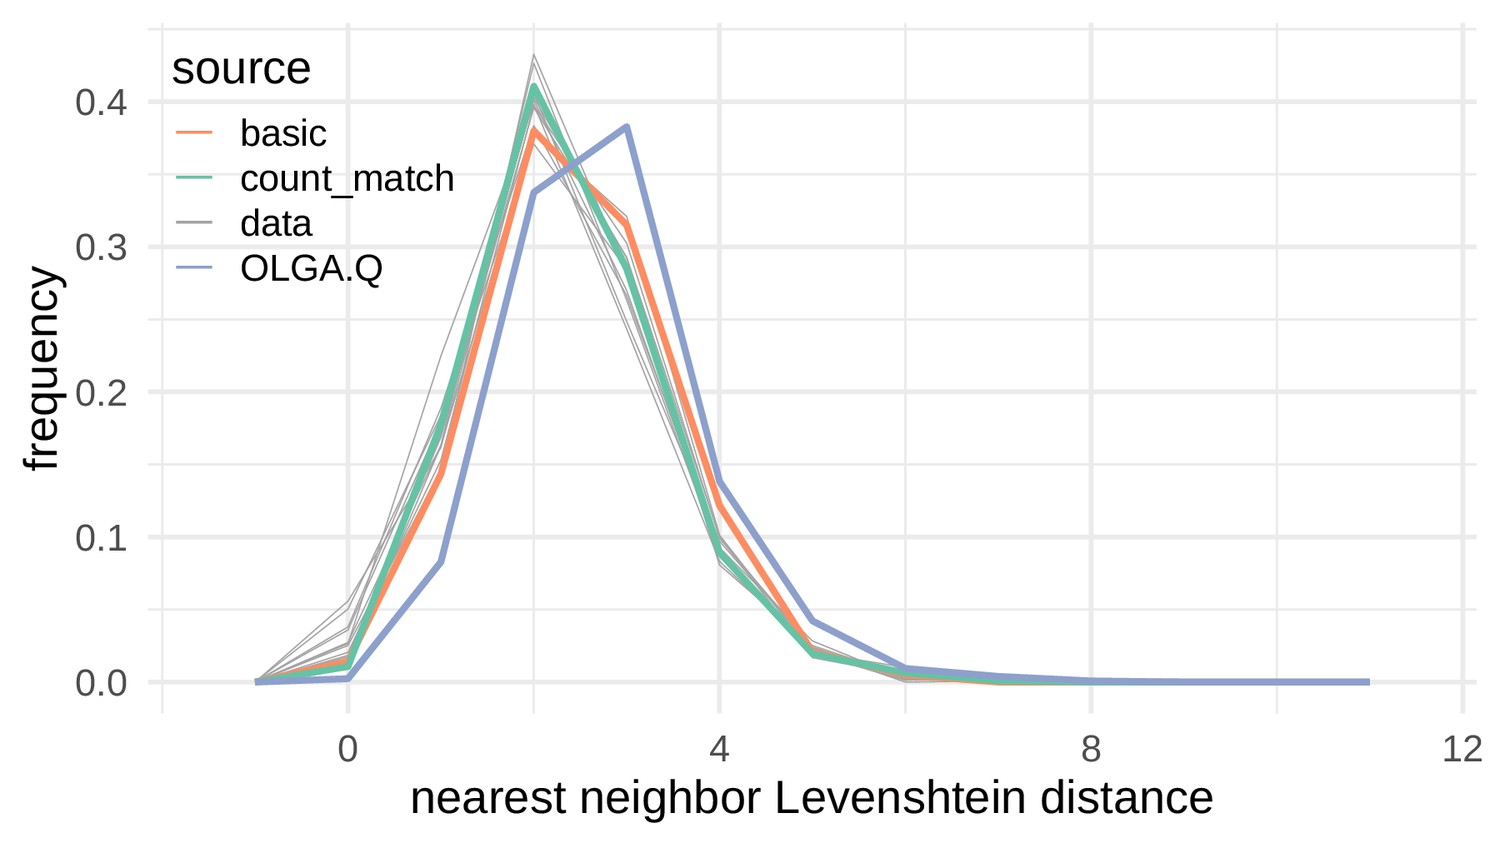
Nearest neighbor Levenshtein distributions on the De Neuter et al. (2019) data set.
Nearest neighbor Levenshtein distance distributions for simulated sequences and test repertoire sequences. Each of the divergences in Figure 4 calculate a divergence between one of the colored lines (a simulated collection of sequences) and one of the gray lines (test repertoire sequences).
Figure 5—figure supplement 2

Summary statistics comparison on a multiple sclerosis data set.
Analysis as in Figure 4 but instead on the multiple sclerosis samples from Emerson et al. (2013), combining CD4+ and CD8+ sorts. Training was performed on 16 repertoires, with nine repertoires for a held-out test set.
Figure 6 with 1 supplement
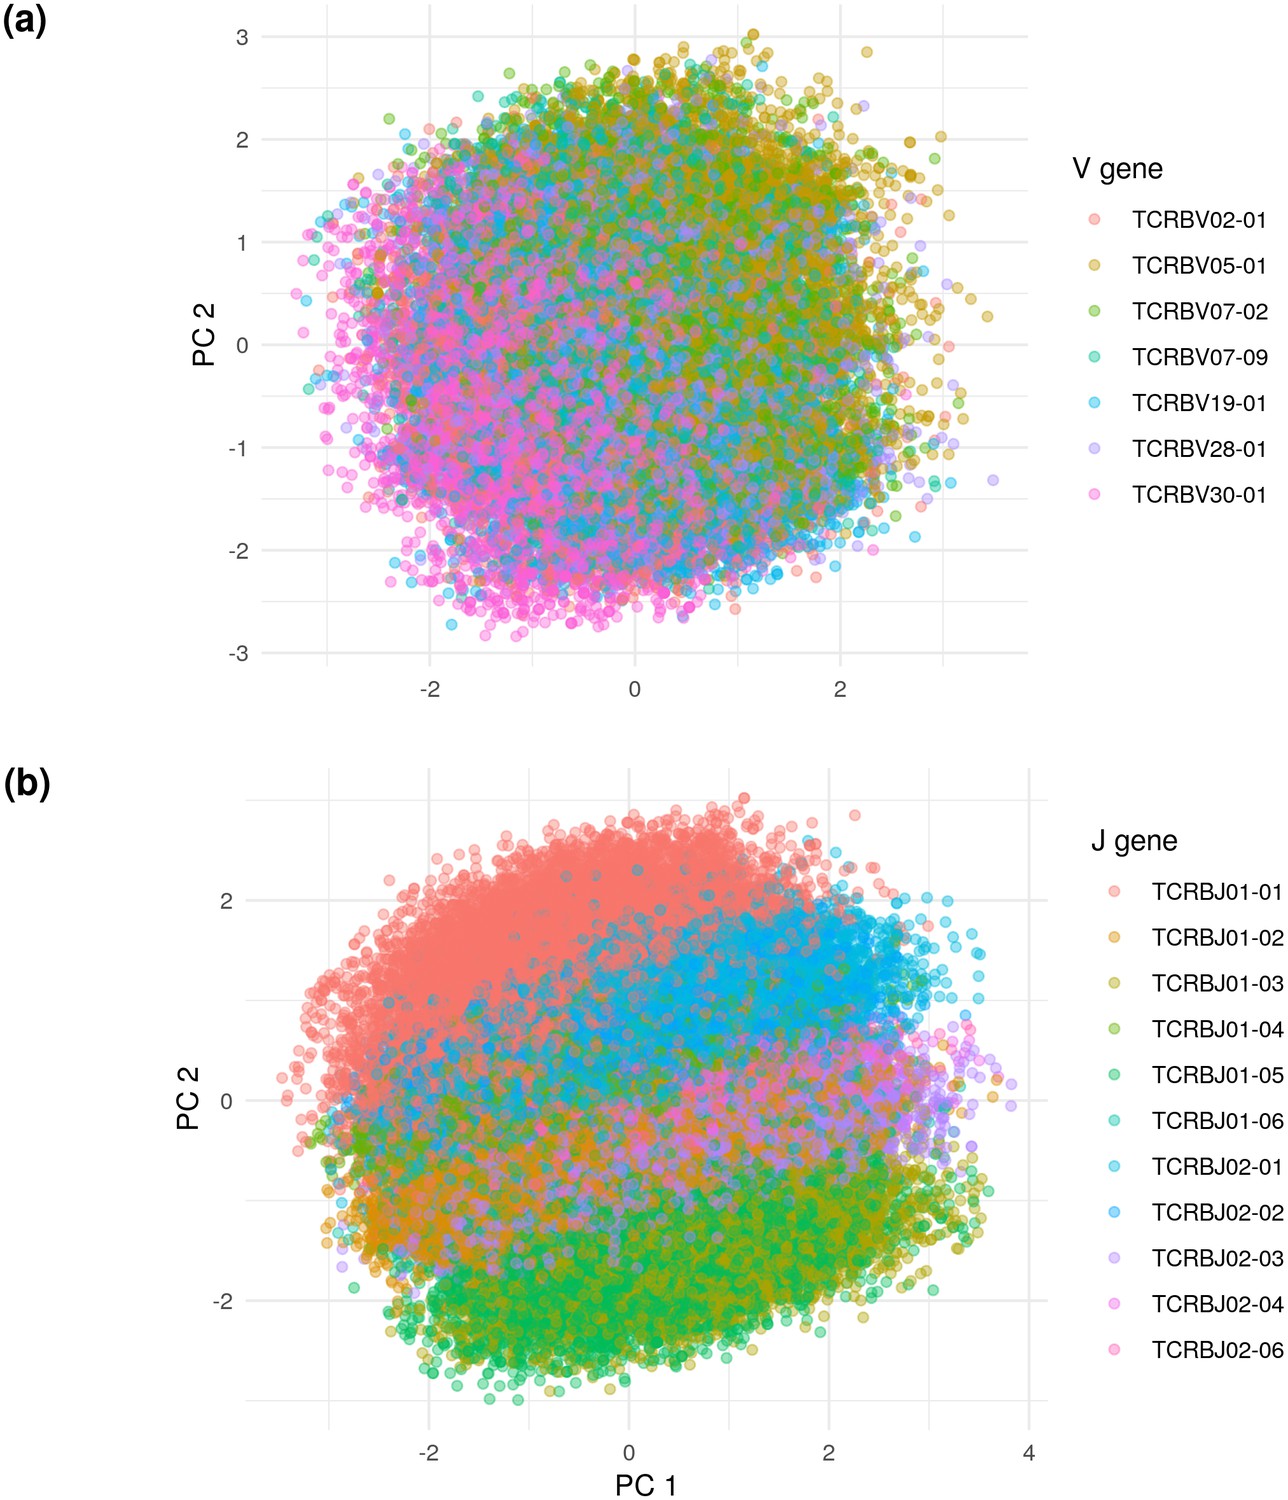
Principal components analysis (PCA) on the De Neuter test data embedded into the 20 dimensional latent space, colored by (a) V gene and (b) J gene.
Panel (a) is limited to the seven most popular V genes.
Figure 6—figure supplement 1
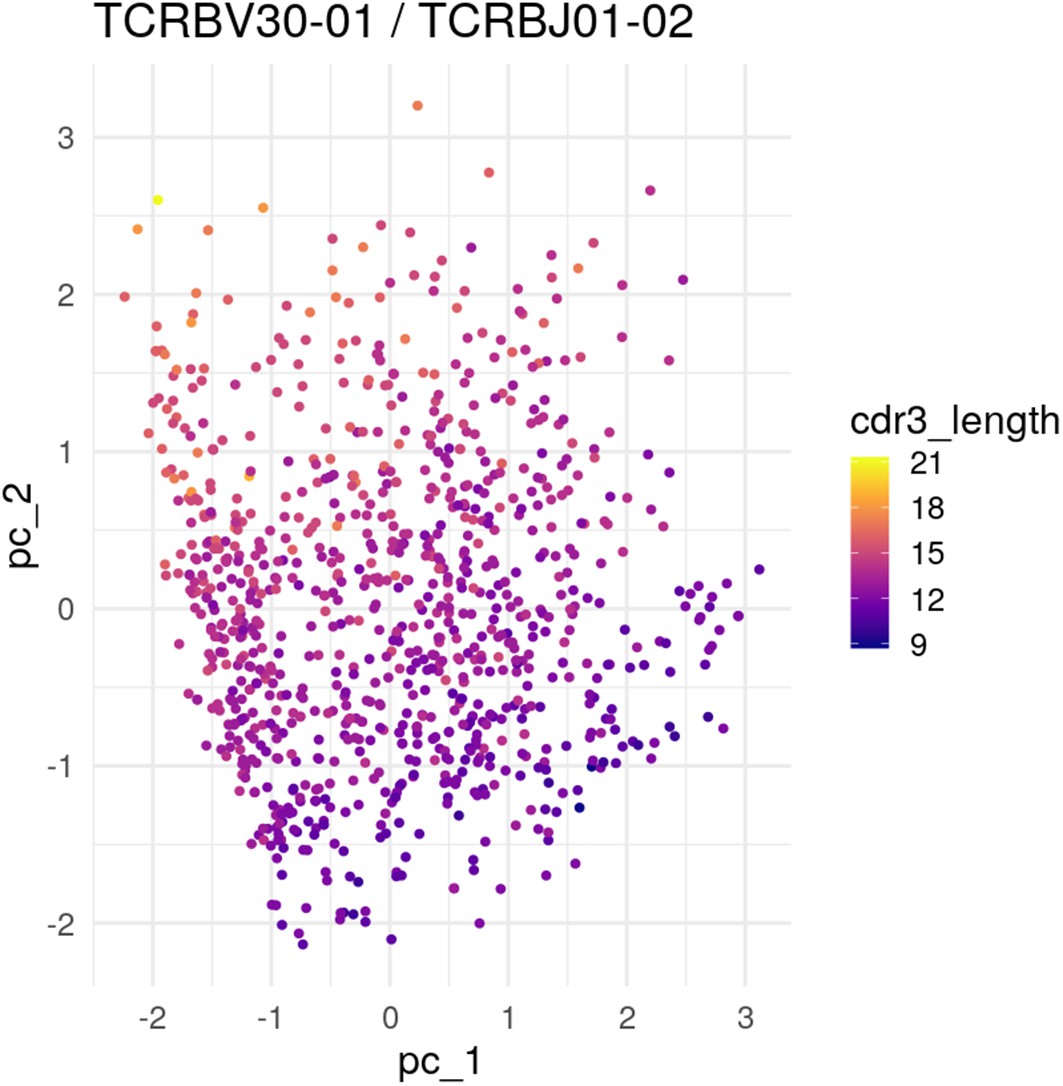
PCA of the most popular V and J genes showing embedding of CDR3 length.
PCA projection of embedded TCR sequences using the most popular V and J genes: TCRBV30-01 and TCRBJ01-02. When we do such a restriction, we see CDR3 length showing up as determining an axis in the latent space.
Figure 7
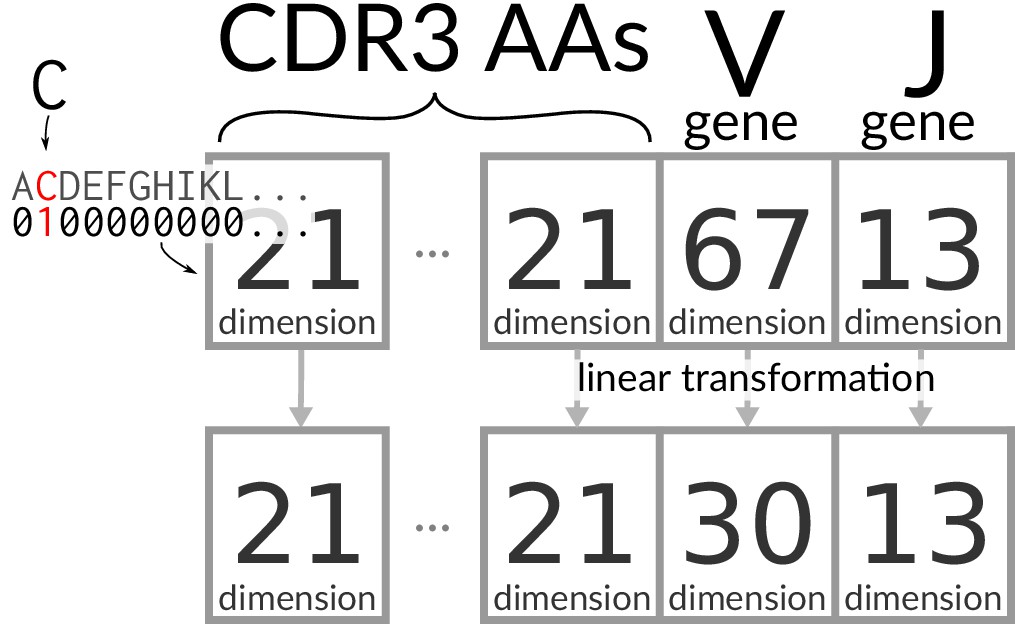
Encoding/transforming TCR sequences.
https://doi.org/10.7554/eLife.46935.011
Figure 8
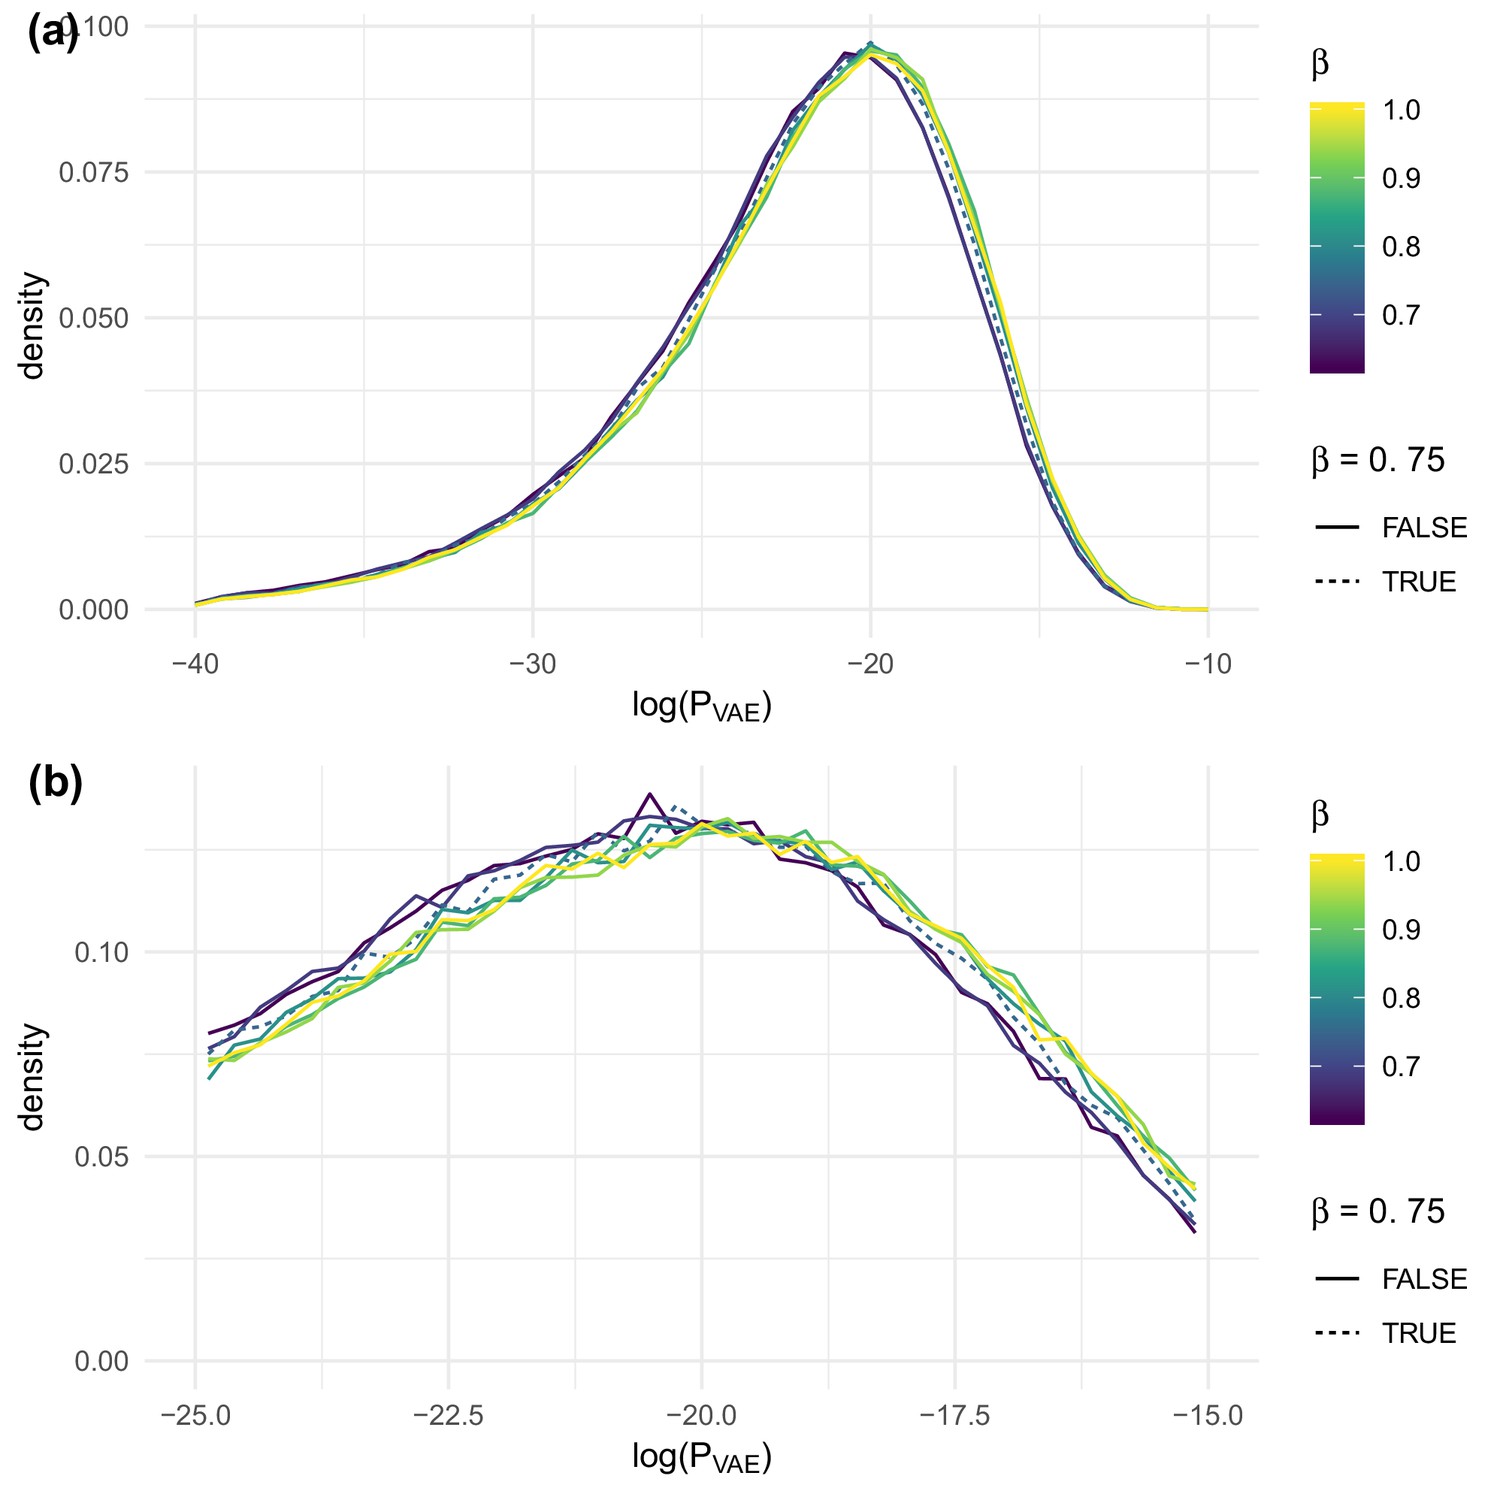
The effect of on evaluated on test sequences for the data of DeWitt et al. (2018), overall (a) and near the peak (b).
https://doi.org/10.7554/eLife.46935.012
Figure 9 with 2 supplements
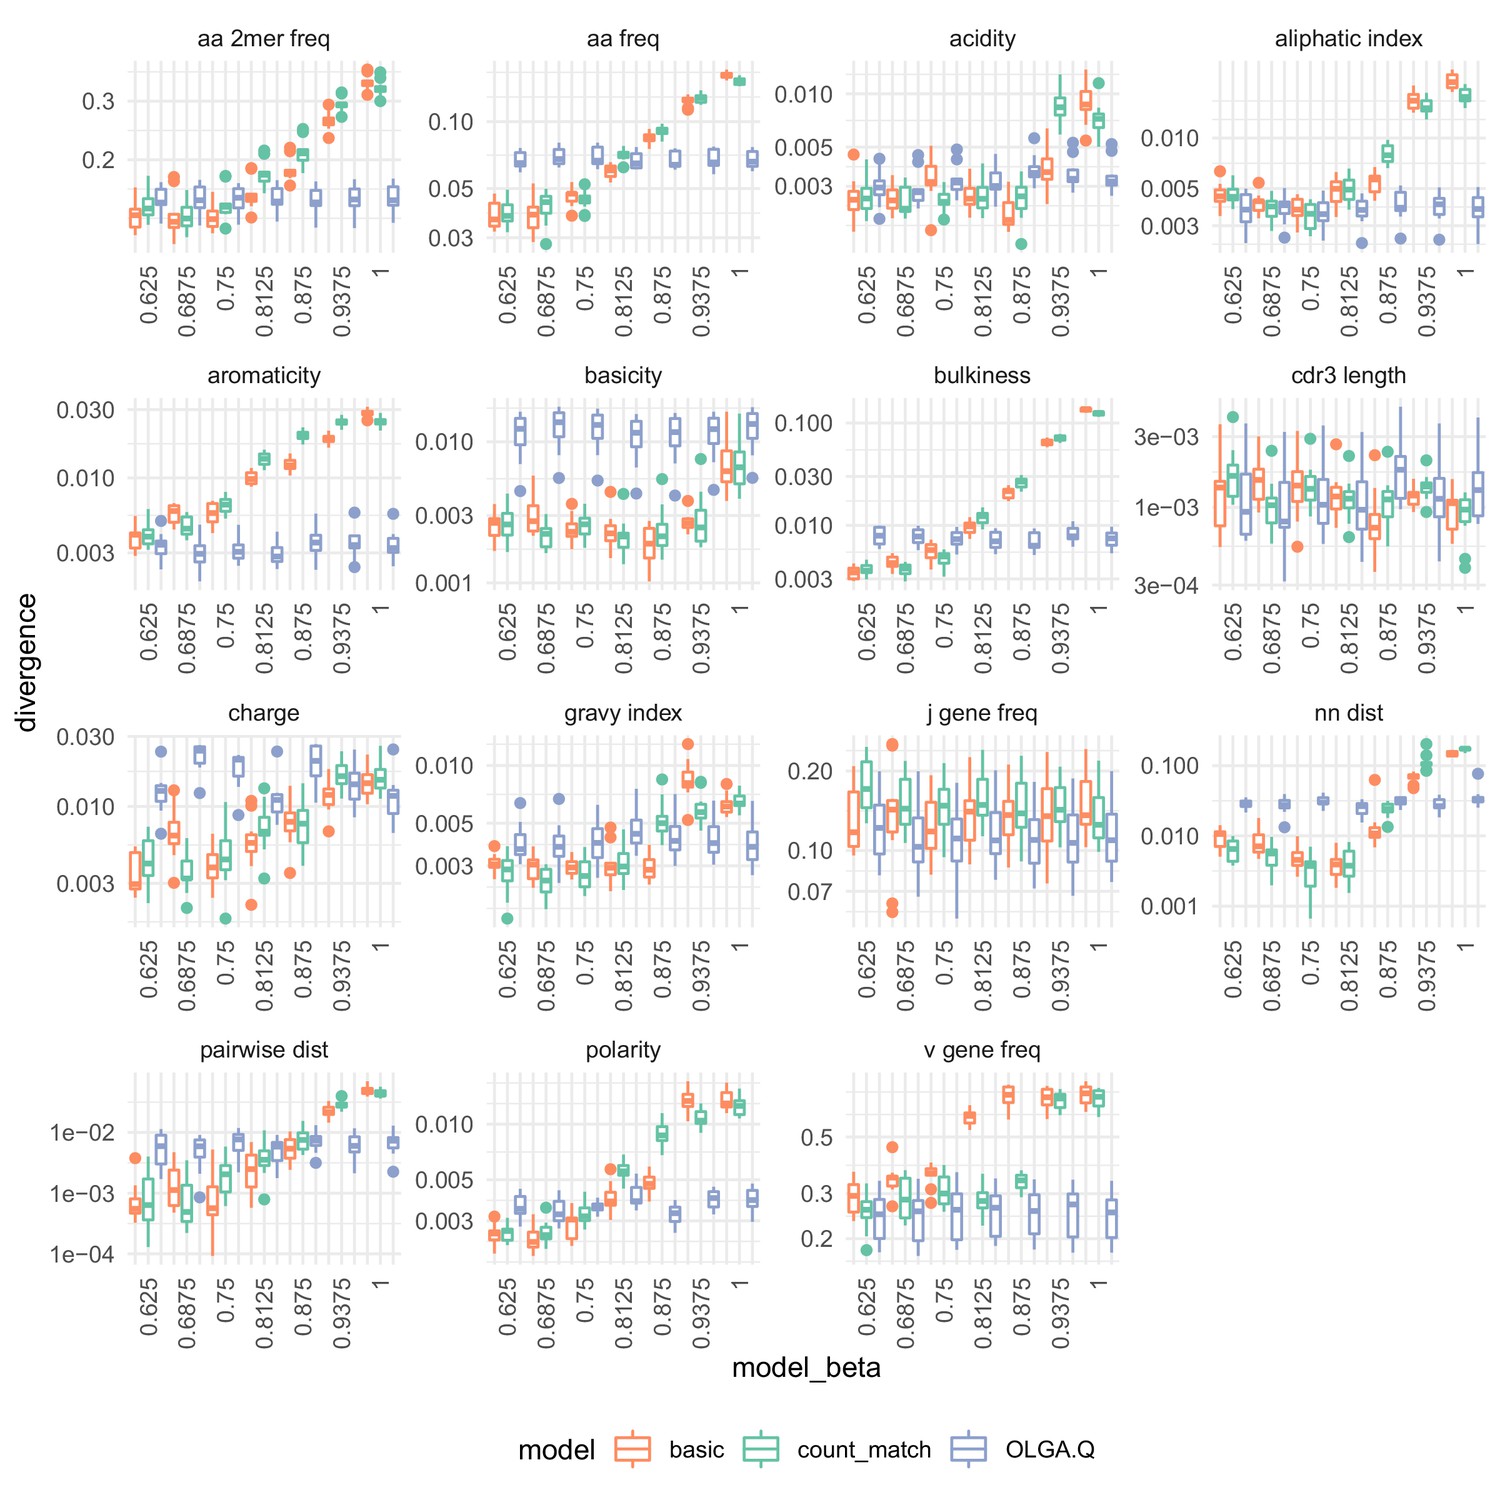
The effect of on summary divergences between generated sequences and observed test sequences as in Figure 4, using the data of DeWitt et al. (2018).
OLGA.Q is also run separately for each value; because has no influence on OLGA.Q, the observed variation is simply due to differences between random samples.
Figure 9—figure supplement 1
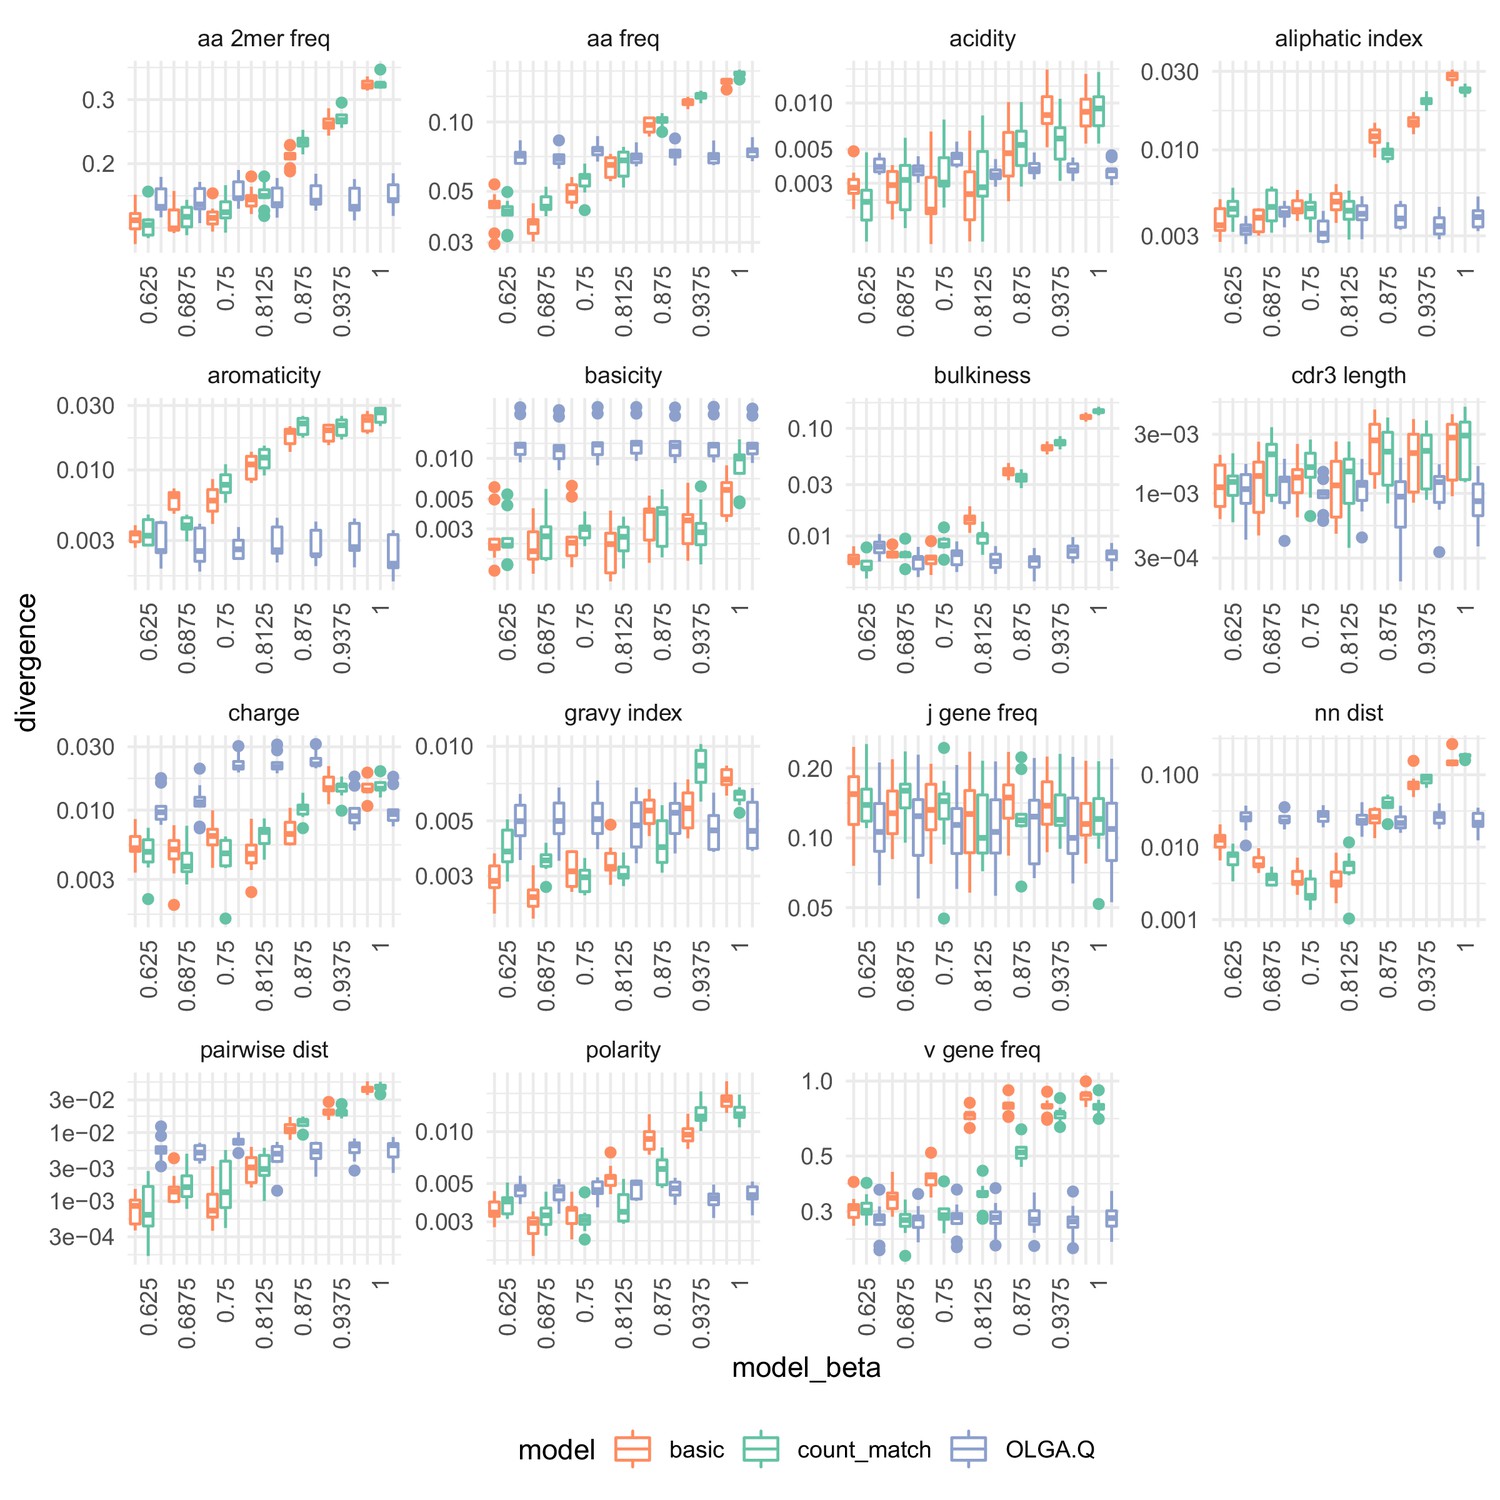
Summary statistic divergences by on the data of Emerson et al. (2013).
Analysis identical to that in Figure 7.
Figure 9—figure supplement 2
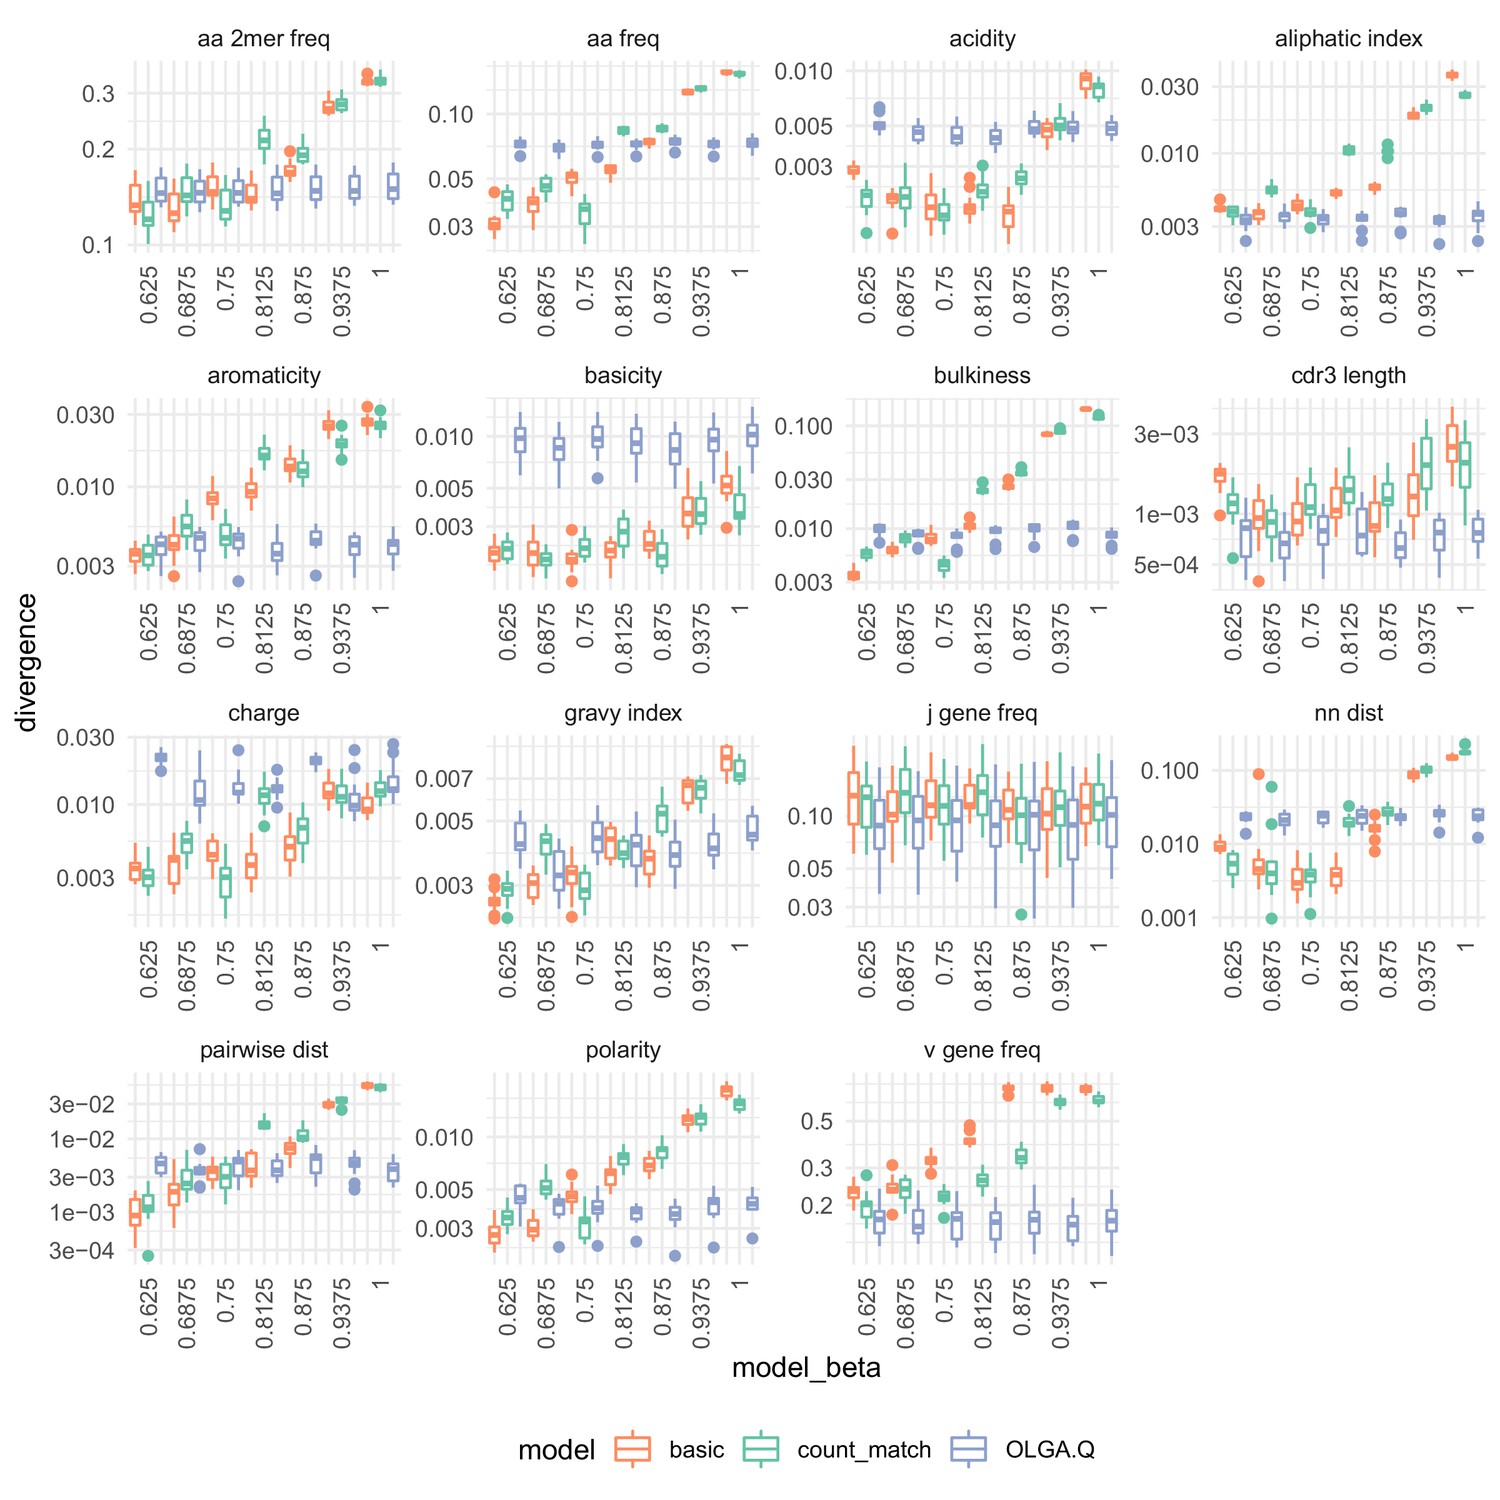
Summary statistic divergences for each on the De Neuter et al. (2019).
Analysis identical to that in Figure 7.
Additional files
-
Transparent reporting form
- https://doi.org/10.7554/eLife.46935.019
Download links
A two-part list of links to download the article, or parts of the article, in various formats.
Downloads (link to download the article as PDF)
Open citations (links to open the citations from this article in various online reference manager services)
Cite this article (links to download the citations from this article in formats compatible with various reference manager tools)
Deep generative models for T cell receptor protein sequences
eLife 8:e46935.
https://doi.org/10.7554/eLife.46935


