Functional brain alterations following mild-to-moderate sensorineural hearing loss in children
- Ecole Normale Supérieure, PSL University, CNRS, France
- University College London, United Kingdom
- University of Cambridge, United Kingdom
Figures
Figure 1
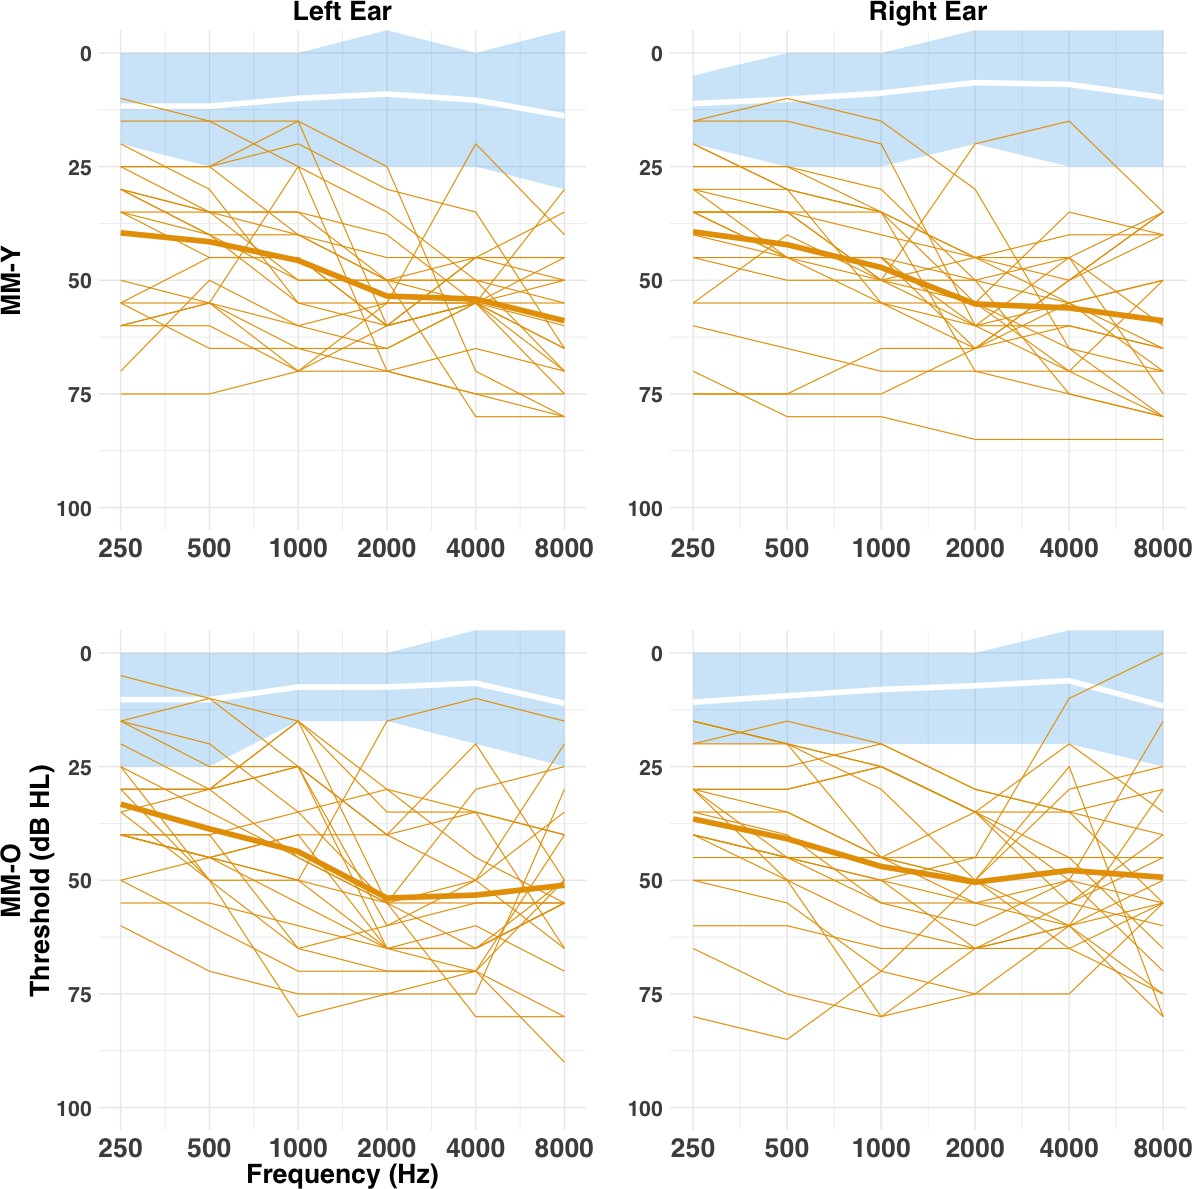
Pure-tone air-conduction audiometric thresholds (cross-sectional study).
Audiometric thresholds are shown across octave frequencies from 0.25 to 8 kHz for the MM (orange) and NH (blue and white) groups, Y (top row) and O (bottom row) age bands, and left (left column) and right (right column) ears. Individual thresholds for the MM group are shown as normal lines, and the group mean marked by a bold line. Mean thresholds for the NH group are marked by a white bold line, with the shaded blue area representing the range for the NH group. There was no difference between the MM-Y or MM-O subgroups in audiometric thresholds (all p>0.05; see text).
Figure 2
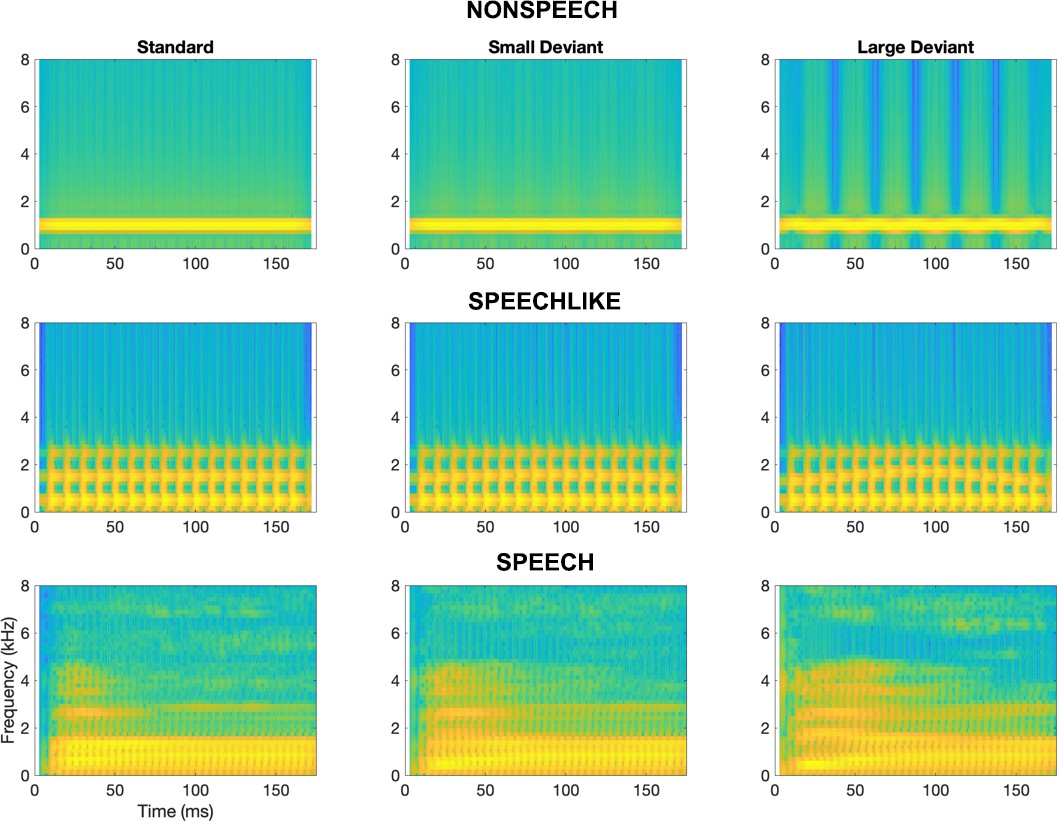
Spectrograms depicting stimuli for the nonspeech, speech-like, and speech conditions.
For each condition, the left panel depicts the standard stimulus, the middle panel depicts the small deviant, and the right panel depicts the large deviant.
Figure 3
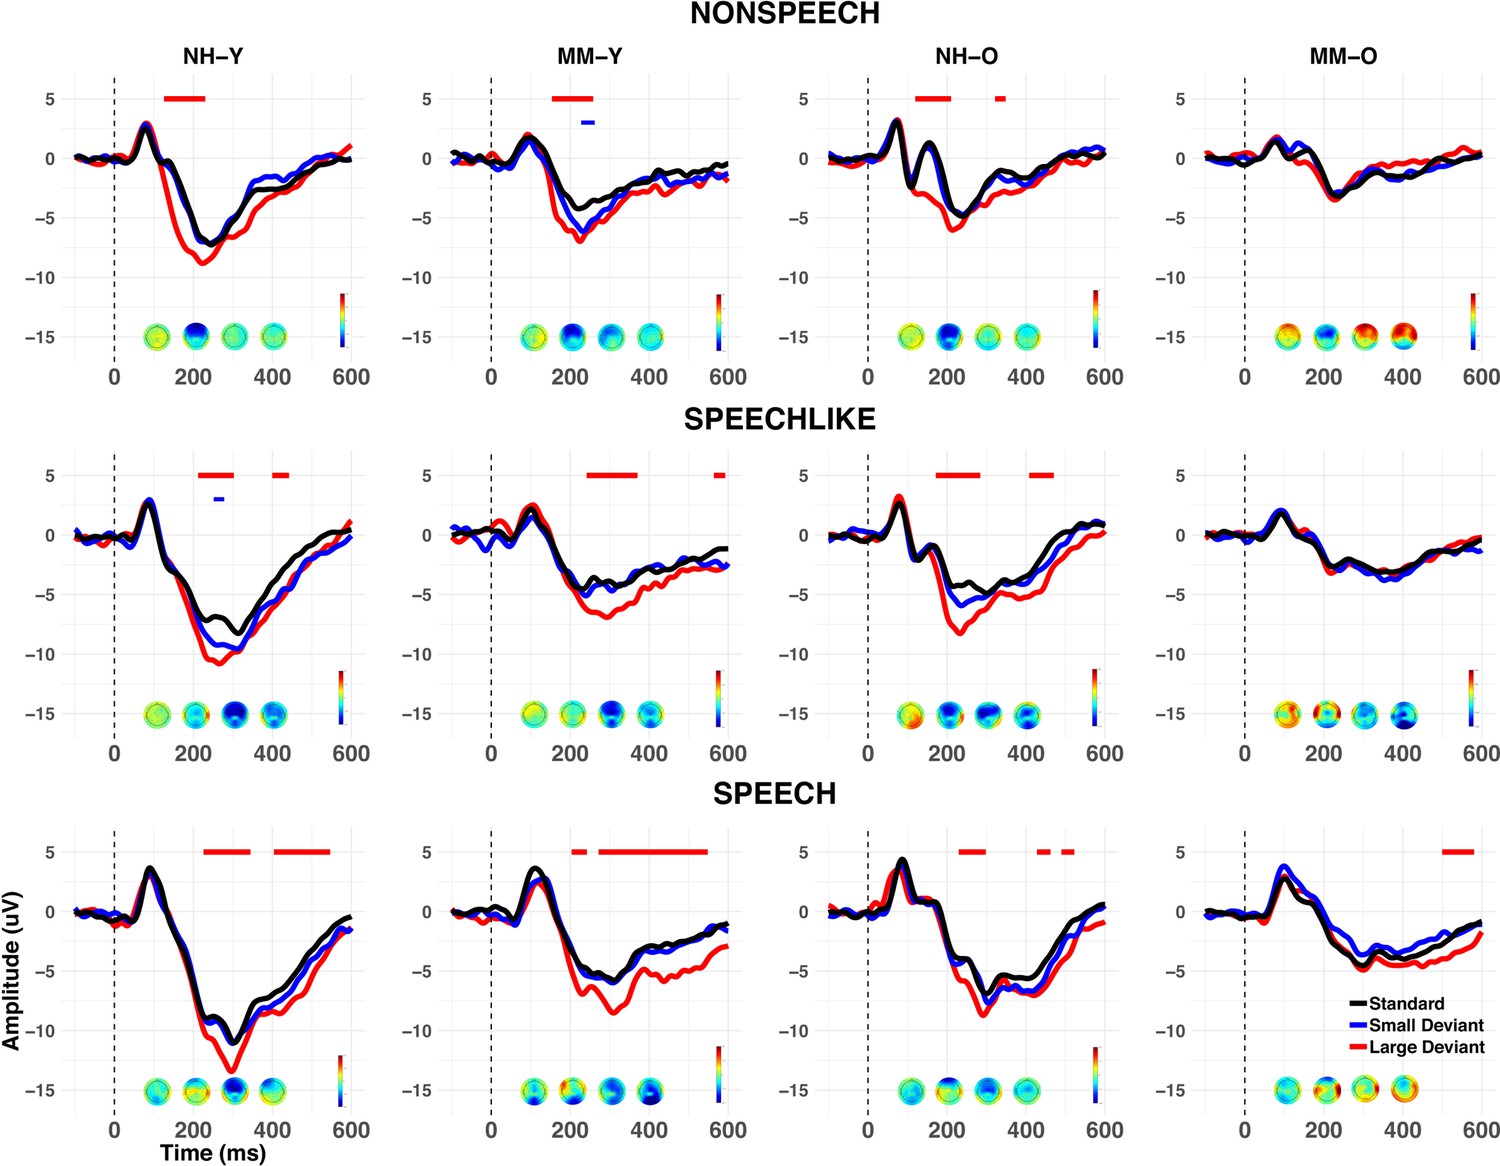
Grand average waveforms at Cz (cross-sectional study).
Grand averages are shown for each group (NH vs. MM), age band (Y vs. O), and condition (nonspeech, speech-like, speech). Responses to standards are shown in black, and to large and small deviants in red and blue respectively. Voltage maps show the mean MMN activity during the 100–400 ms post-stimulus time window. Negative values of the MMN are shown in blue, and positive values in red. Periods of the 100–400 ms (MMN) and 400–600 ms (LDN) post-stimulus epoch where a significant (p<0.01 for>20 ms consecutively) MMR was observed in the grand average are shown by horizontal lines above the waveforms, as a function of deviant type. Note that whilst both the Y and O NH subgroups (NH-Y and NH-O), and the MM-Y subgroup obtained significant MMNs for large deviants across all conditions, the MM-O subgroup failed to show a significant MMN to any stimulus type in any condition (see text for details).
Figure 4 with 2 supplements
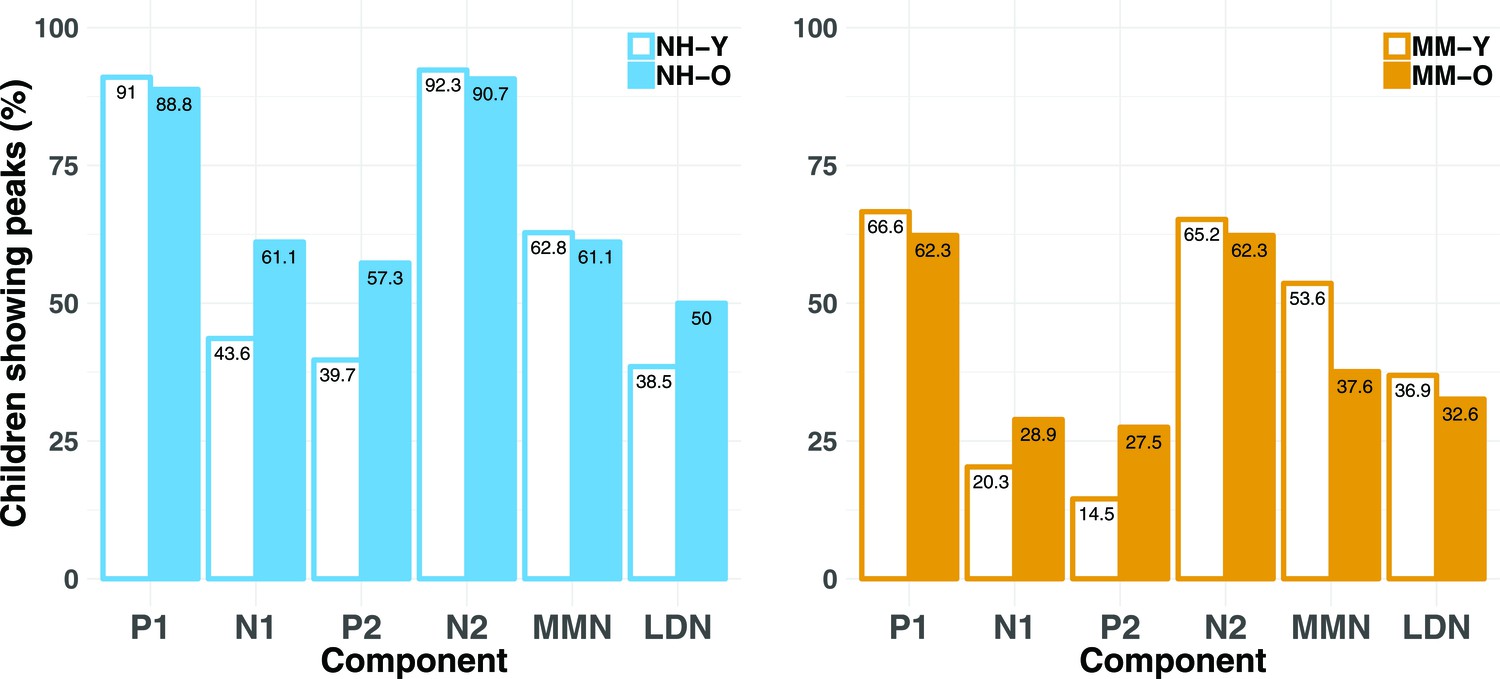
Percentages of children showing present LAER components (P1, N1, P2, and N2) and MMN/LDN responses (cross-sectional study).
Percentages are shown for each age band (Y and O) and for each group (NH and MM), for each component (P1, N1, P2, N2) and response (MMN and LDN). Percentages are averaged across the three conditions (nonspeech, speech-like, speech). Regardless of age band, children in the MM subgroups were less likely to show present LAER components and MMNs (but not LDNs) than their NH peers.
Figure 4—figure supplement 1
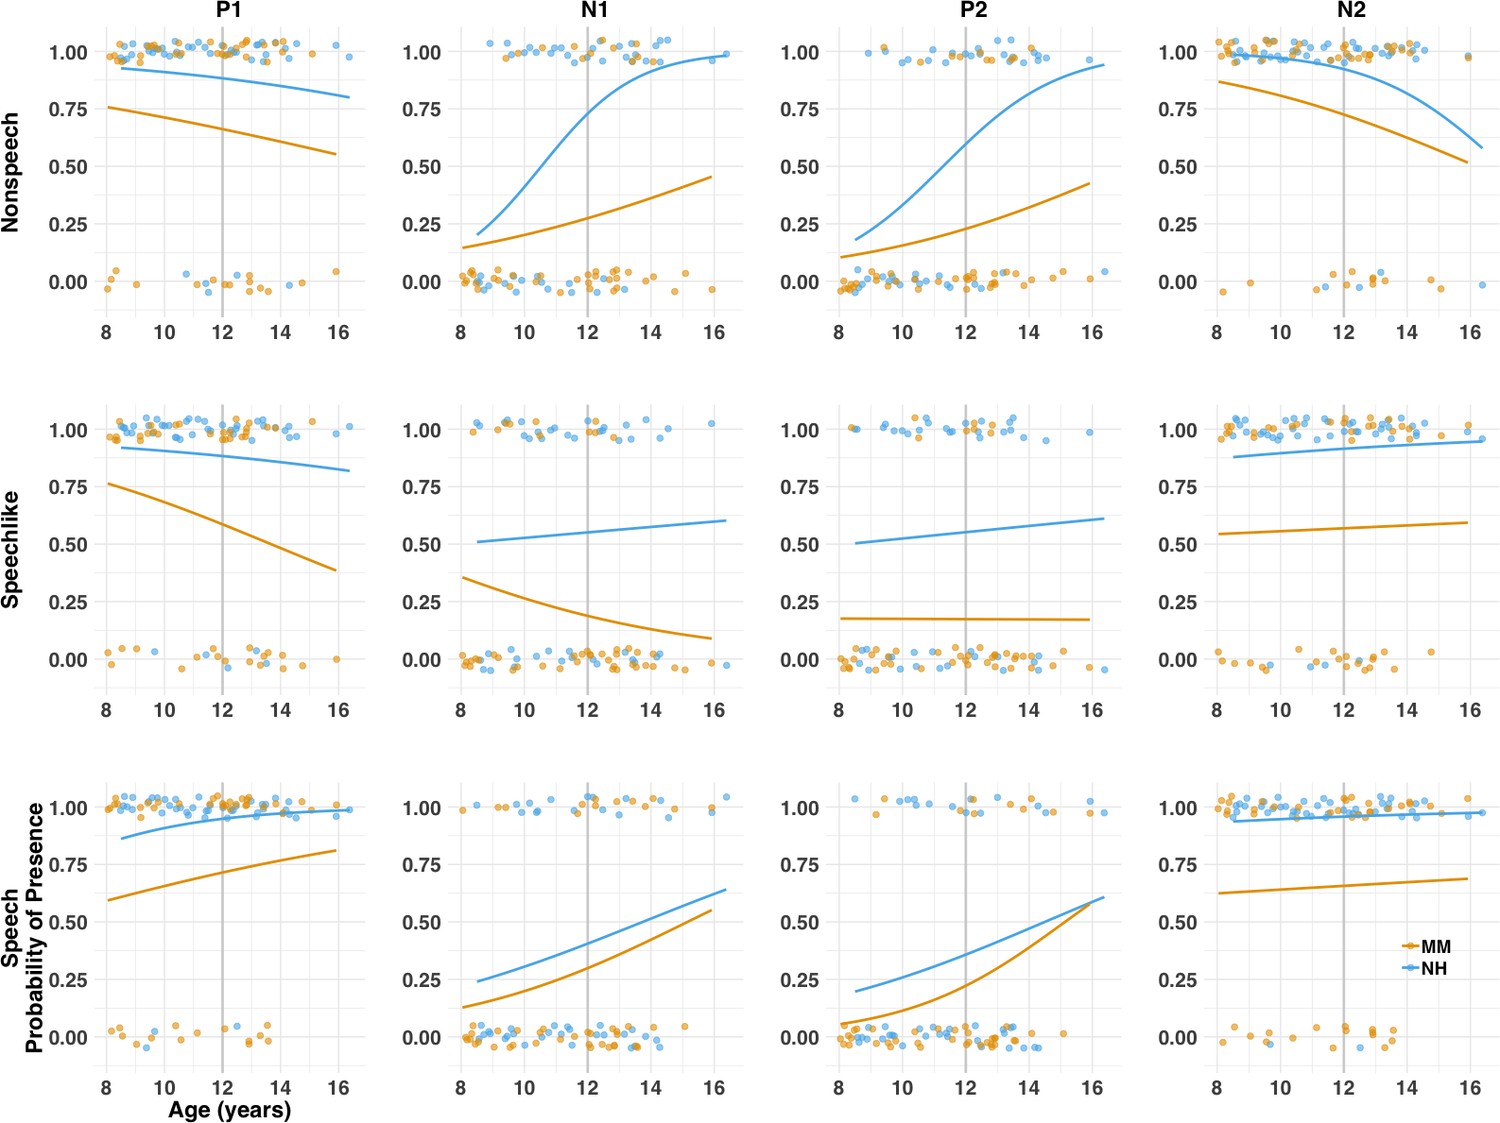
Probability of presence of the LAER components (P1, N1, P2, N2) for each group (MM vs. NH) as a function of age (cross-sectional study).
Individual (circles) and group (lines) data are shown for each condition for the MM (orange) and NH (blue) groups. At the individual level, components were either present (probability = 1) or absent (probability = 0). Solid lines result from a logistic regression fitting a general linear model with age as a predictor and presence/absence of the component as the outcome variable. Note that for illustrative purposes, age is represented here as a continuous variable, but was treated as a categorical variable (Y vs. O) in the analyses (see main text). The grey vertical lines on each subplot represent the median age split into the Y (left of the line) and O (right of the line) age bands. Across ages and conditions, children with MMHL were less likely to show present LAER components than their NH peers.
Figure 4—figure supplement 2

Probability of presence of the MMN and LDN for each group (MM vs. NH) as a function of age (cross-sectional study).
Individual (circles) and group (lines) data are shown for each condition where a significant MMN/LDN was found at the group level (ie, there was no significant LDN in the nonspeech condition, see text). At the individual level, components were either present (probability = 1) or absent (probability = 0). Solid lines result from a logistic regression fitting a general linear model with age as a predictor and presence/absence of the component as the outcome variable. For illustrative purposes, age is represented a continuous variable, but was treated as a categorical variable (Y vs. O) in the analyses (see main text). The grey vertical lines on each subplot represent the median age split into the Y (left of the line) and O (right of the line) age bands. Across ages and conditions, children with MMHL were less likely to show present MMNs but not LDNs than their NH peers.
Figure 5 with 1 supplement
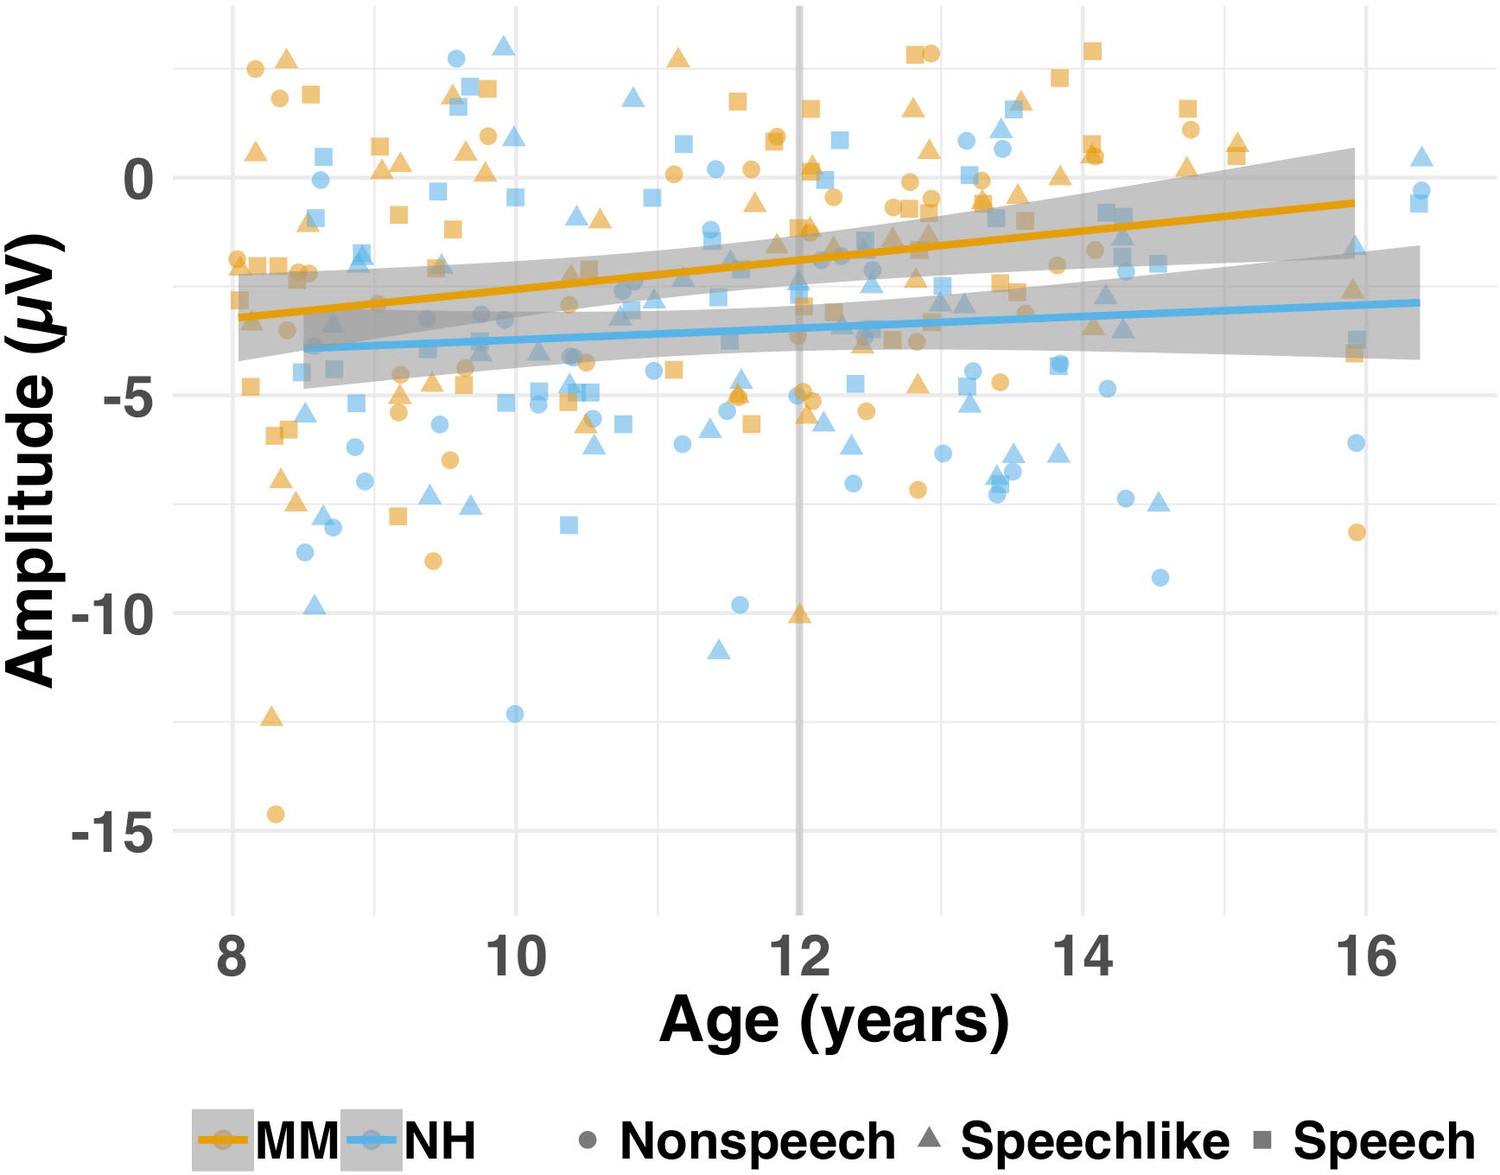
Amplitude (μV) of the MMN for each group (MM vs. NH) as a function of age (cross-sectional study).
Individual (shapes) and group (lines) data are shown for each condition (nonspeech = circles; speech-like = triangles, speech = squares) for the MM (orange) and NH (blue) groups. Shaded lines represent the 95% confidence interval. For illustrative purposes, age is represented as a continuous variable, but was treated as a categorical variable (Y vs. O) in the analyses (see text). The grey vertical lines on each subplot represent the median age split into the Y (left of the line) and O (right of the line) age bands. Children in the MM-O subgroup obtained MMNs that were smaller in amplitude than those of their NH peers (NH-O subgroup).
Figure 5—figure supplement 1
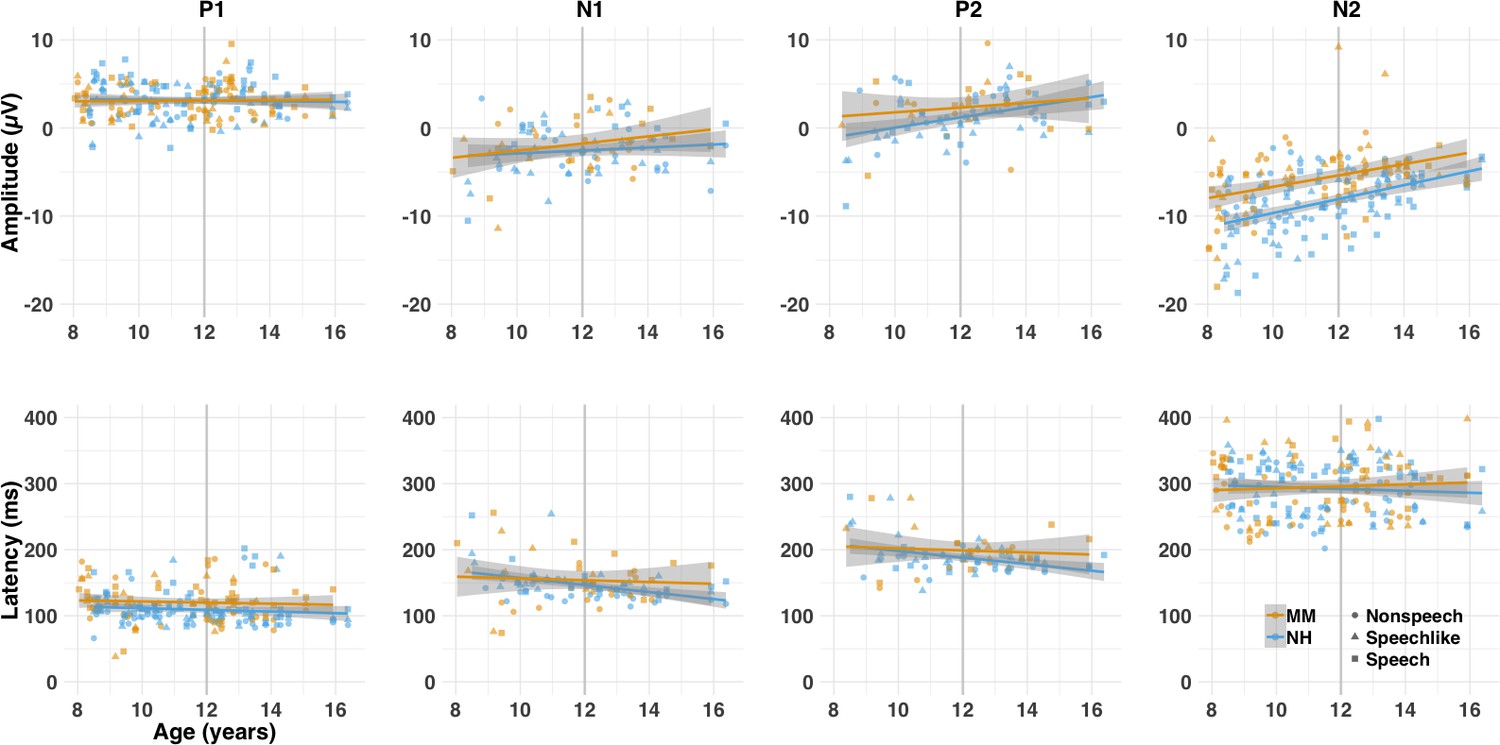
Amplitude (μV) and latency (ms) of the LAER components (P1, N1, P2, and N2), where present, for each group (MM vs. NH) as a function of age (cross-sectional study).
Individual (shapes) and group (lines) data are shown for each condition (nonspeech = circles; speech-like = triangles, speech = squares) and component for the MM (orange) and NH (blue) groups. Shaded lines represent the 95% confidence interval. For illustrative purposes, age is represented as a continuous variable, but was treated as a categorical variable (Y vs. O in the analyses, see main text). The grey vertical lines on each subplot represent the median age split into the Y (left of the line) and O (right of the line) age bands. Across ages and conditions, children with MMHL on average shoed P1s and P2s that were later than, and N2s that were smaller than, those of their NH peers, where these components were present.
Figure 6
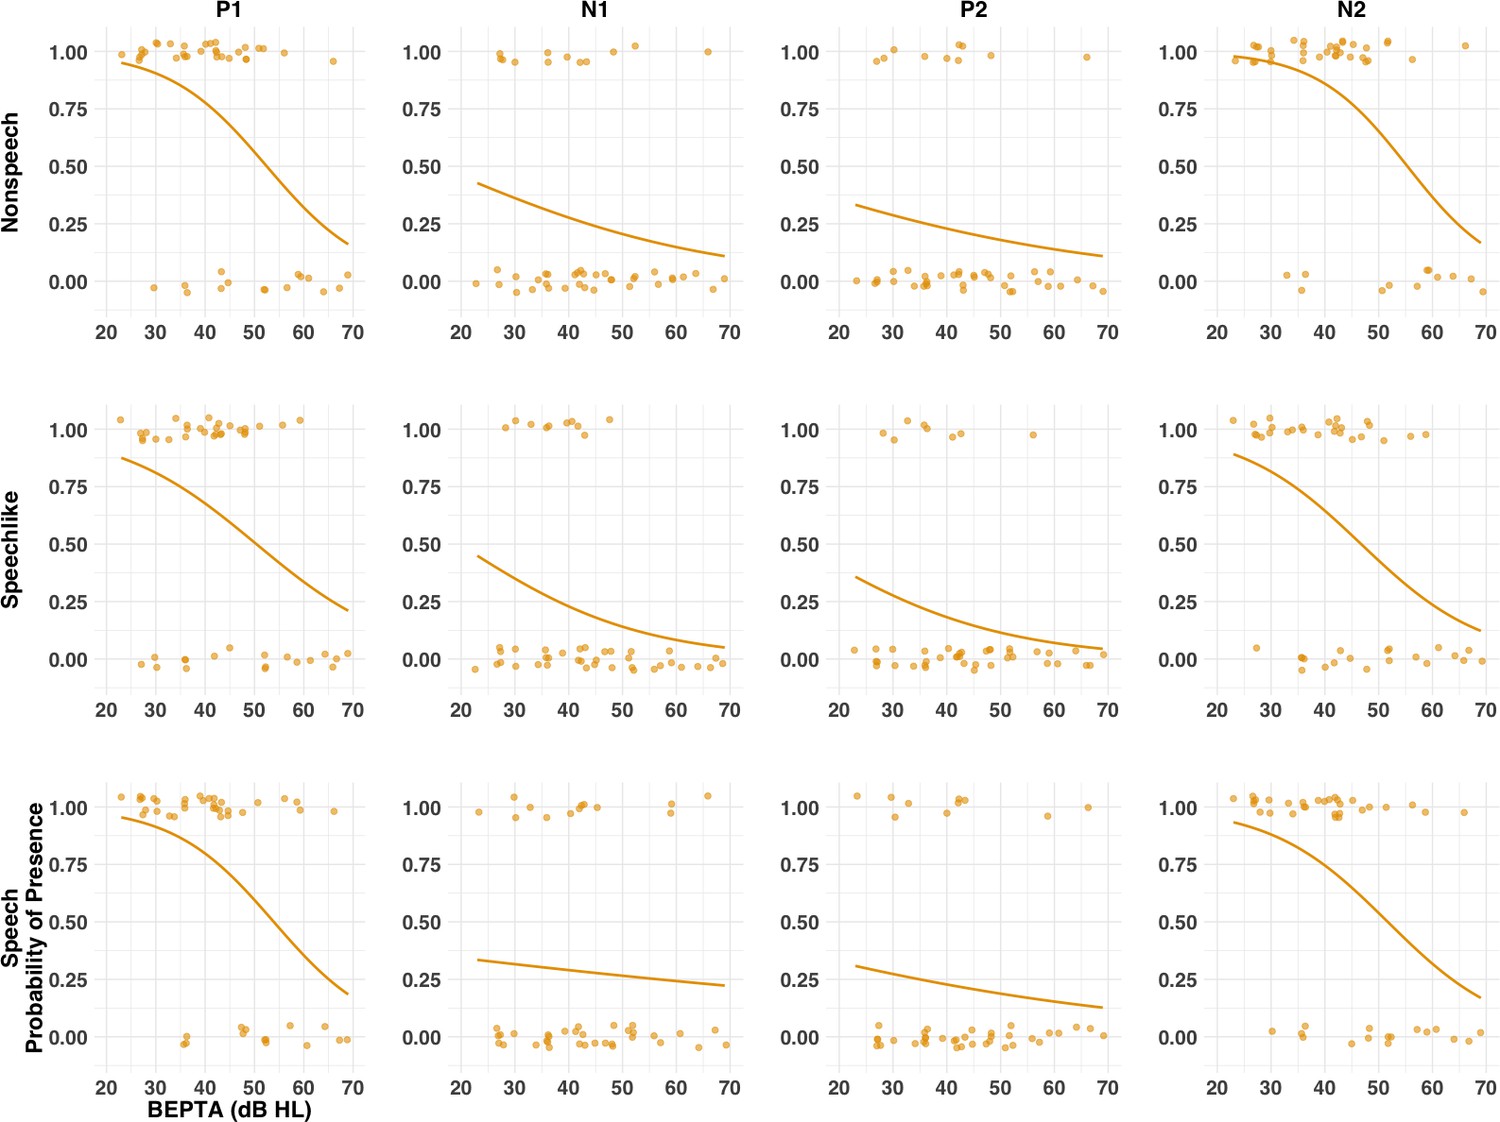
Probability of presence of LAER components (P1, N1, P2, and N2) for the MM group as a function of severity of hearing loss (cross-sectional study).
Individual (circles) and group (lines) data are shown each condition (nonspeech, speech-like, speech) and component. At the individual level, components were either present (probability = 1) or absent (probability = 0). Solid lines result from a logistic regression fitting a general linear model with BEPTA as a predictor and presence of the component as the outcome variable. Worse BEPTA thresholds were associated with reduced likelihood of presence of components in all conditions, although this effect was more marked for the P1 and N2 components than for N1 and P2.
Figure 7

Probability of presence of the MMN and LDN for the MM group as a function of severity of hearing loss (cross-sectional study).
Individual (circles) and group (lines) data are shown for each condition (nonspeech, speech-like, speech) and response where present for the NH group. Solid lines result from a logistic regression fitting a general linear model with BEPTA as a predictor and presence of the response as the outcome variable. Worse BEPTA thresholds were associated with reduced likelihood of presence of the MMN and LDN in all conditions.
Figure 8

Amplitude (μV) and latency (ms) of LAER components (P1, N1, P2, and N2) for the MM group as a function of severity of hearing loss (cross-sectional study).
Individual (shapes) and group (lines) data are shown for each condition (nonspeech = circles; speech-like = triangles; speech = squares) and component. Shaded lines represent the 95% confidence interval. Worse BEPTA thresholds were associated with smaller P1 amplitudes in the speech-like condition, and later N1s across conditions, where present.
Figure 9 with 1 supplement
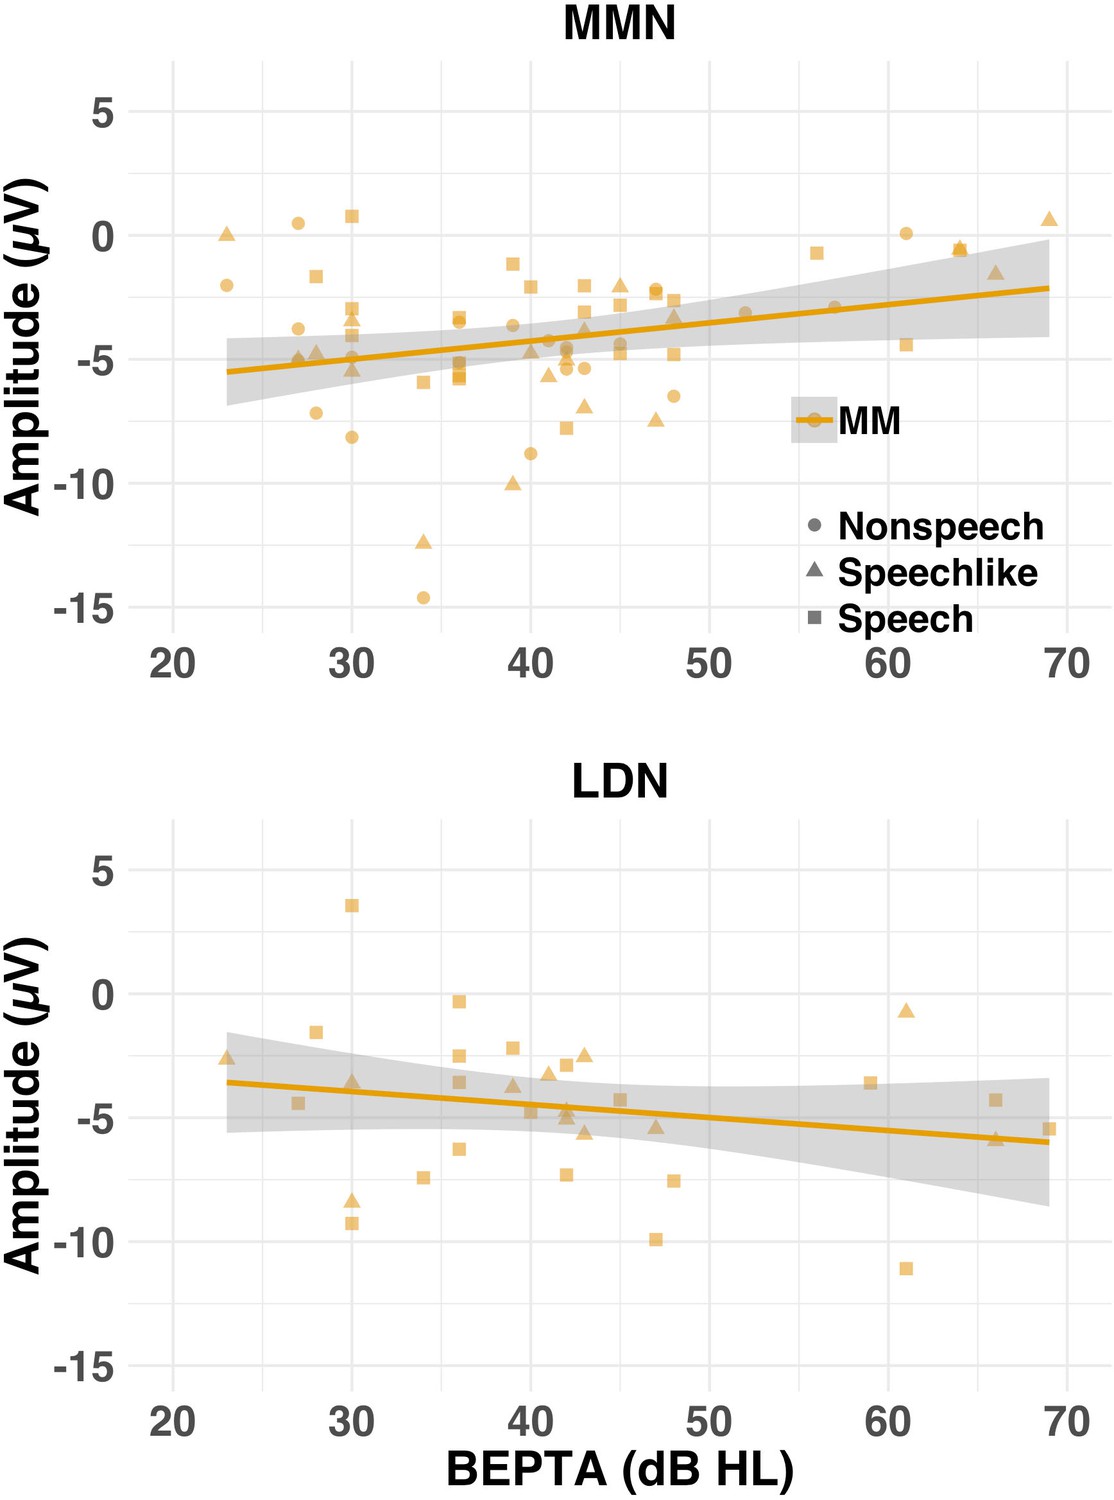
Amplitude (μV) of the MMN (top row) and LDN (bottom row) where present for the MM group as a function of severity of hearing loss (cross-sectional study).
Individual (shapes) and group (lines) data are shown for each condition (nonspeech = circles; speech-like = triangles; speech = squares) and response. Shaded lines represent the 95% confidence interval. Worse BEPTA thresholds were associated with smaller MMN, but not LDN, amplitudes, where present.
Figure 9—figure supplement 1
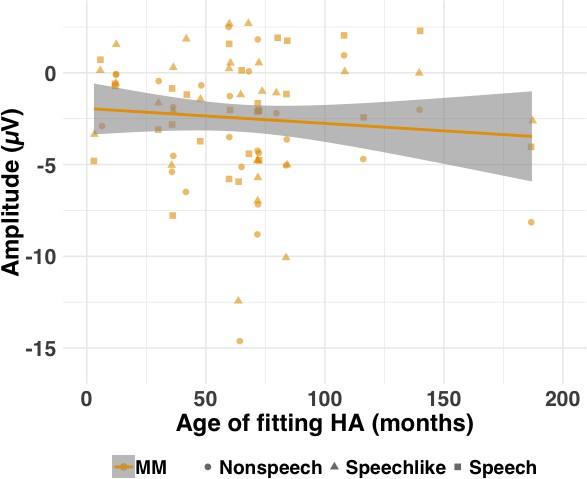
Amplitude (μV) of the MMN as a function of age of fitting with hearing aids (in months).
Individual (shapes) data are shown for each condition (nonspeech = circles; speech-like = triangles, speech = squares) for the MM group. Shaded lines represent the 95% confidence interval. Note that the age at which children with MMHL were first fit with their hearing aids was correlated with BEPTA thresholds (r = −0.546, df = 28, p=0.002); That is, children with lower (better) BEPTA thresholds tended to receive their hearing aids later. Therefore, a partial correlation between MMN amplitude and age of first hearing aid fitting was computed, with BEPTA threshold as a covariate. This partial correlation failed to reach significance (pr = 0.246, df = 28, p=0.190).
Figure 10

Grand average waveforms at Cz (longitudinal study).
Grand averages are shown for standards (black), large deviants (red), and small deviants (blue) for each condition (nonspeech, speech-like, speech) and subgroup (MM-Y, MM-YO, MM-O, and NH-O). Note that the MM-Y plots present the grand average waveforms only for those participants from the cross-sectional study who participated in the longitudinal follow-up (n = 13); Therefore, this represents a different subset from those in Figure 3. Periods of the 100–400 ms (MMN) or 400–600 ms (LDN) post-stimulus epoch where a significant (p<0.01 for>20 ms consecutively) MMR was observed in the grand average are shown by horizontal lines above the waveforms, as a function of deviant type. Whereas the MM-YO subgroup obtained a significant MMN in the nonspeech and speech conditions when they were younger (MM-Y subgroup), they failed to show an MMN in the nonspeech condition six years later (MM-YO subgroup). MMN amplitude for the MM-YO subgroup was significantly smaller than that of the MM-Y subgroup across conditions, and significantly smaller than that of the NH-O subgroup (see text for details).
Figure 11 with 1 supplement
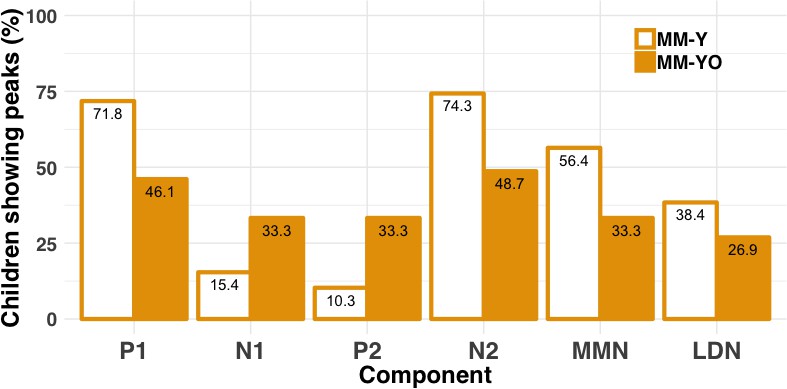
Percentages of the MM-Y and MM-YO subgroups showing present LAER components (P1, N1, P2, and N2) and MMN/LDN responses (longitudinal study).
Percentages are shown for the MM-YO group at Time 1 (MM-Y) and Time 2 (MM-YO) for each component (P1, N1, P2, N2) and response (MMN and LDN). Percentages are averaged across the three conditions (nonspeech, speech-like, speech). Children in the MM-YO subgroup were less likely to show P1 or N2 components, and more likely to show P2 components, at Time 2 relative to Time 1.
Figure 11—figure supplement 1
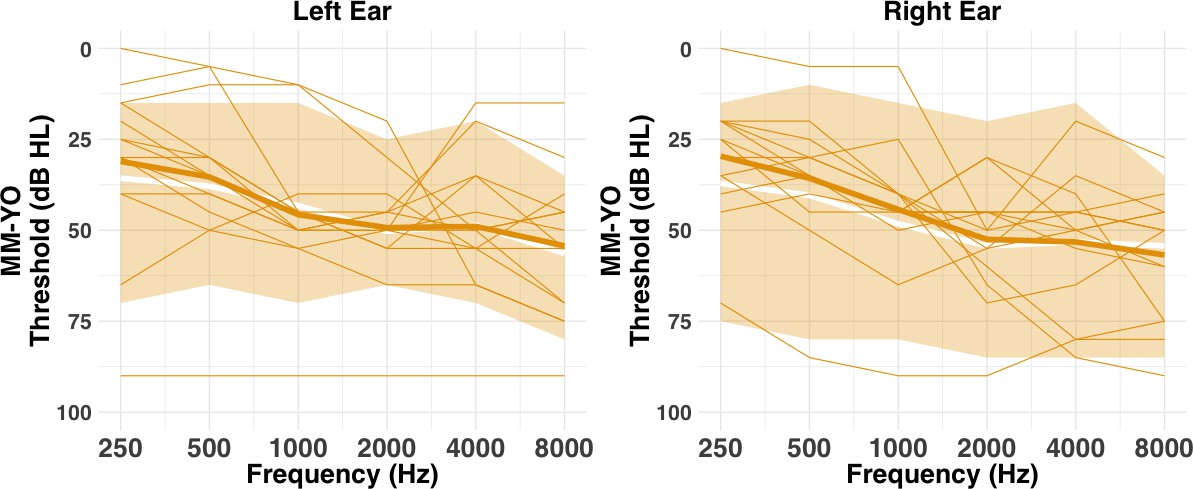
Left and right ear panels: individual audiograms for each child from the MM-YO group (lines) at Time 2 (longitudinal study), with the thicker orange line indicating the group mean.
This can be compared to the range (shaded area) and mean (white line) threshold of their younger selves (i.e. at Time 1; cross-sectional study).
Author response image 1

Tables
Table 1
Mean (SD) participant characteristics for the NH and MM groups and Y and O age bands (cross-sectional study)
https://doi.org/10.7554/eLife.46965.003| Younger (Y) | Older (O) | |||
|---|---|---|---|---|
| Variable | NH-Y (n = 26) | MM-Y (n = 23) | NH-O (n = 18) | MM-O (n = 23) |
| Demographics | ||||
| Age (years)a | 10.1 (1.0) | 9.6 (1.3) | 13.6 (1.2) | 13.2 (1.0) |
| Nonverbal IQ (T score)b | 60.4 (10.0) | 58.3 (9.2) | 61.0 (5.8) | 53.0 (7.5) |
| Maternal education (years) | 20.4 (2.3) | 19.3 (2.7) | 20.6 (3.6) | 19.3 (2.7) |
| Audiometry | ||||
| BEPTA threshold (dB HL)b | 8.07 (4.4) | 44.1 (10.8) | 6.9 (4.3) | 42.6 (13.3) |
| WEPTA threshold (dB HL)b | 11.2 (5.4) | 50.7 (12.6) | 9.8 (4.4) | 46.5 (12.9) |
| MePTA threshold (dB HL)b | 9.2 (5.0) | 49.4 (10.1) | 7.8 (4.3) | 46.9 (13.5) |
| Hearing loss history | ||||
| Age of detection (months) | 49.9 (25.1) | 59.0 (44.1) | ||
| Hearing aids (n; %) | 23; 100% | 18; 78.2% | ||
| Age of aiding (months) | 59.4 (26.8) | 69.6 (56.3) | ||
-
Note. NH = age-matched normally hearing control group; MM = mild-to-moderate SNHL group; Y = younger; O = older; Age = mean age (years) at session 1 and session 2; Nonverbal IQ = T score on Block Design subtest of the Wechsler Abbreviated Scale of Intelligence (Wechsler, 1999); Maternal education = age (years) at which mother left full-time education; BEPTA = better-ear pure-tone average across octave frequencies 0.25–4 kHz; WEPTA = worse-ear PTA across octave frequencies 0.25–4 kHz; MePTA = Mean PTA across octave frequencies 0.25–8 kHz for left and right ears; Age of detection = age (months) at which SNHL was detected; Age of aiding = age (months) at which hearing aids were first fitted. Significant main effects of age band, group, and their interaction are denoted by a, b and c respectively (see Cross-sectional study, Participants, for details).
Table 2
Mean (SD) participant characteristics for the four subgroups (MM-Y, MM-YO, NH-O and MM-O; longitudinal study)
https://doi.org/10.7554/eLife.46965.016| Younger (Y) | Older (O) | |||
|---|---|---|---|---|
| Variable | MM-Y (n = 13) | MM-YO (n = 13) | NH-O (n = 18) | MM-O (n = 23) |
| Demographics | ||||
| Age (years) | 9.5 (1.3)a | 14.8 (1.4)b | 13.6 (1.2)c | 13.2 (1.0)c |
| Nonverbal IQ (T score) | 59.6 (10.2) | - | 61.0 (5.8) | 53.0 (7.5) |
| Maternal education (years) | 19.2 (2.8) | 19.2 (2.8) | 20.6 (3.6) | 19.3 (2.7) |
| Audiometry | ||||
| BEPTA threshold (dB HL) | 40.1 (9.0)a | 35.7 (9.0)a | 6.9 (4.3)b | 42.6 (13.3)a |
| WEPTA threshold (dB HL) | 49.8 (14.1)a | 49.8 (18.2)a | 9.8 (4.4)b | 46.5 (13.0)a |
| MePTA threshold (dB HL)b | 46.7 (9.3)a | 44.9 (11.4)a | 8.8 (4.5)b | 45.5 (12.4)a |
| Hearing loss history | ||||
| Age of detection (months) | 50.6 (23.6) | - | - | 59.0 (44.1) |
| Hearing aids (n; %) | 13; 100% | - | - | 18; 78.2% |
| Age of aiding (months) | 63.6 (23.2) | - | - | 69.6 (56.3) |
-
Note. MM = mild-to-moderate SNHL group; Y = younger; MM-YO = children from the MM-Y subgroup from the cross-sectional study (Time 1) who were followed-up as part of the longitudinal study (Time 2). NH = normally hearing control group; O = older; Age = mean of session 1 and session 2 (years); Nonverbal IQ = T score on Block Design subtest of the Wechsler Abbreviated Scale of Intelligence (Wechsler, 1999); Maternal education = age (years) at which mother left full-time education; BEPTA = better-ear pure-tone average across octave frequencies 0.25–4 kHz; WEPTA = worse-ear pure-tone average across octave frequencies 0.25–4 kHz; MePTA = Mean PTA across octave frequencies 0.25–8 kHz for left and right ears; Age of detection: age (months) at which SNHL was detected (MM subgroups only); Age of aiding = age (months) at which hearing aids were first fitted. Subgroups that differed significantly from one another on a given variable are denoted by a, b and c (see Longitudinal study, Participants).
Appendix 1—table 1
Results of the logistic regression analyses for presence of LAER and MMRs components (cross-sectional study).
https://doi.org/10.7554/eLife.46965.021| Component | Effects | χ2 | Df | p | R2m |
|---|---|---|---|---|---|
| LAERs | Age band | 2.60 | 1 | .106 | .014 |
| Group | 96.6 | 1 | < .001 | .125 | |
| Component | 225.8 | 3 | < .001 | .250 | |
| Age band × Component | 9.58 | 3 | .022 | .011 | |
| MMN | Group | 7.39 | 1 | .007 | .033 |
| LDN | Group | 1.33 | 1 | .247 | .007 |
-
Note. The best fitting models for LAERs and MMRs presence were all an acceptable fit (LAERs [AIC = 1181, R2c=0.335]; MMN [AIC = 369.4, R2c=0.033]; LDN [AIC = 243.2, R2c=0.009]). Effects that were significant are shown in boldface.
Appendix 1—table 2
Periods (>20 ms) of the 100–600 ms post-stimulus epoch (in ms) that contained a significant MMN (100–400 ms) or LDN (400–600 ms) for each Condition (nonspeech, speech-like, speech), Deviant type (small and large), Group (NH and MM), and Age band (Y and O) (cross-sectional study)
https://doi.org/10.7554/eLife.46965.022| Younger (Y) | Older (O) | ||||
|---|---|---|---|---|---|
| Condition | Deviant | NH-Y (n = 26) | MM-Y (n = 23) | NH-O (n = 18) | MM-O (n = 23) |
| Nonspeech | Small | - | 228–262 | - | - |
| Large | 126–230 | 154–258 | 120–210 322–348 | - | |
| Speech-like | Small | 252–278 | - | - | - |
| Large | 212–302 400–442 | 242–370 564–592 | 172–284 408–470 | - | |
| Speech | Small | - | - | - | - |
| Large | 226–344 404–546 | 204–242 272–548 | 230–298 428–462 490–522 | 500–580 | |
-
Note. Presence/absence of the MMR was determined through point-to-point comparison of the differential wave amplitudes to calculate the latency period over which the waveforms were significantly different from zero. Unilateral t-tests were computed within the 100–400 and 400–600 ms post-stimulus-onset time windows with a sampling rate of 500 Hz. An MMN or LDN was considered present when p<0.01 for>20 ms at adjacent time-points (see text).
Appendix 1—table 3
Results of the linear mixed-effect analyses for the amplitude of MMN and LDN (cross-sectional study).
https://doi.org/10.7554/eLife.46965.023| Component | Effects | χ2 | Df | p | R2m |
|---|---|---|---|---|---|
| MMN | Group | 14.48 | 1 | < .001 | .080 |
| Age band | 5.31 | 1 | .021 | .036 | |
| Condition | 7.73 | 2 | .021 | .033 | |
| Age band × Group | 3.29 | 1 | .069 | .013 | |
| LDN | Group | 1.95 | 1 | .162 | .010 |
-
Note. The best fitting models for MMN and LDN amplitude were both an acceptable fit (MMN [AIC = 1418.1, R2cc0.27]; LDN [AIC = 933.4, R2cc0.010]).
Appendix 1—table 4
Results of the linear mixed-effect analyses for the amplitude and latency of each LAER component (P1, N1, P2, N2), where present (cross-sectional study).
https://doi.org/10.7554/eLife.46965.024| Amplitude | Latency | |||||||||
|---|---|---|---|---|---|---|---|---|---|---|
| Component | Effects | χ2 | Df | p | R2m | Effects | χ2 | Df | p | R2m |
| P1 | Condition | 22.78 | 2 | <0.001 | .058 | Group | 15.29 | 1 | < .001 | .055 |
| Condition | 6.32 | 2 | .012 | .037 | ||||||
| N1 | Age band | 0.97 | 1 | .324 | .011 | Age band | 7.87 | 1 | .005 | .057 |
| Condition | 6.67 | 2 | .035 | .048 | Condition | 19.88 | 2 | < .001 | .157 | |
| Age band × Condition | 9.49 | 2 | .008 | .063 | ||||||
| P2 | Age band | 7.07 | 1 | .008 | .103 | Group | 3.80 | 1 | .051 | .023 |
| Condition | 5.95 | 2 | .051 | .027 | Condition | 10.14 | 2 | .006 | .055 | |
| N2 | Group | 15.69 | 1 | < .001 | .094 | Condition | 47.85 | 2 | < .001 | .082 |
| Age band | 13.95 | 1 | < .001 | .110 | ||||||
| Condition | 32.16 | 2 | < .001 | .082 | ||||||
| Group × Condition | 6.45 | 1 | .011 | .000 | ||||||
-
Note. The best fitting models for LAER component amplitude and latency were all an acceptable fit (Amplitude: P1 [AIC = 855.18, R2c=0.527], N1 [AIC = 496.71, R2c=0.439], P2 [AIC = 431.23, R2c=0.627], N2 [AIC = 1072.4, R2c=0.603]; Latency: P1 [AIC = 1967.5, R2c=0.271], N1 [AIC = 958.23, R2c=0.230, P2 [AIC = 797.32, R2c=0.886] and N2 [AIC = 2176.2, R2c=0.45]). Effects that were significant are shown in boldface.
Appendix 1—table 5
Results of the logistic regression analyses (MM group only) for the effect of BEPTA on presence of LAER components and MMRs (cross-sectional study).
https://doi.org/10.7554/eLife.46965.025| Component | Effects | χ2 | Df | p | R2m |
|---|---|---|---|---|---|
| LAER | Component | 118.17 | 3 | < .001 | .240 |
| BEPTA | 57.43 | 1 | < .001 | .132 | |
| BEPTA × Component | 9.30 | 3 | .025 | .001 | |
| MMN | BEPTA | 5.36 | 1 | .020 | .048 |
| LDN | BEPTA | 0.34 | 1 | .559 | .070 |
| Age band | 0.23 | 1 | .633 | .069 | |
| Age band × BEPTA | 4.23 | 1 | .039 | .065 |
-
Note. The best fitting models for LAER, MMN and LDN amplitude were all an acceptable fit (LAER [AIC = 600.12; R2c=0.346]; MMN [AIC = 188.9, R2c=0.05]; LDN [AIC = 122.1, R2c=0.073]).
Appendix 1—table 6
Results of the linear mixed-effect analyses (MM group only) for the amplitude and latency of each LAER component (P1, N1, P2, N2) where present, and for MMN and LDN amplitude for all children (cross-sectional study).
https://doi.org/10.7554/eLife.46965.026| Amplitude | Latency | |||||||||
|---|---|---|---|---|---|---|---|---|---|---|
| Component | Effects | χ2 | Df | p | R2m | Effects | χ2 | Df | p | R2m |
| P1 | BEPTA | 0.76 | 1 | .380 | .055 | BEPTA | .372 | 1 | .541 | .039 |
| Condition | 7.89 | 2 | .019 | .101 | Age band | .061 | 1 | .804 | .035 | |
| BEPTA × Condition | 6.48 | 2 | .039 | .044 | BEPTA × Age band | 2.94 | 1 | .086 | .034 | |
| N1 | BEPTA | .32 | 1 | .572 | .009 | BEPTA | 6.00 | 2 | .049 | .126 |
| Condition | 3.91 | 1 | .047 | .080 | ||||||
| P2 | BEPTA | 2.14 | 1 | .153 | .091 | Condition | 4.72 | 2 | .094 | .037 |
| N2 | Age band | 9.16 | 2 | .010 | .064 | Condition | 8.73 | 2 | .013 | .071 |
| Condition | 4.80 | 1 | .028 | .069 | ||||||
| MMN | Age Band | 10.48 | 1 | .001 | .150 | |||||
| BEPTA | 8.45 | 1 | .003 | .115 | ||||||
| LDN | Condition | 2.24 | 2 | .326 | .004 | |||||
-
Note. The best fitting models for LAER component amplitude and latency, and MMN amplitude were all an acceptable fit (Amplitude: P1 [AIC = 377.99, R2c = .45], N1 [AIC = 185.16, R2c = .24], P2 [AIC = 142.45, R2c = .75], N2 [AIC = 480.39, R2c = .43], MMN [AIC = 304.35, R2c = .302] and LDN [AIC = 167.35, R2c = .005]; Latency: P1 [AIC = 876.47, R2c = .17], N1 [AIC = 357.94, R2c = .23], P2 [AIC = 268.42, R2c = .91], and N2 [AIC = 483.19, R2c = .40]). Effects that were significant are shown in boldface
Appendix 1—table 7
Periods of the 100–600 ms post-stimulus epoch (in ms) that contained a significant (p<0.01) MMN (100–400 ms) or LDN (400–600 ms) for each Condition (nonspeech, speech-like, speech), Deviant type (small vs. large), Group (CA vs. MM), and Age band (Y vs. O) (longitudinal study).
https://doi.org/10.7554/eLife.46965.027| Younger (Y) | Older (O) | ||||
|---|---|---|---|---|---|
| Condition | Deviant | MM-Y (n = 13) | MM-YO (n = 13) | MM-O (n = 23) | NH-O (n = 18) |
| Nonspeech | Small | - | - | - | - |
| Large | 162–260 378–400 566–600 | - | - | 120–220 288–370 | |
| Speech-like | Small | - | - | - | - |
| Large | - | - | - | 162–280 424–494 | |
| Speech | Small | - | - | - | - |
| Large | 310–370 | 296–368 412–476 | 468–576 | 236–326 |
-
Note. Differences in the values obtained between for the MM-Y groups in Table 2 and here are due to slightly different pre-processing strategies, together with a change in MM-Y group sample between Time 1 (n = 23) and Time 2 (n = 13).
Appendix 1—table 8
Results of the logistic and linear regression analyses for MMN presence/absence and amplitude (longitudinal study).
https://doi.org/10.7554/eLife.46965.028| Logistic regression | Linear regression | |||||||||
|---|---|---|---|---|---|---|---|---|---|---|
| Type | Effects | χ2 | Df | p | R2m | Effects | χ2 | Df | p | R2m |
| Within-subject | Group | 4.24 | 76 | .039 | .065 | Group | 4.80 | 1 | .028 | .060 |
| Between-subject | Group | 17.0 | 159 | < .001 | .124 | Group | 23.2 | 2 | < .001 | .168 |
| Condition | 10.01 | 3 | .018 | .041 | ||||||
-
Note: Within-subject analyses included MM-YO and MM-Y as groups. Between-subject analyses included MM-YO, MM-O and NH-O. The best fitting models for MMN presence/absence and amplitude were all an acceptable fit (Presence: Within-subject [AIC = 107.1, R2c = .06], Between-subject [AIC = 212.98, R2c = .12]; Amplitude: Within-Subject [AIC = 398.2, R2c = .06], Between-subject [AIC = 791.0, R2c = .315]). Effects that were significant are shown in boldface.
Appendix 1—table 9
Latencies (ms) of the MMN/LDN evoked by large deviants for the NH group for each age band and condition (cross-sectional and longitudinal studies).
https://doi.org/10.7554/eLife.46965.029| MMN | LDN | ||||
|---|---|---|---|---|---|
| Study | Condition | Y | O | Y | O |
| Cross-sectional | Nonspeech | 164 | 160 | ||
| Speech-like | 264 | 232 | 430 | 444 | |
| Speech | 284 | 262 | 486 | 510 | |
| Longitudinal | Nonspeech | - | 168 | ||
| Speech-like | - | 230 | - | 484 | |
| Speech | - | 266 | - | 508 | |
Download links
A two-part list of links to download the article, or parts of the article, in various formats.
Downloads (link to download the article as PDF)
Open citations (links to open the citations from this article in various online reference manager services)
Cite this article (links to download the citations from this article in formats compatible with various reference manager tools)
Functional brain alterations following mild-to-moderate sensorineural hearing loss in children
eLife 8:e46965.
https://doi.org/10.7554/eLife.46965


