Cryo-EM structures and functional characterization of murine Slc26a9 reveal mechanism of uncoupled chloride transport
- University of Zurich, Switzerland
Figures
Figure 1 with 3 supplements
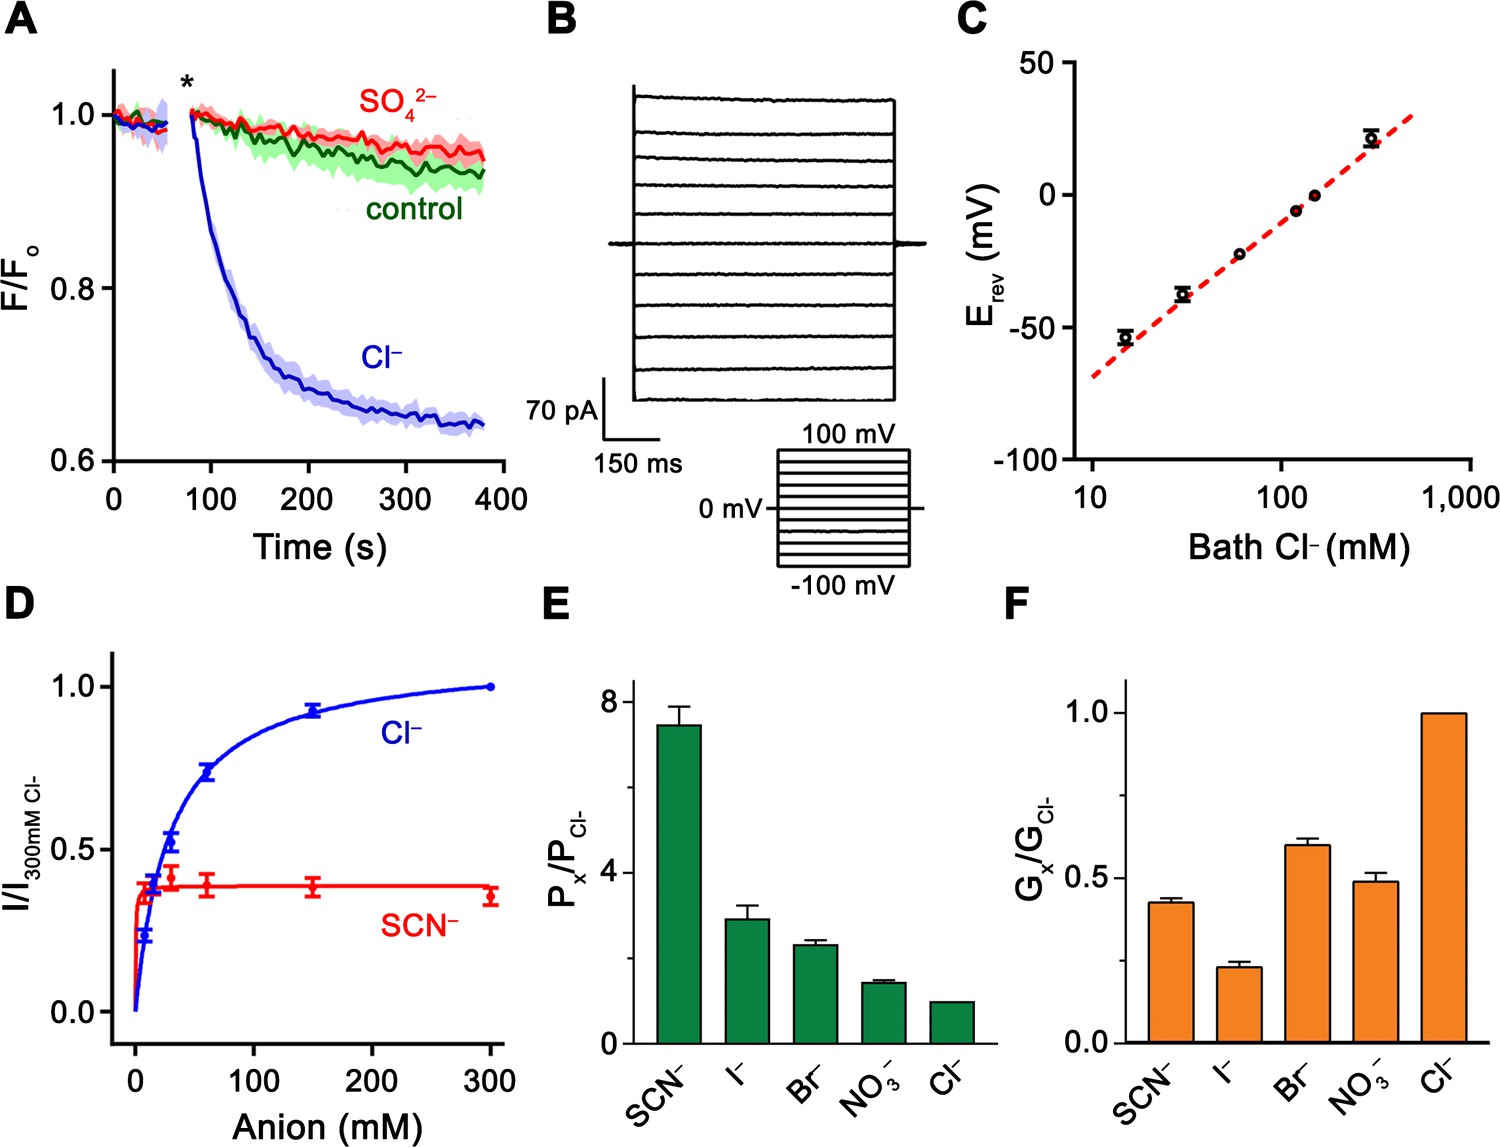
Functional properties of Slc26a9.
(A) Cl– transport of Slc26a9T reconstituted into proteoliposomes, monitored by the fluorescence change of the pH gradient-sensitive fluorophore ACMA. (*) Indicates addition of the H+ ionophore CCCP, which allows counterion movement and electrogenic Cl– transport to proceed. Green trace (control) corresponds to liposomes not containing any protein in the presence of an inward Cl– gradient, red trace (SO42–) to proteoliposomes exposed to external SO42– and blue trace (Cl–) to proteoliposomes exposed to external Cl–. Traces show mean of three technical replicates. (B) Representative current trace recorded from excised patches from HEK293T cells expressing Slc26a9T at symmetrical 150 mM Cl–. Inset shows voltage protocol. (C) Reversal potentials at 150 mM extracellular NaCl and varying intracellular NaCl concentrations recorded from inside-out patches (PNa+/PCl–=0.02). Red line corresponds to the Cl– Nernst potential. Presented data is the mean of 5 biological replicates, except for 300 mM, for which n = 3. (D) Conductance–concentration relationships of anion transport across Slc26a9T. Data were recorded at −100 mV from inside-out patches with a pipette solution containing 7.5 mM Cl– and varying intracellular Cl– (blue) or SCN– (red) concentrations. Km (Cl–)=29.5 mM; Km (SCN–)=0.5 mM; n = 5, errors are s.e.m.. (E) Permeabilities and (F) conductance ratios (recorded at −100 mV) were obtained from bi-ionic substitution experiments. Biological replicates for Px/PCl and Gx/GCl: Cl–, n = 10; Br–, n = 10; NO3–, n = 9; SCN–, n = 8; I–, n = 6. C-E, Errors are s.e.m.
Figure 1—figure supplement 1
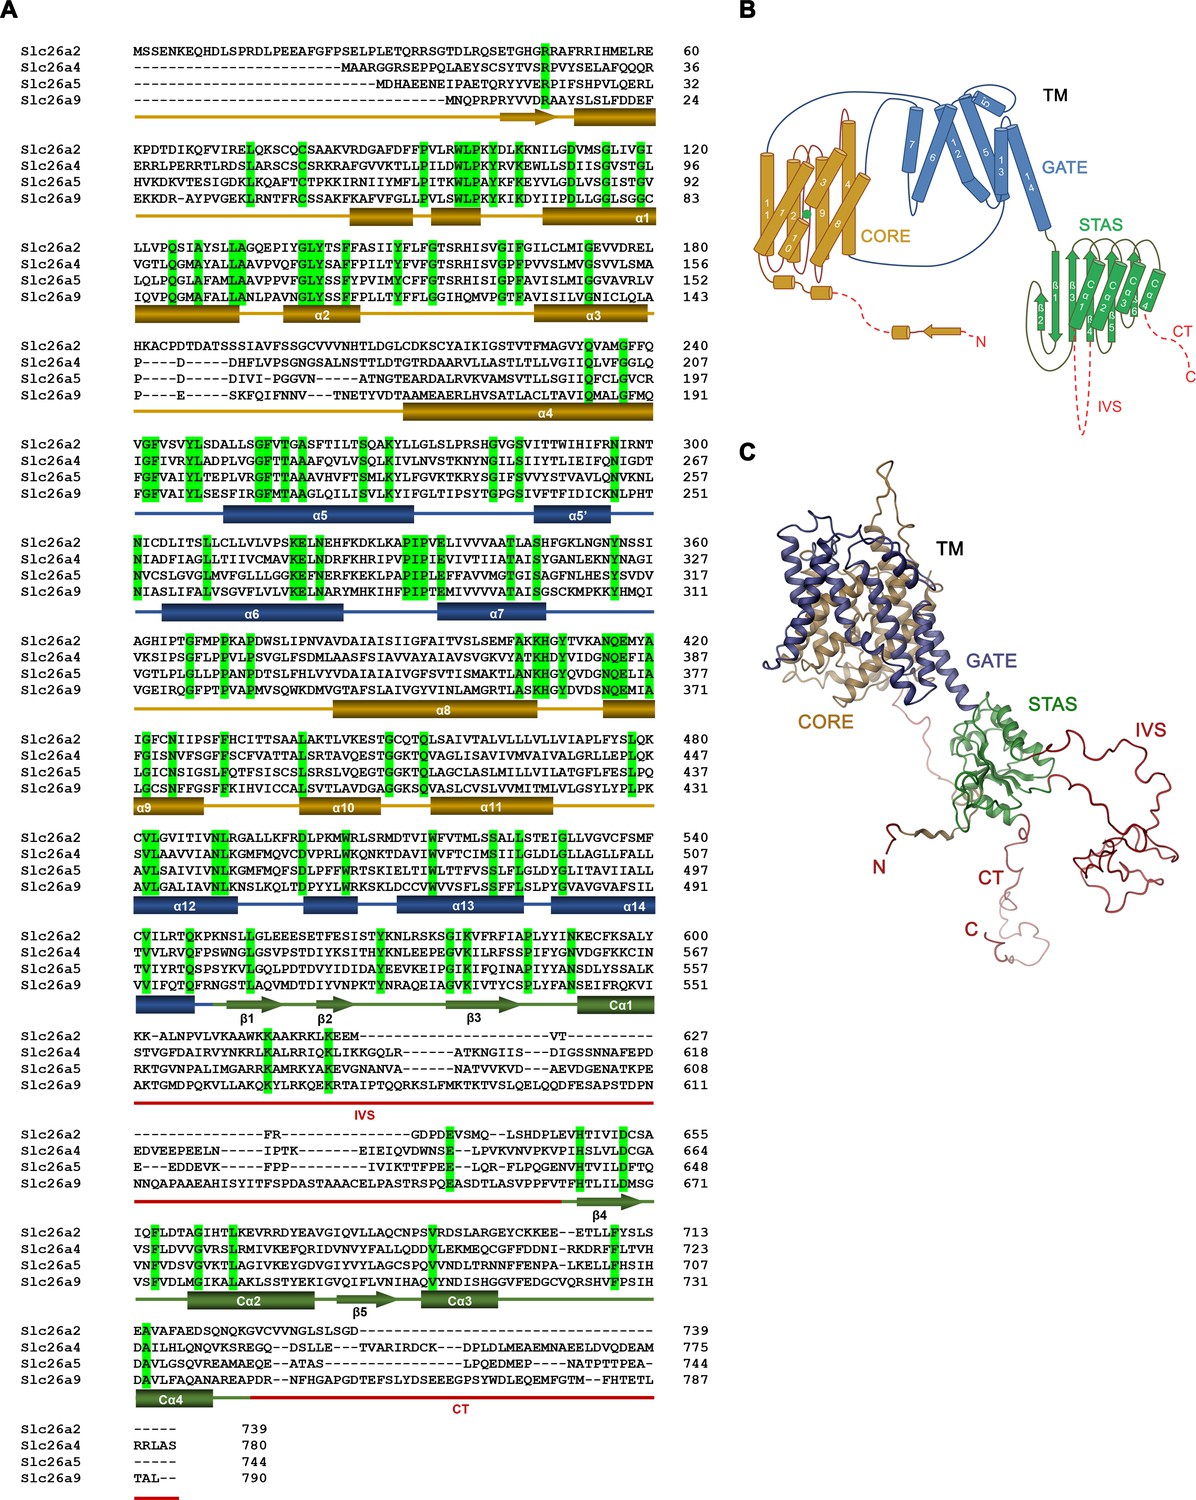
Sequence alignment and topology.
(A) Sequence alignment of the murine Slc26 paralogs Slc26a2 (NP_031911.1), Slc26a4 (NP_035997.1), Slc26a5 (NP_109652.3), and Slc26a9 (NP_796217.2). Identical residues are highlighted in green, secondary structure elements of Slc26a9 are indicated below. Truncated regions are underlined in red. IVS – intervening sequence; CT – C terminus (B) Schematic representation of the topology of Slc26a9. (C) Ribbon representation of the model of a single Slc26a9 monomer, containing the disordered regions that were removed in Slc26a9T.
Figure 1—figure supplement 2
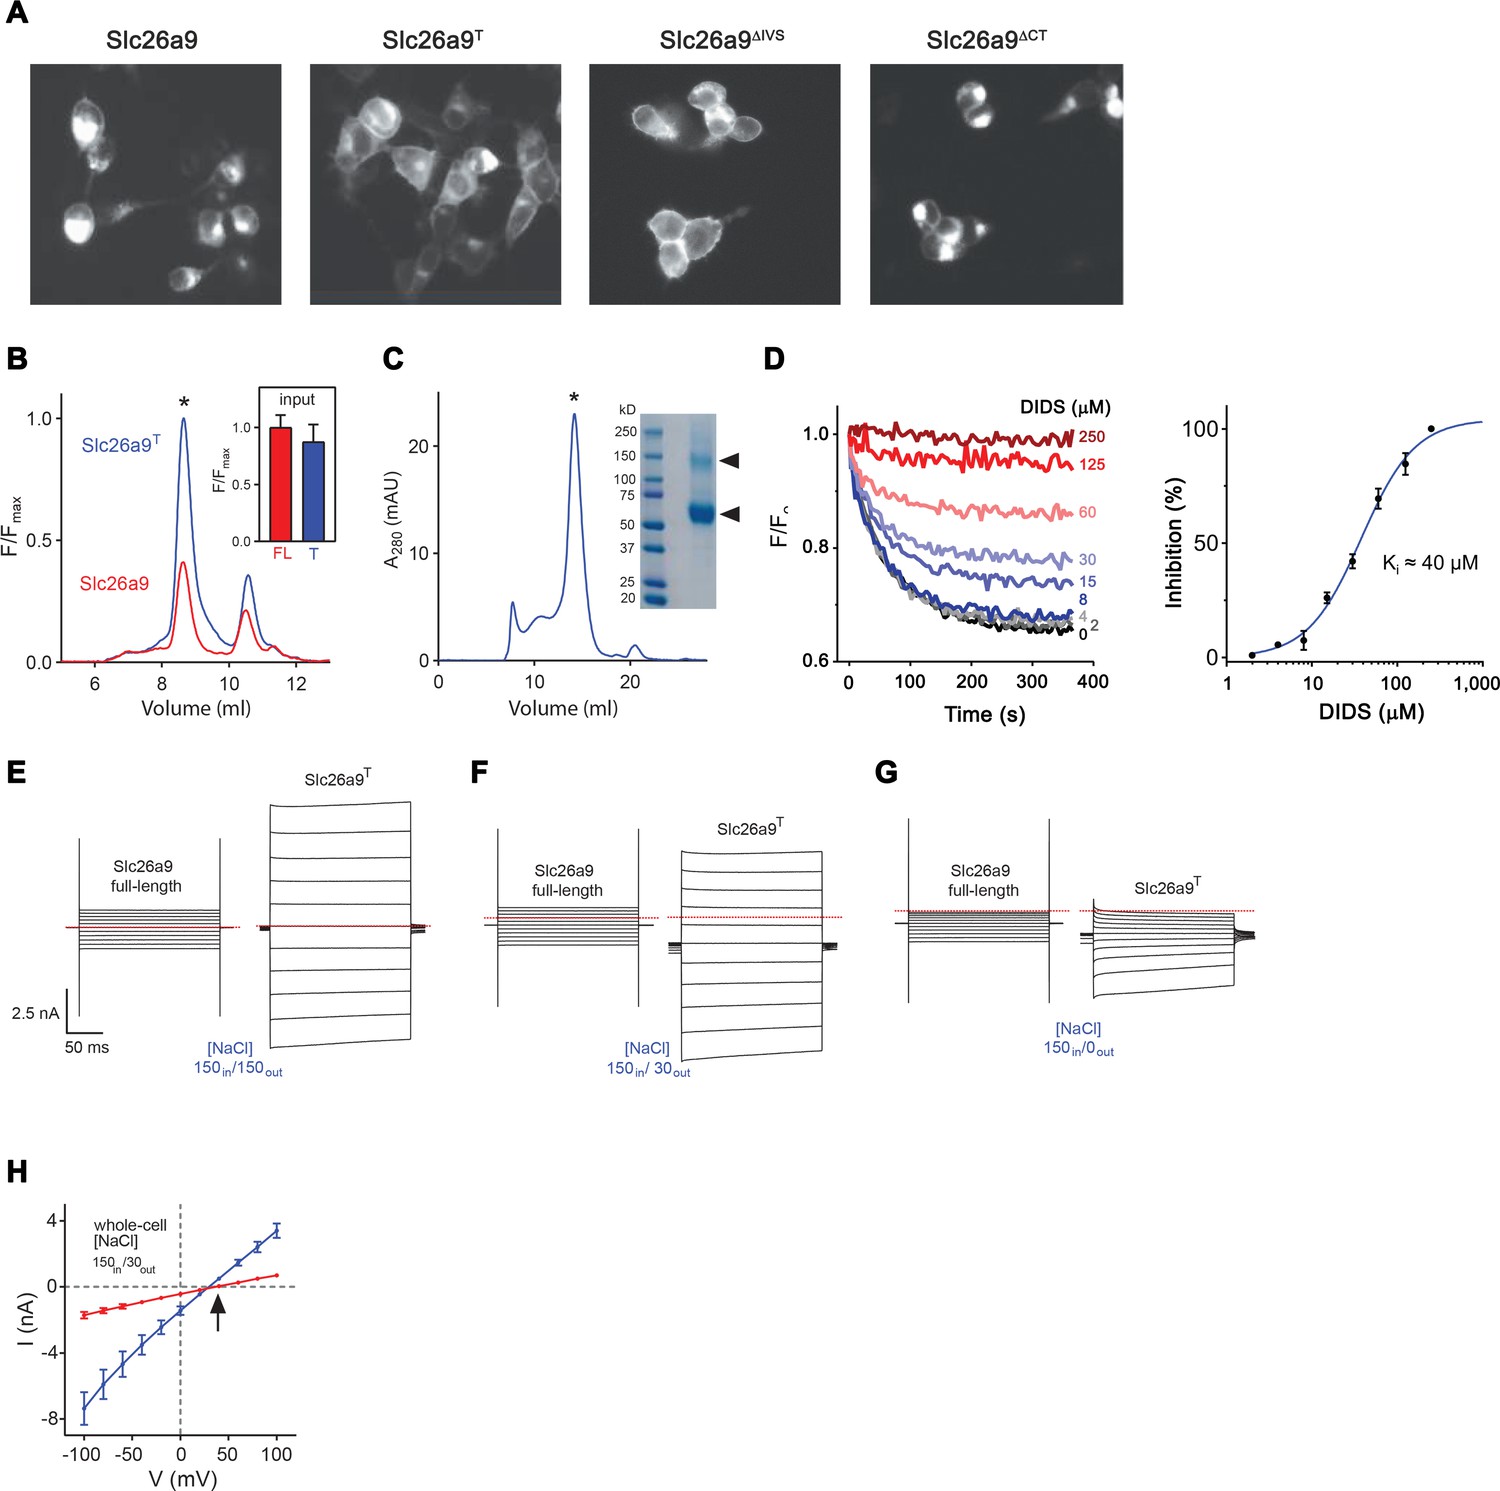
Expression, purification and functional characterization of Slc26a9T.
(A) Fluorescence-microscopy images of HEK293T cells transfected with different Slc26a9 constructs (From left to right: full-length Slc26a9, the ΔIVSΔCT truncation construct Slc26a9T, the ΔIVS truncation construct Slc26a9ΔIVS and the ΔCT truncation construct Slc26a9ΔCT). Cells transfected with the two constructs Slc26a9T and Slc26a9ΔIVS show greater apparent surface expression and less intracellular retention for to the full-length protein Slc26a9 or Slc26a9ΔCT. (B) Fluorescence size-exclusion chromatograms (FSEC) for soluble detergent extracts of vYFP-tagged Slc26a9 (red) and Slc26a9T (blue) demonstrating a considerably larger peak for Slc26a9T (asterisk). The inset shows bulk fluorescence readings of crude extracts (FL, full-length Slc26a9, n = 3; T, Slc26a9T, n = 3) before removal of aggregated material and loading onto the HPLC, indicating that both samples had comparable levels of protein prior to clarification and FSEC analysis, and implying that Slc26a9T can be more efficiently extracted than full-length Slc26a9. (C) Size-exclusion chromatogram of Slc26a9T purified in GDN detergent, from a Superose 6 10/300 column. The asterisk indicates the peak corresponding to Slc26a9T. The inset shows an SDS-PAGE gel of purified Slc26a9T. Triangles indicate Slc26a9T protein, with the upper band consisting of a stable dimer fraction which tolerates the harsh electrophoretic environment. (D) Cl– transport in Slc26a9T-reconstituted proteoliposomes shows dose-dependent inhibition by 4,4’-Diisothiocyanatostilbene-2,2’-disulfonic acid (DIDS). (Left) Example experiment, carried out similarly as in Figure 1A, except that proteoliposomes were pre-incubated with the indicated concentration of DIDS for 5 min. The plot shows measured ACMA fluorescence after addition of the H+ ionophore CCCP (300 nM) at 0 s. (Right) Data from three technical replicates was used to create a concentration-response plot, wherein the relative fluorescence quenching at t = 300 s was converted to percent inhibition. Error bars are s.e.m. (E–G) Whole-cell currents for Slc26a9 and Slc26a9T at symmetrical 150 mM NaCl (E), upon imposing a 5-fold NaCl gradient by decreasing the extracellular concentration to 30 mM NaCl (F), and upon extracellular perfusion in NaCl-free buffer containing 150 mM NMDG-methylsulfonate (G). Membrane voltage was stepped from −100 mV to +100 mV in 20 mV increments, with the red line indicating 0 mV. (H) Whole-cell current–voltage (I–V) relationships for Slc26a9 (red, n = 8) and Slc26a9T (blue, n = 5) in the presence of a 5-fold outward-directed NaCl gradient. The arrow indicates the reversal potential for chloride. Data are averages of the indicated number of independent biological replicates, and errors are s.e.m.
Figure 1—figure supplement 3
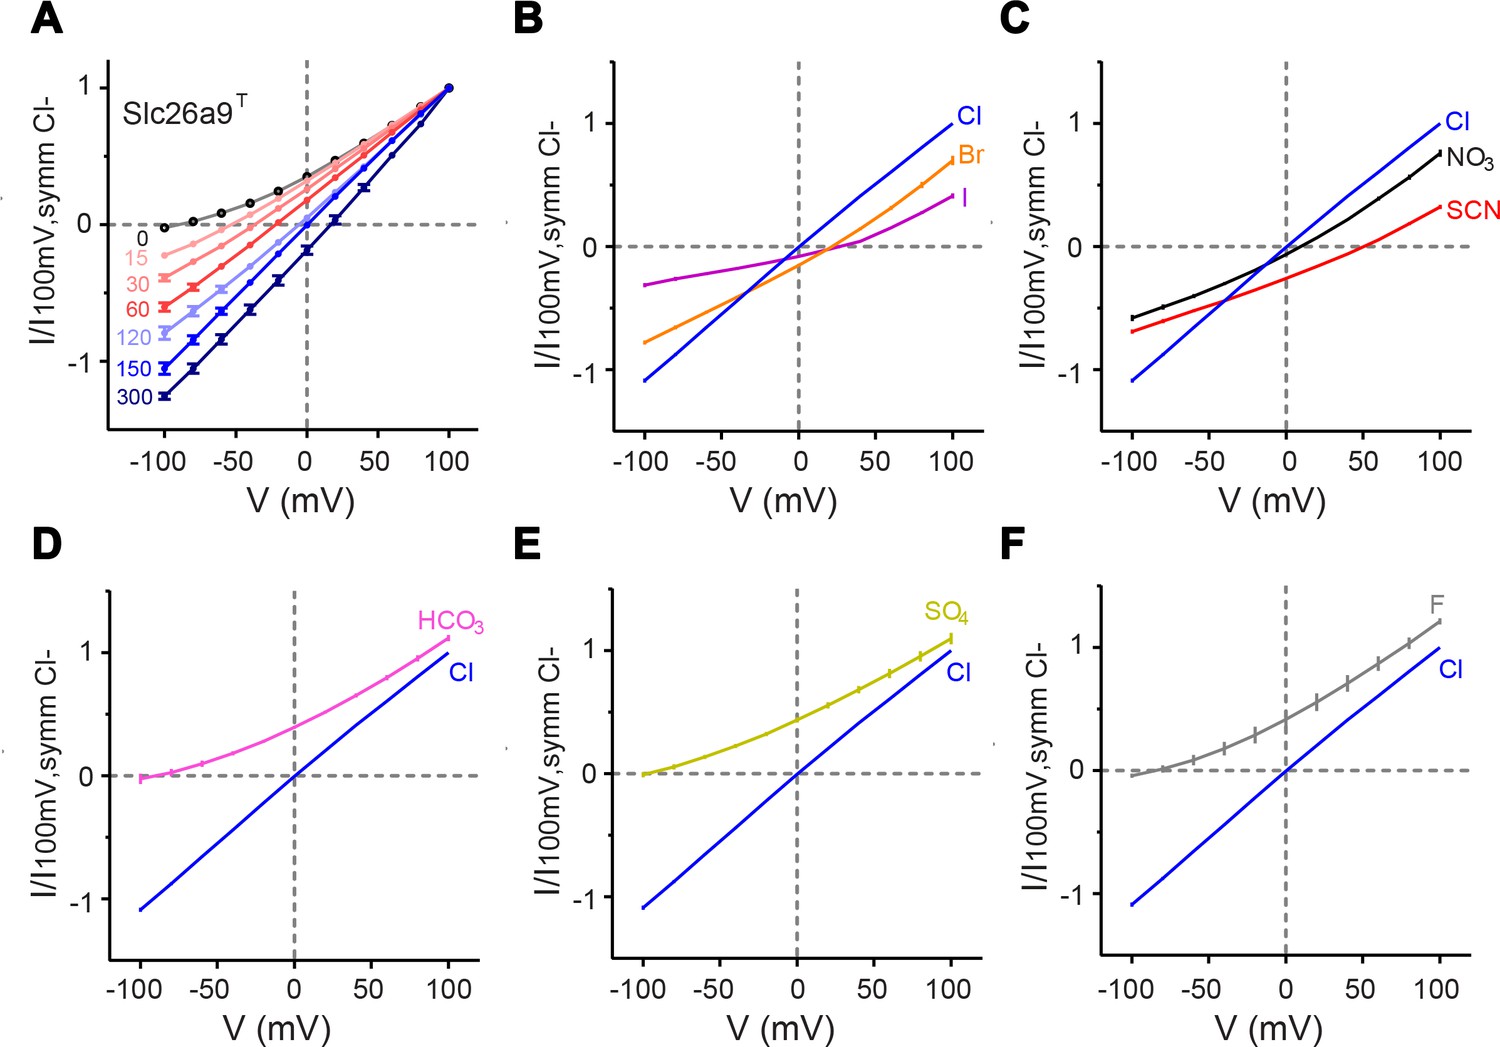
Functional properties of Slc26a9T.
(A) I–V relationships for excised inside-out patches from HEK293T cells expressing Slc26a9T-vYFP, under varying NaCl gradients. The perfusate (intracellular) NaCl concentration was varied from 0 to 300 mM, with a constant pipette (extracellular) NaCl concentration of 150 mM. Intracellular NaCl concentrations are indicated in the plot (0 mM, n = 6; 15, 30, 60, 150 mM n = 7; 120 mM, n = 6; 300 mM, n = 3). (B–F) Permeation properties of substitute intracellular anions. Bi-ionic I–V relationships for inside-out patches with pipette NaCl constant at 150 mM and intracellular Cl– replaced by 150 mM sodium salts of substitute anions. Each plot shows the reference I–V relation for symmetrical 150 mM NaCl (n = 10). (B) Br– (orange, n = 10) or I– (violet, n = 6) substitution. (C), NO3– (black, n = 9) or SCN– (red, n = 8) substitution. (D–F) Substitution by impermeant anions (K), HCO3– (pink, n = 6), (L), SO42– (chartreuse, n = 7), or (M), F– (gray, n = 4). Data shown in A-F are averages of the indicated number of independent biological replicates, and errors are s.e.m.
Figure 2 with 4 supplements

Slc26a9T structure.
(A) Cryo-EM density of Slc26a9T in the detergent GDN at 3.96 Å contoured at 5σ. Density corresponding to distinct subunits in the dimeric protein is colored in blue and red respectively. Residual density outside the protein region probably corresponding to detergent or lipids is colored in gray. The view is from within the membrane; the boundary of the bilayer is indicated. (B) Ribbon representation of Slc26a9T with subunits colored in blue and red. Protein dimensions are indicated. View is as in (A).
Figure 2—figure supplement 1
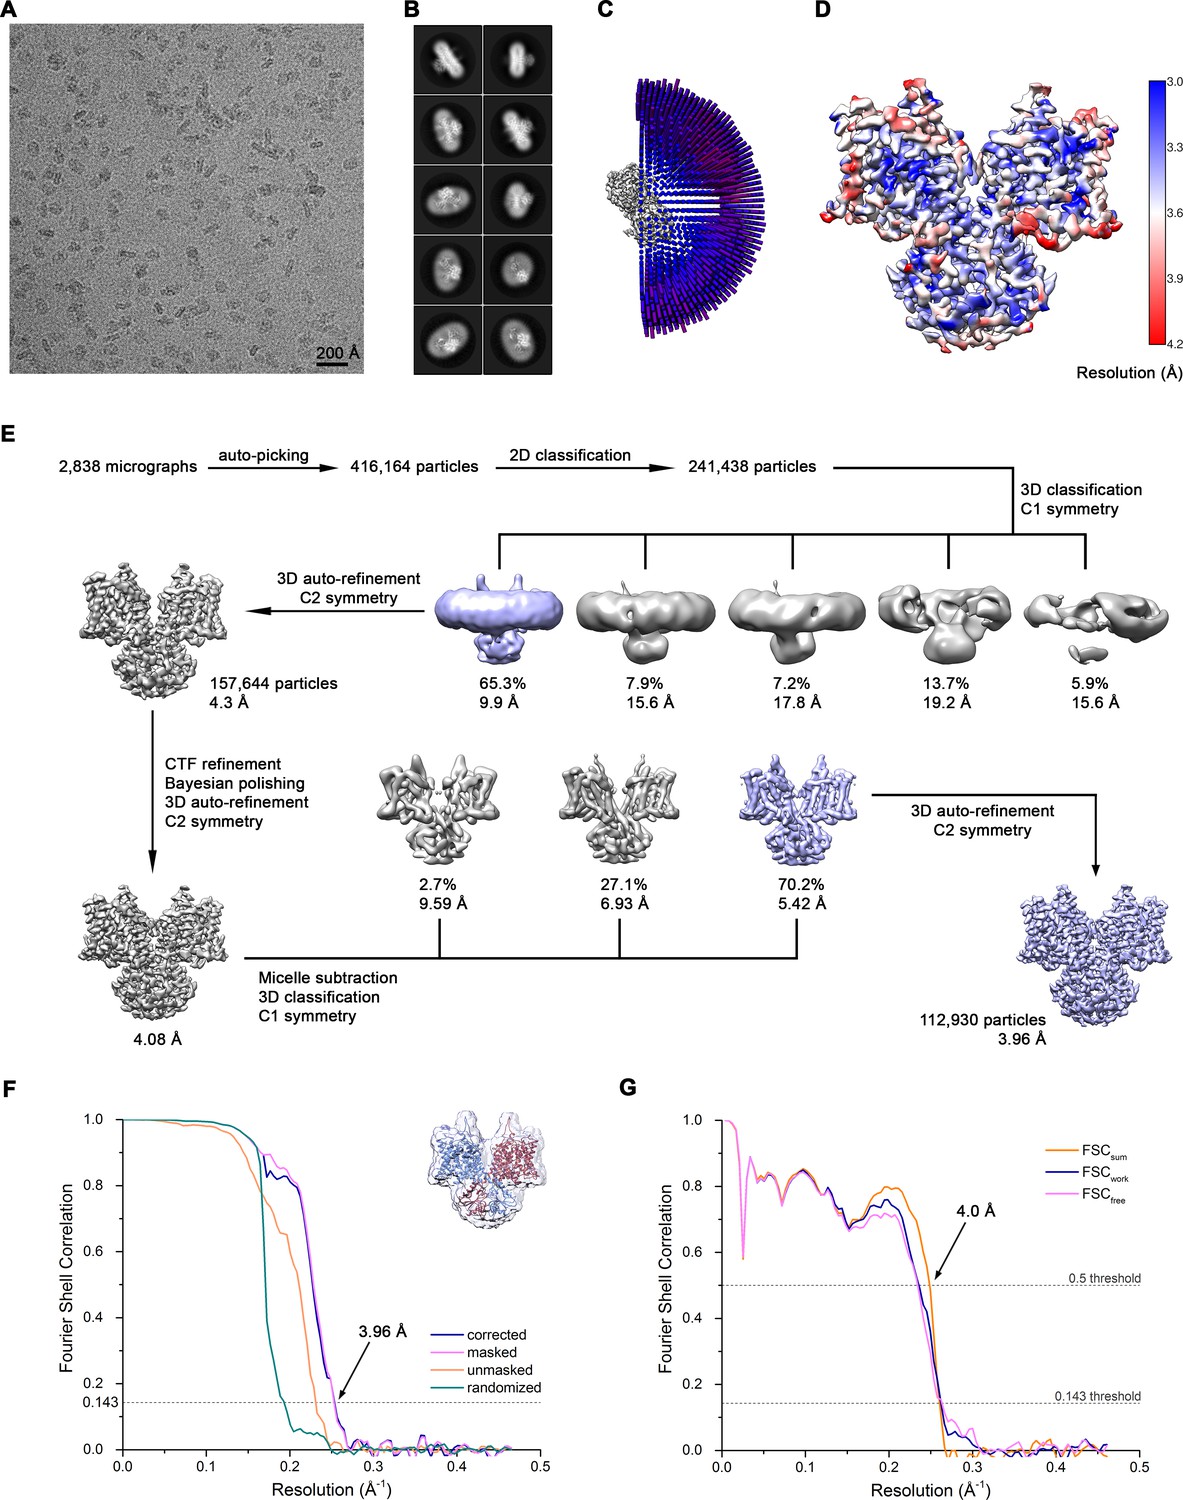
Cryo-EM reconstruction of Slc26a9T in detergent at 3.96 Å.
(A) Representative cryo-EM micrograph acquired with Titan Krios microscope. (B) 2D class averages of Slc26a9T. (C) Angular distribution plot of all particles included in the final C2-symmetrized reconstruction showing uniform orientations. The length and the color of the cylinders correspond to the number of particles with respective Euler angles. (D) Final 3D reconstruction colored according to local resolution. (E) The data processing workflow. Multiple rounds of 2D and non-symmetrized 3D classifications allowed to isolate a subset of homogenous particles that were further refined with C2 symmetry imposed. After performing per particle CTF refinement and Bayesian polishing, the remaining structural heterogeneity was segregated by performing the final 3D classification, where the orientations were kept fixed as in the consensus model and the symmetry was relaxed. Particles belonging to the predominant class were selected and used to generate the final model. The distribution of all particles (%) and the resolution of each class is indicated. (F) Fourier shell correlation (FSC) plot of the final refined unmasked (orange), masked (pink), phase-randomized (green) and corrected for mask convolution effects (blue) cryo-EM density map of Slc26a9T. The resolution at which the FSC curve drops below the 0.143 threshold is indicated. The inset shows the atomic model within the mask that was applied for calculations of the resolution estimates. (G) FSC plot of refined atomic models against the cryo-EM density maps of Slc26a9T in detergent at 3.96 Å (dataset 1). FSCsum (orange) is calculated for the full masked map and the model refined against the complete dataset, FSCwork (blue) is calculated for the masked half-map one and the shaken model refined against the dataset comprising the half map 1, FSCfree (pink) is calculated for the masked half-map two and the shaken model refined against the half map 1. FSC thresholds at 0.5 and 0.143 were used for FSCsum and FSCwork/FSCfree, respectively.
Figure 2—figure supplement 2
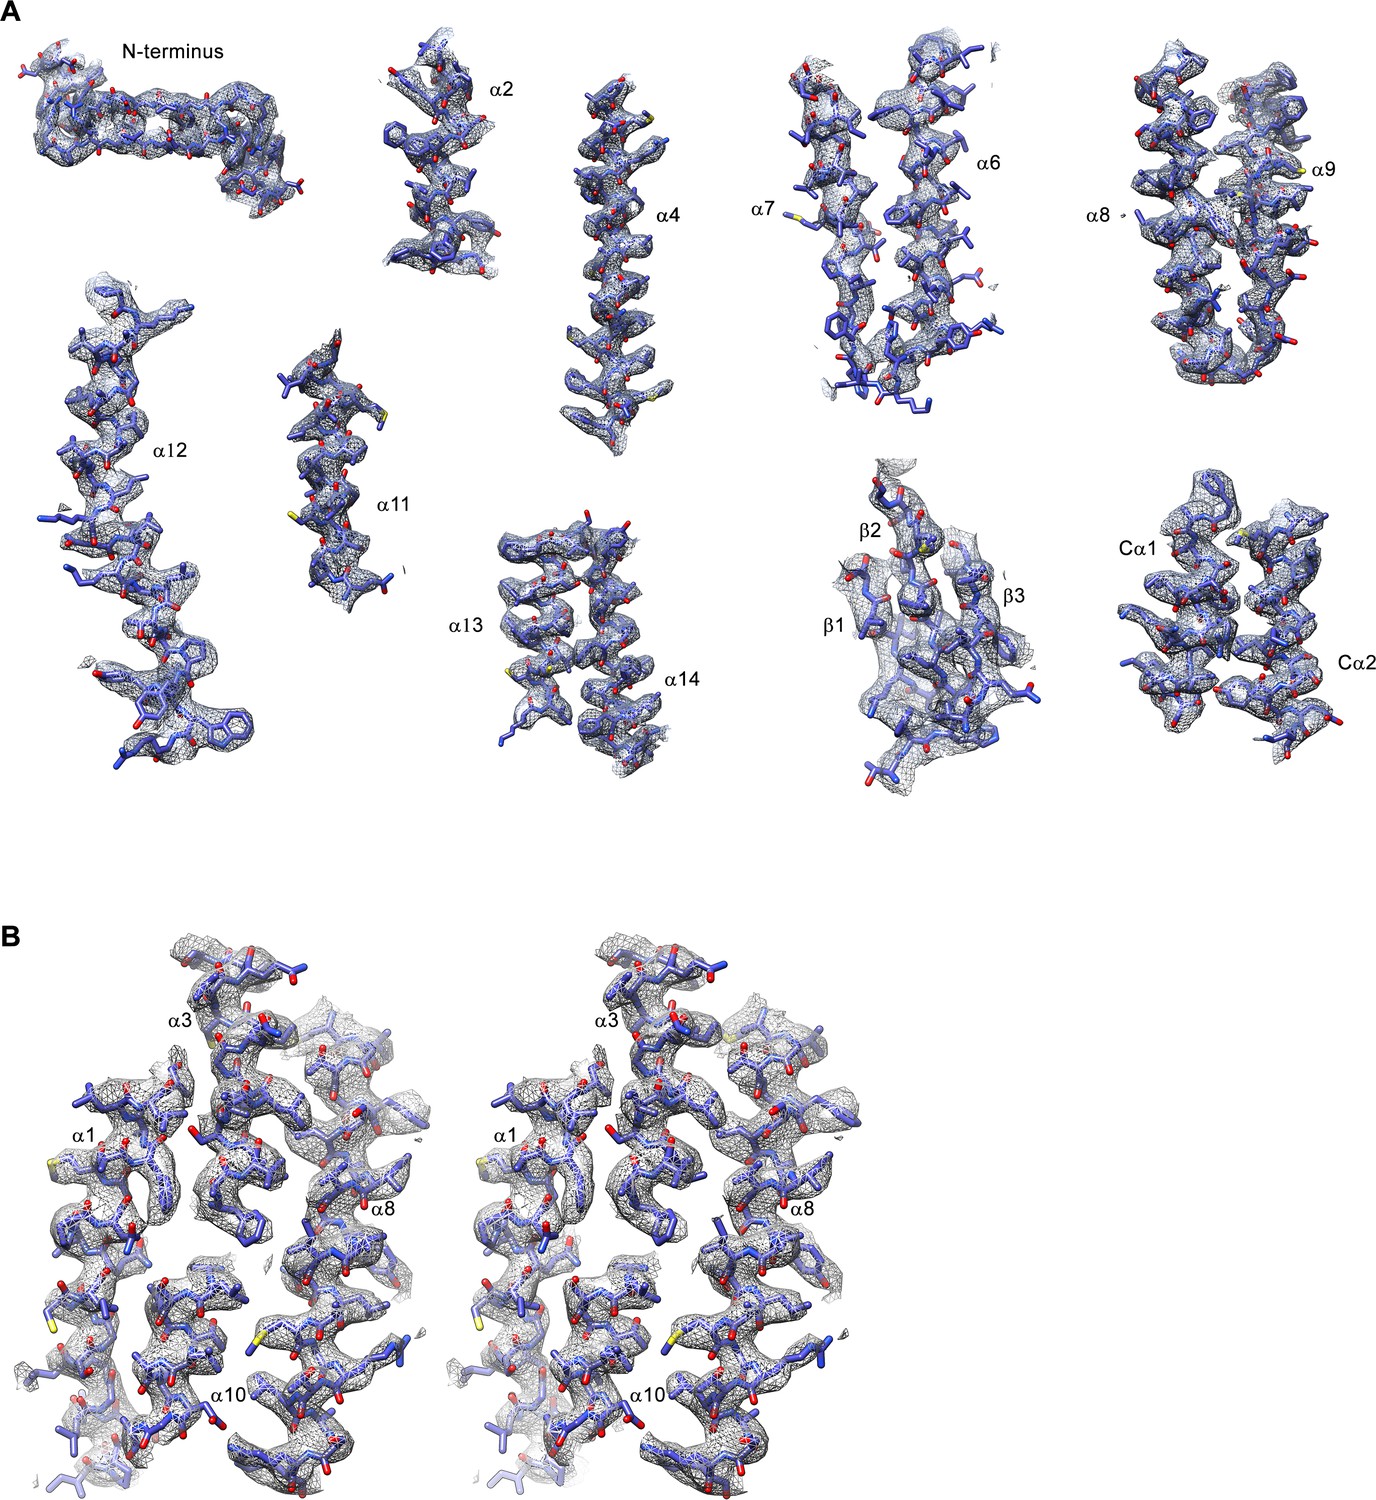
Cryo-EM density of the Slc26a9T structure in detergent.
(A) Sections of the cryo-EM density (gray, 7σ) superimposed on the refined structure of Slc26a9T. Secondary structure elements are labeled. (B) Stereo view of cryo-EM density (7σ) of the anion-binding site. The density representing the gate domain and parts of the core domain not involved in putative interactions with the ion were removed for clarity.
Figure 2—figure supplement 3
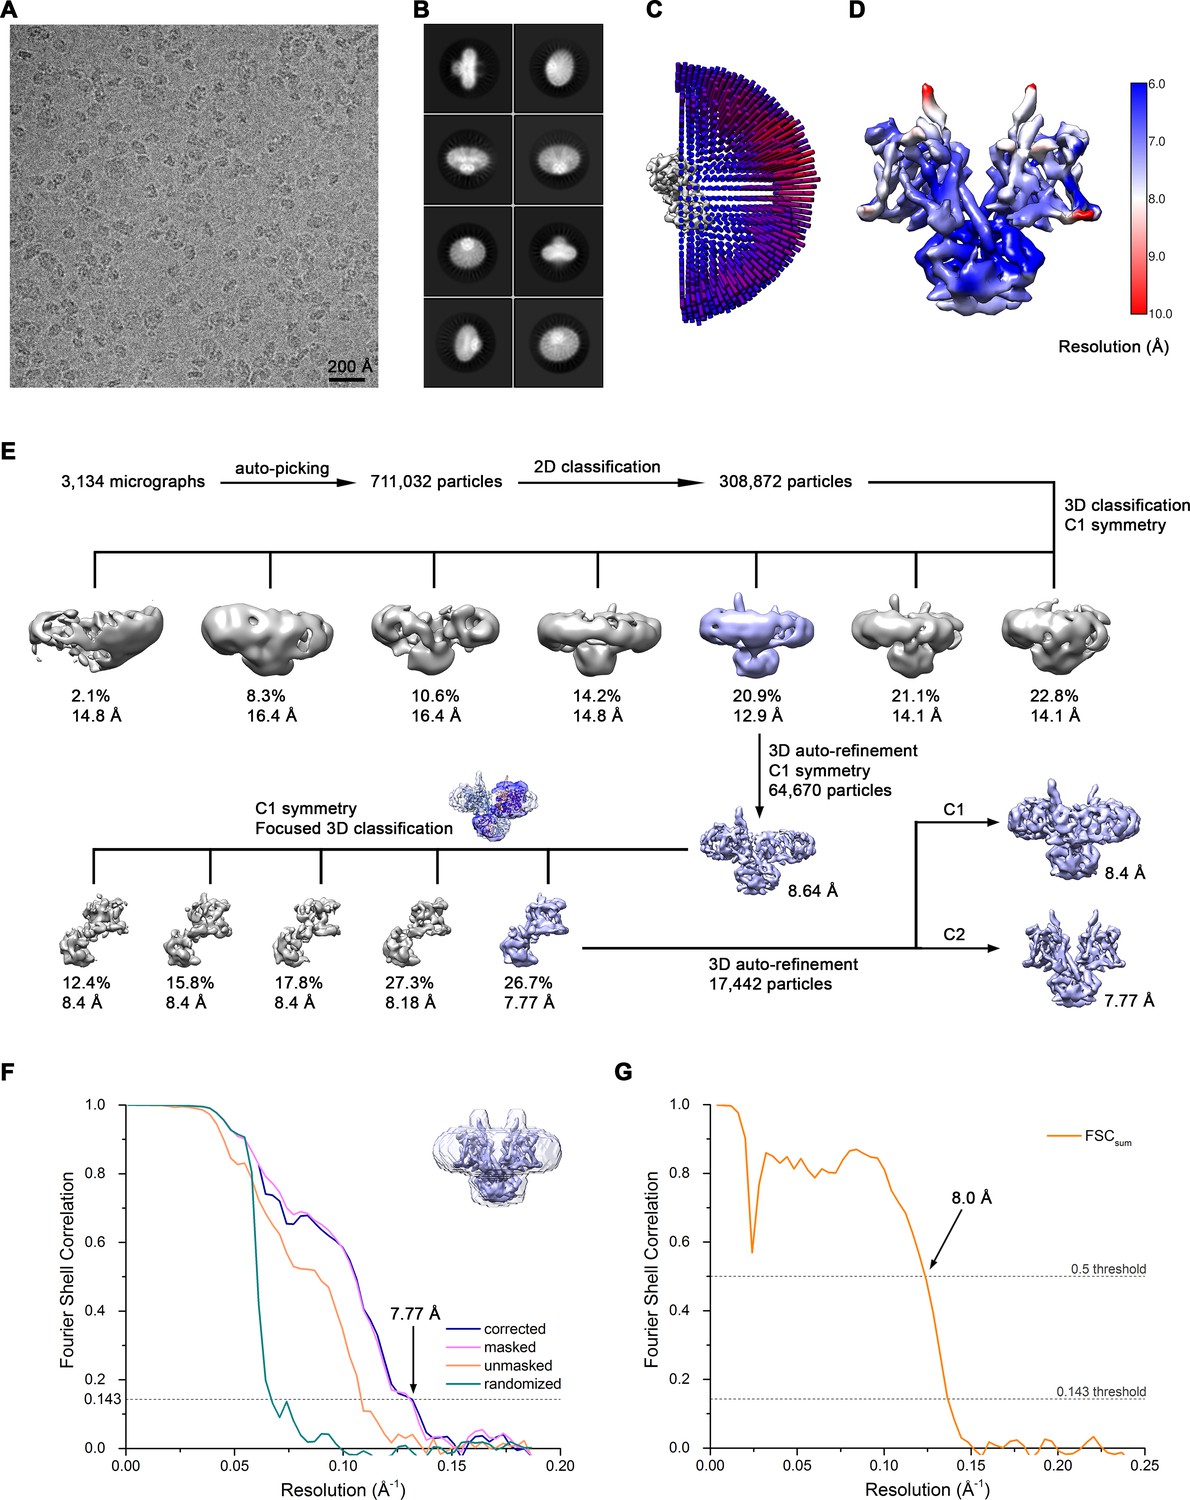
Cryo-EM reconstruction of Slc26a9T in nanodiscs at 7.8 Å.
(A) Representative cryo-EM micrograph acquired with Tecnai G2 Polara microscope. (B) 2D class averages of Slc26a9T. (C) Angular distribution plot of all particles included in the final C2-symmetrized reconstruction showing uniform orientations. The length and the color of the cylinders correspond to the number of particles with respective Euler angles. (D) Final 3D reconstruction colored according to local resolution. (E) The data processing workflow. Four out of seven classes showed well-defined cytoplasmic domains and increased heterogeneity within the TM domains. Particles belonging to the class with the best resolved TM domain were selected and subjected to further refinement. Since one monomer showed a missing extracellular loop, 3D classification focused on this monomer was performed. To segregate distinct states of the protein, the angles were kept the same as in the consensus model. The inlet shows the atomic model of the inward-facing state fitted into the 3D reconstruction from nanodiscs and the mask imposed on the flexible monomer. One out of five classes showed the density corresponding to the helix linking the TM and STAS domains. Particles belonging to this class were selected and subjected to a final auto-refinement on the whole particle. The distribution of all particles (%) and the resolution of each class is indicated. (F) Fourier shell correlation (FSC) plot of the final refined unmasked (orange), masked (pink), phase-randomized (green) and corrected for mask convolution effects (blue) cryo-EM density map of Slc26a9T. The resolution at which the FSC curve drops below the 0.143 threshold is indicated. The inset shows the final reconstruction within the mask that was applied for calculations of the resolution estimates. (G) FSC plot of refined atomic models against the cryo-EM density maps of Slc26a9T in lipid nanodiscs at 7.77 Å (dataset 2). FSCsum (orange) is calculated for the full masked map and the model refined against the complete dataset.
Figure 2—figure supplement 4
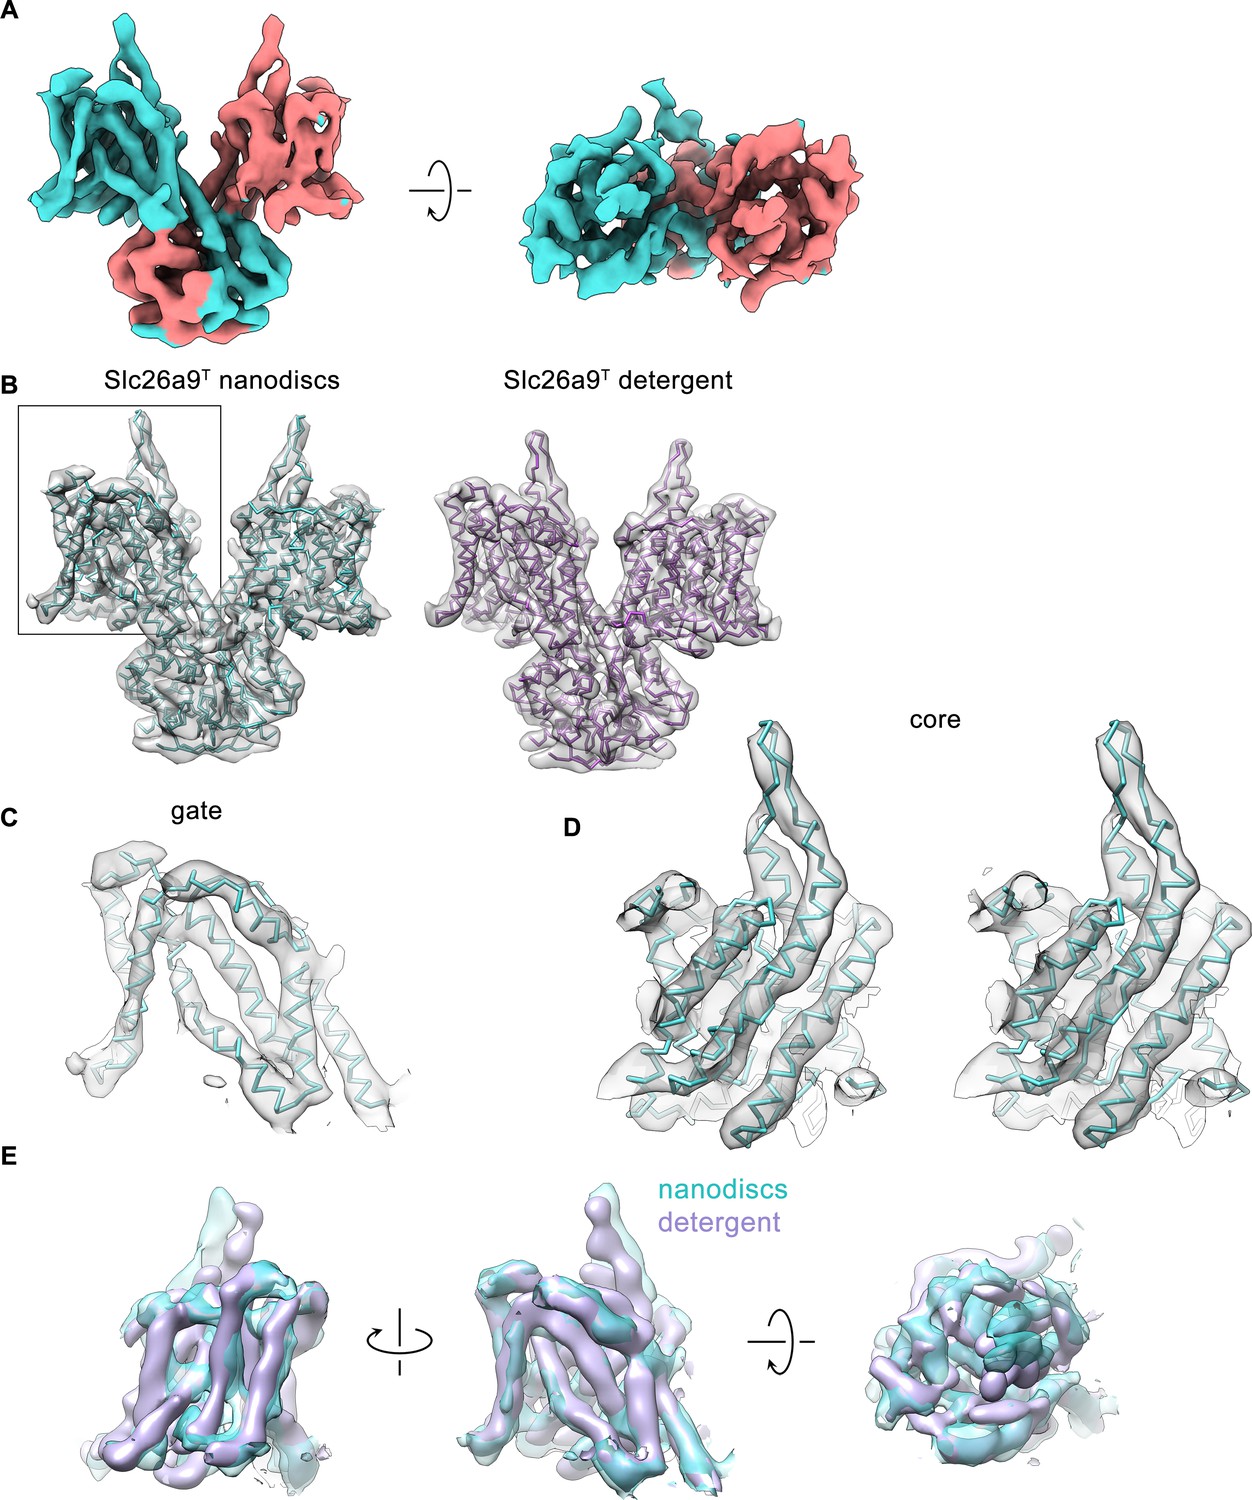
Cryo-EM density of the Slc26a9T structure in nanodiscs.
(A) Cryo-EM density (6σ) of Slc26a9T in lipid nanodiscs at 7.77 Å. Density corresponding to distinct subunits is colored in cyan and salmon respectively. (B) Left, Cα-representation of the refined model of Slc26a9T in intermediate state (cyan) with cryo-EM density (6σ) of the protein in lipid nanodiscs superimposed. Right, Cα-representation of the refined model of Slc26a9T in inward-facing state (pink) with low-pass filtered cryo-EM density (7σ) of the protein in detergent superimposed. Boxed area indicates the TMD of a single subunit consisting of the gate and the core sub-domains. (C) Fit of the refined model of the gate sub-domain of Slc26a9T in an intermediate state to the corresponding cryo-EM density (6σ). (D) Stereo view of the fit of the refined model of the core sub-domain of Slc26a9T in an intermediate state to the corresponding cryo-EM density (6σ). (C and D) The models are shown as Cα-representation. (E) View of the cryo-EM density of the transmembrane domain of Slc26a9T in lipid nanodiscs (cyan) with the respective cryo-EM density of Slc26a9T in detergent (pink) superimposed. The structures were aligned with respect to their gate sub-domains. Left, view from within the membrane along the long dimension of the dimeric molecule. Center, view as in panels B-D. Right, view from the extracellular side.
Figure 3 with 2 supplements
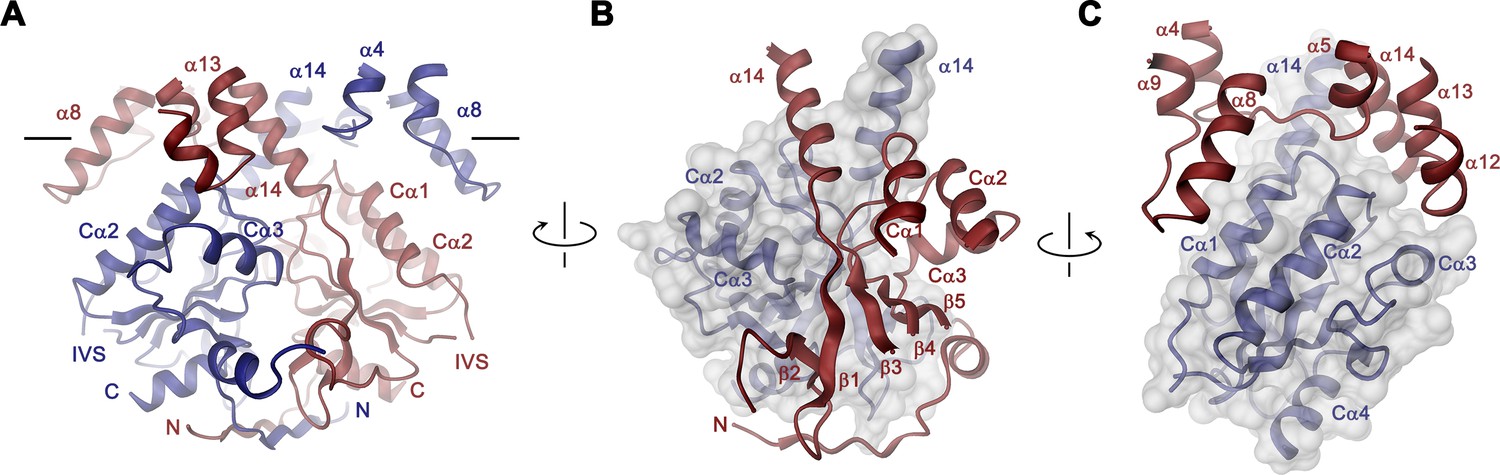
STAS domain and dimer interface.
(A) Ribbon representation of the STAS domain dimer and interacting parts of the N-terminus and the TMD. The view is as in Figure 2B. (B) Elements of mutual STAS domain interactions and contacts with the N-terminus. (C) STAS domain-TMD interactions. B and C, Molecular surface of the STAS domain and the C-terminal part of α14 is shown superimposed on one subunit (blue), segments of the interacting subunit are shown in red. The relationship between views is indicated. A-C, The intracellular membrane boundary is indicated.
Figure 3—figure supplement 1
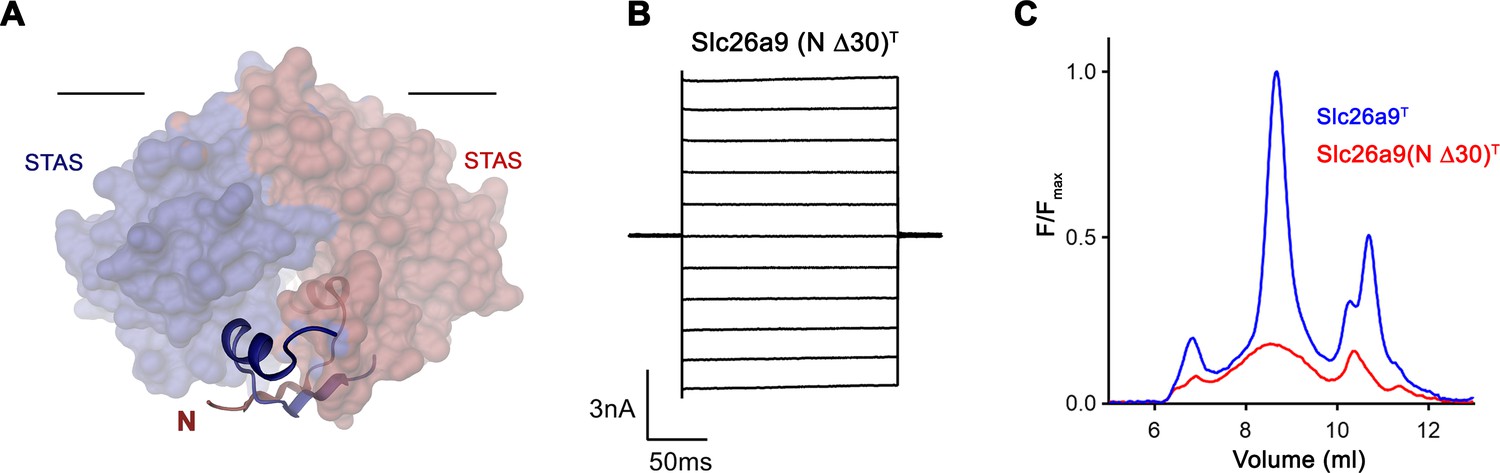
Effect of N-terminal truncation of Slc26a9T on function and stability.
(A) Depiction of the interaction of residues 5–25 of both subunits with the STAS domain dimer. The N-termini are displayed as ribbon interacting with the STAS domain depicted by its molecular surface. Subunits are displayed in red and blue respectively. The view is parallel to the membrane with its inner boundary indicated. (B) Representative current traces from a whole-cell patch-clamp experiment of Slc26a9(N Δ30)T in symmetric Cl– illustrate that the truncated construct is targeted to the membrane and mediates currents. (C) Analysis of detergent extracts via size exclusion chromatography shows poor behavior of the N-terminally truncated construct. The protein is detected by the fluorescence of fused vYFP.
Figure 3—figure supplement 2
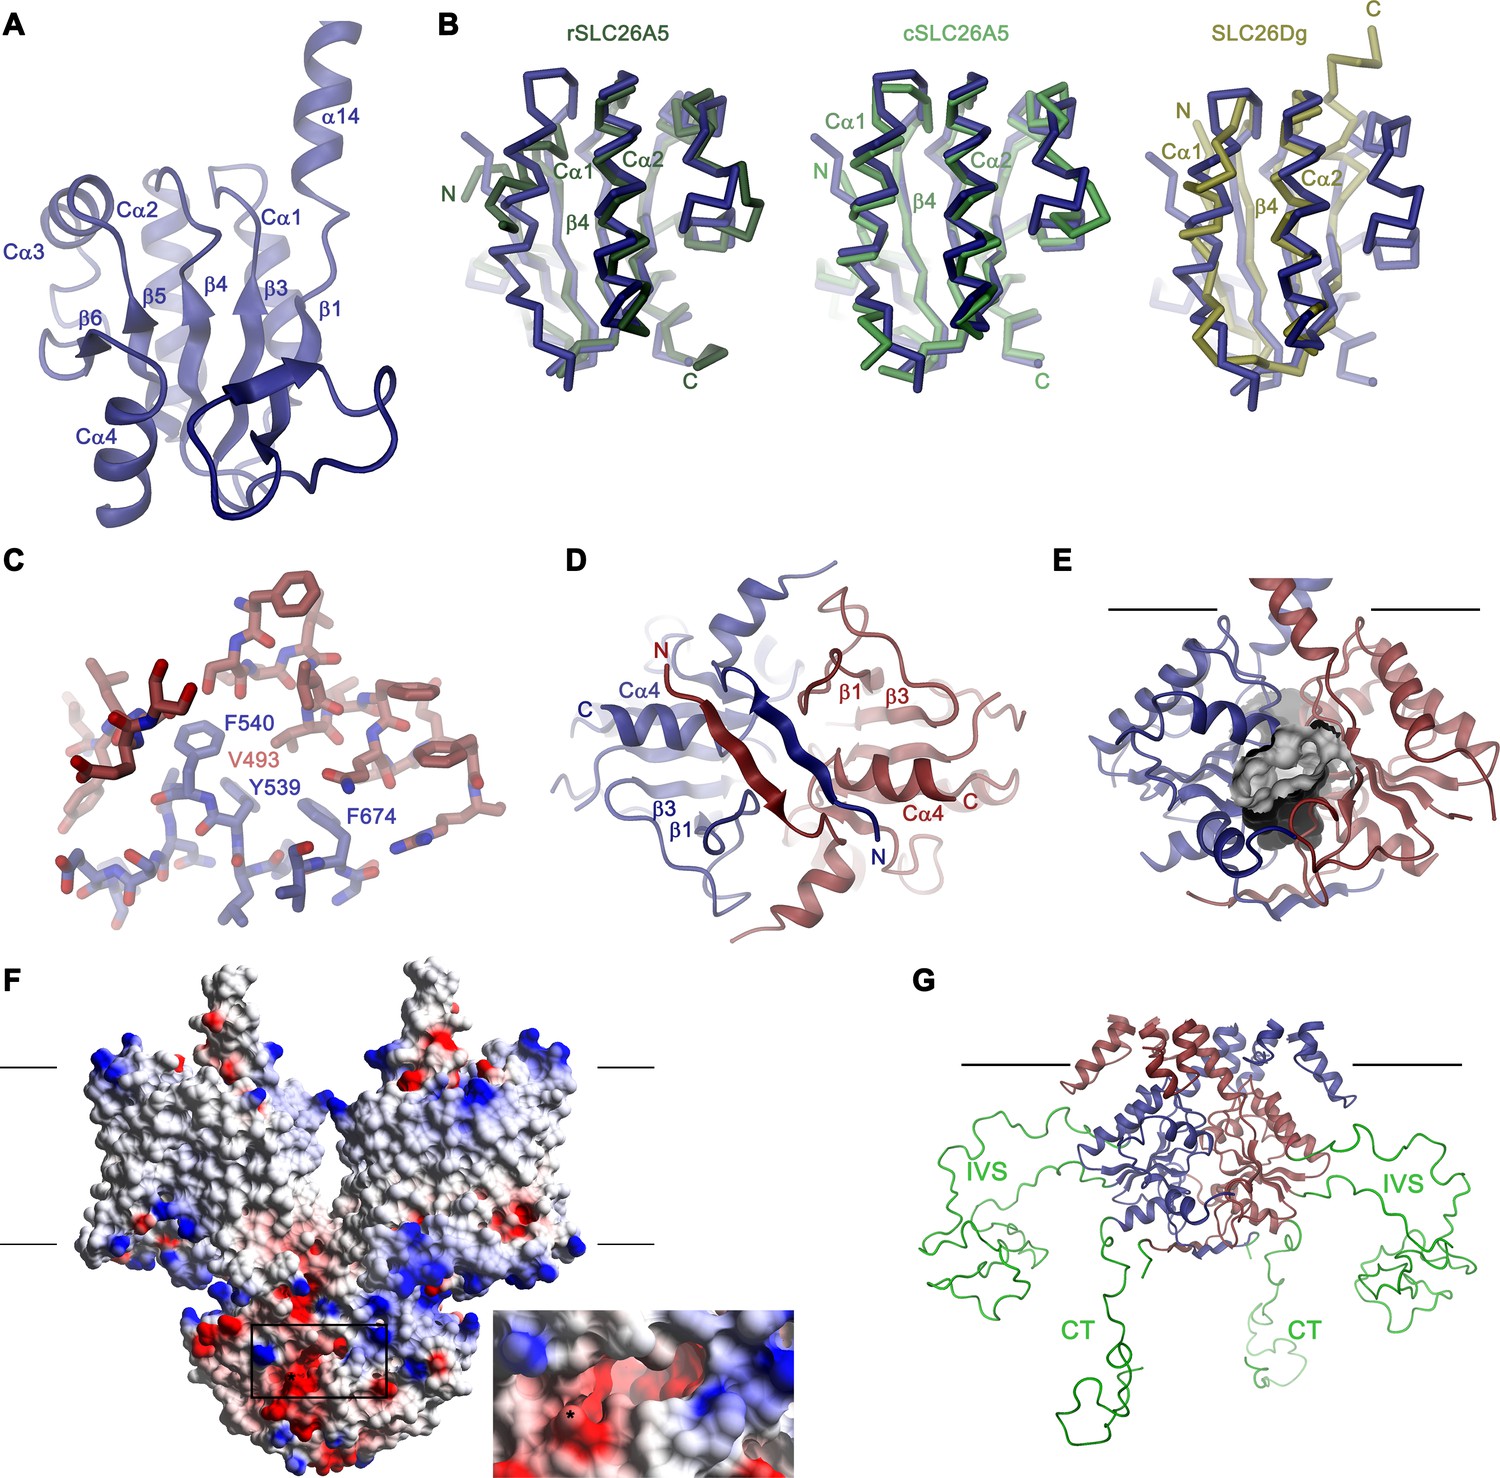
Structural features of the Slc26a9 STAS domain.
(A) Ribbon representation of the STAS domain of a single subunit of Slc26a9T with secondary structure elements labeled. (B) Superposition of the STAS domain of Slc26a9T with the X-ray structures of the isolated STAS domains of rat SLC26A5 (left, PDBID: 5EUU), chicken SLC26A5 (center, PDBID: 5EZB) and the STAS-domain of SLC26Dg (right, PDBID: 5DA0). (C) Conserved hydrophobic residues at the β3-Cα1 loop and the β4-Cα2 loop of the STAS domain (blue) buried in the interaction interface with the TMD (red). (D) N-termini interacting with the STAS domain dimer viewed from the intracellular side. (E) Molecular surface of an acidic pocket in the STAS domain interface in relation to the STAS domain dimer. (F) Electrostatic potential of Slc26a9T mapped on the molecular surface. Negative regions are colored in red, positive regions in blue. Inset shows close-up of the acidic pocket at the STAS-domain interface (indicated by box). (G) Model of the IVS sequence stretches of the STAS domain, which were removed in the Slc26a9T construct. Lines in E-G indicate membrane boundaries.
Figure 4 with 1 supplement
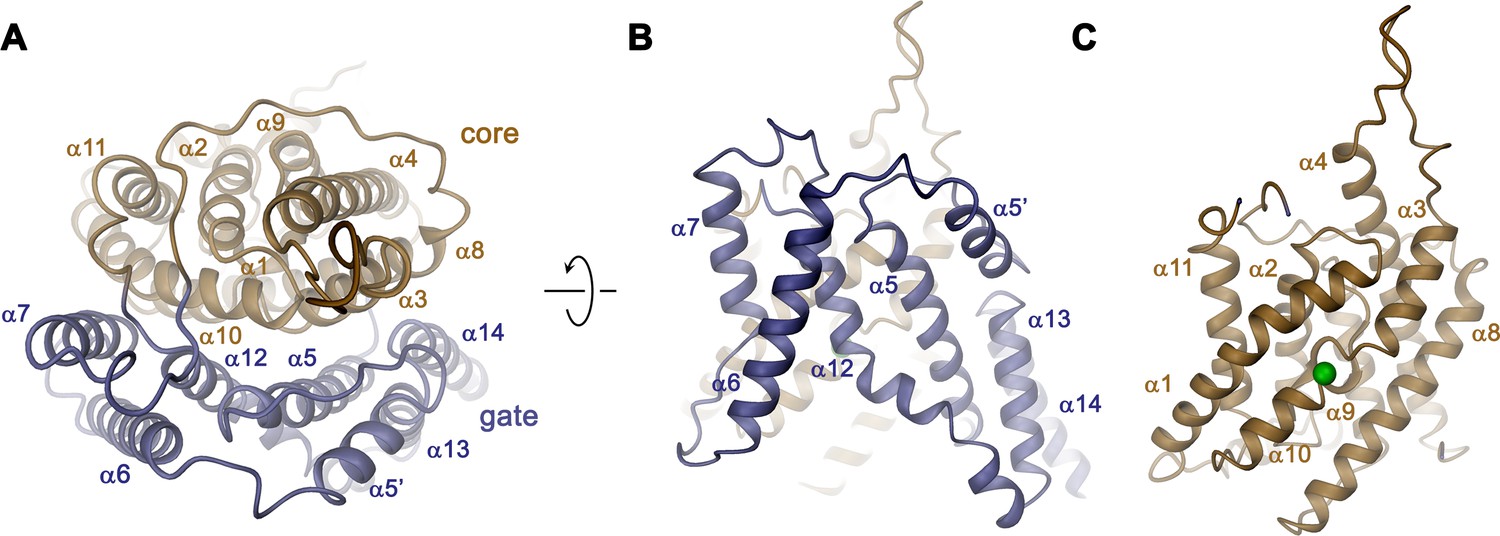
Transmembrane domain.
(A) Ribbon representation of the TMD of a single subunit of Slc26a9T viewed from the extracellular side. (B) View of the gate and (C) the core module from within the membrane. Green sphere indicates predicted position of bound Cl–.
Figure 4—figure supplement 1
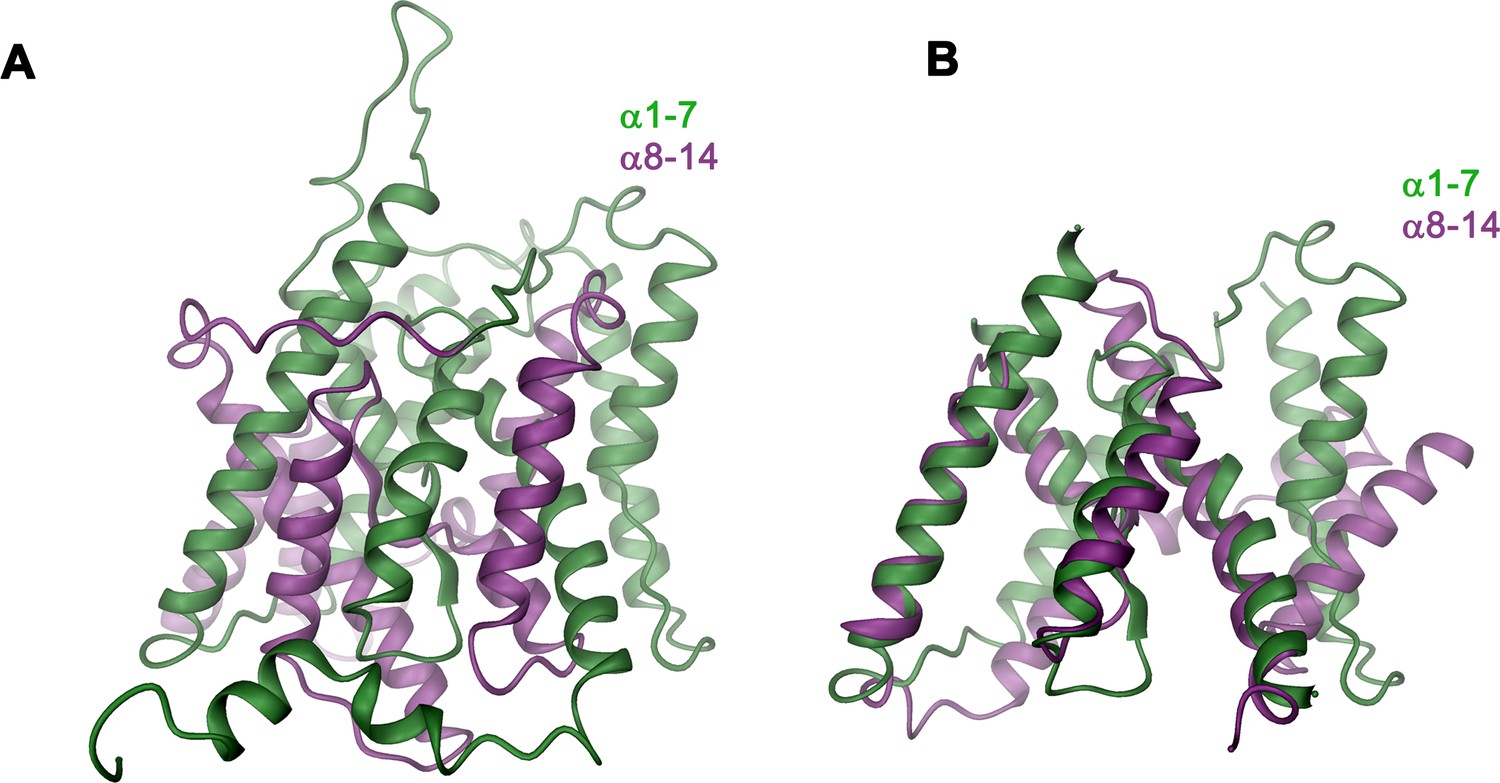
Structural features of the TMD.
(A) Ribbon representation of the TMD of a single subunit of Slc26a9T viewed from within the membrane. The N-terminal (α1-α7) and C-terminal (α8-α14) halves are colored in green and magenta respectively. (B) Structural superposition of the N-terminal and C-terminal halves of the TMD. Structural features that are unique to the N-terminal half of the transporter (α5’) were removed.
Figure 5
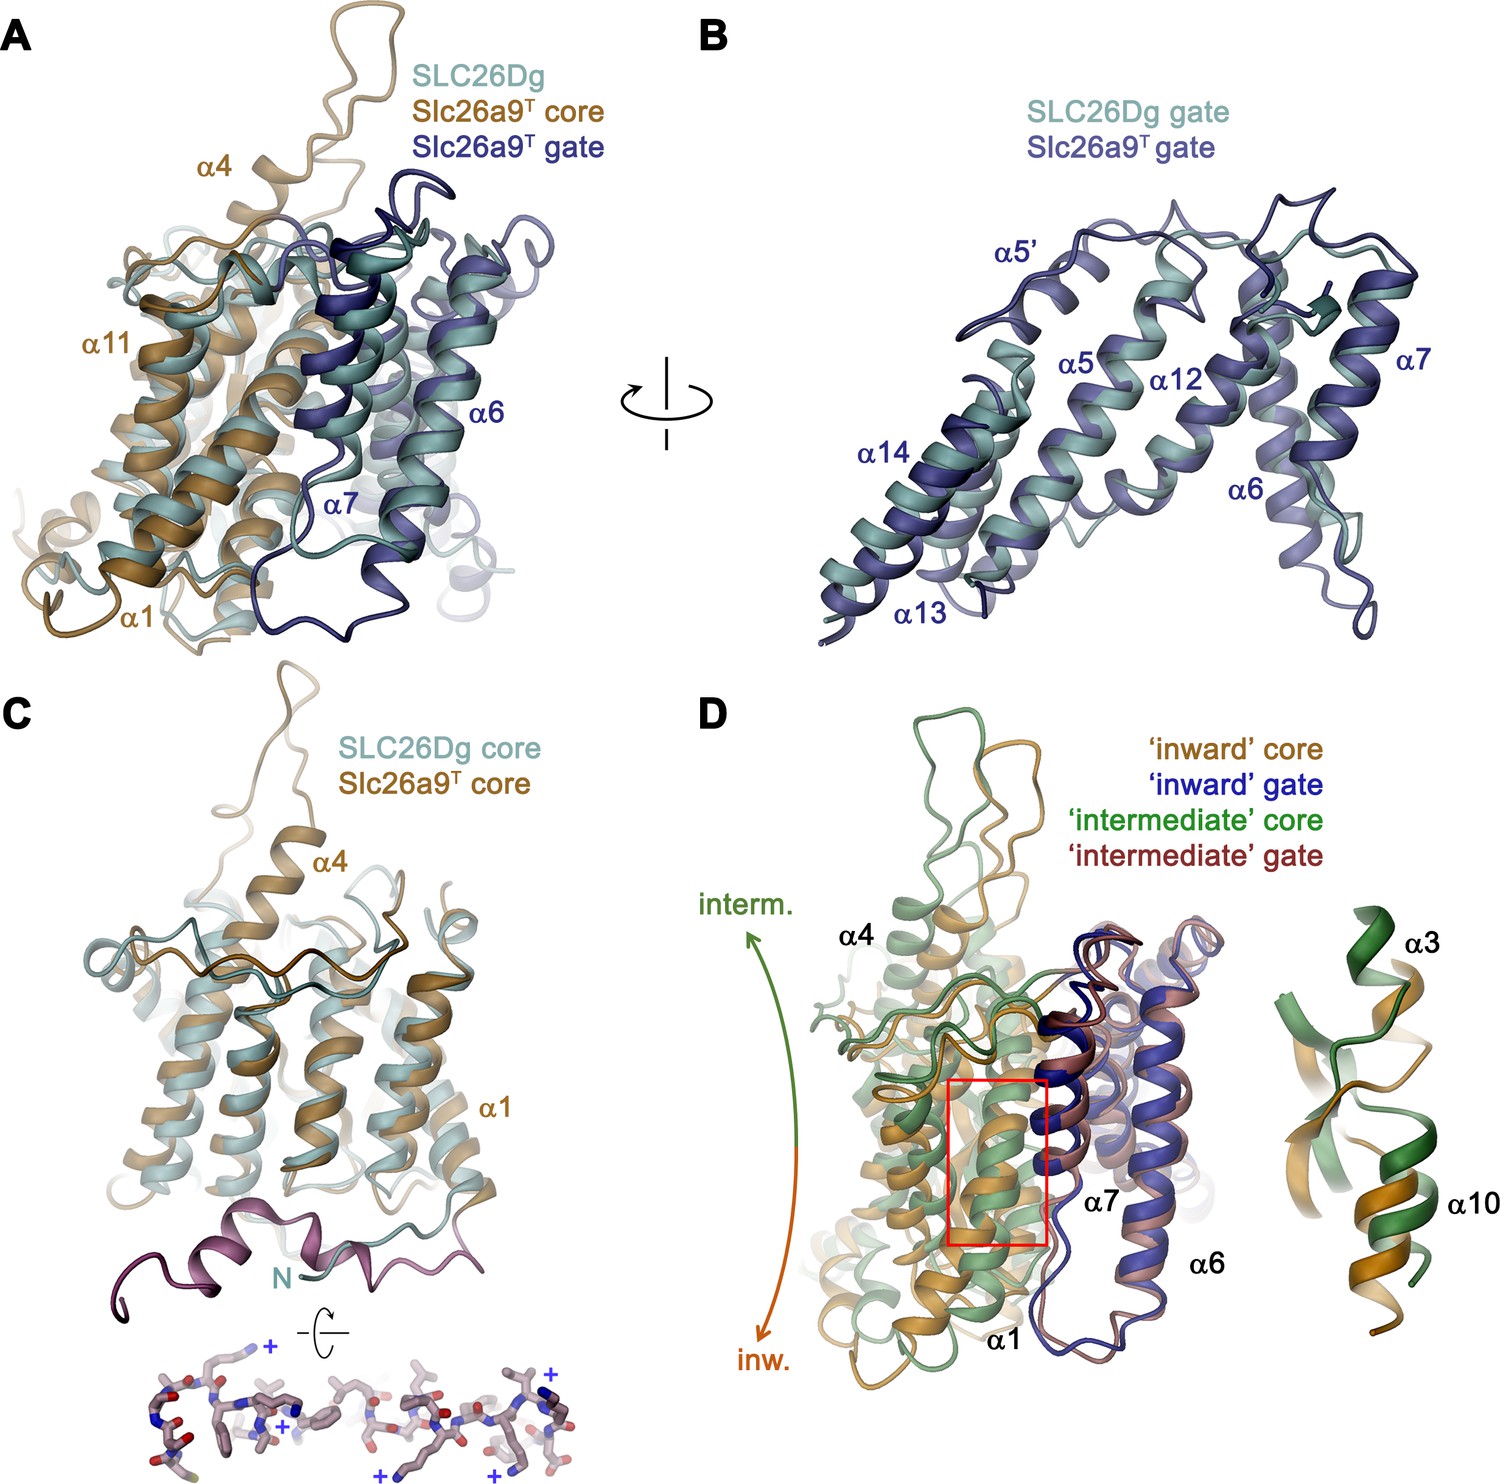
Comparison of the TMD.
(A) Structural superposition of the TMDs of Slc26a9T (beige and blue) and SLC26Dg (PDBID: 5DA0, cyan). (B) Superposition of the gate domains and (C) core domains of Slc26a9T and SLC26Dg. N-terminal region of Slc26a9T preceding α1 is colored in pink and displayed as sticks from an intracellular perspective below. The location of basic residues is indicated (+). (D) Superposition of the TMD of detergent-solubilized Slc26a9T, showing an inward-facing state onto the TMD of lipid nanodisc-reconstituted Slc26a9T, indicating an intermediate state on its transition towards the outside. The movement of the core domains is indicated. Inset (right) shows blow-up of the region around the Cl–-binding site (indicated by red box). The core and gate modules of the intermediate conformation of Slc26a9T determined in nanodiscs are colored in green and pink, respectively.
Figure 6 with 1 supplement
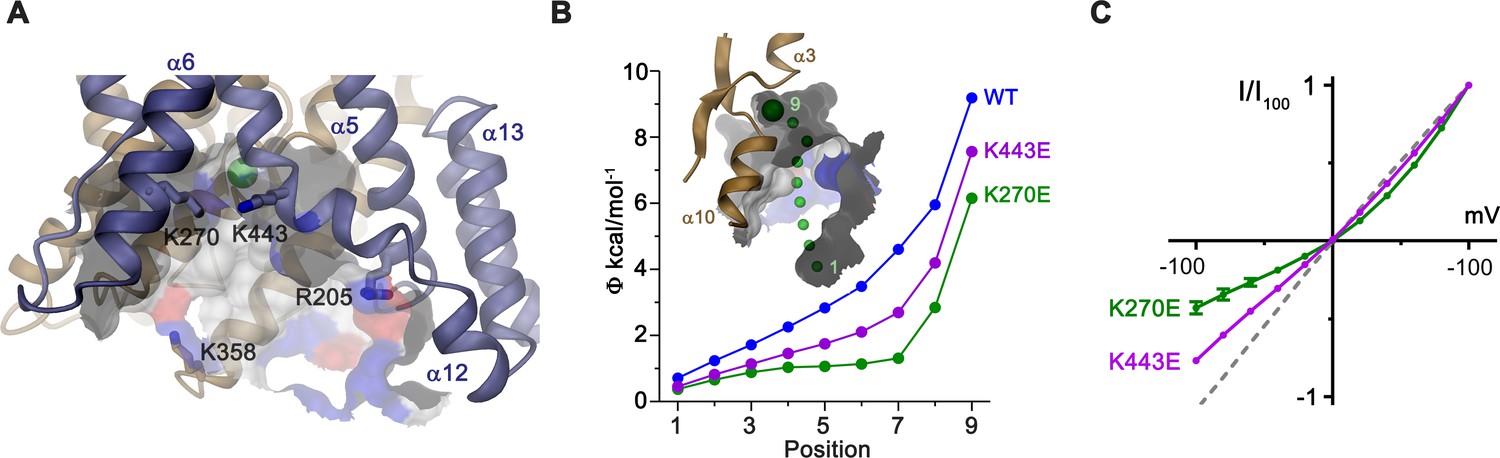
Electrostatic properties of the intracellular cavity.
(A) View of the intracellular cavity leading to the Cl–-binding site. Section of the molecular surface is shown with contact region of acidic residues colored in red and basic residues in blue. (B) Electrostatic potential within the aqueous cavity leading to the Cl–-binding site of WT and charge reversing mutants of basic residues facing the cavity. Inset shows aqueous access path of ions. Positions sampling the electrostatic potential are shown as green spheres. A, B, Bound Cl– is shown as a large green sphere. (C) I-V relationships of charge-reversing mutants K270E and K443E facing the aqueous cavity (K270E, n = 3; K443E, n = 4). Data was recorded from excised patches in symmetric 150 mM Cl–.
Figure 6—figure supplement 1
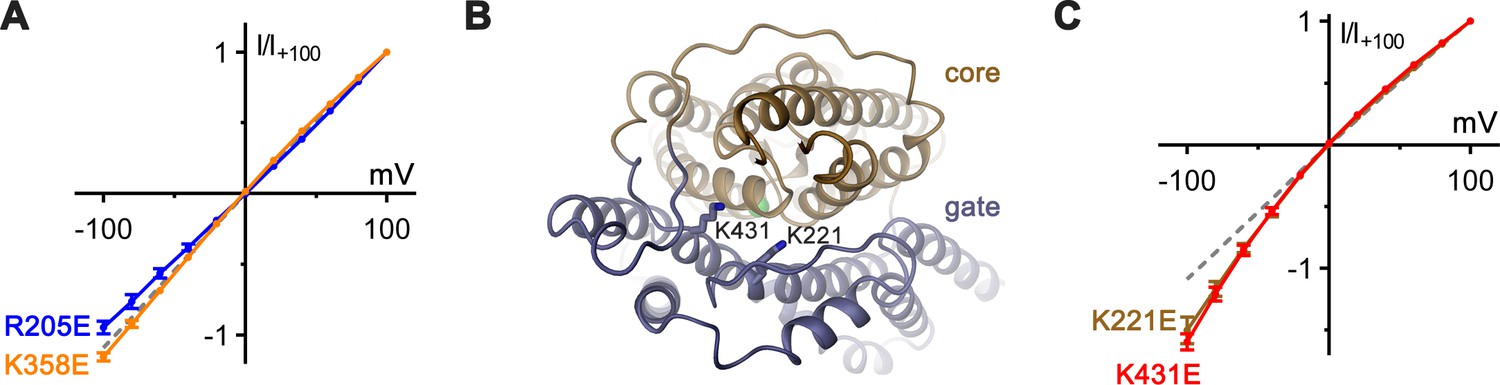
Functional properties of mutants of basic residues.
(A) Introduction of negative charges at positions of basic residues distal to the putative anion-binding site show negligible effects on the linear I–V relation. Shown are I–V relationships of mutants R205E (blue, n = 3) and K358E (orange, n = 3). (B) Structural context of extracellular basic residues K221 and K431, which lie on the proposed ion-transit pathway. The protein is shown as ribbon with core and gate domain colored in beige and blue respectively. Selected side-chains are shown as sticks. The view is from the extracellular side. (C) Charge-reversal of K221 and K431 results in inward-rectification of chloride currents. I–V plots show similar levels of inward rectification for mutants K221E (brown, n = 3) and K431E (red, n = 3).
Figure 7 with 3 supplements
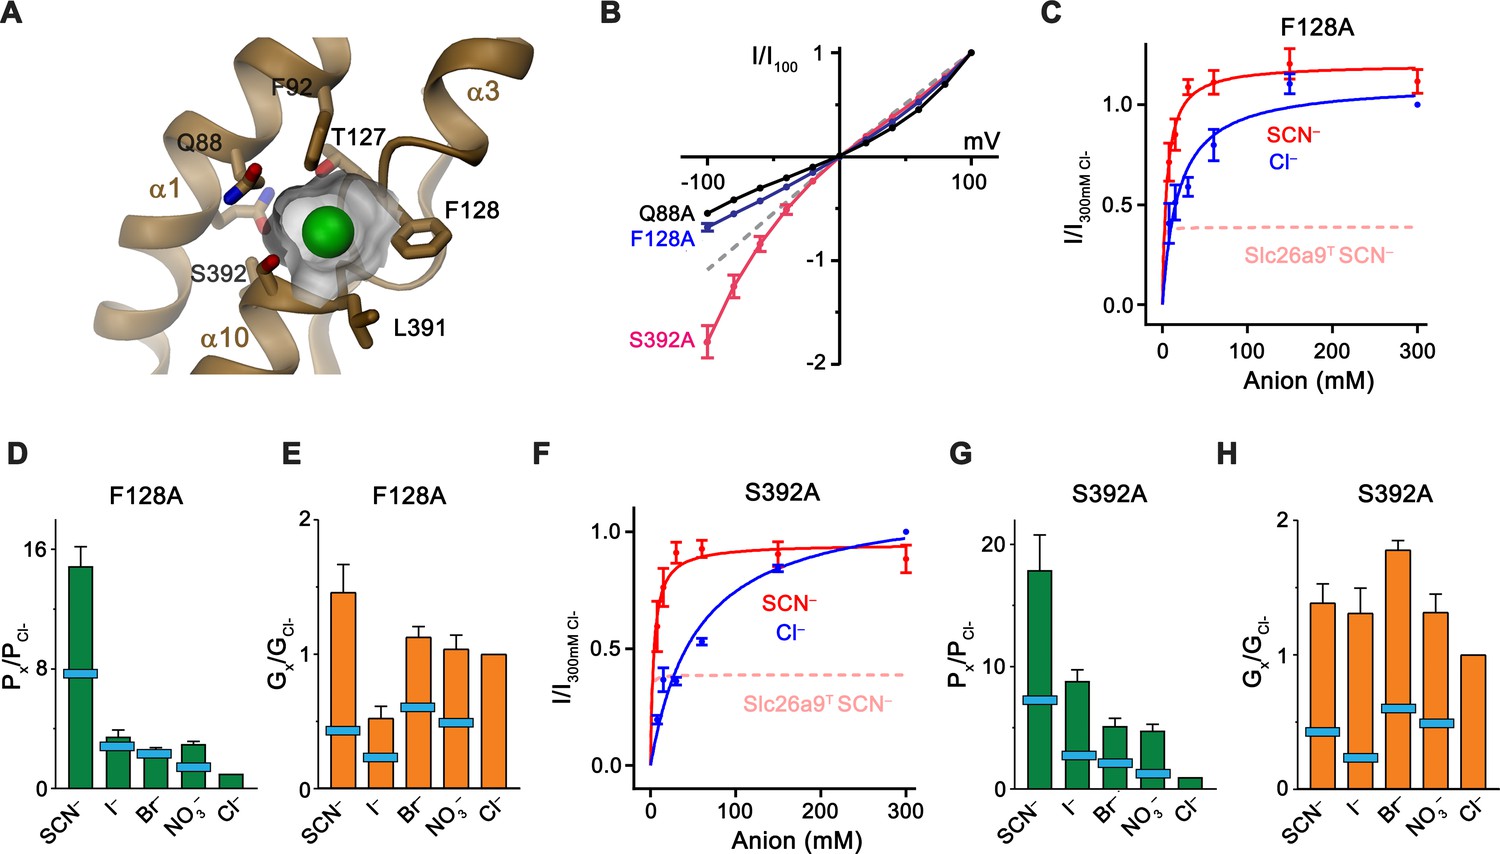
Substrate binding site.
(A) Structure of the Cl– binding site. The molecular surface of the binding pocket is shown. Selected residues are displayed as sticks. Bound Cl– is shown as a green sphere. (B) I-V relationships of selected Cl– binding site mutants (Q88A, n = 5; F128A, n = 8; S392A, n = 5). Data for WT Slc26a9T is shown as dashed line for comparison. (C) Conductance-concentration relationships of anion transport across the Slc26a9T mutant F128A (n = 3). For comparison, SCN– conductance–concentration relationship for non-mutated Slc26a9T is shown as a pink dotted line. (D) Permeability (Px/PCl) and (E) conductance ratios (Gx/GCl) of the Slc26a9T mutant F128A obtained from bi-ionic substitution experiments (Cl–, Br–, NO3–, SCN–, n = 8; I–, n = 3). The light-blue bars indicate corresponding values for WT Slc26a9T. (F) Conductance-concentration relationships of anion transport across the Slc26a9T mutant S392A (n = 5). For comparison, SCN– conductance–concentration relationship for non-mutated Slc26a9T is shown as a pink dotted line. (G) Permeability (Px/PCl) and (H) conductance ratios (Gx/GCl) of the Slc26a9T mutant S392A obtained from bi-ionic substitution experiments (Cl–, Br–, n = 5; NO3–, SCN–, I–, n = 4). The light-blue bars indicate corresponding values for WT Slc26a9T. Data was recorded from excised patches either in symmetric 150 mM Cl– (B), the indicated intracellular anion-concentrations with 7.5 mM extracellular Cl– (C and F), or at equimolar bi-ionic conditions containing 150 mM extracellular Cl– and 150 mM of the indicated intracellular anion (D, E, G, H). Data show mean values of the indicated number of biological replicates, errors are s.e.m.. C-H, Data were recorded at −100 mV.
Figure 7—figure supplement 1
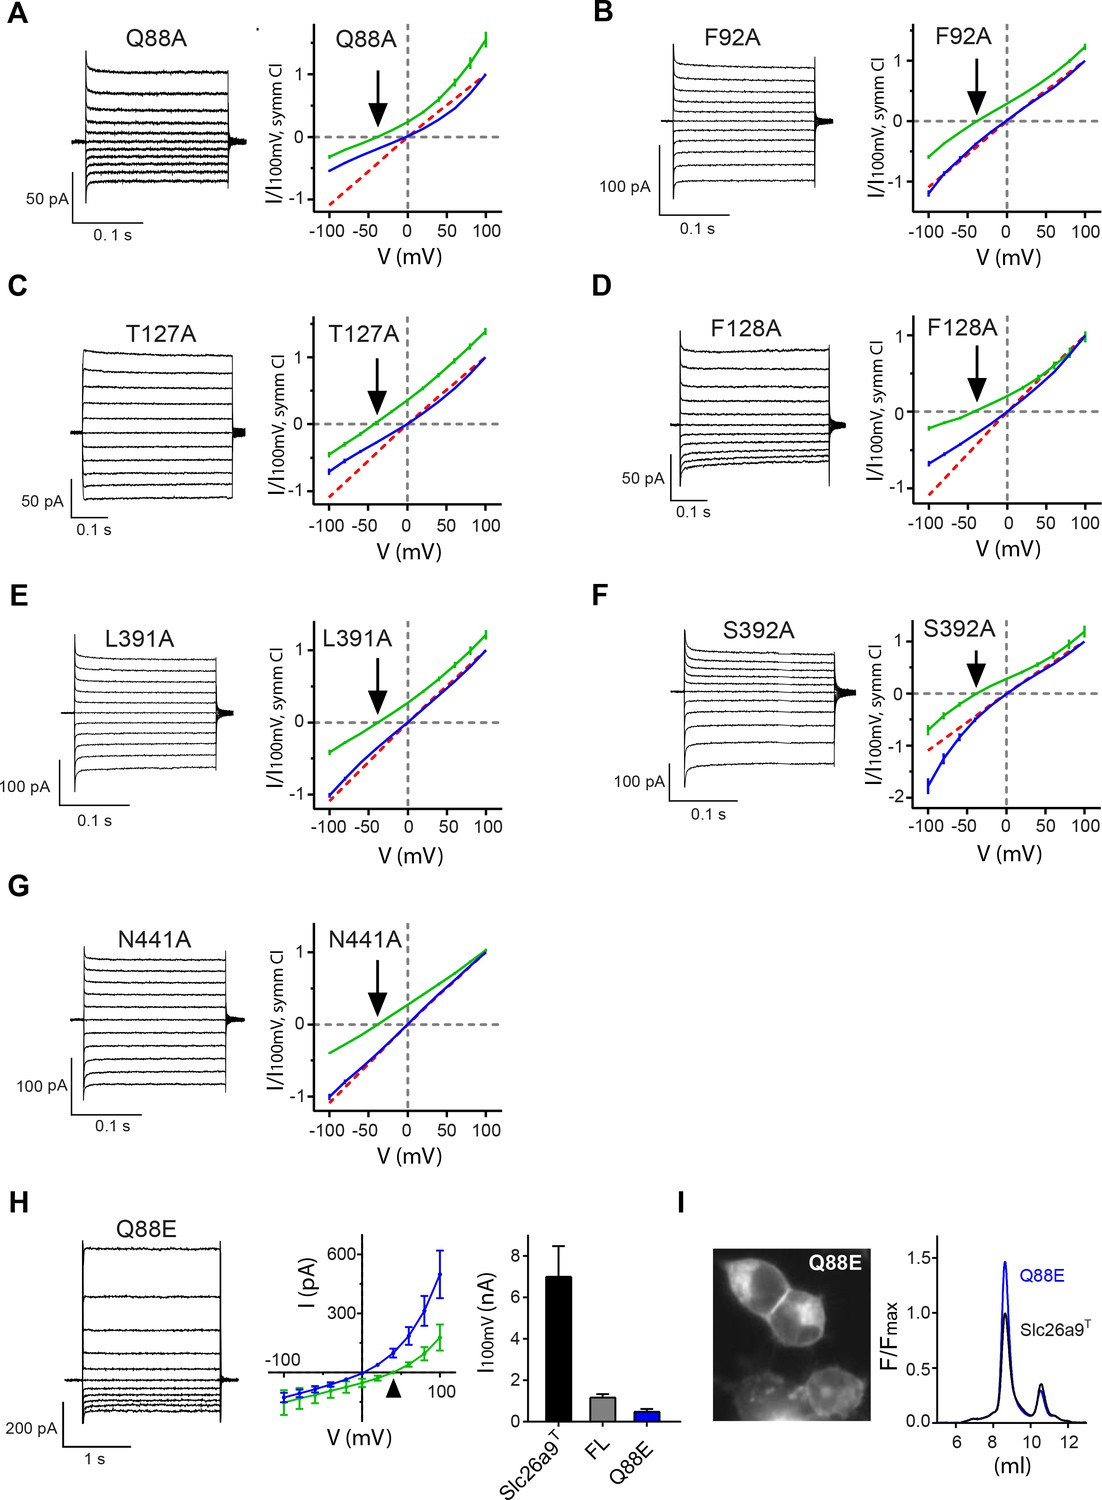
I-V-relationships of anion binding site mutants.
(A–G) Alanine mutants investigated by inside-out patch-clamp electrophysiology of HEK392T cells expressing Slc26a9T anion binding-site mutations. Binding-site mutations do not alter Cl– selectivity, but some mutants show rectifying behavior. Current traces (left) demonstrate that the shortening of side-chains does not severely alter the current magnitude. I-V relationships (right) in symmetric 150 mM chloride concentrations (blue) shows different degree of rectification. Currents recorded in a 5-fold inwardly-directed NaCl gradient (green) reverse at the Nernst potential for Cl– (indicated by arrow). (A) Q88A, n = 5; (B) F92A, n = 3; (C) T127A, n = 5; (D) F128A, n = 8; (E) L391A, n = 4; (F) S392A, n = 5; (G) N441A, n = 3. For panels A-G, data is represented as averages of the indicated number of biological replicates, and errors are s.e.m.. WT is shown as red dashed line for comparison. (H) The Slc26a9T-Q88E mutation displays strong outward rectification in the whole-cell configuration, along with severely attenuated current magnitude. Left, Whole-cell currents at symmetrical 150 mM NaCl. Middle, I–V plot for whole-cell Slc26a9T-Q88E currents at symmetrical 150 mM NaCl (blue, n = 4) and with a 5-fold outward-directed NaCl gradient (green, n = 4). The triangle indicates the Nernst potential for Cl–. Right, Strong reduction of Cl– currents by Q88E, relative to WT Slc26a9T. Shown are Cl– influx currents at 100 mV for Slc26a9T (black bar, n = 5), full-length Slc26a9 (FL) (gray bar, n = 8), and Slc26a9T-Q88E (blue bar, n = 4). (I) The Slc26a9T-Q88E mutation does not compromise surface expression or stability of Slc26a9T. Left, Fluorescence microscopy image of Slc26a9T-Q88E-transfected HEK293T cells shows that the Q88E mutation displays similar membrane-attributable fluorescence as for Slc26a9T. Right, FSEC profiles of detergent extracts of Slc26a9T and the Slc26a9T-Q88E mutant show that the mutation has not apparently compromised protein stability, and in fact the mutation may result in more stable protein, as evidenced by the larger monodisperse peak relative to Slc26a9T.
Figure 7—figure supplement 2
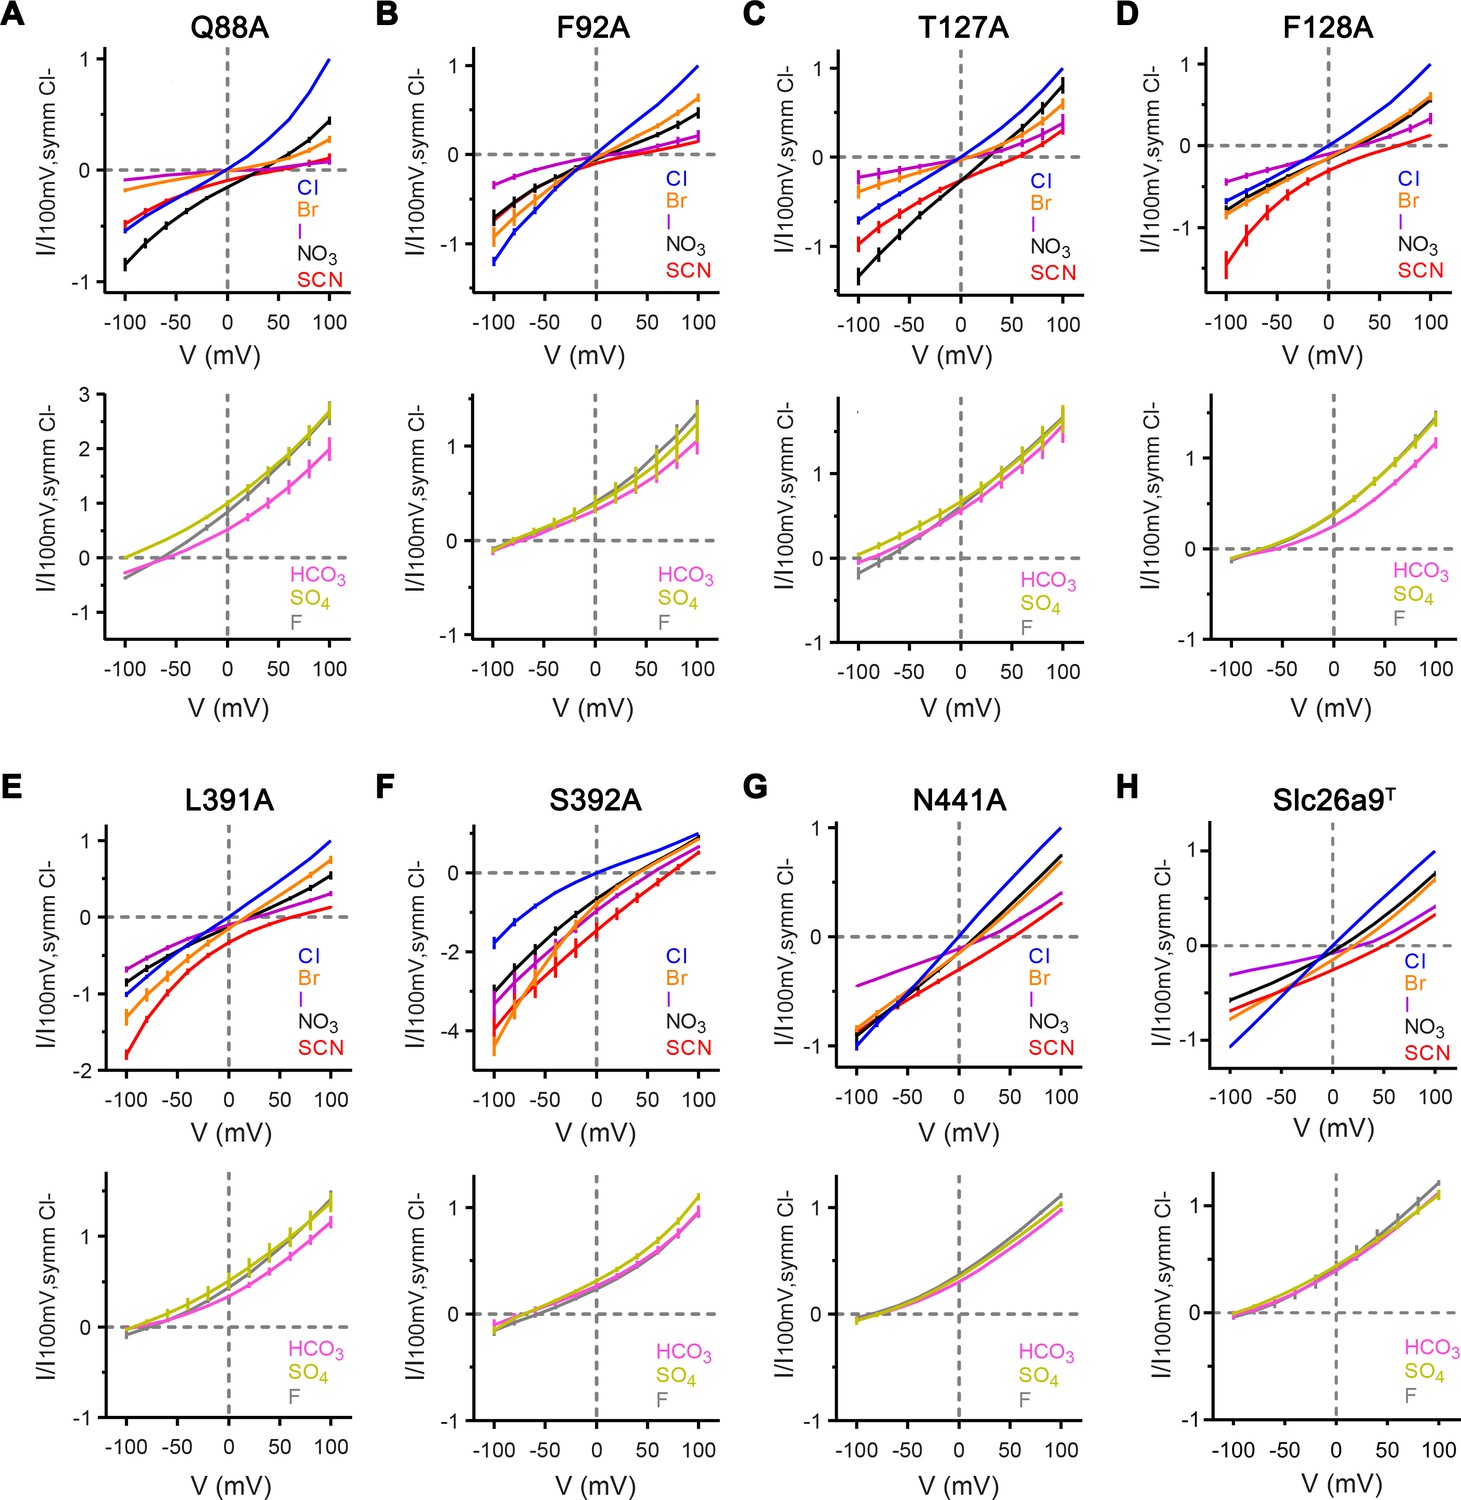
Anion selectivity of binding site mutants.
Currents were recorded by inside-out patch-clamp electrophysiology at asymmetric conditions containing 150 mM extracellular Cl– and 150 mM of the indicated anion. (A–G) Top, Bi-ionic I–V relationships for equimolar replacement of intracellular Cl– with permeable anions Br– (orange), I– (violet), NO3– (black), and SCN– (red), and with symmetrical Cl– shown as reference (blue). Mutants Q88A, T127A, F128A, L391A, and S392A show considerable changes in the I–V relationships of intracellularly substituted permeable anions, relative to WT-Slc26a9T, while the mutants F92A and N441A reveal less severe alterations. Bottom, Bi-ionic I–V relationships for equimolar replacement of intracellular Cl– with impermeable anions HCO3– (pink), SO42– (chartreuse), and F– (gray). All mutants remain poorly permeable to bicarbonate, sulfate, and fluoride. (A), Q88A, Cl–, Br–, SCN–: n = 5, I–, NO3–, HCO3–, SO42–n = 4, F–: n = 3; (B) F92A, Cl–, Br–, I–, NO3–, SCN–, HCO3–, SO42–, F–: n = 3; (C) T127A, Cl, NO3–, SCN–, F–: n = 5, Br–, I–: n = 4; HCO3–, SO42–n = 3); (D) F128A, Cl–, Br–, SCN–: n = 8, I–, HCO3–, SO42–, F–: n = 3; (E) L391A, Cl–, Br–, I–, NO3–, SCN–, HCO3–, SO42–, F–: n = 4; (F) S392A, Cl–, Br–: n = 5, I–, NO3–, SCN–, HCO3–, SO42–, F–: n = 4; (G) N441A, Cl–, Br–, I–, NO3–, SCN–, HCO3–, SO42–, F–: n = 3. For panels A-G, data is represented as averages of the indicated number of biological replicates, and errors are s.e.m.. (H) Data for Slc26a9T displayed in Figure 1—figure supplement 3B–F is shown for comparison.
Figure 7—figure supplement 3
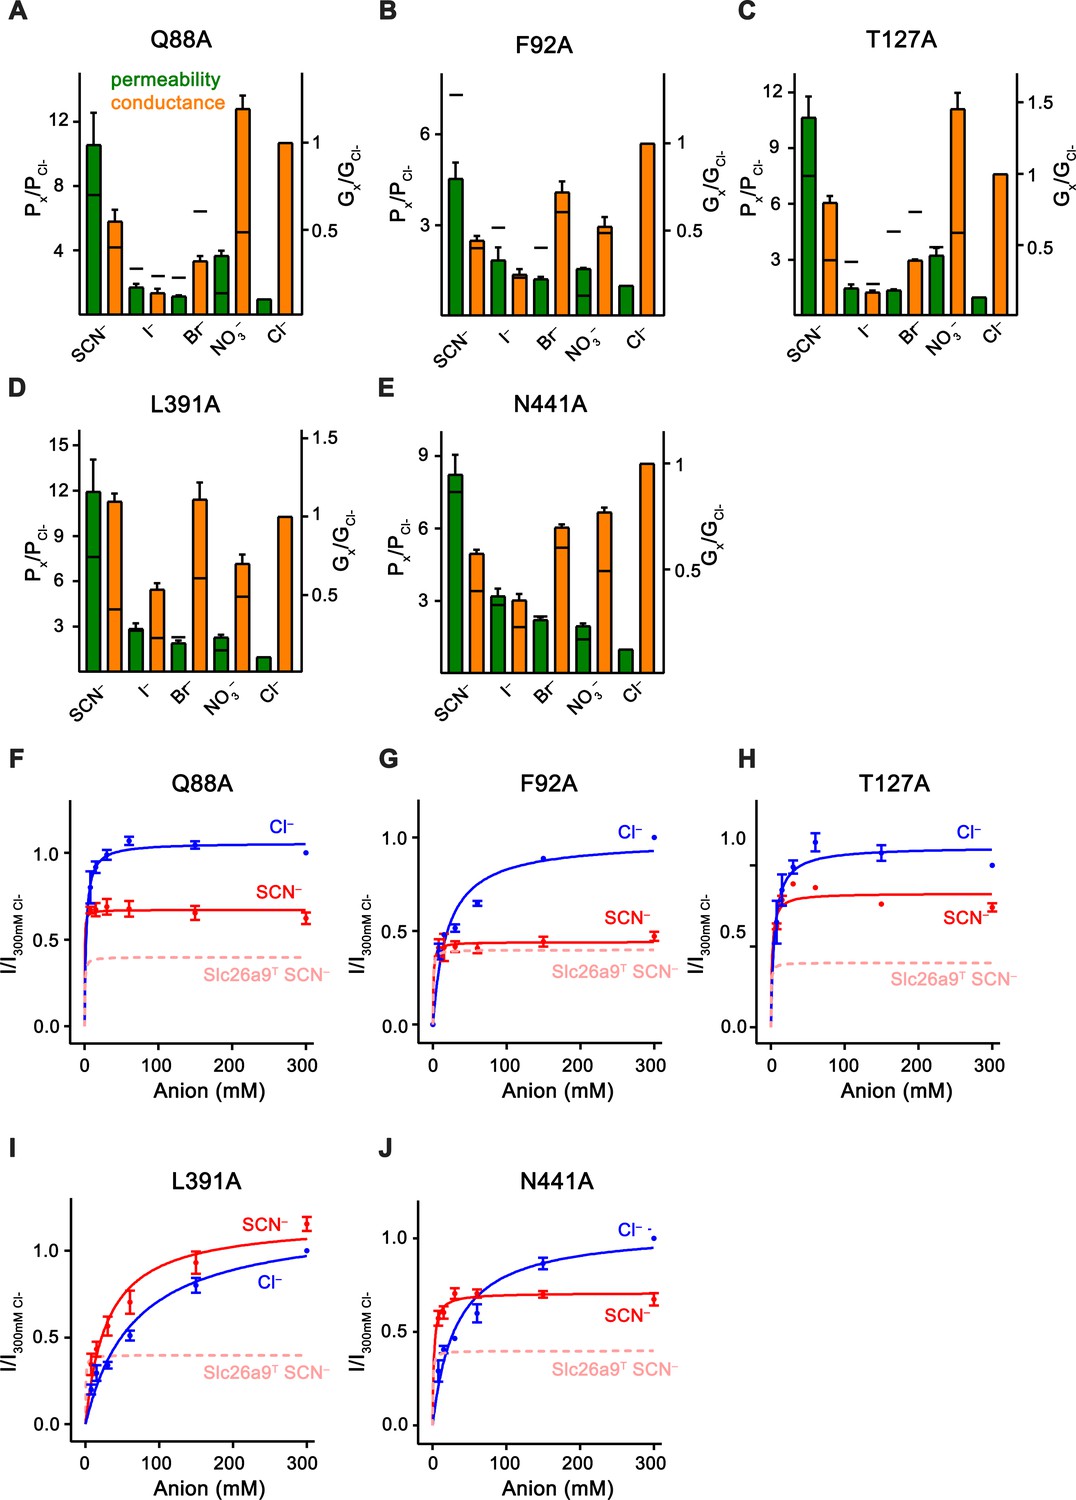
Kinetic properties of anion binding site mutants.
Data was recorded from excised patches. (A–E) Relative permeabilities (Px/PCl, green) and macroscopic conductivities (Gx/GCl, orange) for (A) Q88A, (B) F92A, (C) T127A, (D) L391A and (E) N441A. Number of replicates for each mutant/ion combination corresponds directly to the values listed for the bi-ionic data in Figure 7—figure supplement 2. The black horizontal line for each bar indicates the corresponding value in WT Slc26a9T. (F–J) Mutant conductance–concentration relationships. Data was recorded from excised patches. Extracellular pipette NaCl concentration was kept constant at 7.5 mM, and patches were intracellularly perfused sequentially with 7.5–300 mM Cl– and SCN–, which allowed measurement of apparent Km values as well as assessment of relative Vmax for both anions. Macroscopic conductance corresponds to measured efflux currents at –100 mV, and data is normalized to efflux at 300 mM intracellular Cl–. Cl– and SCN– are displayed in blue and red, respectively. SCN– conductance data for WT-Slc26a9T is shown (pink) for comparison. Km, Vmax(SCN–)/Vmax(Cl–) ratios, and number of replicates were (F), Q88A: Km(Cl–)=2.3 mM, Km(SCN–)=0.2 mM, Vmax(SCN–)/Vmax(Cl–)=0.63, n = 3; (G), F92A: Km(Cl–)=19.2 mM, Km(SCN–)=0.8 mM, Vmax(SCN–)/Vmax(Cl–)=0.45, n = 3; (H), T127A: Km(Cl–)=4.7 mM, Km(SCN–)=1.6 mM, Vmax(SCN–)/Vmax(Cl–)=0.74, n = 3; (I), L391A: Km(Cl–)=44.0, Km(SCN–)=29.4, Vmax(SCN–)/Vmax(Cl–)=1.1, n = 4, and (J), N441A: Km(Cl–)=31.3, Km(SCN–)=1.8, Vmax(SCN–)/Vmax(Cl–)=0.68,n = 5. Relative to WT-Slc26a9T, L391A showed a considerable deviation in the parameters, Q88A and T127A displayed moderate shifts, and F92A and N441A had the least effective changes. For panels A-J, data is represented as averages of the indicated number of biological replicates, and errors are s.e.m.
Figure 8 with 3 supplements
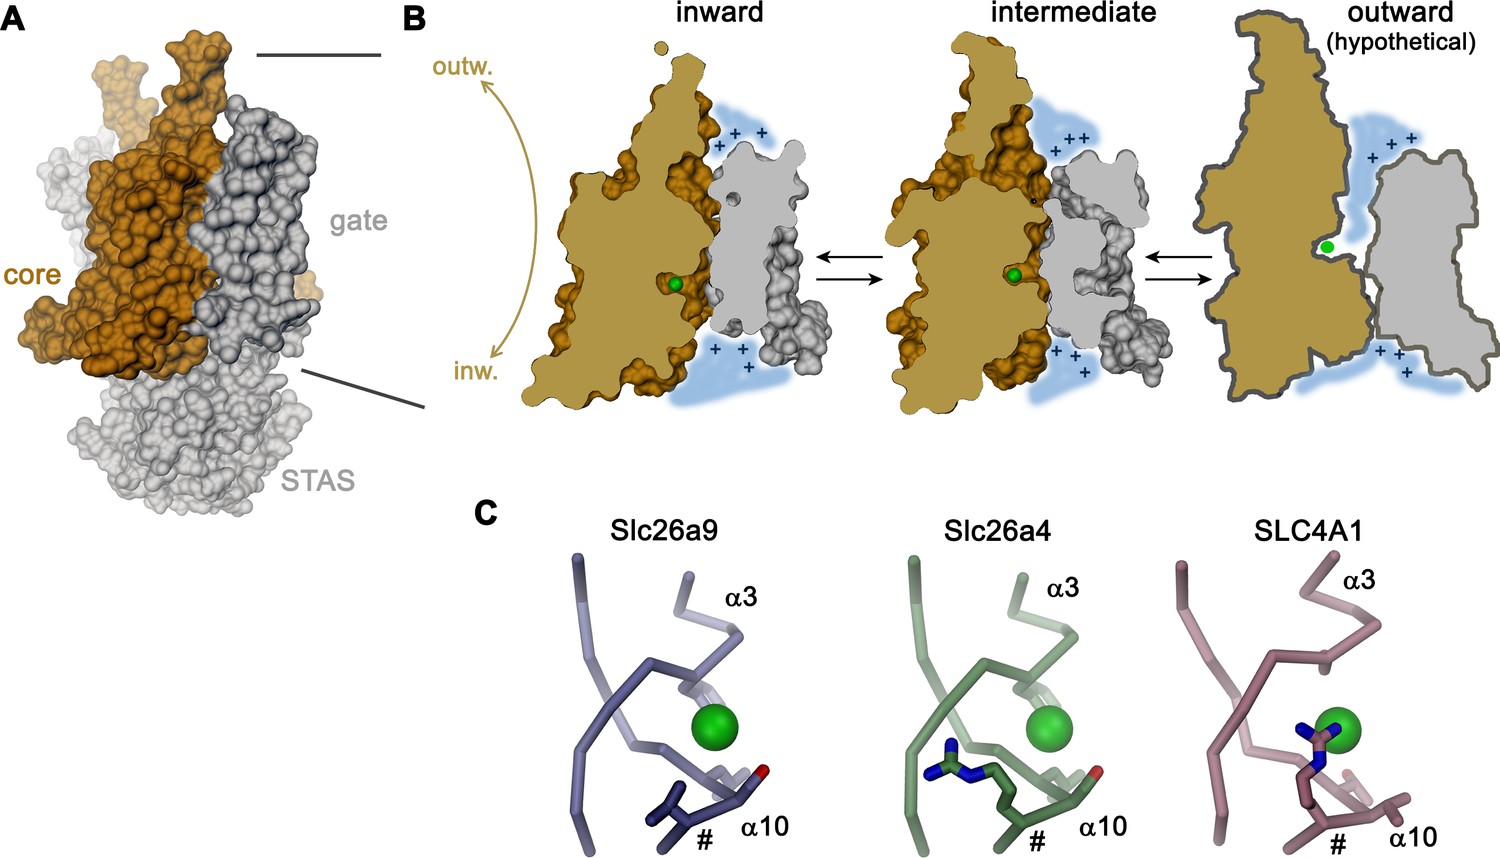
Transport mechanism.
(A) Molecular surface of Slc26a9T viewed towards the long dimension of the molecule. (B) Sections of the TMD in the inward-facing conformation defined by the Slc26a9T detergent structure (left), an intermediate conformation defined by the Slc26a9T nanodisc structure (center) and a schematic drawing of a potential outward-facing state (right). (C) Putative Cl–-binding site of Slc26a9 (left), a homology model of Slc26a4 (Pendrin, center) and SLC4A1/Band 3 (PDBID: 4YZF). A position that contains a basic residue in SLC26A4 and all mammalian SLC26 paralogs except for Slc26a9 is labeled (#). A and B, STAS domain and gate modules are colored in gray, the core module in beige. A-C, The putative position of a bound Cl– is indicated as green sphere.
Figure 8—figure supplement 1
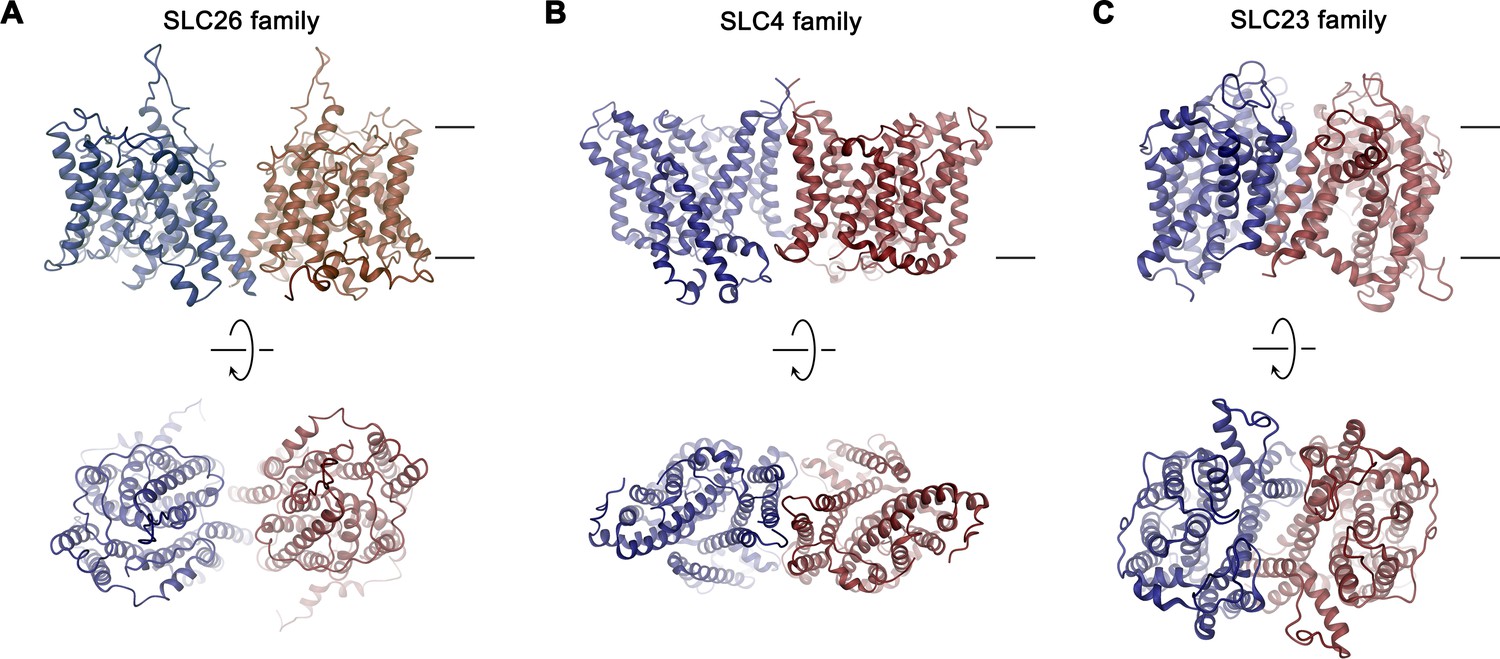
Dimer architecture of transport proteins sharing the 7 + 7 inverted repeat topology.
The TMDs of selected transporters are shown as representatives for their respective family as ribbon. (A), SLC26 family: Slc26a9, (B), SLC4 family: SLC4A1/Band 3 (PDBID: 4YZF), (C), SLC23 family: UapA (PDBID: 5I6C). Top panels show view from within the membrane with approximate membrane boundaries indicated, bottom panels show view from the extracellular side.
Figure 8—figure supplement 2
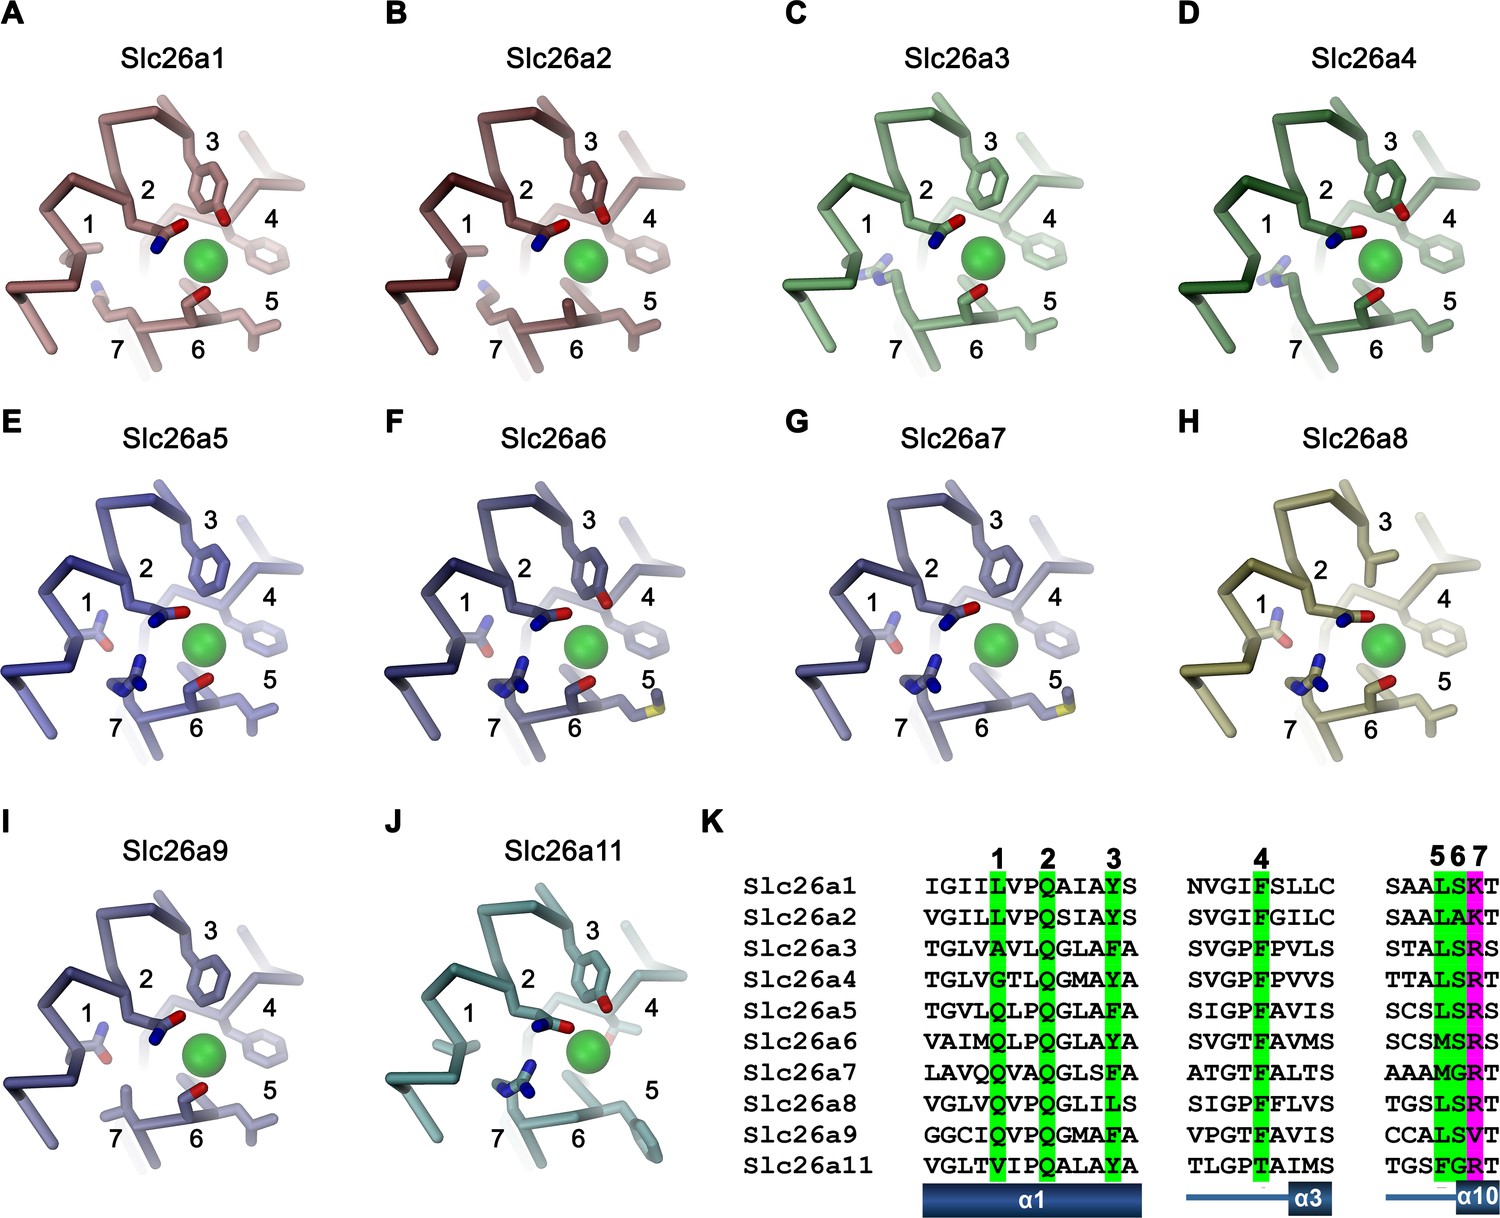
Ion binding by SLC26 proteins.
Putative anion binding region of murine Slc26 paralogs are shown as Cα-trace with selected side-chains in interaction distance with the bound anion displayed as sticks. Numbering corresponds to the sequential location of displayed residues on the respective sequences. A bound anion is shown as green sphere, Homology model of (A), Slc26a1, (B), Slc26a2, (C), Slc26a3, (D) Slc26a4, (E), Slc26a5, (F), Slc26a6, (G) Slc26a7, (H), Slc26a8, (I), cryo-EM structure of Slc26a9, (J) homology model of Slc26a11. (K) Alignment of sequence regions of murine Slc26a9 paralogs displayed in panels A-J. Residues involved in anion interaction are numbered and highlighted in green (general residues) and magenta (position that harbors a cationic residue in all paralogs except for Slc26a9).
Figure 8—figure supplement 3
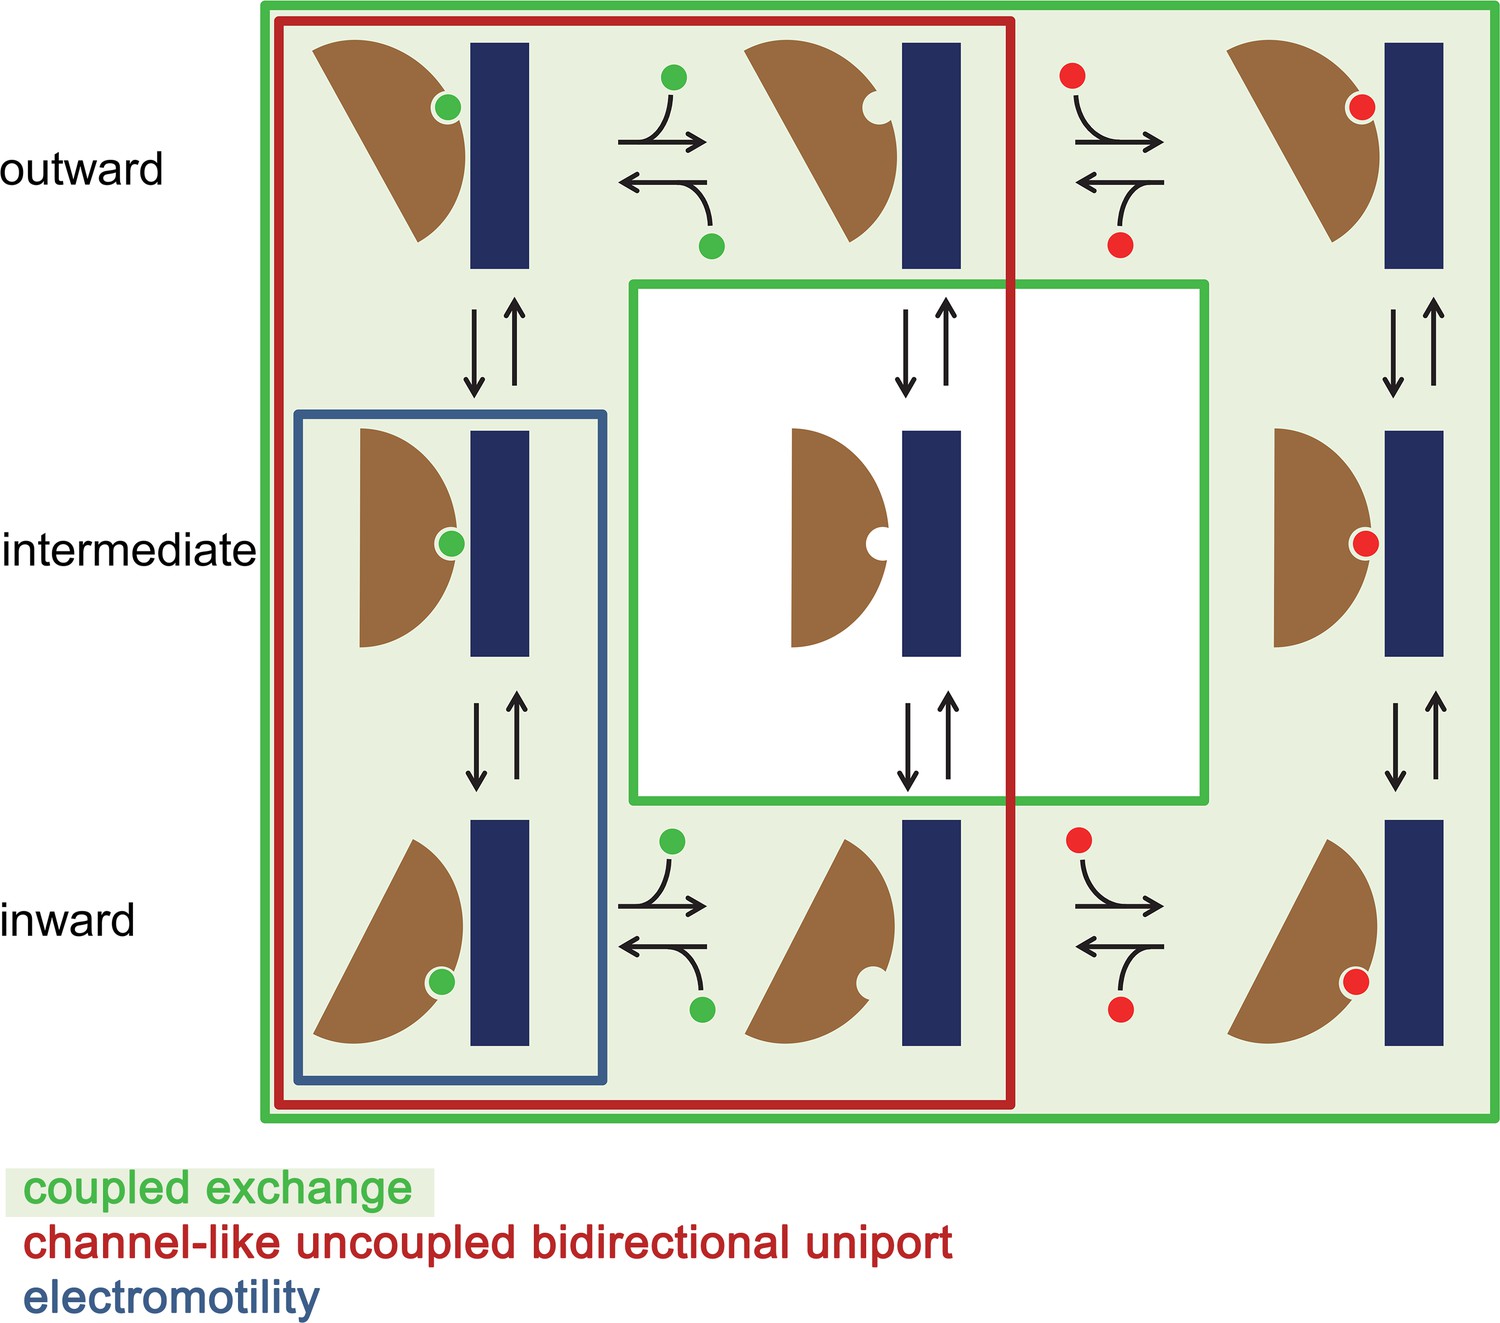
Mechanistic relationships within the SLC26 family.
Schematic depiction of plausible kinetic cycles underlying different transport modes observed in the SLC26 family. States occupied in a channel-like uncoupled bidirectional uniport as observed in Slc26a9 are enclosed by a red box. In this mechanism, the transporter can change its access to either side of the membrane in a substrate-loaded or an unloaded state. In case of coupled exchange (indicated by light green background) conformational transition of the unloaded transporter is energetically disfavored. In case of the electromotility observed for the protein SLC26A5 (Prestin) the binding site is accessible from the inside and the transporter transitions to an intermediate state whereas the full transition to an outward-facing state is likely disfavored.
Videos
Video 1
Cryo-EM density map of the dimeric Slc26a9T.
Shown is the cryo-EM map of the protein in detergent with the refined model of the inward-facing state superimposed.
Video 2
Cryo-EM density map of the dimeric Slc26a9T in nanodiscs.
Shown is the cryo-EM map of the protein in nanodiscs with the modeled structure of the intermediate state superimposed.
Video 3
The structure of Slc26a9T.
Shown are unique features of a mammalian SLC26 transporter. The oligomerization interface is minimal between the transmembrane domains and is predominantly mediated by the swapped STAS domains. The view of the transmembrane domain only shows two independent modules: core and gate.
Video 4
Conformational transition from the inward-facing to the intermediate state.
Ribbon representation of the transmembrane domain as a morph between the inward-facing and intermediate states. The structure is viewed from the peripheral. Residues 276 to 312 are removed for clarity. The putative trajectory of the chloride ion is also shown.
Video 5
Structure of the presumed ion binding site.
Ribbon representation of the anion binding site with side-chains of interacting residues displayed as sticks. Surface of the binding pocket around a modeled chloride (green sphere) is shown. View is as in Figure 7A.
Tables
Table 1
Cryo-EM data collection, refinement and validation statistics.
https://doi.org/10.7554/eLife.46986.012| Dataset 1 Slc26a9T in detergent (EMD-4997) (PDB 6RTC) | Dataset 2 Slc26a9T in nanodiscs (EMD-4998) (PDB 6RTF) | |
|---|---|---|
| Data collection and processing | ||
| Microscope | FEI Titan Krios | FEI Tecnai G2 Polara |
| Camera | Gatan K2 Summit + GIF | Gatan K2 Summit + GIF |
| Magnification | 6,511 | 37,313 |
| Voltage (kV) | 300 | 300 |
| Electron exposure (e–/Å2) | 70 | 60 |
| Defocus range (μm) | −0.5 to −3.0 | −0.5 to −3.0 |
| Pixel size (Å)* | 1.075 (0.5375) | 1.34 |
| Symmetry imposed | C2 | C2 |
| Initial particle images (no.) | 416,164 | 711,032 |
| Final particle images (no.) | 112,930 | 17,442 |
| Map resolution (Å) FSC threshold 0.143 | 3.96 | 7.77 |
| Map resolution range (Å) | 3.0–4.2 | 6.0–10.0 |
| Refinement | ||
| Model resolution (Å) FSC threshold 0.5 | 4.0 | 8.0 |
| Model resolution range (Å) | 118–3.96 | |
| Map sharpening b-factor (Å2) | −205 | −512 |
| Model composition Non-hydrogen atoms Protein residues | 9570 1242 | 9570 1242 |
| B factors (Å2) Protein | 73 | 73 |
| Refmac FSCavg/Rfactor | 0.851/0.351 | |
| R.m.s. deviations Bond lengths (Å) Bond angles (°) | 0.005 0.888 | 0.006 1.195 |
| Validation MolProbity score Clashscore Poor rotamers (%) | 1.10 1.19 0 | 1.07 0.78 0 |
| Ramachandran plot Favored (%) Allowed (%) Disallowed (%) | 96.10 3.90 0 | 95.28 4.72 0 |
-
*Values in parentheses indicate the pixel size in super-resolution.
Table 2
Transport properties of WT and mutated Slc26a9T.
https://doi.org/10.7554/eLife.46986.029| WT* | Q88A | F92A | T127A | F128A | L391A | S392A | N441A | ||
|---|---|---|---|---|---|---|---|---|---|
| SCN– | Erev (mV)† Px/PCl Gx/GCl | 50.5 7.5 0.43 | 58.4 10.6 0.55 | 37.8 4.5 0.44 | 59.3 10.7 0.80 | 68.7 14.9 1.46 | 61.5 12.0 1.10 | 71.5 18.0 1.39 | 52.9 8.2 0.57 |
| I– | Erev (mV) Px/PCl Gx/GCl | 26.6 2.9 0.23 | 16.3 1.9 0.14 | 14.1 1.8 0.25 | 9.5 1.5 0.17 | 31.0 3.5 0.53 | 23.5 2.6 0.54 | 53.2 8.4 1.31 | 29.1 3.2 0.35 |
| Br– | Erev (mV) Px/PCl Gx/GCl | 21.3 2.4 0.60 | 3.7 1.2 0.32 | 5.1 1.2 0.72 | 7.6 1.4 0.40 | 24.6 2.7 1.13 | 16.1 1.9 1.11 | 40.7 5.2 1.78 | 20.0 2.2 0.70 |
| NO3– | Erev (mV) Px/PCl Gx/GCl | 9.4 1.5 0.49 | 32.6 3.7 1.20 | 11.2 1.6 0.52 | 29.0 3.2 1.46 | 28.5 3.1 1.04 | 20.7 2.3 0.70 | 39.1 4.8 1.31 | 16.9 2.0 0.77 |
| Cl– | Erev (mV) Px/PCl Gx/GCl | −0.1 1 1 | −1.4 1 1 | −1.5 1 1 | −0.5 1 1 | 0 1 1 | −0.7 1 1 | 0.3 1 1 | −0.3 1 1 |
| F– | Erev (mV) Px/PCl Gx/GCl | −81.1 .05 nd¶ | −64.2 .08 nd | −81.0 .04 nd | −74.5 .07 nd | −67.6 .07 nd | −81.0 .05 nd | −58.8 0.11 nd | −86.7 0.03 nd |
| HCO3– | Erev (mV) Px/PCl Gx/GCl | −81.7 0.05 nd | −54.4 0.12 nd | −69.5 0.07 nd | −84.7 0.04 nd | −47.3 0.16 nd | −93.1 0.03 nd | −57.4 0.10 nd | −76.0 0.05 nd |
| SO42– | Erev (mV) Px/PCl Gx/GCl | −96.9 0.01 nd | −102.2 0.01 nd | −78.0 0.01 nd | −104.5 0 nd | −70.5 0.02 nd | −93.6 0.01 nd | −71.2 0.02 nd | −82.4 0.01 nd |
| E30mM Cl‡ | −37.7 | −39.3 | −38.5 | −39.8 | −42.1 | −37.9 | −39.0 | −38.3 | |
| Km,Cl (mM) § | 29.5 | 2.3 | 19.2 | 4.7 | 18.6 | 44.0 | 54.1 | 31.3 | |
| Km,SCN (mM) § | 0.5 | 0.2 | 0.8 | 1.6 | 5.2 | 29.4 | 3.8 | 0.7 | |
| VSCN/VCl § | 0.44 | 0.63 | 0.44 | 0.74 | 1.08 | 1.08 | 0.83 | 0.68 |
-
*WT refers to non-mutated Slc26a9T.
†Erev values, Px/PCl, and Gx/GCl were derived from bi-ionic data in Figure 1—figure supplement 3B–F, and Figure 7—figure supplement 2.
-
‡Measured reversal potential, in mV, under a 5-fold NaCl gradient (ECl = –40.2 mV). Extracted from data in Figure 1C and Figure 7—figure supplement 1A–H.
§Km and VSCN/VCl values are derived from conductance–concentration data presented in Figure 1D, Figure 7, and Figure 7—figure supplement 3F–J.
-
¶nd, not determined.
Key resources table
| Reagent type (species) or resource | Designation | Source or reference | Identifier | Additional information |
|---|---|---|---|---|
| Chemical compound, drug | Pro293S-CDM medium | Lonza | Cat#BE02-025Q | |
| Chemical compound, drug | HyClone HyCell TransFx-H medium | GE Healthcare | Cat#SH30939.02 | |
| Chemical compound, drug | L-glutamine | Millipore Sigma | Cat#G7513 | |
| Chemical compound, drug | Penicillin-streptomycin | Millipore Sigma | Cat#P0781 | |
| Chemical compound, drug | Fetal bovine serum | Millipore Sigma | Cat#F7524 | |
| Chemical compound, drug | Pluronic F-68 | ThermoFisher Scientific | Cat#24040032 | |
| Chemical compound, drug | Polyethylenimine 25 K MW, linear | Polysciences | Cat#23966–1 | |
| Chemical compound, drug | Dulbecco’s Modified Eagle’s Medium (DMEM) | Millipore Sigma | Cat#D5546 | |
| Chemical compound, drug | Valproic acid | Millipore Sigma | Cat#P4543 | |
| Chemical compound, drug | cOmplete, EDTA-free Protease Inhibitor Cocktail | Roche | Cat#5056489001 | |
| Chemical compound, drug | Digitonin | AppliChem | Cat#A1905 | |
| Chemical compound, drug | Glyco-diosgenin | Anatrace | Cat#GDN101 | |
| Chemical compound, drug | D-desthiobiotin | Millipore Sigma | Cat#D1411 | |
| Chemical compound, drug | n-dodecyl-β-D-maltoside (DDM) | Anatrace | Cat#D310 | |
| Chemical compound, drug | Cholesteryl hemisuccinate, tris salt (CHS) | Anatrace | Cat#CH210 | |
| Chemical compound, drug | 1-palmitoyl-2-oleoyl-sn-glycero-3-phosphoethanolamine (POPE) | Avanti Polar Lipids, Inc | Cat#850757 | |
| Chemical compound, drug | 1-palmitoyl-2-oleoyl-sn-glycero-3-phospho-(1'-rac-glycerol) (POPG) | Avanti Polar Lipids, Inc | Cat#840457 | |
| Chemical compound, drug | Diethyl ether | Millipore Sigma | Cat#296082 | |
| Chemical compound, drug | Triton X-100 | Millipore Sigma | Cat#T9284 | |
| Chemical compound, drug | Biotin | Millipore Sigma | Cat#B4501 | |
| Chemical compound, drug | 9-amino-6-chloro-2-methoxyacridine (ACMA) | Thermo Fisher Scientific | Cat#A1324 | |
| Chemical compound, drug | carbonyl cyanide 3-chloropheny lhydrazone (CCCP) | Merck Millipore | Cat#C2759 | |
| Chemical compound, drug | 4,4’-Diisothiocyanatostilbene-2,2’-disulfonic acid (DIDS) | Millipore Sigma | Cat#D3514 | |
| Commercial assay or kit | QuikChange site-directed mutagenesis kit | Agilent | Cat#200523 | |
| Commercial assay or kit | NucleoBond Xtra Maxi kit | Macherey-Nagel | Cat#740416 | |
| Commercial assay or kit | StrepTactin Superflow affinity resin slurry | IBA Lifesciences | Cat#2-1206-002 | |
| Commercial assay or kit | Superose 6 10/300 GL | GE Healthcare | Cat#17-5172-01 | |
| Commercial assay or kit | Zorbax GF-450 | Agilent | Cat#884973–902 | |
| Commercial assay or kit | Superose 6 5/150 | GE Healthcare | Cat#29091597 | |
| Commercial assay or kit | Pierce Streptavidin Plus UltraLink Resin | Thermo Fisher Scientific | Cat#53117 | |
| Commercial assay or kit | Bio-Beads SM-2 | Bio-Rad | Cat# 1523920 | |
| Commercial assay or kit | Avestin LiposoFast Liposome Factory Basic | Millipore Sigma | Cat#Z373400 | |
| Commercial assay or kit | 400 nm polycarbonate filters for LiposoFast | Millipore Sigma | Cat#Z373435 | |
| Commercial assay or kit | 96-well black-walled microplate | Thermo Fisher Scientific | Cat#M33089 | |
| Commercial assay or kit | 200 mesh Au 1.2/1.3 cryo-EM grids | Quantifoil | Cat#N1-C14nAu20-01 | |
| Commercial assay or kit | Amicon 100 kDa MWCO centrifugal filter | EMD Millipore | Cat#UFC910008 | |
| Commercial assay or kit | 0.22 µm Ultrafree-MC Centrifugal Filter | EMD Millipore | Cat#UFC30GV | |
| Commercial assay or kit | Borosilicate glass capillary with filament | Sutter Instrument | Cat#BF150-86-10HP | |
| Cell line (human) | HEK293S GnTI- | ATCC | CRL-3022 | |
| Cell line (human) | HEK-293T | ATCC | CRL-1573 | |
| Recombinant DNA | Mus musculus Slc26a9 ORF shuttle clone | Source BioScience | ORFeome# OCACo5052B0115D; GenBank BC160193 | |
| Recombinant DNA | pcDNA 3.1 (+)vector, Invitrogen | Thermo Fisher Scientific | Cat# V79020 | |
| Recombinant DNA | Modified pcDNA 3.1 vector with C-terminal 3C protease cleavage site, Venus and Myc tags and streptavidin binding peptide | Raimund Dutzler laboratory | N/A | |
| Recombinant DNA | Modified pcDNA 3.1 vector with C-terminal 3C protease cleavage site, Myc tag and streptavidin binding peptide | Raimund Dutzler laboratory | N/A | |
| Recombinant DNA | Expression vector encoding membrane scaffold protein (MSP) E3D1, pMSP1E3D1 | Denisov et al., 2007 | Addgene, Cat#20066 | |
| Software,algorithm | SerialEM 3.5.0 | Mastronarde, 2005 | http://bio3d.colorado.edu/SerialEM/ | |
| Software, algorithm | RELION-3.0 | Scheres, 2012 | https://www2.mrc-lmb.cam.ac.uk/relion/ | |
| Software, algorithm | CTFFIND4.1 | Rohou and Grigorieff, 2015 | http://grigoriefflab.jan elia.org/ctf | |
| Software, algorithm | Bsoft 1.9.5 | Heymann and Belnap, 2007 | https://lsbr.niams.nih.gov/bsoft/ | |
| Software, algorithm | Coot 0.8.8 | Emsley and Cowtan, 2004 | https://www2.mrc-lmb.cam.ac.uk/person al/pemsley/coot/ | |
| Software, algorithm | PHENIX 1.14 | Adams et al., 2002 | http://phenix-online.org/ | |
| Software, algorithm | REFMAC5 | Murshudov et al., 2011 | http://www.ccpem.ac.uk/ | |
| Software, algorithm | MSMS | Sanner et al., 1996 | http://mgltools.scripps.edu/packages/MSMS/ | |
| Software, algorithm | DINO 0.9.4 | http://www.dino3d.org | http://www.dino3d.org | |
| Software, algorithm | PyMOL 2.3.0 | DeLano, 2002 | https://pymol.org/2/ | |
| Software, algorithm | Chimera 1.13.1 | Pettersen et al., 2004 | http://www.cgl.ucsf.edu/chimera/ | |
| Software, algorithm | ChimeraX 0.7 | Goddard et al., 2018 | https://www.cgl.ucsf.edu/chimerax/ | |
| Software, algorithm | CHARMM | Brooks et al., 1983 | https://www.charmm.org/charmm/ | |
| Software, algorithm | SWISS-MODEL | Biasini et al., 2014 | https://swissmodel.expasy.org/ | |
| Software, algorithm | Axon Clampex 10.6 | Molecular Devices | N/A | |
| Software, algorithm | Axon Clampfit 10.6 | Molecular Devices | N/A | |
| Software, algorithm | Prism 7 | GraphPad | https://www.graphpad.com/ |
Additional files
-
Transparent reporting form
- https://doi.org/10.7554/eLife.46986.035
Download links
A two-part list of links to download the article, or parts of the article, in various formats.
Downloads (link to download the article as PDF)
Open citations (links to open the citations from this article in various online reference manager services)
Cite this article (links to download the citations from this article in formats compatible with various reference manager tools)
Cryo-EM structures and functional characterization of murine Slc26a9 reveal mechanism of uncoupled chloride transport
eLife 8:e46986.
https://doi.org/10.7554/eLife.46986


