Dynamic ubiquitination determines transcriptional activity of the plant immune coactivator NPR1
- University of Edinburgh, United Kingdom
Figures
Figure 1 with 1 supplement
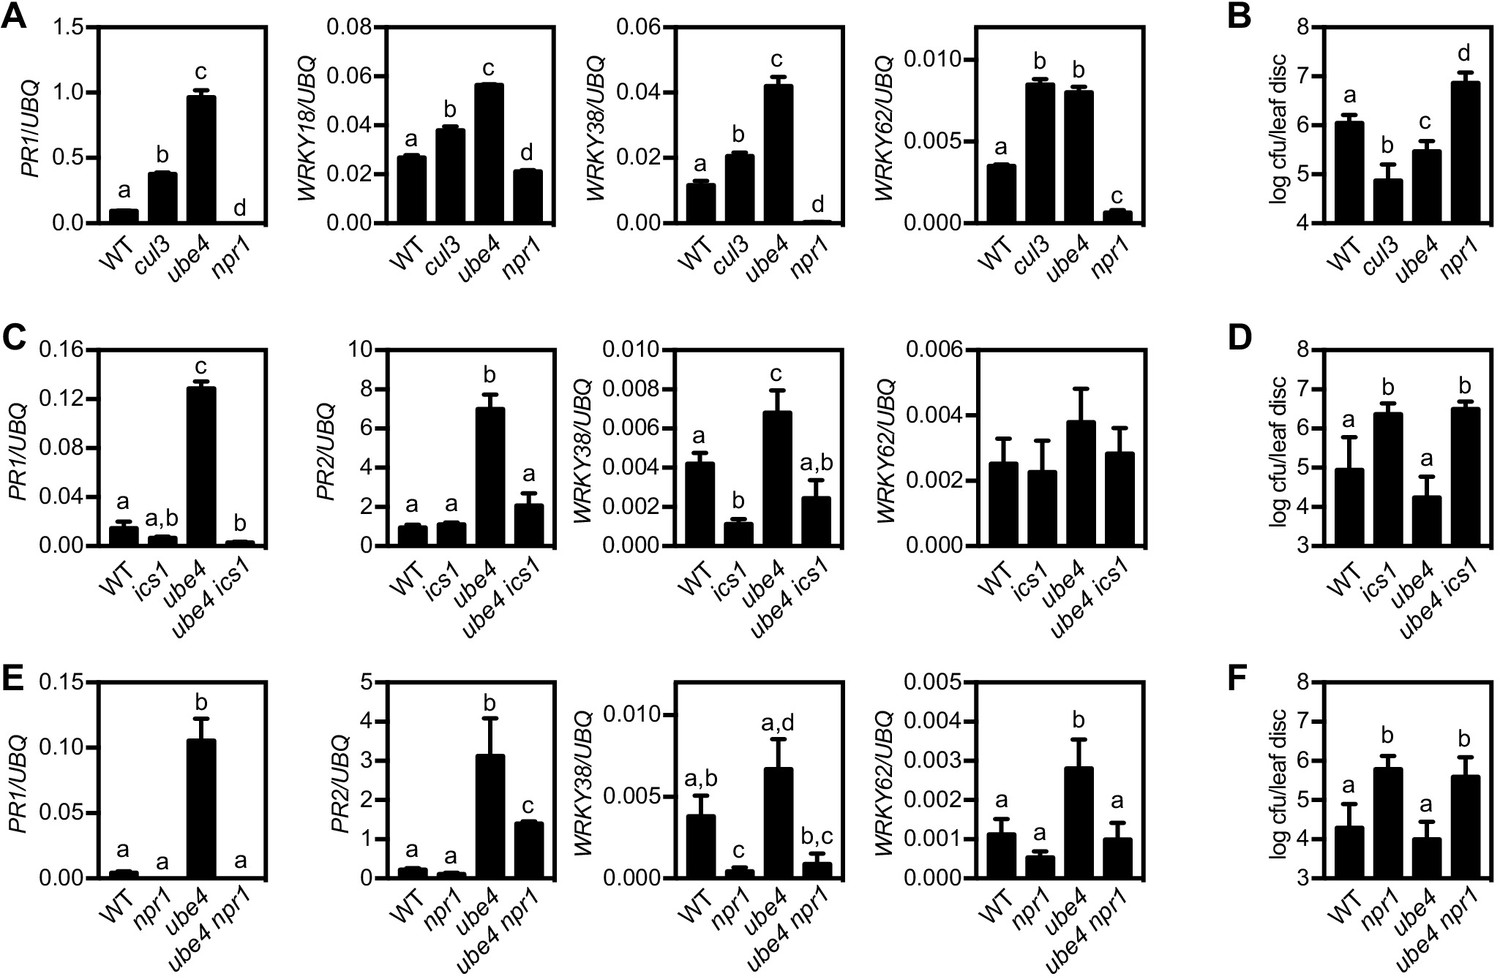
The E4 ubiquitin ligase UBE4 regulates SA-mediated plant immunity.
(A) Expression of NPR1 target genes normalised relative to constitutively expressed UBQ5 in four-week old plants of the indicated genotypes. Data points represent mean ± SD while letters denote statistically significant differences between samples (Tukey Kramer ANOVA; α = 0.05, n = 3). (B) Adult plants were treated with or without 0.5 mM SA 24 hr prior to inoculation with 5 × 10⁶ colony forming units (cfu)/ml Psm ES4326. Leaf discs were analysed for bacterial growth 4 days post-infection (dpi). Error bars represent 95% confidence limits, while letters denote statistically significant differences between samples (Tukey Kramer ANOVA; α = 0.05, n = 8). (C) Expression of NPR1 target genes was analysed as in (A). (D) Adult plants were inoculated with 5 × 10⁵ cfu/ml Psm ES4326 and leaf discs were analysed for bacterial growth at four dpi. Error bars represent 95% confidence limits, while letters denote statistically significant differences between samples (Tukey Kramer ANOVA; α = 0.05, n = 8). (E) Basal expression of NPR1 target genes were analysed as in (A). (F) Adult plants of indicated genotypes were infected and analysed as in (D).
Figure 1—figure supplement 1
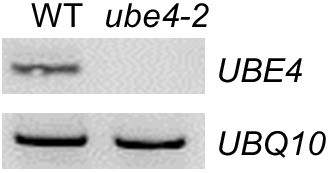
UBE4 knockout.
Expression of UBE4 was analysed by RT-PCR in the stated genotypes using primers specific to UBE4 or UBQ10 as a loading control.
Figure 2 with 1 supplement
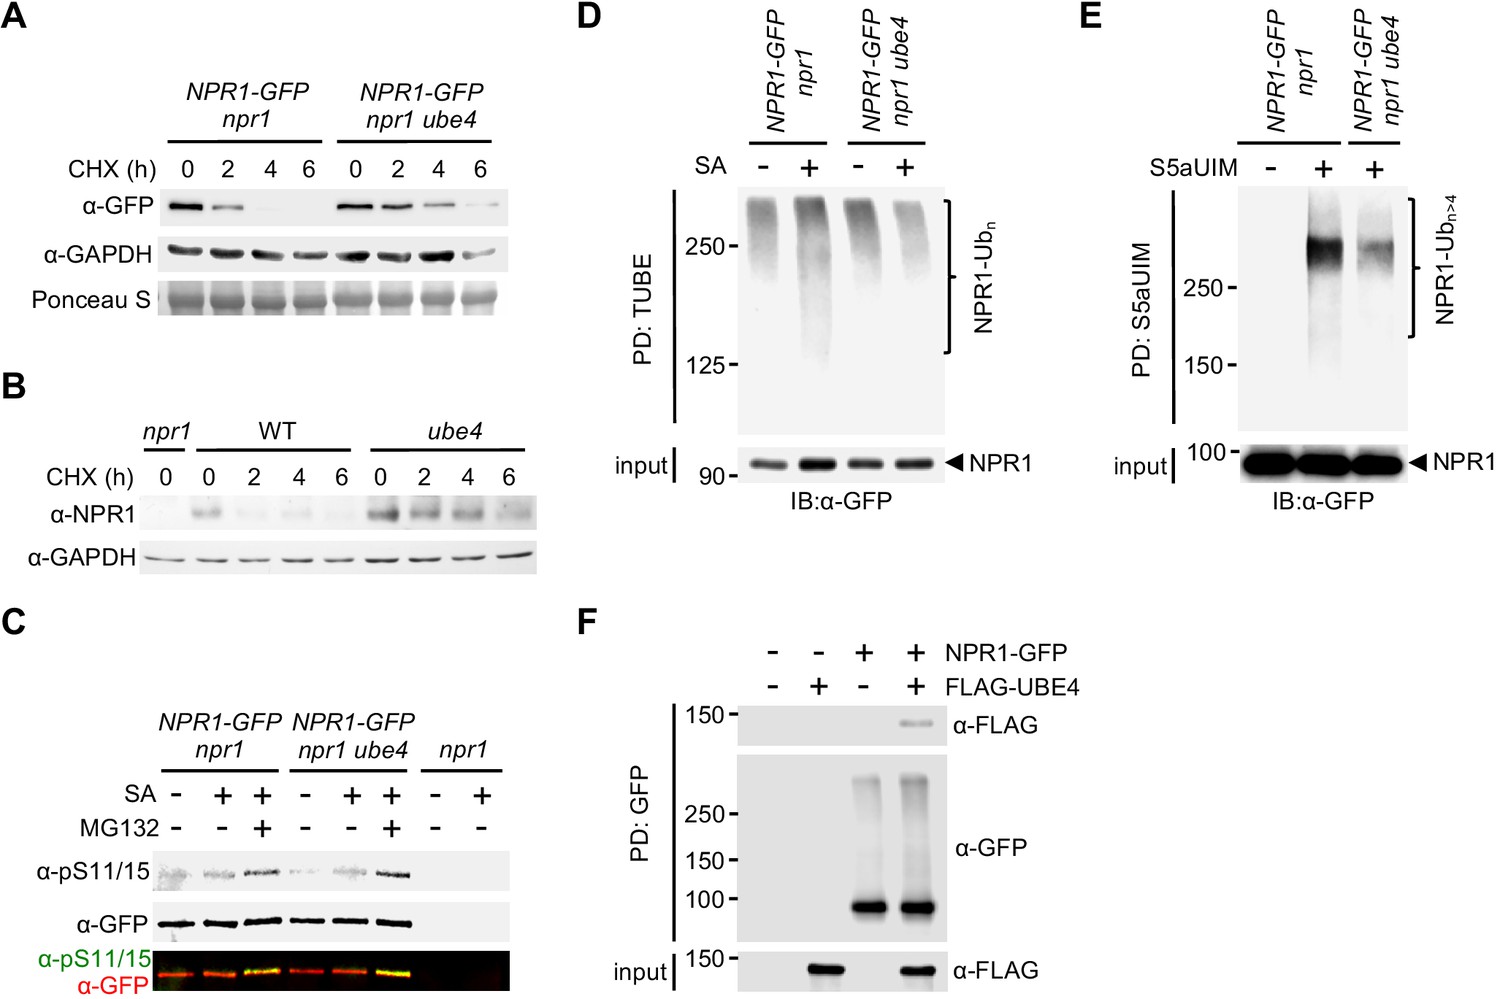
UBE4 facilitates polyubiquitination and degradation of NPR1 coactivator.
(A) Seedlings expressing 35S::NPR1-GFP in the indicated genetic backgrounds were treated with 0.5 mM SA for 24 hr before addition of 100 μM CHX to inhibit protein synthesis. NPR1-GFP protein levels were monitored by immunoblot analysis, while S5a levels confirmed equal loading. (B) Seedlings were treated with 0.5 mM SA for 24 hr before addition of 100 μM CHX. Endogenous NPR1 protein levels were then monitored at the indicated times by immunoblot analysis, while GAPDH levels confirmed equal loading. (C) Seedlings expressing 35S::NPR1-GFP in the indicated genetic backgrounds were pre-treated with 0.5 mM SA for 2 hr followed by addition of vehicle (DMSO) or 100 μM MG132 for an additional 4 hr. Phosphorylated Ser11/15 (pS11/15) and total NPR1-GFP levels were then determined by immunoblotting. (D) Seedlings expressing 35S::NPR1-GFP in the indicated genetic backgrounds were pre-treated with 0.5 mM SA for 6 hr followed by addition of 100 μM MG132 for an additional 18 hr before ubiquitinated proteins were pulled down using GST-TUBEs. Input and ubiquitinated NPR1-GFP (NPR1-Ubn) were detected by immunoblotting with a GFP antibody. (E) Seedlings expressing 35S::NPR1-GFP in the indicated genetic backgrounds were pre-treated with 0.5 mM SA for 2 hr followed by addition of 100 μM MG132 for an additional 4 hr before ubiquitinated proteins were pulled down (PD) using His6-V5-S5a-UIMs. Unmodified and long-chain polyubiquitinated NPR1-GFP (NPR1-Ubn>4) were detected by immunoblotting with GFP antibodies. (F) Seedlings expressing 35S::NPR1-GFP in the indicated genetic backgrounds were treated for 6 hr with 0.5 mM SA followed by addition of 100 μM MG132 for a further 18 hr. Polyubiquitinated NPR1-GFP protein was then purified with GFP-Trap agarose and incubated for 2 hr with in vitro synthesised FLAG-UBE4. NPR1-GFP was detected by immunoblotting with GFP antibodies, while FLAG-UBE4 was detected using FLAG antibodies.
Figure 2—figure supplement 1
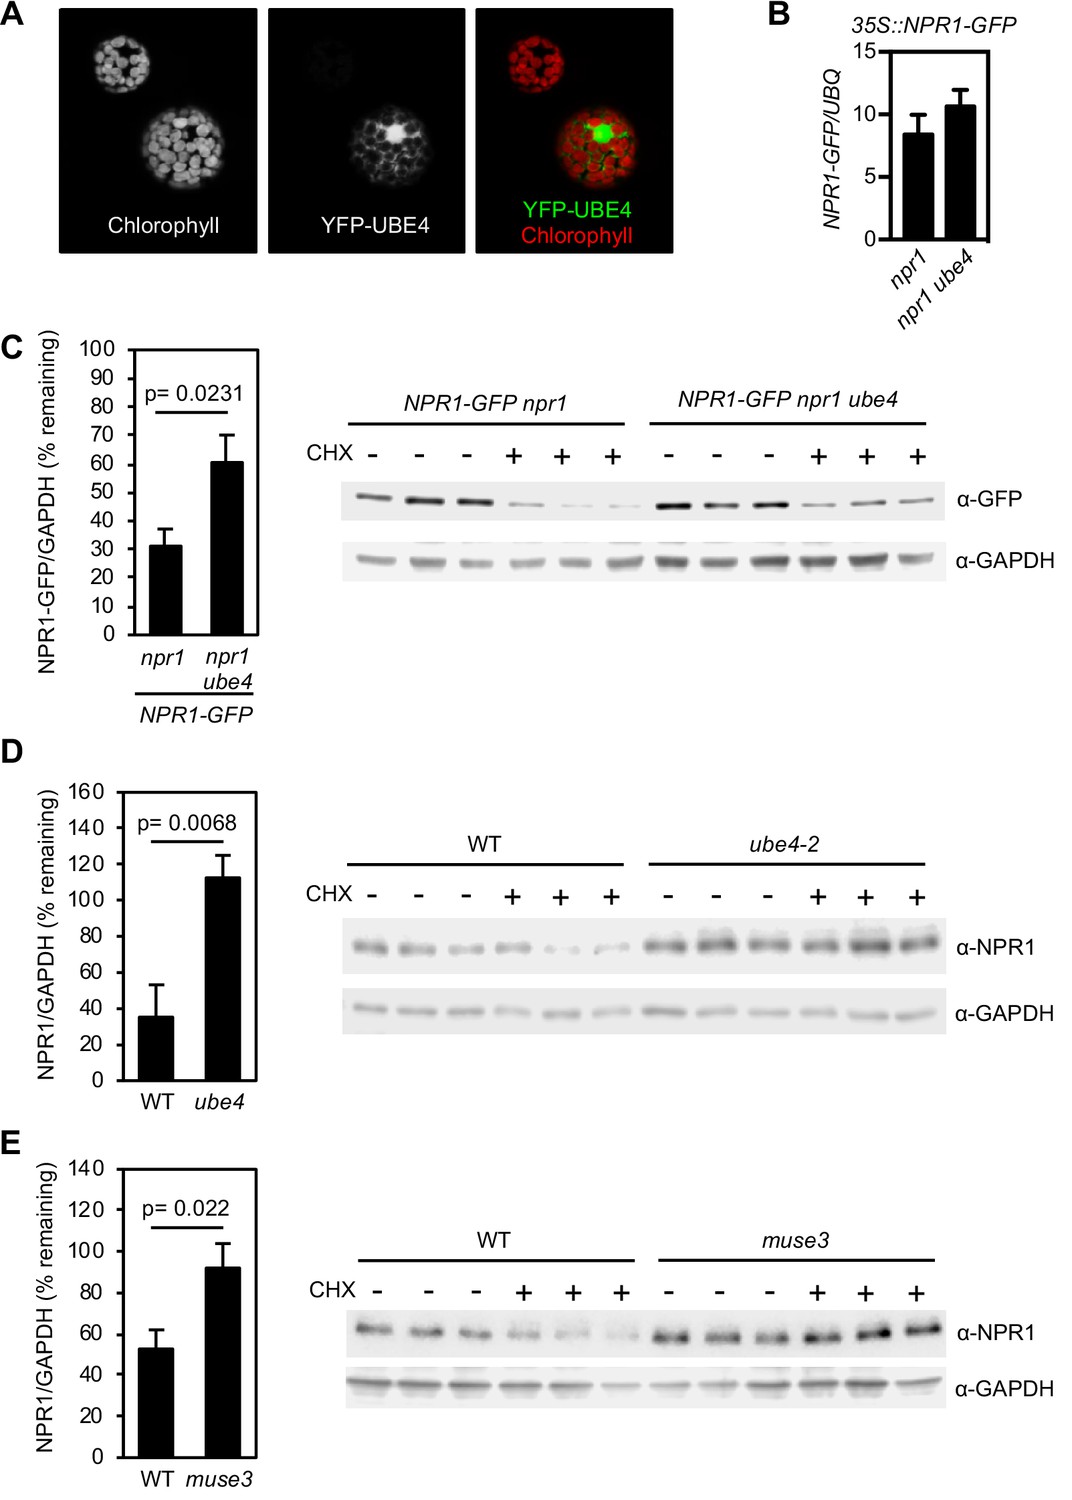
UBE4 cellular localisation and effect on NPR1 stability.
(A) 35S::YFP-UBE4 was transformed into protoplasts and subcellular localization analysed by confocal microscopy. Left: Auto-fluorescence of protoplasts. Middle: 35S::YFP-UBE4. Right: Merged image. (B) Seedlings of the indicated genotypes were treated with 0.5 mM SA for 24 hr before determining NPR1-GFP transgene expression normalised relative to constitutively expressed UBQ5. Data points represent mean ± SD with no statistically significant difference observed between samples (Tukey Kramer ANOVA; α = 0.05, n = 3). (C–E) Seedlings of the indicated genotypes were treated with 0.5 mM SA for 24 hr to induce NPR1 before addition of either DMSO (vehicle control) or 100 μM CHX for 4 hr. Endogenous NPR1 protein levels were quantified relative to GAPDH levels by quantitative immunoblotting and expressed as % remaining of the DMSO treated samples of each genotype. Data points represent mean ± SD (n = 3) with Student’s t-test p value indicated. Immunoblot images are shown with each replicate included.
Figure 3 with 1 supplement
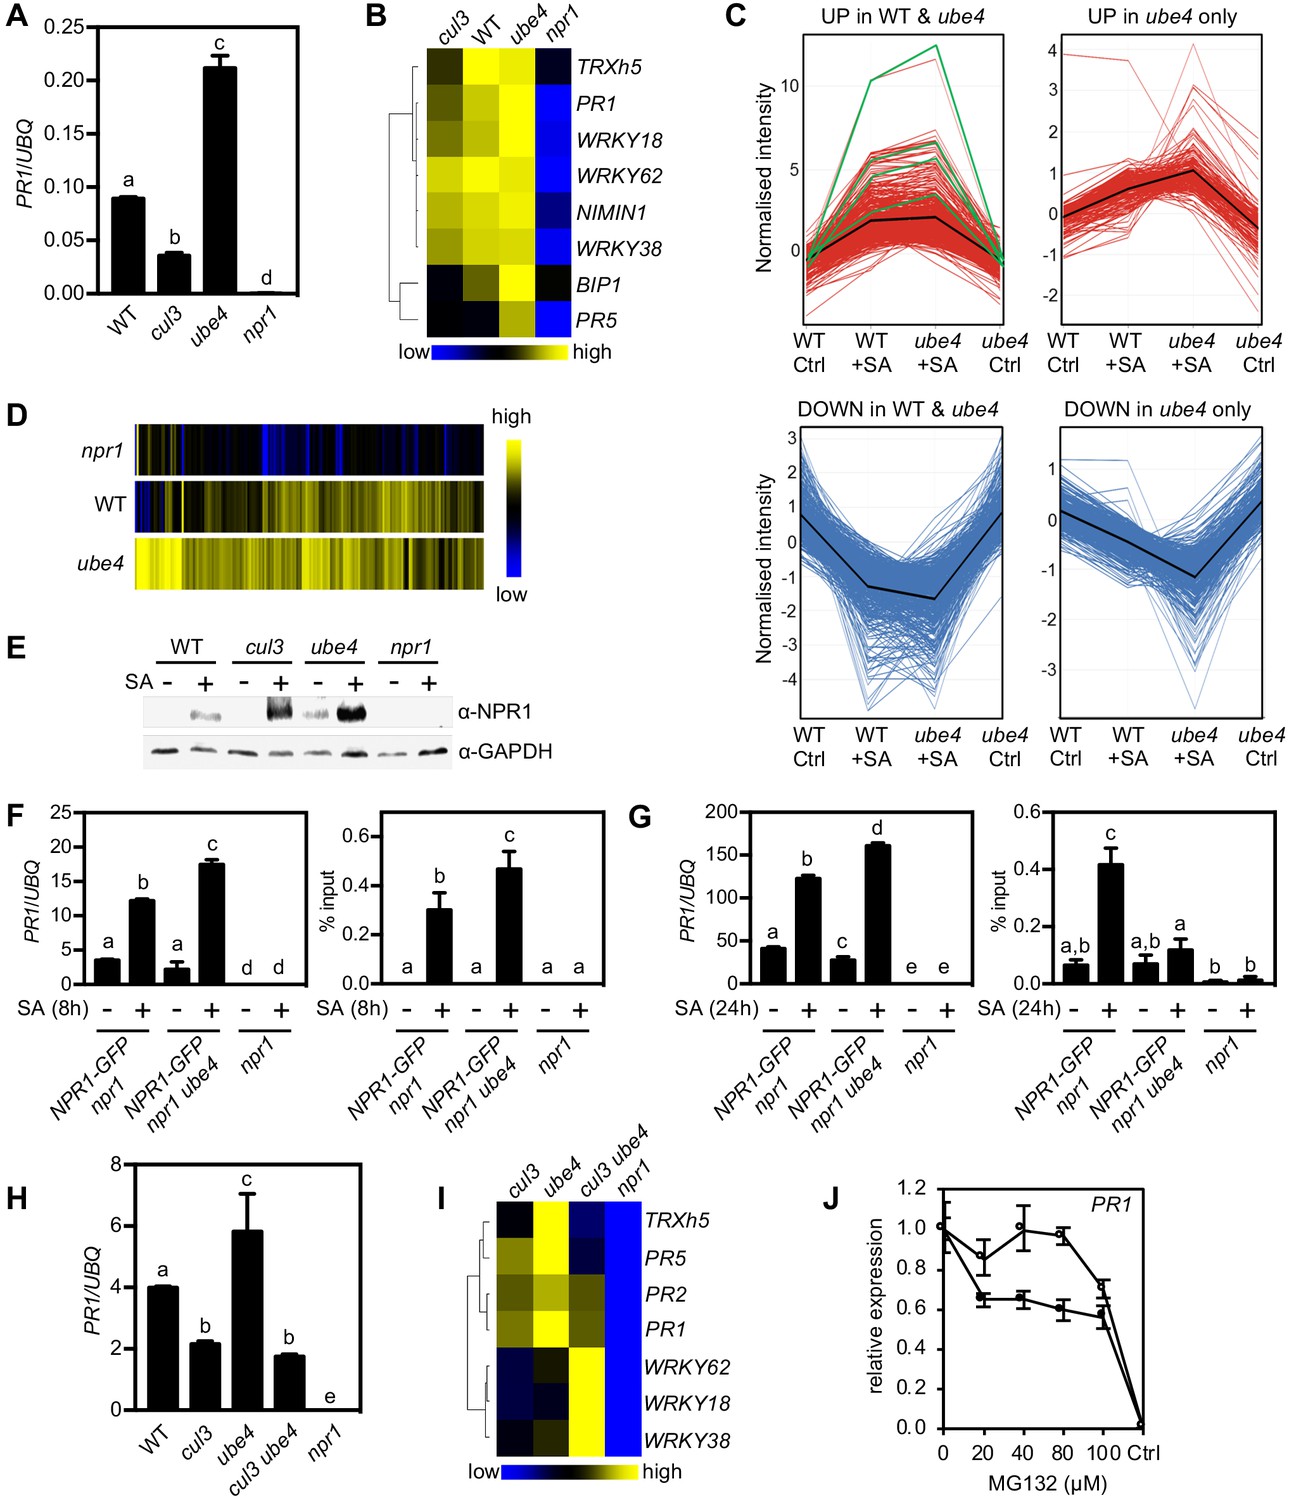
Progressive ubiquitination controls transcriptional activity of NPR1.
(A) WT, cul3a cul3b (cul3), ube4 and npr1 seedlings were treated with 0.5 mM SA for 6 hr before determining PR1 gene expression normalised relative to constitutively expressed UBQ5. Data points represent mean ± SD while letters denote statistically significant differences between samples (Tukey Kramer ANOVA; α = 0.05, n = 3). (B) Heat map of the expression of additional NPR1 target genes analysed as in (A). (C) Seedlings treated with water (Ctrl) or 0.5 mM SA for 12 hr were analysed by RNA-Seq. Only genes that were induced ≥2 fold by SA in WT and/or ube4 plants and showed ≥1.5 fold difference in expression in npr1 mutants are shown (Benjamini Hochberg FDR, 2-way ANOVA p≤0.05). Graphs indicate genes that are up or down regulated in both WT and ube4 or only in ube4. PR-1, WRKY18, WRKY38 and WRKY62 marker genes are indicated by green lines, whereas mean expression patterns are indicated by black lines. (D) Heat map representation of genes from (C) that were upregulated by SA. (E) WT, cul3a cul3b (cul3), ube4 and npr1 seedlings were treated with water (-) or 0.5 mM SA (+) for 6 hr. Endogenous NPR1 protein levels were monitored by immunoblot analysis, while GAPDH levels confirmed equal loading. (F) Adult plants expressing 35S::NPR1-GFP in the indicated genetic backgrounds were treated with 0.5 mM SA for 8 hr before analysing either PR1 gene expression (left panel) or NPR1-GFP binding to the as-1 motif of the PR1 promoter (right panel). Mutant npr1 plants served as a negative control. Data points represent mean ± SD while letters denote statistically significant differences between samples (Tukey Kramer ANOVA; α = 0.05, n = 3). (G) As in (F) except plants were treated with 0.5 mM SA for 24 hr. (H) WT, cul3a cul3b (cul3) double, ube4 single, cul3a cul3b ube4 (cul3 ube4) triple and npr1 single mutant seedlings were treated with 0.5 mM SA for 6 hr and PR1 gene expression determined by normalising against constitutively expressed UBQ5. Data points represent mean ± SD while letters denote statistically significant differences between samples (Tukey Kramer ANOVA; α = 0.05, n = 3). (I) Heat map of the expression of additional NPR1 target genes analysed as in (H). (J) WT (closed circles) and mutant ube4 (open circles) seedlings expressing 35S:NPR1-GFP were treated with 0.5 mM SA for 4 hr followed by the addition of indicated concentrations of MG132 for an additional 2 hr. PR1 gene expression was determined and normalised relative to constitutively expressed UBQ5. MG132 treatments as well as a control (Ctrl) that received 4 hr of water treatment followed by the addition of vehicle (DMSO), were plotted relative to maximal SA-induced PR1 expression. Data points represent mean ± SD (n = 3).
-
Figure 3—source data 1
SA-induced genes in WT, ube4 and npr1 plants determined by RNA-Seq.
- https://doi.org/10.7554/eLife.47005.009
Figure 3—figure supplement 1
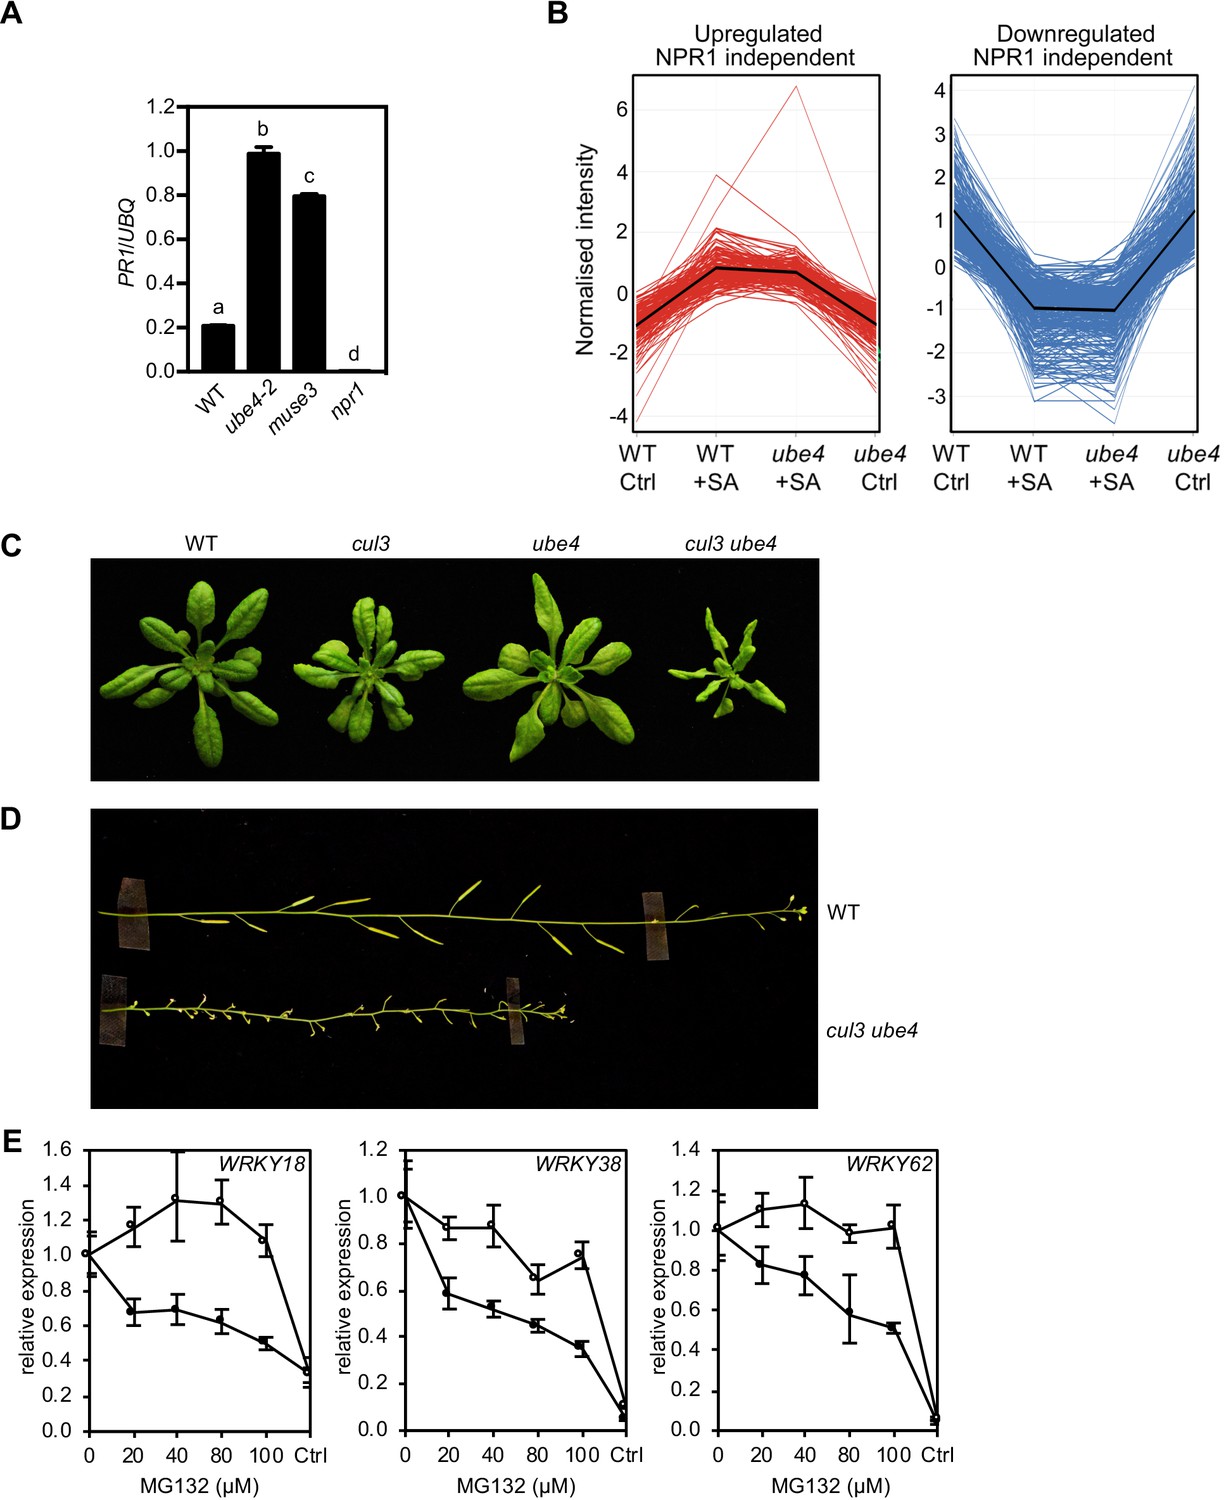
Progressive ubiquitination controls transcriptional activity of NPR1.
(A) WT, ube4, muse3 and npr1 seedlings were treated with 0.5 mM SA for 6 hr before determining PR1 gene expression normalised relative to constitutively expressed UBQ5. Data points represent mean ± SD while letters denote statistically significant differences between samples (Tukey Kramer ANOVA; α = 0.05, n = 3). (B) Expression profiles of SA-responsive, NPR1-independent genes. Seedlings treated with water (Ctrl) or 0.5 mM SA for 12 hr were analysed by RNA-Seq. Only genes that were induced (left) or repressed (right) ≥2 fold by SA in WT and/or ube4 plants and showed ≤1.5 fold difference in expression in npr1 mutants are shown (Benjamini Hochberg FDR, 2-way ANOVA p≤0.05). Mean expression patterns are indicated by black lines. (C) Morphological phenotypes of 4-week-old plants of the indicated genotypes. (D) Inflorescence phenotypes of 7-week-old plants of the indicated genotypes. (E) WT (closed circles) and mutant ube4 (open circles) seedlings expressing 35S:NPR1-GFP were treated with 0.5 mM SA for 4 hr followed by the addition of indicated concentrations of MG132 for a further 2 hr. PR1 gene expression was determined and normalised relative to constitutively expressed UBQ5. MG132 treatments as well as a control (Ctrl) that received 4 hr of water treatment followed by the addition of vehicle (DMSO), were plotted relative to maximal SA-induced PR1 expression. Data points represent mean ± SD (n = 3).
Figure 4 with 1 supplement
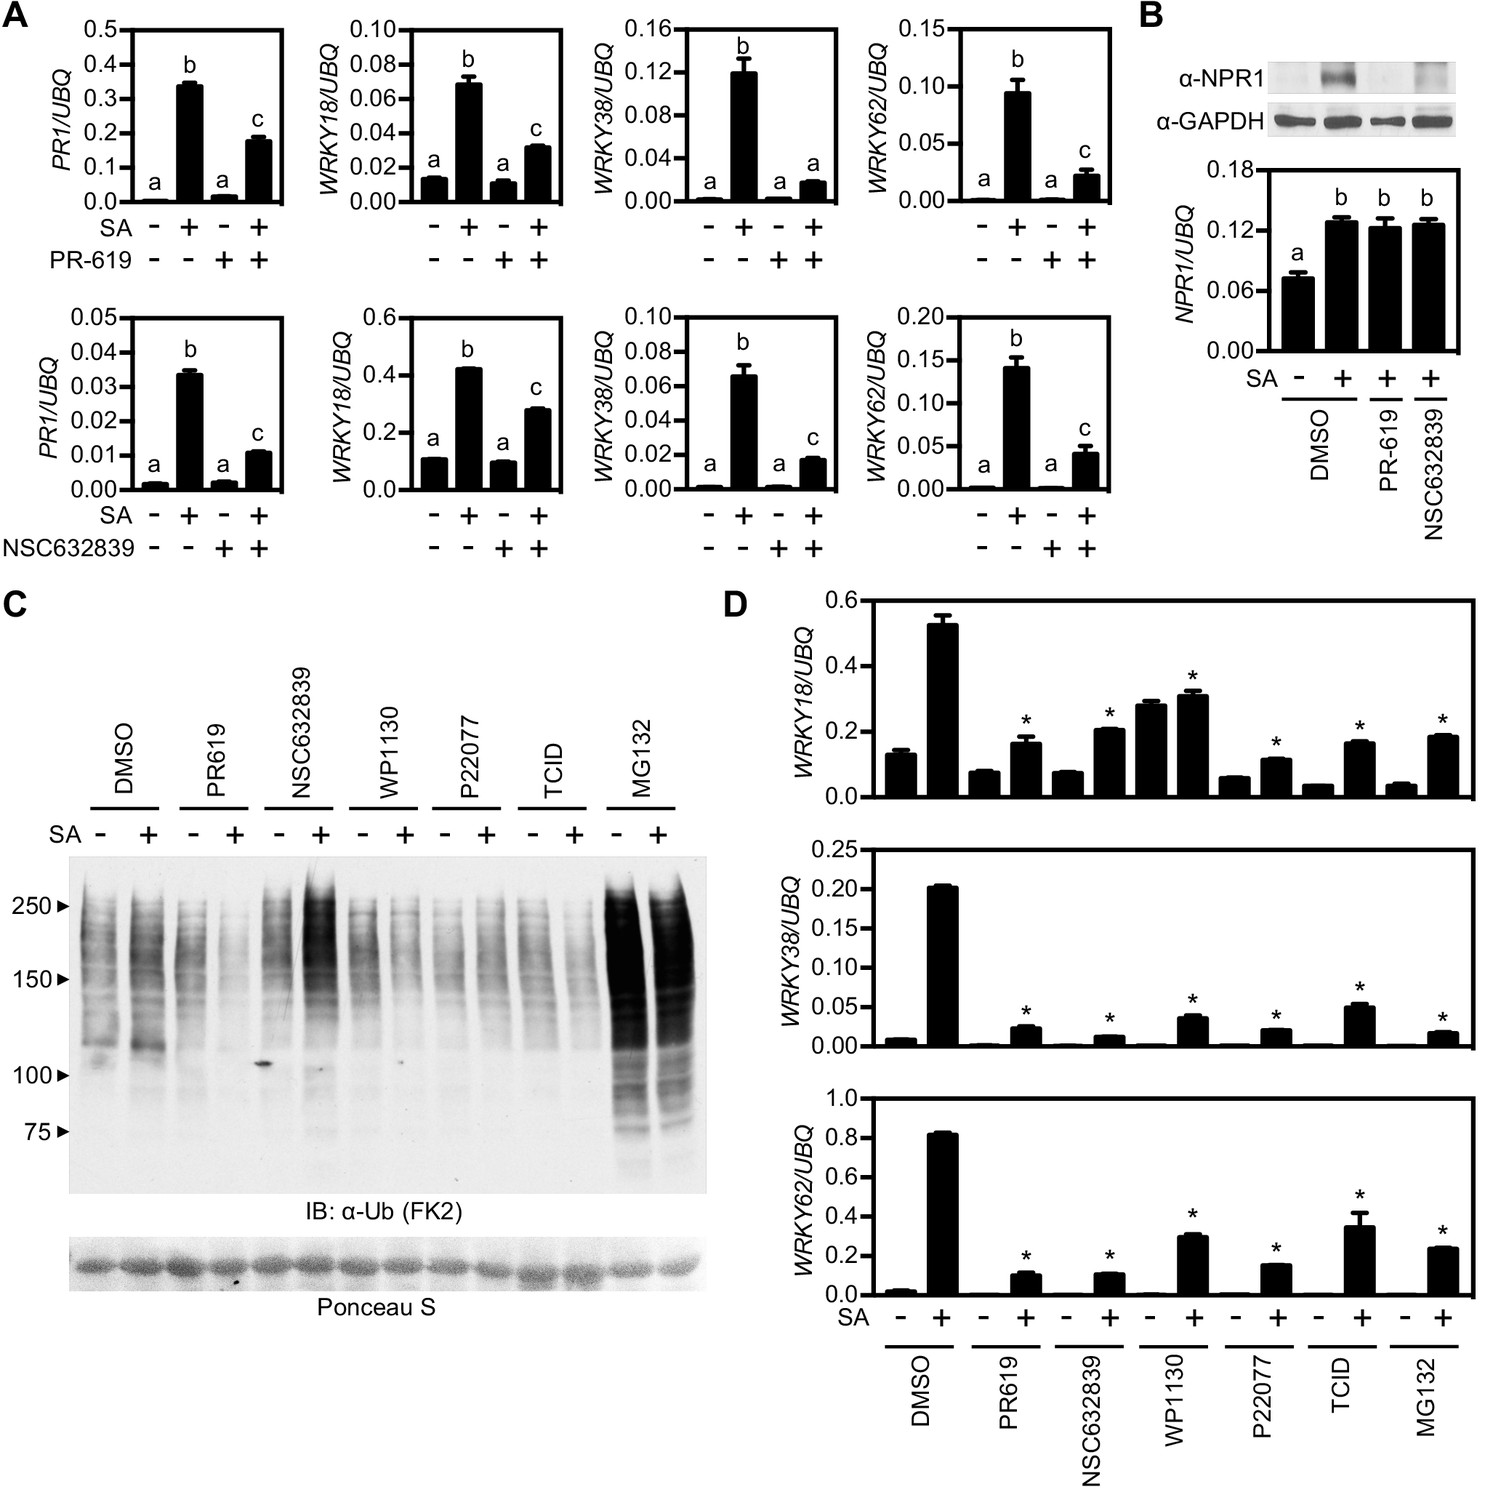
Deubiquitinases regulate NPR1-dependent transcription.
(A) WT seedlings were treated for 6 hr with either vehicle control (DMSO) or the indicated DUB inhibitors (50 μM) in presence or absence of 0.5 mM SA before analysing the expression of NPR1 target genes. Data points represent mean ± SD while letters denote statistically significant differences between samples (Tukey Kramer ANOVA; α = 0.05, n = 3). (B) WT seedlings were treated as in (A) before endogenous NPR1 and GAPDH (loading control) protein levels were analysed by immunoblotting (top panel). NPR1 gene expression was also analysed from the same samples (bottom panel). Data points represent mean ± SD while letters denote statistically significant differences between samples (Tukey Kramer ANOVA; α = 0.05, n = 3). (C) WT seedlings were treated for 6 hr with vehicle (DMSO) or either the indicated DUB inhibitors (50 μM) or MG132 (100 μM) in presence or absence of 0.5 mM SA before immunoblotting against conjugated ubiquitin (FK2). Ponceau S staining indicated equal loading. (D) WT seedlings were treated as in (C) and NPR1 target gene expression analysed. Data points represent mean ± SD while asterisks denote statistically significant differences between the indicated samples and the DMSO + SA treated sample (Tukey Kramer ANOVA; α = 0.05, n = 3).
Figure 4—figure supplement 1
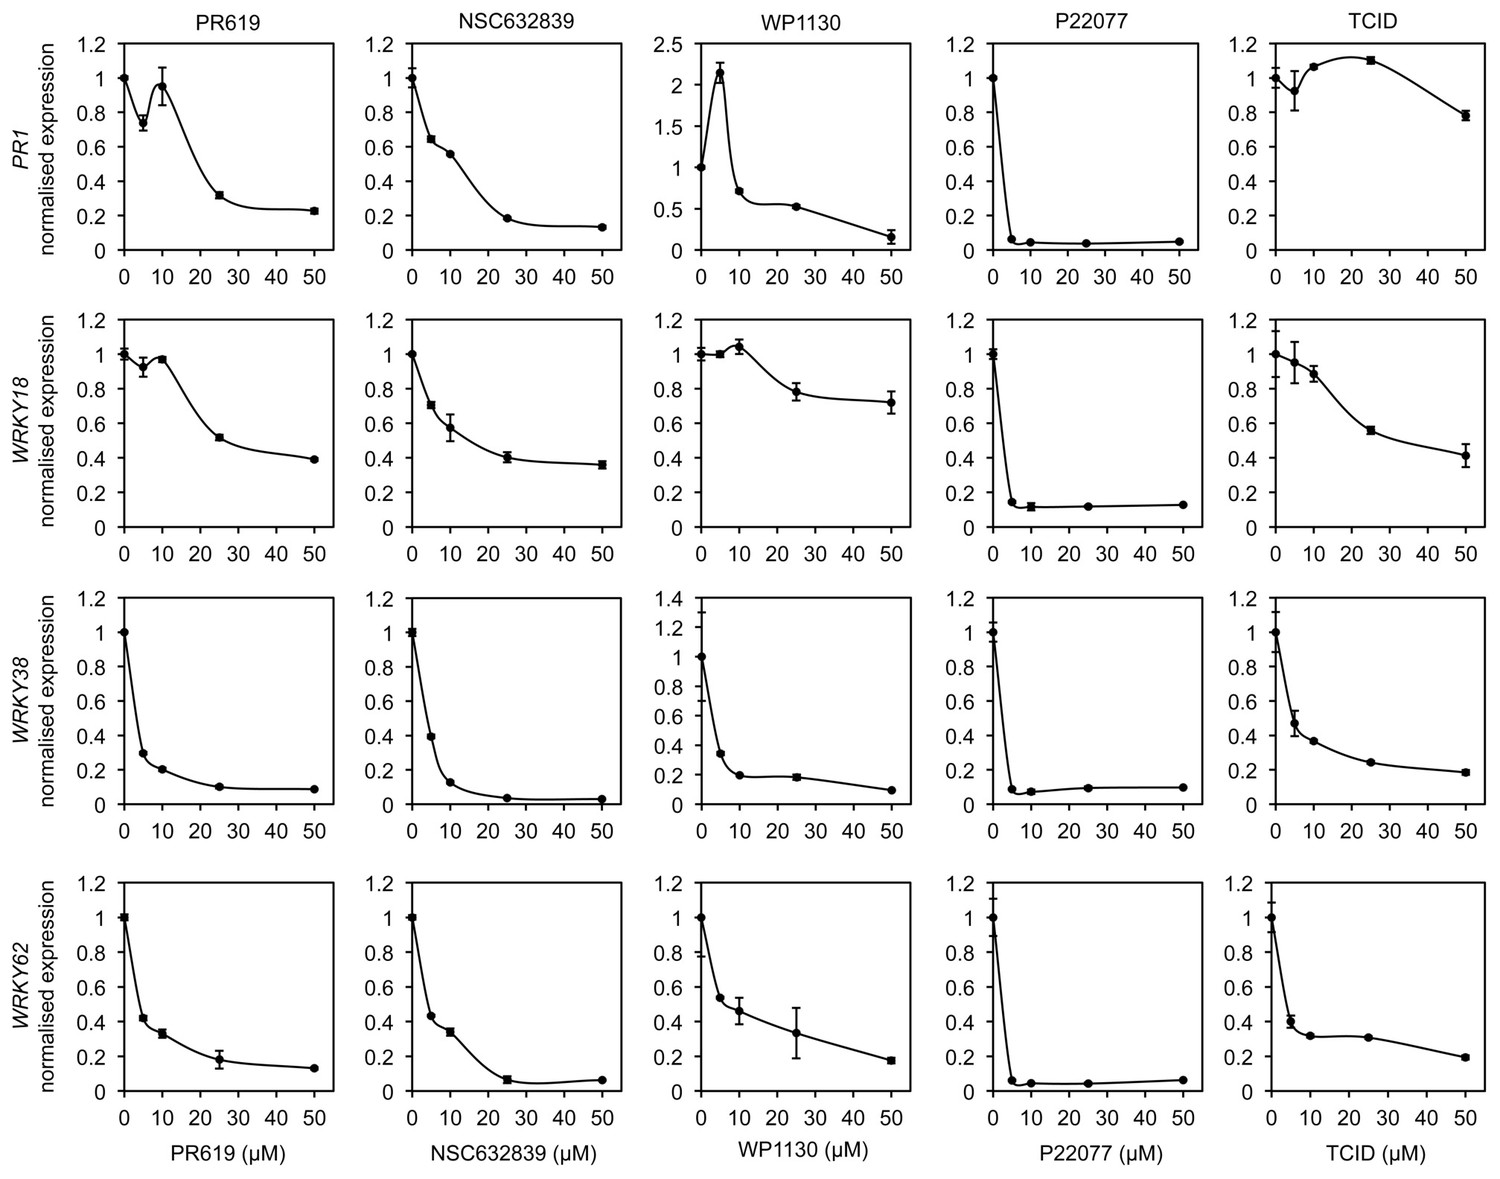
DUB inhibitors suppress NPR1 target gene expression.
Arabidopsis seedlings were treated with SA in combination with increasing concentrations of the indicated DUB inhibitors. The expression levels of the NPR1 target genes PR1, WRKY18, WRKY38 and WRKY62 were analysed by qPCR and normalised against constitutively expressed UBQ5. Data points represent mean relative expression as compared to SA treatment alone ± SD (n = 3).
Figure 5 with 2 supplements
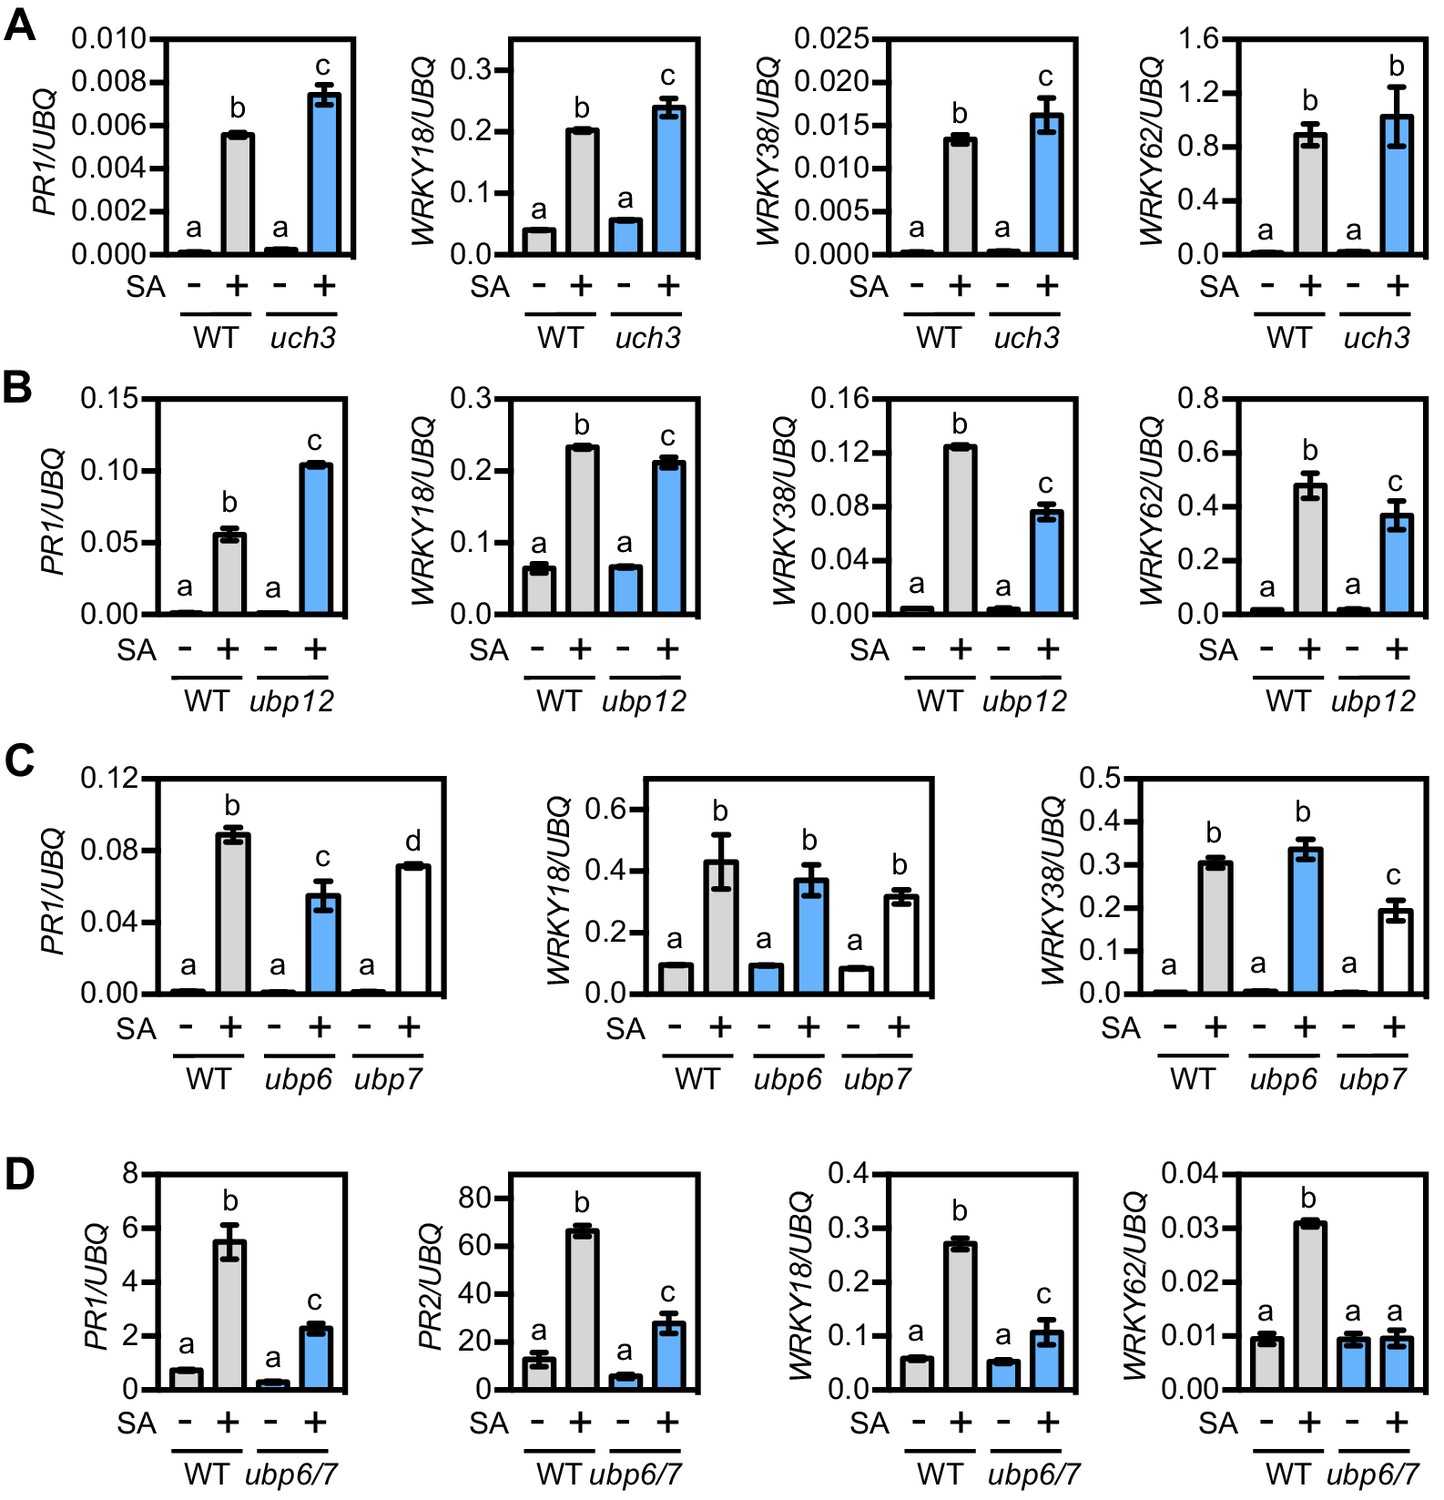
UBP6 and UBP7 deubiquitinases are required for SA-induced expression of NPR1 target genes.
(A) WT and uch3-1 seedlings were treated for 6 hr with 0.5 mM SA followed by analysis of NPR1 target gene expression. Data points represent mean ± SD while letters denote statistically significant differences between samples (Tukey Kramer ANOVA; α = 0.05, n = 3). (B) WT and ubp-12–2 w seedlings were treated and analysed as in (A). (C) WT, ubp6-1 and ubp7-1 plants were treated with 0.5 mM SA for 24 hr before analysis of NPR1 target gene expression. Data points represent mean ± SD while letters denote statistically significant differences between samples (Tukey Kramer ANOVA; α = 0.05, n = 3). (D) WT and ubp6-1 ubp7-1 double mutant plants were treated and analysed as in (C).
Figure 5—figure supplement 1
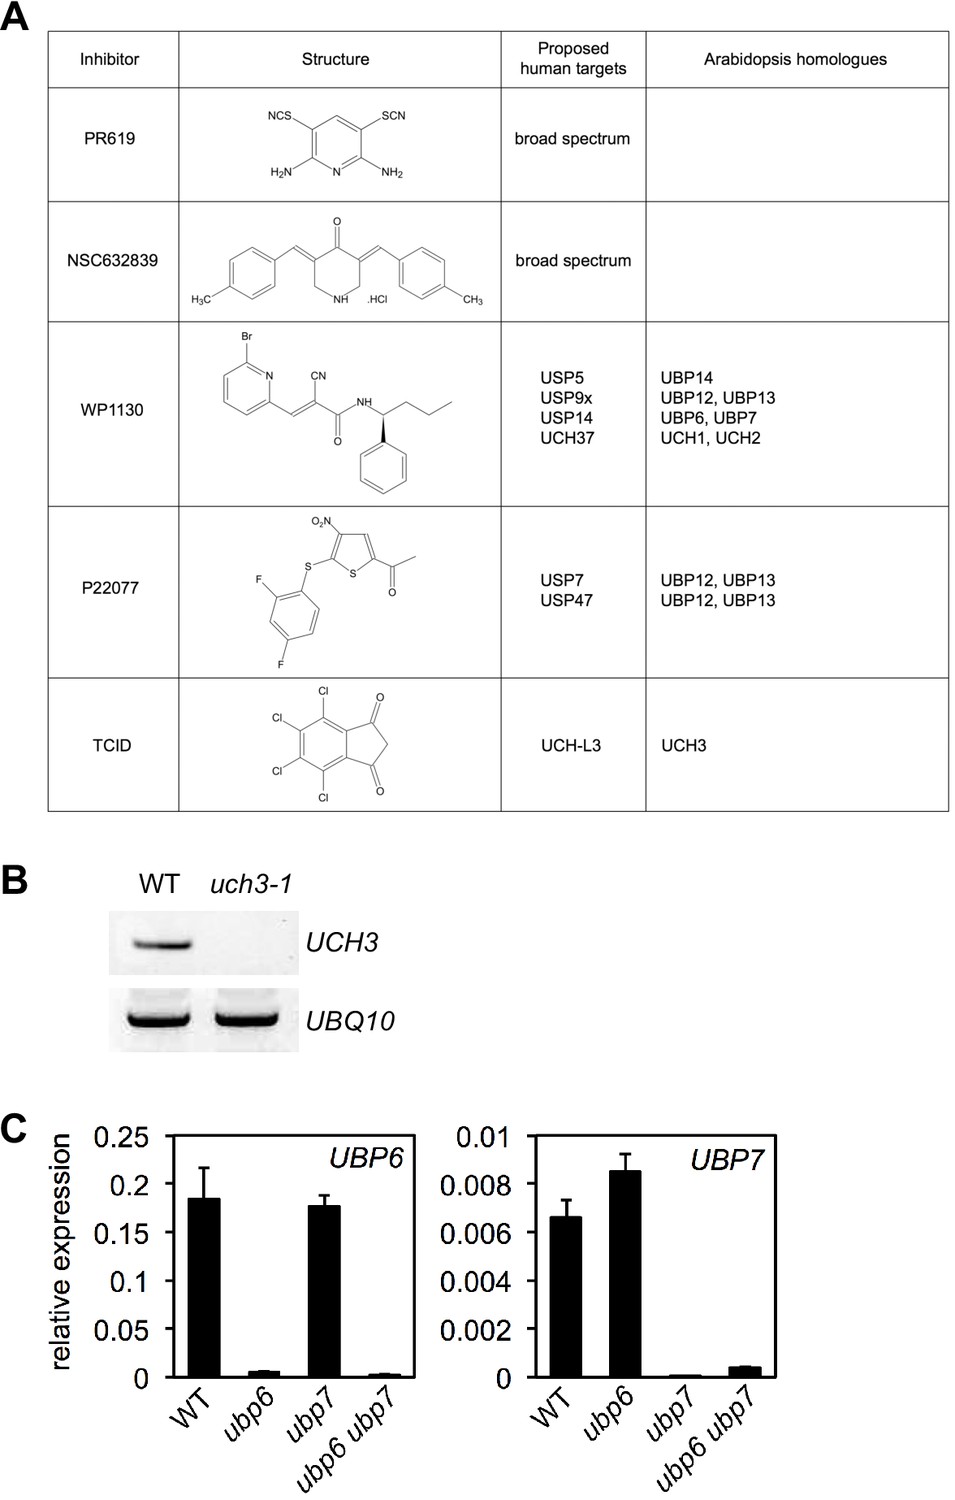
DUB inhibitor targets in Arabidopsis.
(A) Structures and proposed human and Arabidopsis targets of DUB inhibitors used in this study. (B) Expression of UCH3 was analysed by RT-PCR in the stated genotypes using primers specific to UCH3 or UBQ10 as a loading control. (C) The expression of UBP6 and UBP7 was analysed by qPCR and normalised relative to constitutively expressed UBQ5 in plants of the indicated genotypes. Data points represent mean ± SD (n = 3).
Figure 5—figure supplement 2
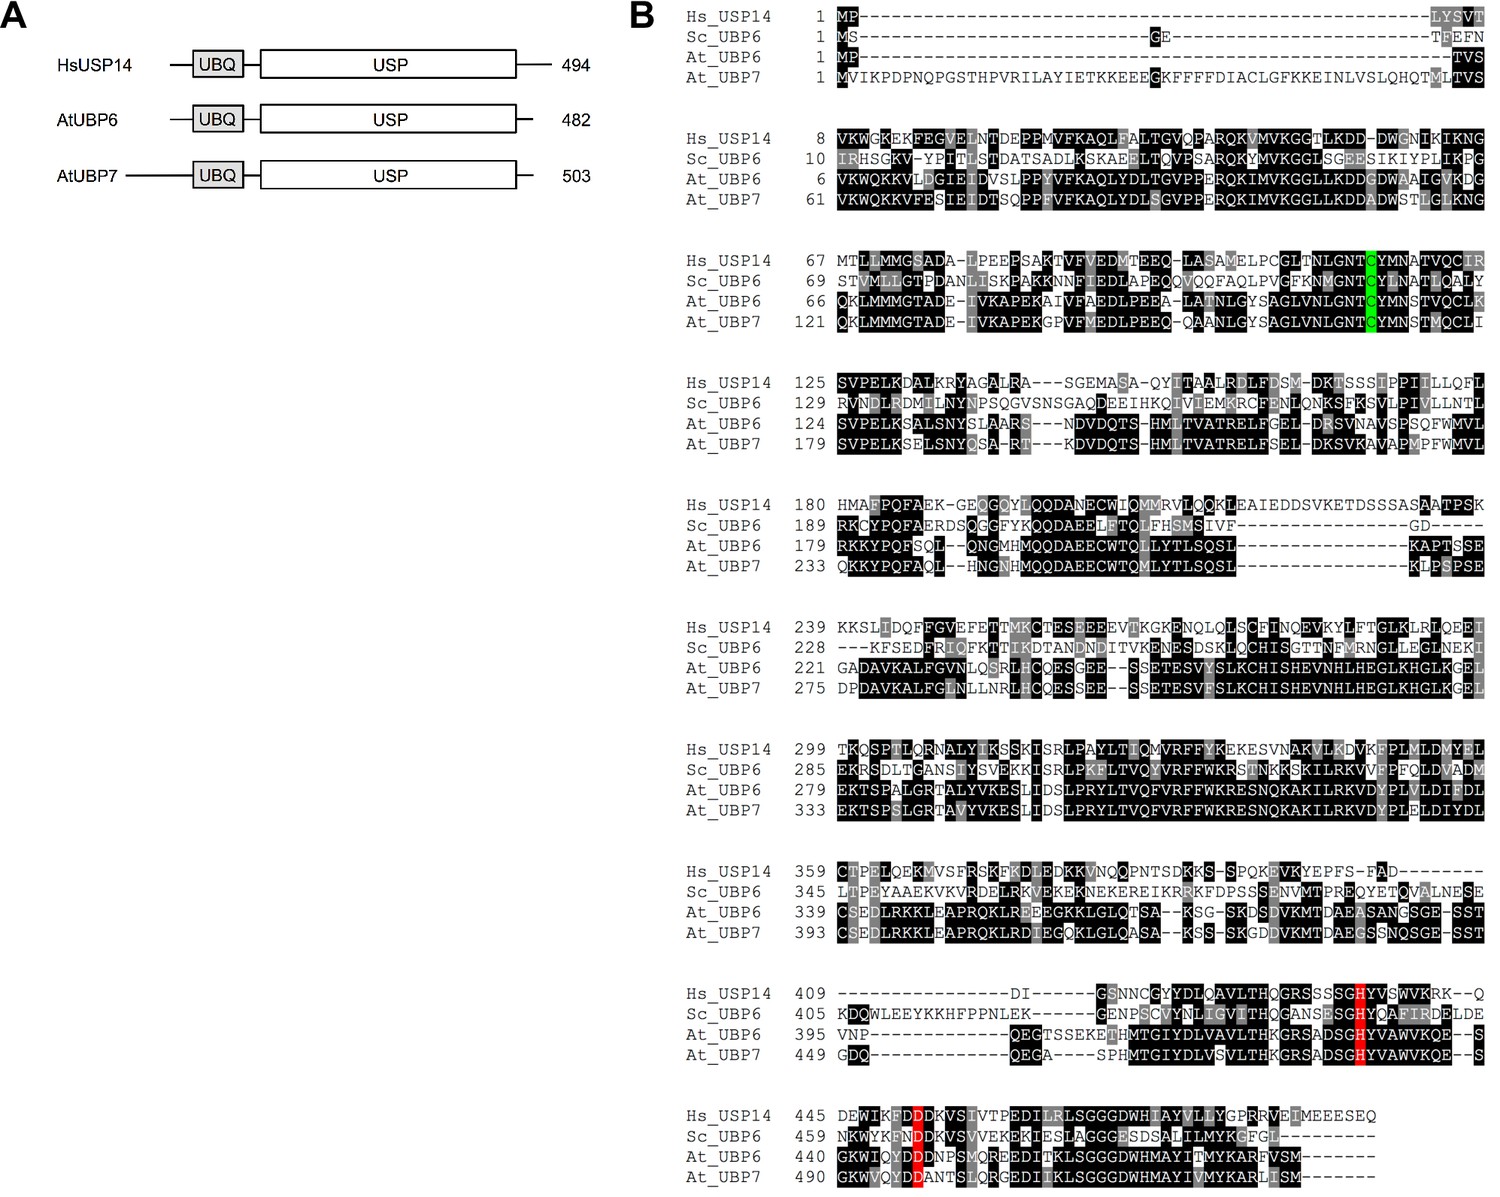
Domain structure and sequence of UBP6 and UBP7.
(A) Domain structures of human USP14, and Arabidopsis UBP6 and UBP7. (B) Sequence alignments of human USP14, Saccharomyces cerevisiae UBP6, Arabidopsis UBP6 and Arabidopsis UBP7. The active site Cys residue is highlighted in green while the conserved His and Asp residues making up the catalytic triad are highlighted in red.
Figure 6 with 1 supplement
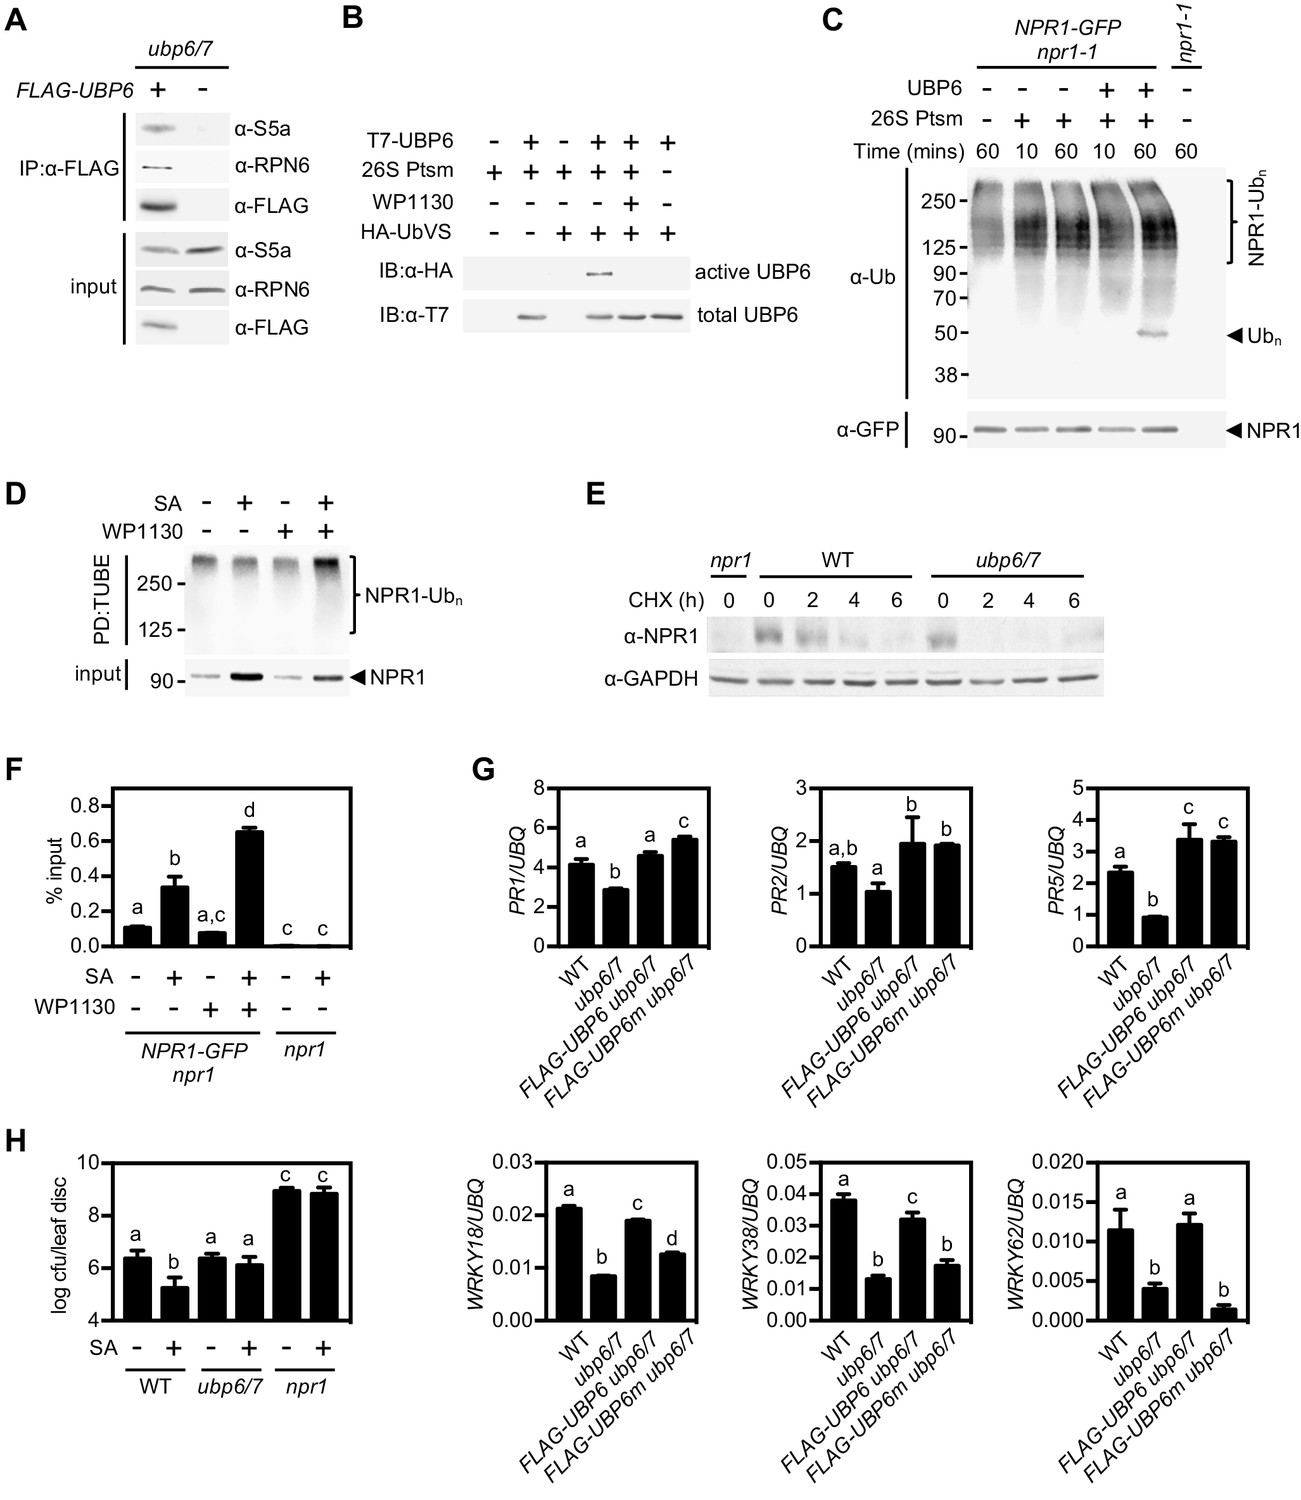
Deubiquitination by UBP6/7 regulates transcriptional activity of NPR1.
(A) FLAG-UBP6 was immunoprecipitated (IP) from ubp6 ubp7 plants transformed with or without 35S::FLAG-UBP6. Co-immunoprecipitates were analysed by immunoblotting against FLAG as well as the proteasome subunits S5a and RPN6. Input protein levels are shown in the bottom panel. (B) Purified recombinant His6-T7-UBP6 was preincubated with or without WP1130 and 26S proteasomes before labelling with HA-UbVS. Immunoblotting with HA antibodies detected active, labelled UBP6 while immunoblotting with T7 antibodies detected total levels of UBP6. (C) 35S::NPR1-GFP seedlings were treated for 6 hr with 0.5 mM SA followed by addition of 100 μM MG132 for a further 18 hr. Polyubiquitinated NPR1-GFP protein was then purified with GFP-Trap agarose and incubated for the indicated times with recombinant UBP6 in presence or absence of 26S proteasomes. Remaining polyubiquitinated NPR1-GFP and released ubiquitin species were detected by immunoblotting using an antibody against ubiquitin (P4D1), while unmodified NPR1-GFP was detected with an anti-GFP antibody. (D) 35S::NPR1-GFP seedlings were treated for 2 hr with 0.5 mM SA followed by addition of 50 μM WP1130 or DMSO vehicle for a further 4 hr. Ubiquitinated proteins were pulled down using GST-TUBEs. Input and ubiquitinated NPR1-GFP (NPR1-Ubn) were detected by immunoblotting with a GFP antibody. (E) Seedlings were treated with SA for 24 hr to induce NPR1 before addition of 100 μM CHX. Endogenous NPR1 protein levels were monitored by immunoblotting and GAPDH levels confirmed equal loading. (F) 35S::NPR1-GFP seedlings were treated for 2 hr with 0.5 mM SA followed by addition of 50 μM WP1130 or DMSO vehicle for a further 4 hr. NPR1-GFP binding to the as-1 motif of the PR1 promoter element was quantified by ChIP with npr1 seedlings serving as a negative control. Data points represent mean ± SD while letters denote statistically significant differences between samples (Tukey Kramer ANOVA; α = 0.05, n = 3). (G) Plants of the stated genotypes were treated with 0.5 mM SA for 24 hr before the expression of NPR1 target genes was analysed by qPCR. Data points represent mean ± SD while letters denote statistically significant differences between samples (Tukey Kramer ANOVA; α = 0.05, n = 3). (H) Plants were treated with or without 0.5 mM SA 24 hr prior to inoculation with 5 × 10⁶ colony forming units (cfu)/ml Psm ES4326. Leaf discs were analysed for bacterial growth at three dpi. Error bars represent 95% confidence limits, while letters denote statistically significant differences between samples (Tukey Kramer ANOVA; α = 0.05, n = 8).
Figure 6—figure supplement 1

Deubiquitinating activity of UBP6.
(A) K48-linked Ub chains of 3–7 in length were incubated with the indicated reaction components for 2 or 16 hr. Ub species were then detected by SDS-PAGE and immunoblot using antibodies against ubiquitin (P4D1). (B) As in (A) but using K63-linked Ub chains. (C) As in (A) but using K48- or K63-linked di-ubiquitin as a substrate. (D) 35S::NPR1-GFP or npr1-1 seedlings were treated with water or 0.5 mM SA for 6 hr followed by addition of 100 μM MG132 for a further 18 hr. Polyubiquitinated NPR1-GFP protein was then purified with GFP-Trap agarose and incubated for the indicated times with or without recombinant UBP6 in the presence of 26S proteasomes. Remaining polyubiquitinated NPR1-GFP and released ubiquitin species were detected by immunoblotting using an antibody against ubiquitin (P4D1), while unmodified NPR1-GFP was detected with an anti-GFP antibody. (E) Seedlings of the indicated genotypes were treated with 0.5 mM SA for 24 hr to induce NPR1 before addition of either DMSO (vehicle control) or 100 μM CHX for 4 hr. NPR1 protein levels were monitored by immunoblot analysis, while GAPDH levels confirmed equal loading.
Figure 7

Working model for how dynamic ubiquitination regulates transcriptional outputs of NPR1.
NPR1 occupancy at target gene promoters initiates low-level transcription (dashed green arrow). Initial ubiquitin (grey circles) modifications mediated by CRL3 ligase enhances target gene expression to maximum levels (solid green arrow), while progression to long-chain polyubiquitination mediated by UBE4 promotes the proteasome-mediated degradation of NPR1 and inactivates target gene expression. UBP6/7 activity at the proteasome serves to limit the degradation of NPR1, thereby promoting its active state.
Tables
Key resources table
| Reagent type (species) or resource | Designation | Source or reference | Identifiers | Additional information |
|---|---|---|---|---|
| Genetic reagent (Arabidopsis thaliana) | cul3a cul3b | (Spoel et al., 2009) | SALK_046638 SALK_098014 | |
| Genetic reagent (Arabidopsis thaliana) | ics1/sid2-2 | (Wildermuth et al., 2001) | N/A | |
| Genetic reagent (Arabidopsis thaliana) | ube4-2 | (Sessions et al., 2002) | SAIL_713_A12 | |
| Genetic reagent (Arabidopsis thaliana) | npr1-1 | (Cao et al., 1994) | N/A | |
| Genetic reagent (Arabidopsis thaliana) | npr1-0 | This paper, (Alonso et al., 2003) | SALK_204100 | |
| Genetic reagent (Arabidopsis thaliana) | 35S::NPR1-GFP npr1-1 | (Kinkema et al., 2000) | N/A | |
| Genetic reagent (Arabidopsis thaliana) | ubp12-2w | (Cui et al., 2013) | GABI_742C10 | |
| Genetic reagent (Arabidopsis thaliana) | uch3-1 | This paper, (Alonso et al., 2003) | SALK_140823 | |
| Genetic reagent (Arabidopsis thaliana) | ubp6-1 | This paper, (Alonso et al., 2003) | SALK_108832 | |
| Genetic reagent (Arabidopsis thaliana) | ubp7-1 | This paper, (Alonso et al., 2003) | SALK_014223 | |
| Genetic reagent (Arabidopsis thaliana) | 35S::FLAG-UBP6 ubp6/7 | This paper | SALK_108832 SALK_014223 | |
| Antibody | Mouse monoclonal anti-GFP | Roche | Cat# 11814460001 | (1:1000 – 1:2000) |
| Antibody | Rabbit polyclonal anti-S5a | Abcam | Cat# ab60101 | (1:10000) |
| Antibody | Rabbit polyclonal anti-NPR1 | This paper | N/A | (1:1000) |
| Antibody | Rabbit polyclonal anti-GAPDH | Sigma-Aldrich | Cat# G9545 | (1:5000) |
| Antibody | Rabbit polyclonal anti-pS11/15 NPR1 | (Spoel et al., 2009) | N/A | (1:1000) |
| Antibody | Rabbit polyclonal anti-GFP (ChIP grade) | Abcam | Cat# ab290 | (1:500 for ChIP) |
| Antibody | Mouse monoclonal anti-Ubiquitin (FK2) | Millipore | Cat# 04–263 | (1:2000) |
| Antibody | Mouse monoclonal anti-FLAG M2 affinity gel | Sigma-Aldrich | Cat# A2220 | N/A |
| Antibody | Rabbit monoclonal anti-FLAG | Sigma-Aldrich | Cat# F7425 | (1:2000) |
| Antibody | Rabbit polyclonal anti-RPN6 | Upstate | Cat# 11814460001 | (1:2000) |
| Antibody | Mouse monoclonal anti-Ubiquitin (P4D1) | Santa Cruz Biotechnology | Cat# sc-8017 | (1:2000) |
| Antibody | Mouse monoclonal anti-HA | ThermoFisher | Cat# 26183 | (1:5000) |
| Antibody | Mouse monoclonal anti-T7 | Millipore | Cat# 69522 | (1:5000) |
| Recombinant DNA reagent | pENTR-D-TOPO | Invitrogen | Cat# K240020 | |
| Recombinant DNA reagent | pEarleyGate 202 | ABRC (Earley et al., 2006) | Cat# CD3-688 | |
| Recombinant DNA reagent | pGEX-6P-1 | GE Healthcare | Cat# 28-9546-48 | |
| Recombinant DNA reagent | pET28a | Novagen | Cat# 69865 | |
| Peptide, recombinant protein | USP2 Catalytic Domain | Boston Biochem | Cat# E-504 | |
| Peptide, recombinant protein | 26S Proteasome (Ub-VS treated) | Ubiquigent | Cat# 65-1020-010 | |
| Peptide, recombinant protein | Poly-ubiquitin (Ub3-7) K48-linked | Boston Biochem | Cat# UC-220 | |
| Peptide, recombinant protein | Poly-ubiquitin (Ub3-7) K63-linked | Boston Biochem | Cat# UC-320 | |
| Peptide, recombinant protein | Di-ubiquitin K48-linked | Boston Biochem | Cat# UC-200B | |
| Peptide, recombinant protein | Di-ubiquitin K63-linked | Boston Biochem | Cat# UC-300B | |
| Peptide, recombinant protein | HA-Ubiquitin-Vinyl sulfone | Boston Biochem | Cat# U-212 | |
| Commercial assay or kit | SuperScript II | Invitrogen | Cat# 18064014 | |
| Commercial assay or kit | QuikChange Site-Directed Mutagenesis Kit | Agilent | Cat# 200519 | |
| Commercial assay or kit | GFP-Trap A | Chromotek | Cat# gta-20 | |
| Chemical compound, drug | PR-619 | Abcam | Cat# ab144641 | |
| Chemical compound, drug | NSC632839 | Abcam | Cat# ab144599 | |
| Chemical compound, drug | WP1130 | Cayman Chemical | Cat# 15227 | |
| Chemical compound, drug | P2207 | LifeSensors | Cat# SI9699 | |
| Chemical compound, drug | TCID | LifeSensors | Cat# SI9679 | |
| Chemical compound, drug | MG132 | Cayman Chemical | Cat# 10012628 | |
| Software, algorithm | Strand NGS | Avadis | N/A |
Additional files
-
Supplementary file 1
List of oligonucleotides used.
- https://doi.org/10.7554/eLife.47005.018
-
Transparent reporting form
- https://doi.org/10.7554/eLife.47005.019
Download links
A two-part list of links to download the article, or parts of the article, in various formats.
Downloads (link to download the article as PDF)
Open citations (links to open the citations from this article in various online reference manager services)
Cite this article (links to download the citations from this article in formats compatible with various reference manager tools)
Dynamic ubiquitination determines transcriptional activity of the plant immune coactivator NPR1
eLife 8:e47005.
https://doi.org/10.7554/eLife.47005


