Modular organization of cerebellar climbing fiber inputs during goal-directed behavior
- The University of Tokyo, Japan
- Japan Science and Technology Agency, Japan
- University of Yamanashi, Japan
- Tamagawa University, Japan
- Tokyo Medical and Dental University, Japan
- Niigata University, Japan
Figures
Figure 1 with 2 supplements
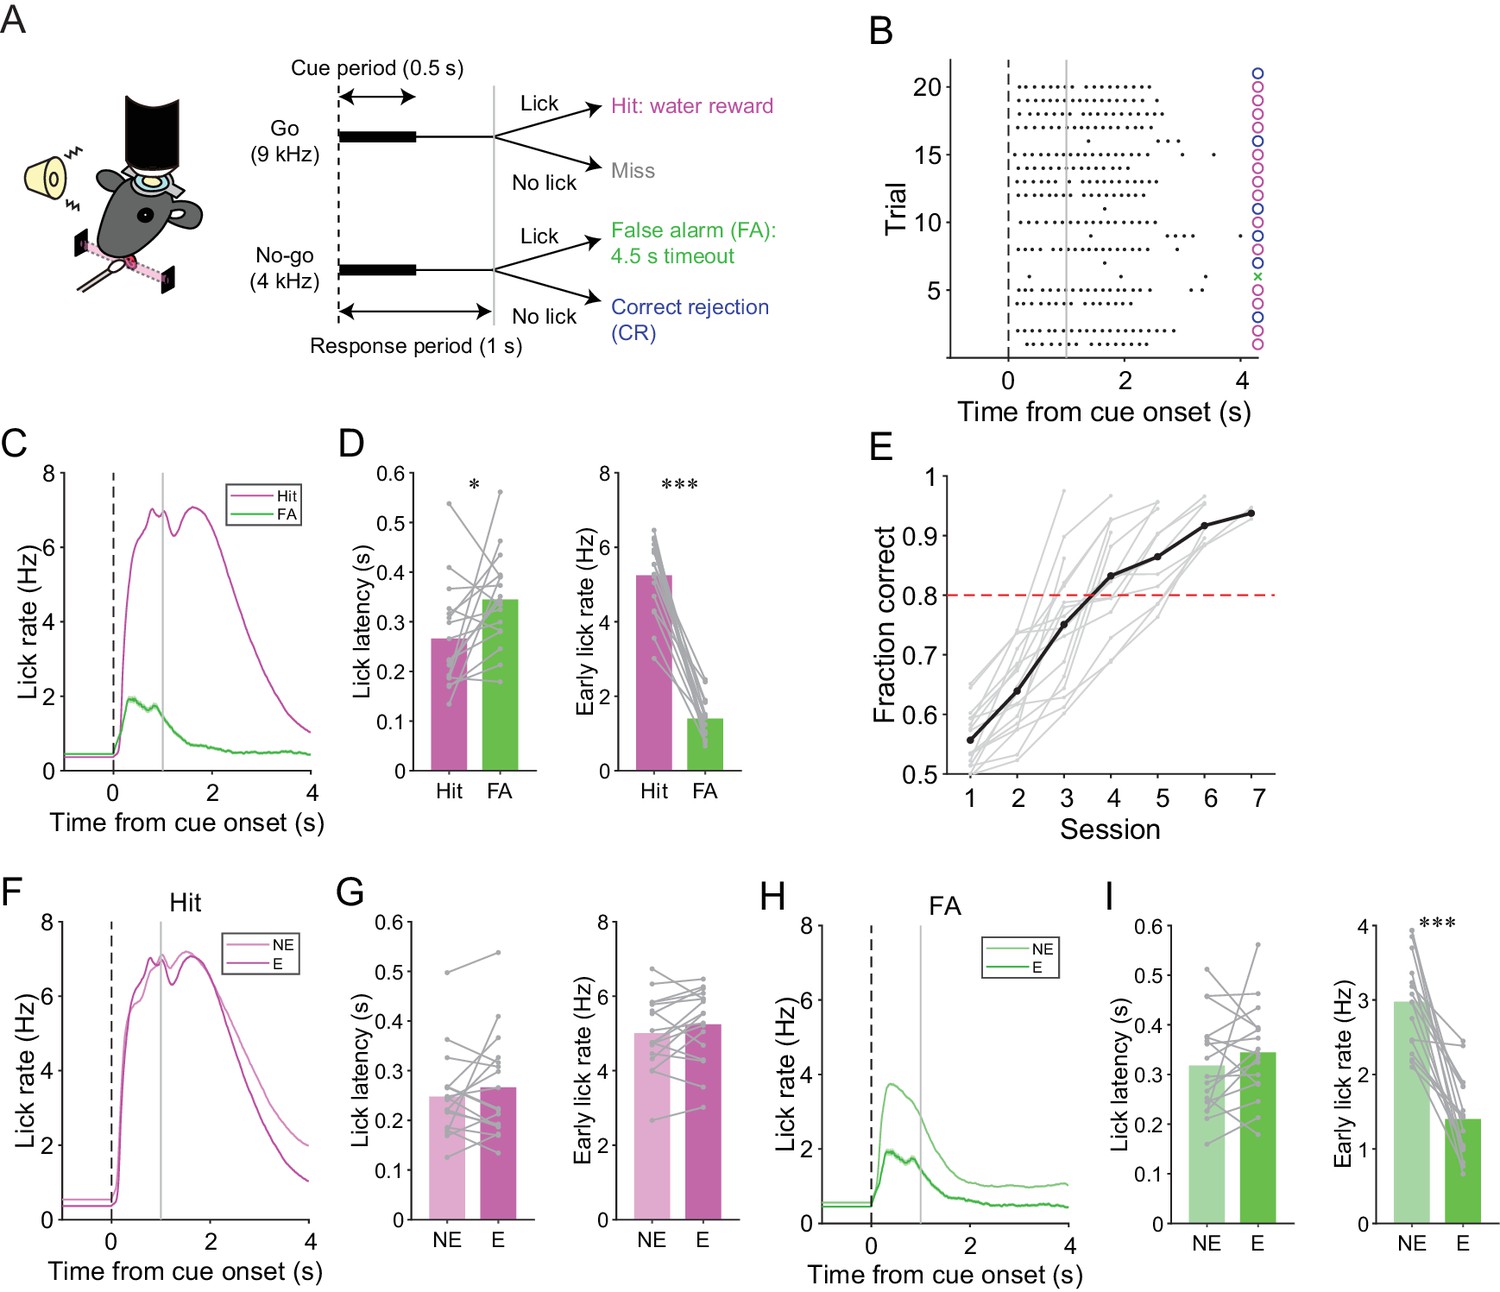
A lick/no-lick auditory discrimination task.
(A) Left, schematic diagram of a mouse performing the task under a two-photon microscope. Right, task structure. (B) Performance of an expert mouse in a representative session. Black dots represent licks. A vertical dotted line represents cue onset, and a gray line indicates the end of the response window. Circles and a cross represent correct trials and an incorrect trial, respectively. The color scheme is the same as that in panel (A). (C) Trial-averaged lick rate for hit and FA trials pooled across all trials in expert performance sessions. (D) Mouse-averaged lick latency (left) and lick rate within 1 s from cue onset (right) for hit and FA trials in expert performance sessions. Gray dots and lines represent individual mice (n = 17). (E) Learning curve for all mice (n = 17). Black dots and a line represent an average. A red dashed line represents a threshold for expert performance level (fraction correct = 0.8). (F) Trial-averaged lick rate for hit trials pooled across expert (E) and non-expert (NE) performance sessions. (G) Mouse-averaged lick latency (left) and lick rate within 1 s from cue onset (right) for hit trials in expert (E) and non-expert (NE) performance sessions. (H) Same as panel (F) but for FA trials. (I) Same as panel (G) but for FA trials. (C, F, H) Lines and shadings represent means ± s.e.m. (D, G, I) Paired t-test: *p<0.05, ***p<0.001.
-
Figure 1—source data 1
Datasets used to create Figure 1.
- https://doi.org/10.7554/eLife.47021.007
Figure 1—figure supplement 1
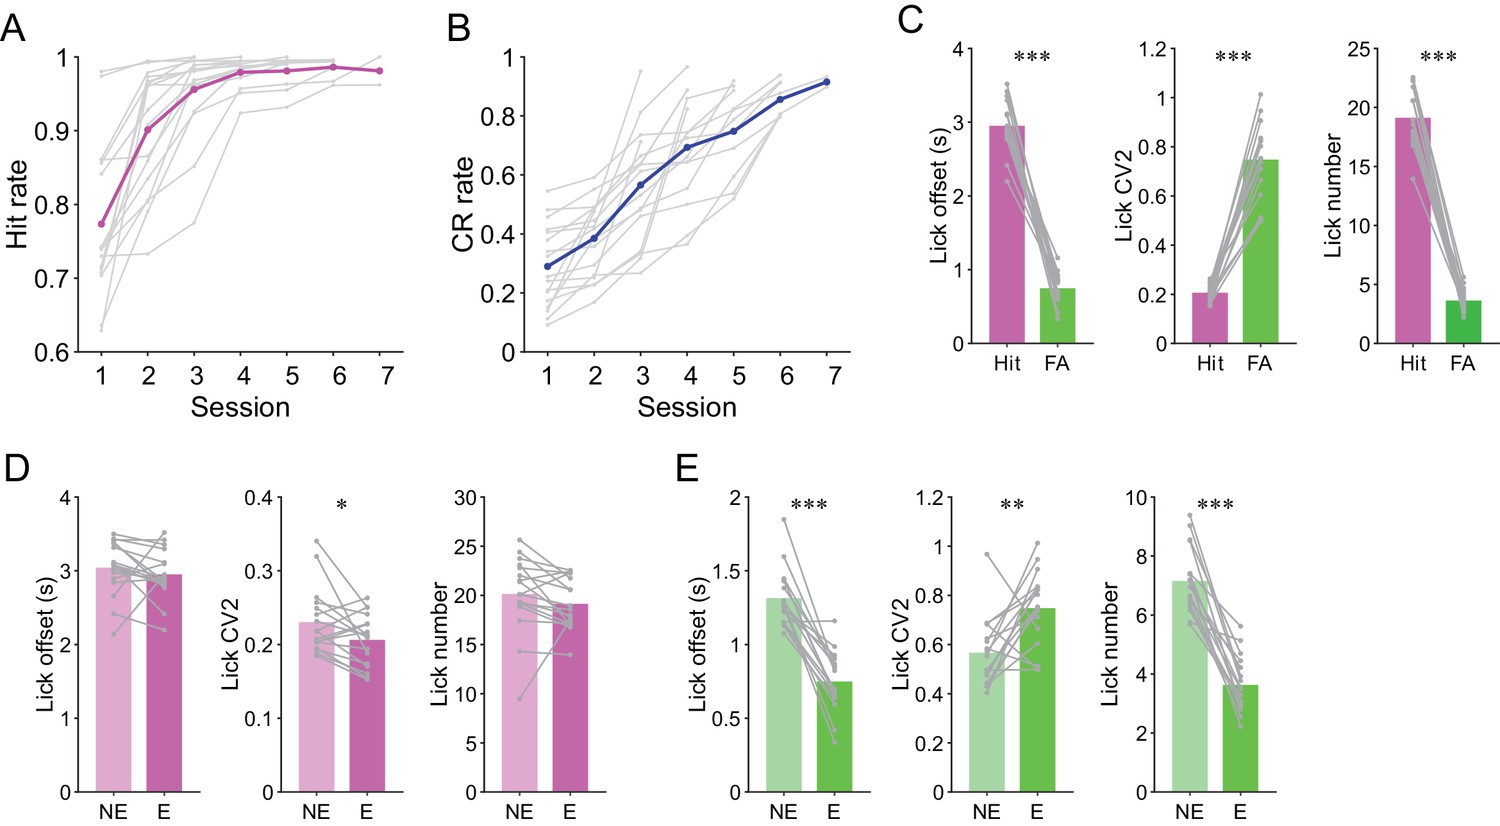
Analyses of task performance and licking behavior.
(A) Learning curves for hit rate in all mice (n = 17). Gray dots and lines represent individual animals and magenta dots and line represent means. (B) Same as panel (A) but for CR rate. Gray dots and lines represent individual animals and the blue line and dots represent means. (C) Mouse-averaged lick offset, lick CV2, and lick number for hit and FA trials (n = 17 mice). (D) Mouse-averaged lick offset, lick CV2, and lick number for hit trials in non-expert (NE) and expert (E) performance sessions (n = 17 mice). (E) Same as panel (D) but for FA trials. (C, D, E) Paired t-test: *p<0.05, **p<0.01, ***p<0.001.
-
Figure 1—figure supplement 1—source data 1
Datasets used to create Figure 1—figure supplement 1.
- https://doi.org/10.7554/eLife.47021.004
Figure 1—figure supplement 2
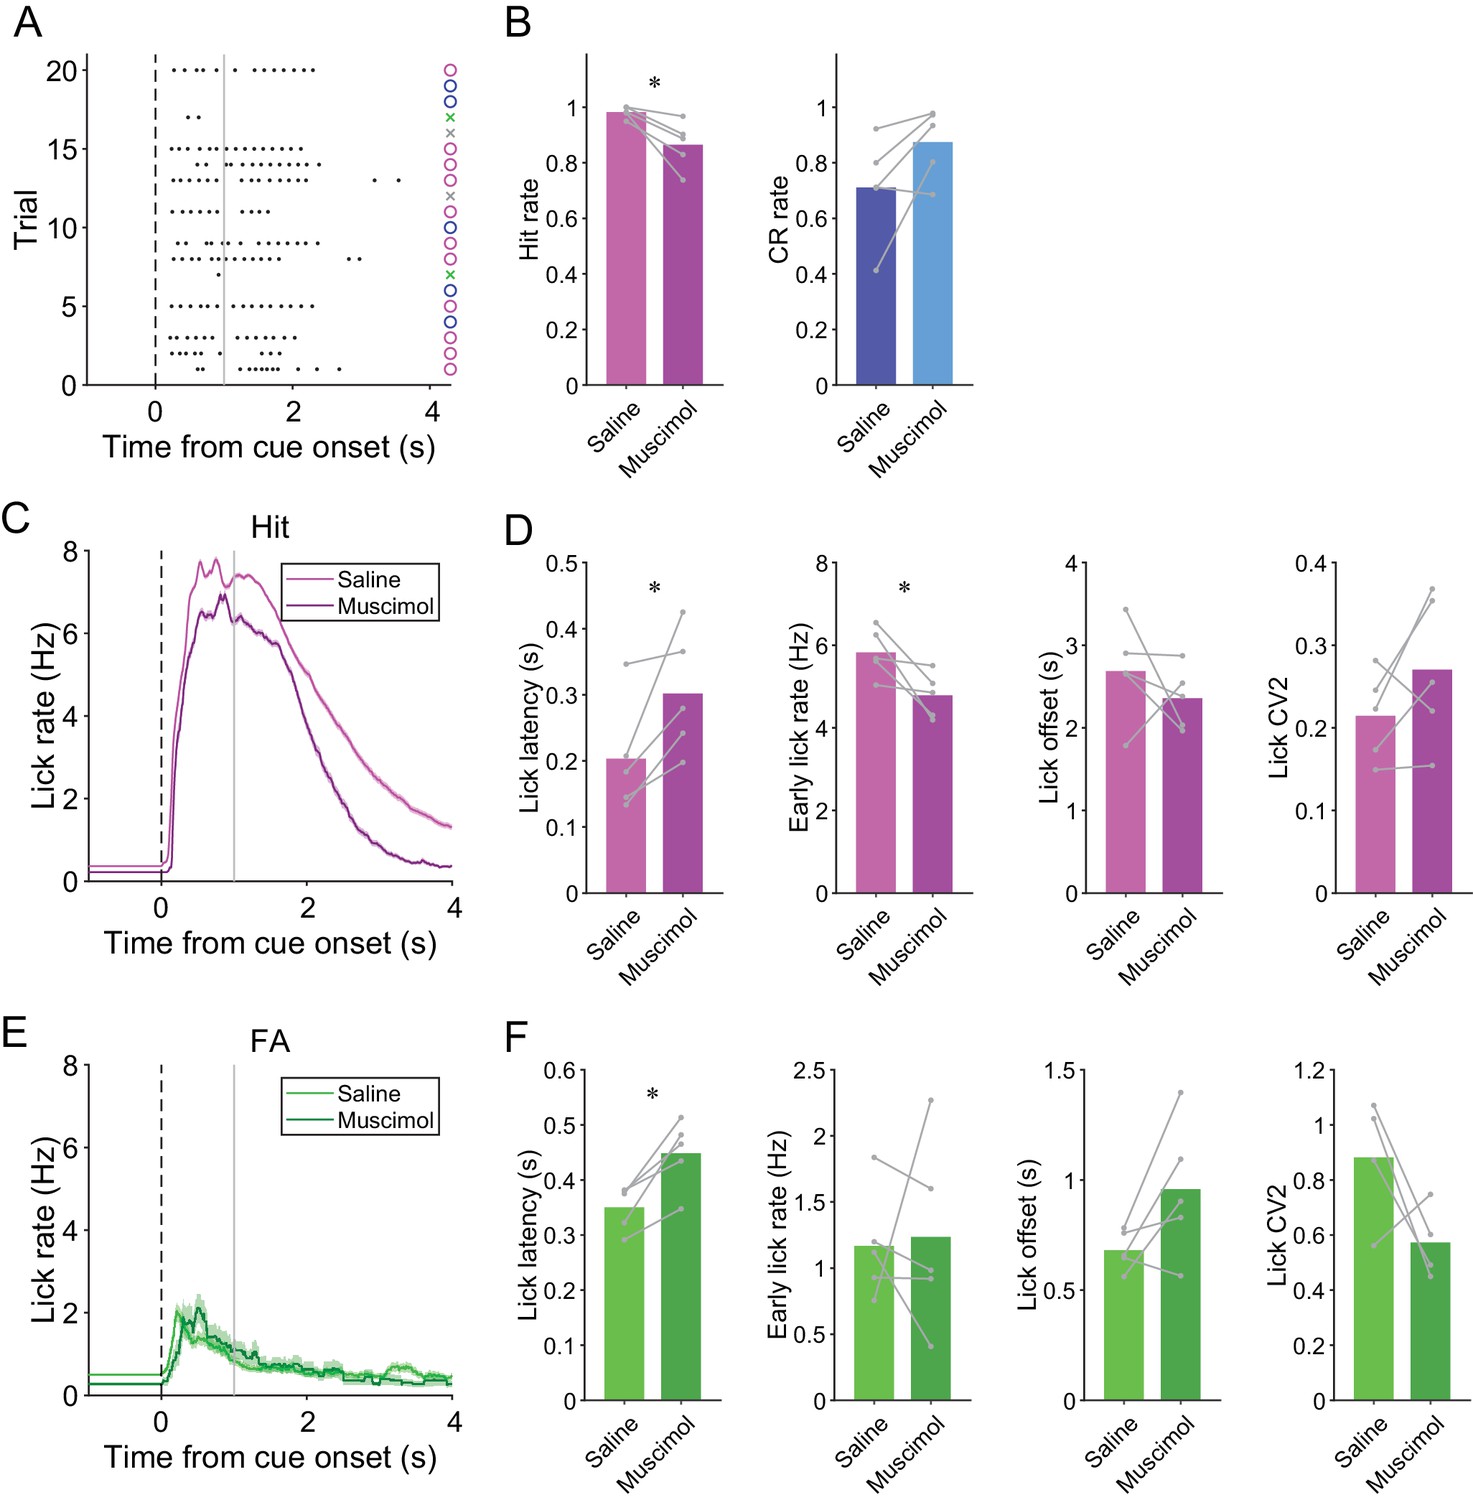
Effects of muscimol on mouse behavior.
(A) Example behavior during a session with muscimol injection. Black dots represent licks. A vertical dashed line represents cue onset, and a gray line indicates the end of the response window. Circles and crosses represent correct and incorrect trials, respectively. The color scheme is the same as that in Figure 1A. (B) Hit and CR rate for saline injection control and muscimol injection sessions (n = 5 mice). (C) Trial-averaged lick rate for hit trials during saline injection control and muscimol injection sessions. (D) Lick latency, early lick rate within 1 s from cue onset, lick offset, and lick CV2 for hit trials during saline injection control and muscimol injection sessions (n = 5 mice). (E) Same as panel (C) but for FA trials. (F) Same as panel (D) but for FA trials. (C, E) Lines and shadings represent means ± s.e.m. (B, D, F) Gray dots and lines represent individual animals. Paired t-test: *p<0.05.
-
Figure 1—figure supplement 2—source data 1
Datasets used to create Figure 1—figure supplement 2.
- https://doi.org/10.7554/eLife.47021.006
Figure 2 with 4 supplements
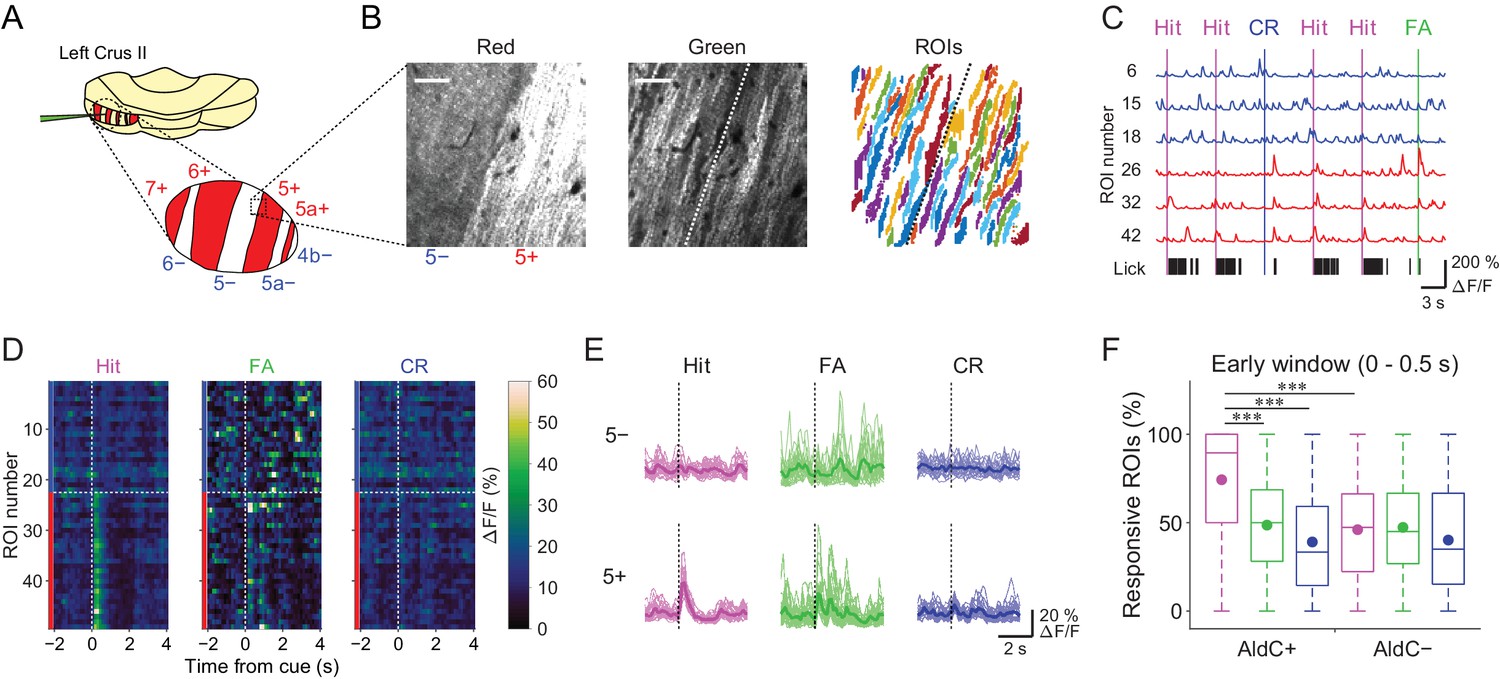
Differences in task-related CF signals between AldC+ and AldC− compartments.
(A) Schematic diagram of virus injection into the left cerebellar folium Crus II of Aldoc-tdTomato mice. Inset, magnified view of the Crus II. Red stripes represent AldC+ compartments. (B) Left, tdTomato fluorescence image at a 5−/5+ boundary. Middle, mean image of a GCaMP6f video at the same field of view. Right, extracted ROIs representing PC dendrites that are pseudocolored, in the same field of view. Scale bars, 40 μm. (C) Representative calcium traces from dendrites in panel (B) and their corresponding lick activities (black bars). Colored vertical lines represent the onsets of sensory cues for each trial type. (D) Trial-averaged calcium traces of single ROIs from the data in panel (C). (E) Single ROI trial-averaged traces for 5− and 5+ compartments from the data in panel (C). Thick lines represent ROI-averaged traces. (F) Percentage of responsive ROIs in a compartment per session for each trial type pooled across all AldC+ or AldC− compartments (n = 17 mice, 79 imaging sessions). Colored circles represent means. Colors represent trial types (hit, magenta; FA, green; CR, blue). Two-way ANOVA on ranks with repeated measures followed by post-hoc Tukey’s test: ***p<0.001.
-
Figure 2—source data 1
Datasets used to create Figure 2.
- https://doi.org/10.7554/eLife.47021.015
Figure 2—figure supplement 1
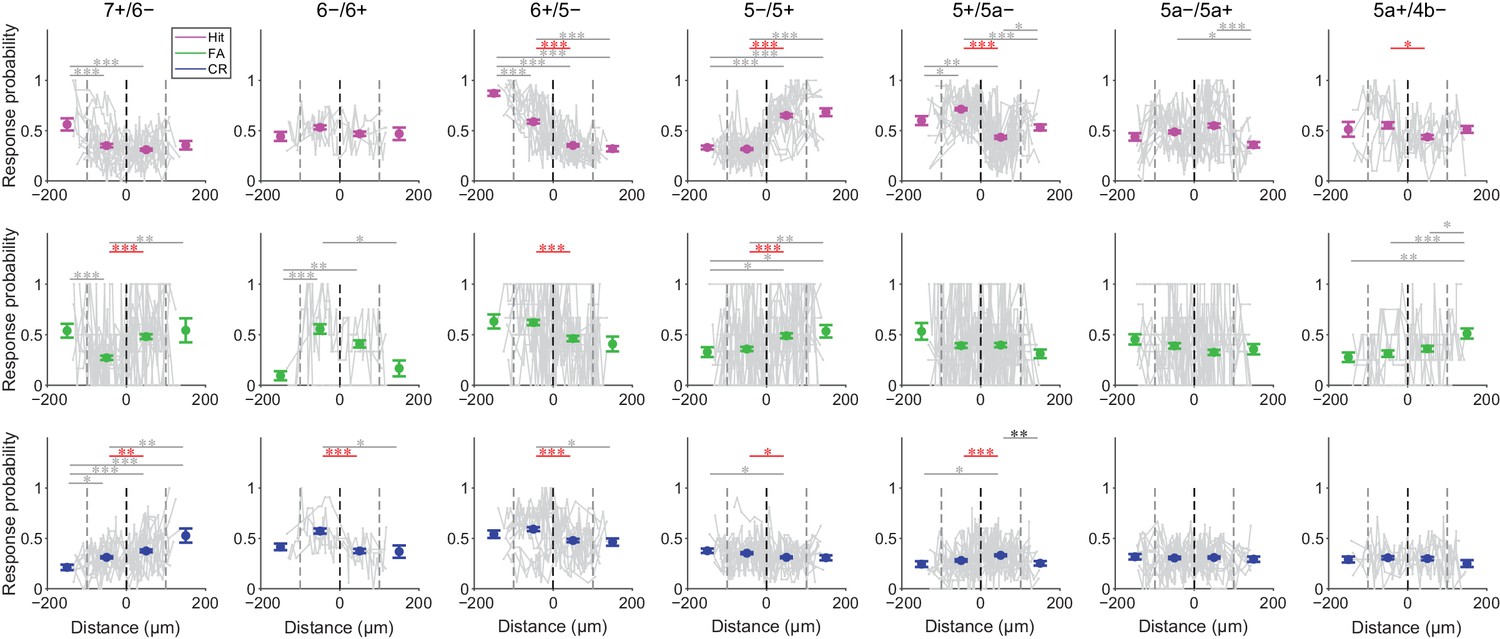
Broad correspondence between functional boundaries and AldC expression boundaries at the microzone level.
Probability of response during the early response window (0 to 0.5 s from cue onset) in single ROIs (gray dots) for each trial type (hit, magenta; FA, green; CR, blue) plotted as a function of relative distance from AldC expression boundaries (gray lines; single lines represent single imaging sessions). Colored dots and error bars represent the means and s.e.m. of single ROI response probability within 100 µm bins from AldC expression boundaries, pooled across sessions and animals (lateral 100–200 μm bin, lateral 0–100 μm bin, medial 0–100 μm bin, and medial 100–200 μm bin; 7+/6−, n = 5 mice, 12 imaging sessions, 18, 147, 147, and 11 ROIs; 6−/6+, n = 3 mice, four imaging sessions, 8, 48, 40, and 6 ROIs; 6+/5−, n = 8 mice, 13 imaging sessions, 19, 140, 143, and 23 ROIs; 5−/5+, n = 9 mice, 15 imaging sessions, 34, 199, 161, and 33 ROIs; 5+/5a−, n = 8 mice, 16 imaging sessions, 21, 168, 209, and 37 ROIs; 5a−/5a+, n = 3 mice, 13 imaging sessions, 35, 159, 159, and 26 ROIs; 5a+/4b−, n = 2 mice, six imaging sessions, 13, 69, 74, and 23 ROIs). Red horizontal lines and asterisks represent significant difference between adjacent 100 μm bins across AldC expression boundaries. Gray horizontal lines and asterisks represent significant difference between the other pairs of 100 μm bins. Black vertical dashed lines represent AldC expression boundaries. Gray vertical dashed lines represent other boundaries between 100 μm bins. One-way ANOVA on ranks with repeated measures followed by post-hoc Tukey’s test: *p<0.05, **p<0.01, ***p<0.001.
-
Figure 2—figure supplement 1—source data 1
Datasets used to create Figure 2—figure supplement 1.
- https://doi.org/10.7554/eLife.47021.010
Figure 2—figure supplement 2

Broad correspondence between functional boundaries and AldC expression boundaries at cellular resolution.
(A) Principal component analyses of whole ∆F/F traces from all ROIs in single imaging sessions at all AldC expression boundaries, irrespective of AldC expression. Colored dots correspond to results from k-means clustering on the basis of the first three principal components (PrC1, PrC2, and PrC3). The first two major principal components (PrC1 and PrC2) for individual ROIs are plotted for better visualization. The silhouette value for the optimized cluster number is indicated on the bottom. (B) Projections of each clustering result from panel (A) using the same color scheme, overlaid on the tdTomato image. Coincidence rates of clustering results and AldC expression are indicated at the bottom. Scale bars: 40 μm. (C) Correlation matrices of whole traces from all the ROIs in panel (B) aligned from lateral to medial. Red and blue bars correspond to AldC+ and AldC− PCs. Note the exact delineation of the correlation matrices at the AldC expression boundary where coincidence value is close to 100%. (B, C) White dashed lines represent boundaries of AldC expression.
Figure 2—figure supplement 3
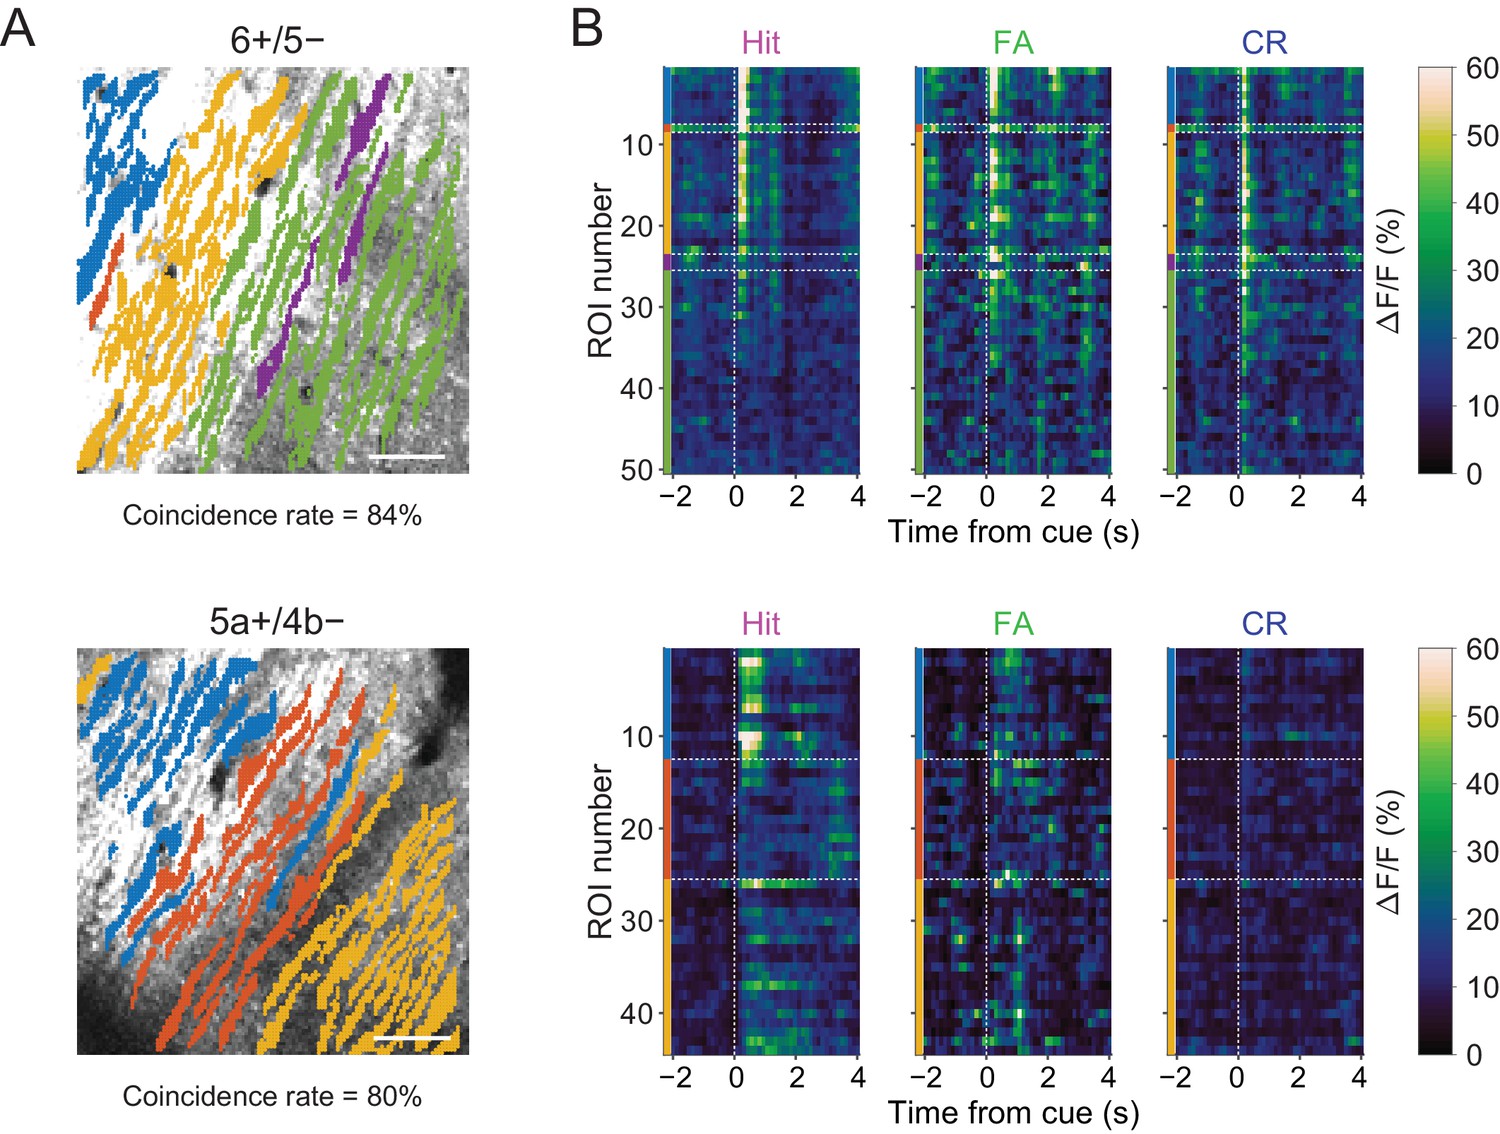
Task-related CF signals in individual clusters.
(A) Projection of clustering results of Figure 2—figure supplement 2A overlaid on tdTomato images at 6+/5− (top) and 5a+/4b− (bottom) boundaries. Coincidence rates of clustering results and AldC expression are indicated below the images. (B) Trial-averaged single ROI calcium traces separated on the basis of clustering results. Colored bars indicate ROIs from colored clusters in panel (A). Horizontal dashed lines represent the boundaries of clusters. Vertical dashed lines represent cue onsets.
Figure 2—figure supplement 4
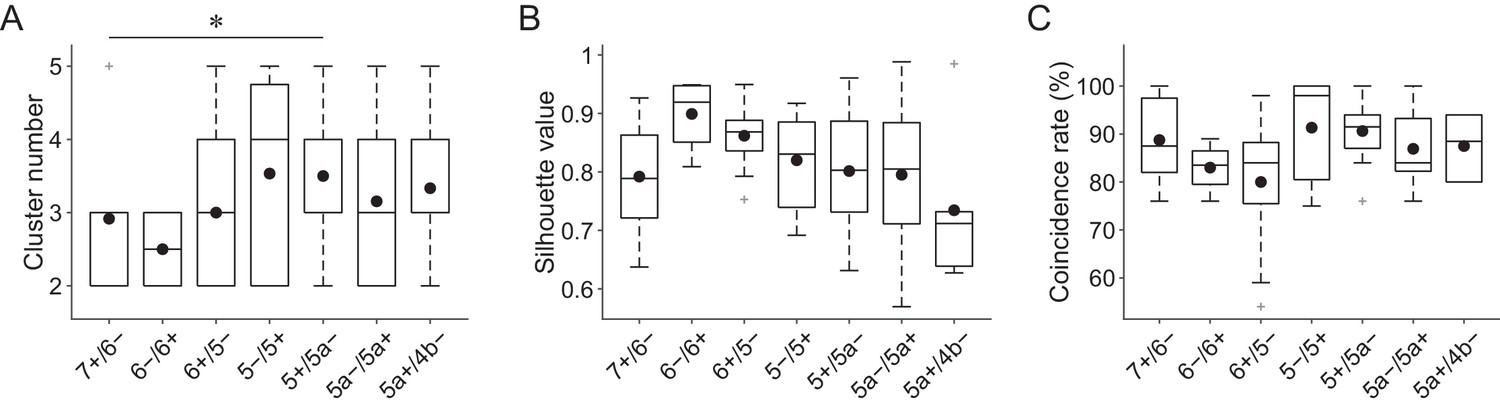
Summary of correspondence between functional boundaries and AldC expression.
(A) Number of clusters per field of view for all sessions from all mice (n = 5, 3, 8, 9, 8, 3, and two mice, 12, 4, 13, 15, 16, 13, and 6 sessions for 7+/6−, 6−/6+, 6+/5−, 5−/5+, 5+/5a−, 5a−/5a+, and 5a+/4b− boundaries, respectively). (B) Same as in panel (A), but for silhouette values for the clustering results. (C) Same as in panel (A), but for coincidence rates for the clustering results. One-way ANOVA on ranks with repeated measures followed by post-hoc Tukey’s test: *p<0.05.
-
Figure 2—figure supplement 4—source data 1
Datasets used to create Figure 2—figure supplement 4.
- https://doi.org/10.7554/eLife.47021.014
Figure 3 with 2 supplements
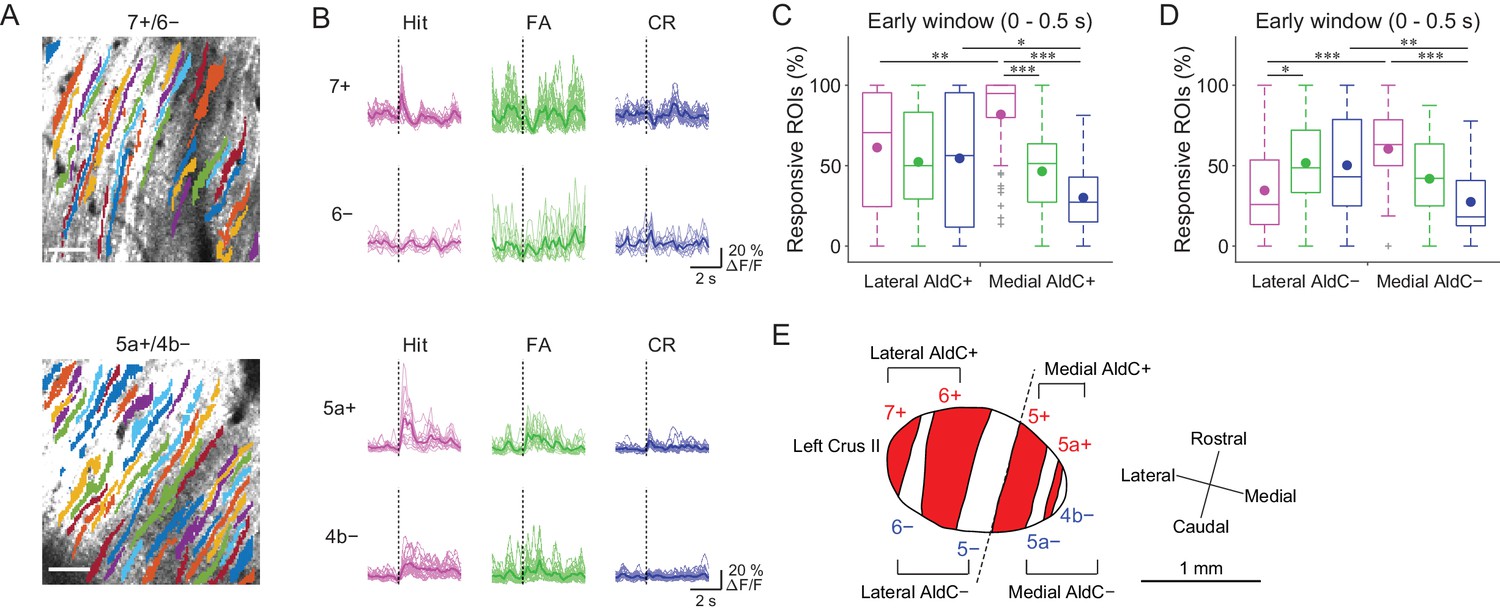
Difference in CF signals between the lateral and medial Crus II.
(A) Extracted ROIs representing PC dendrites that are pseudocolored overlaid on the tdTomato image around a 7+/6− (top) and a 5a+/4b− (bottom) boundary. Scale bars, 40 μm. (B) Single ROI trial-averaged traces for 7+ and 6− (top) and 5a+ and 4b− (bottom) compartments from the data in panel (A). Thick lines represent ROI-averaged traces. (C) Percentage of responsive ROIs during the early response window (0 to 0.5 s from cue onset) in an AldC compartment per session for each trial type pooled across all the lateral AldC+ or medial AldC+ compartments (n = 12 and 13 mice, 29 and 50 imaging sessions, respectively). Colored dots represent means. Colors represent trial types (hit, magenta; FA, green; CR, blue). (D) Same as panel (C) but for all the lateral AldC− or medial AldC− compartments (n = 15 and 9 mice, 44 and 35 imaging sessions, respectively). (E) Schematic diagram of the left Crus II showing a functional grouping of AldC compartments. The dashed line represents a boundary between the lateral and medial Crus II. (C, D) Two-way ANOVA on ranks with repeated measures followed by post-hoc Tukey’s test: *p<0.05, **p<0.01, ***p<0.001.
-
Figure 3—source data 1
Datasets used to create Figure 3.
- https://doi.org/10.7554/eLife.47021.020
Figure 3—figure supplement 1

Mediolateral separation of task-related CF signals in the Crus II.
(A) Extracted ROIs representing PC dendrites around the example 7+/6−, 6−/6+, 6+/5−, 5−/5+, 5+/5a−, 5a−/5a+, and 5a+/4b− boundaries that are pseudocolored and overlaid on the tdTomato image. Scale bars, 40 μm. (B) Single ROI trial-averaged traces for all the AldC compartments from the data in panel (A). Thick lines represent ROI-averaged traces. (C) Z-scored trial-averaged ΔF/F for each compartment averaged across sessions and mice, aligned from lateral to medial separately for AldC+ and AldC− compartments (n = 5, 3, 8, 9, 8, 3, and two mice, and 12, 4, 13, 15, 16, 13 and 6 sessions for 7+/6−, 6−/6+, 6+/5−, 5−/5+, 5+/5a−, 5a−/5a+ and 5a+/4b− boundaries, respectively). Vertical dashed lines delineate the lateral and medial Crus II. Horizontal dashed lines represent cue onset.
-
Figure 3—figure supplement 1—source data 1
Datasets used to create Figure 3—figure supplement 1.
- https://doi.org/10.7554/eLife.47021.018
Figure 3—figure supplement 2
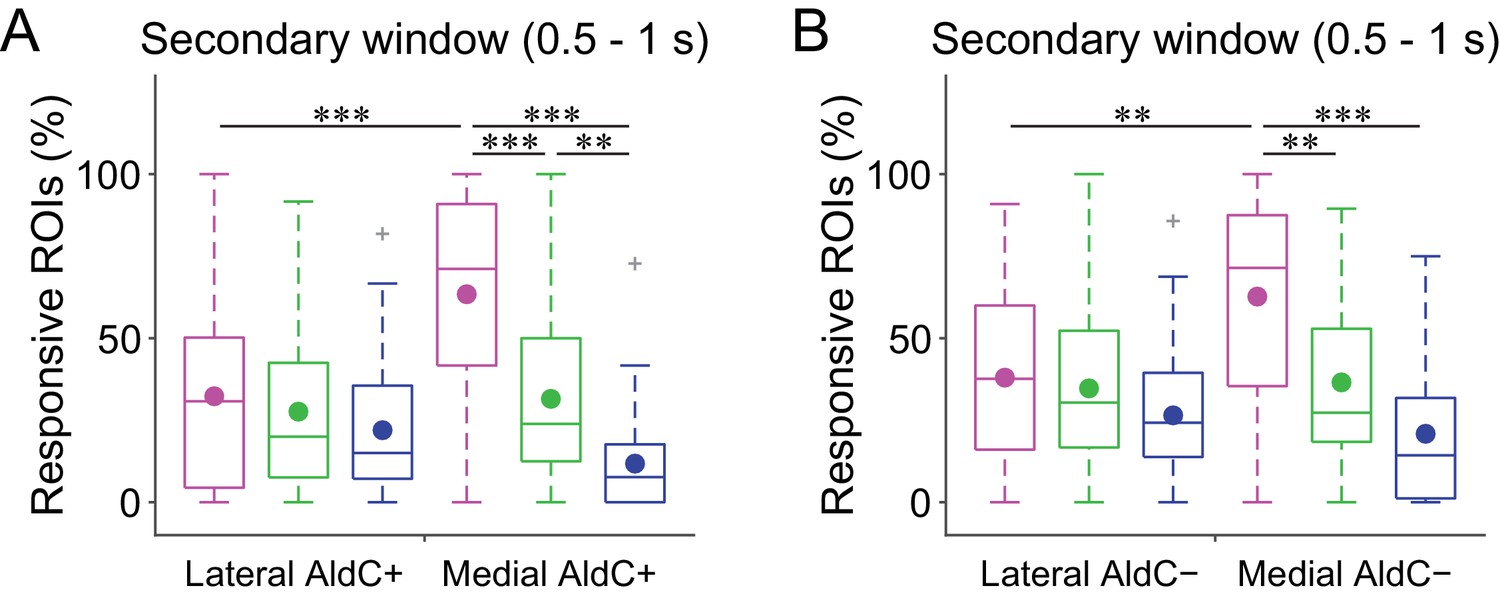
Difference in secondary CF signals between the lateral and medial Crus II.
(A) Percentage of responsive ROIs during the secondary response window (0.5 to 1 s from cue onset) in a compartment per session for each trial type pooled across all the lateral AldC+ or medial AldC+ compartments (n = 12 and 13 mice, 29 and 50 imaging sessions, respectively). Colored dots represent means. Colors represent trial types (hit, magenta; FA, green; CR, blue). (B) Same as panel (A) but for all the lateral AldC− or medial AldC− compartments (n = 15 and 9 mice, 44 and 35 imaging sessions, respectively). (A, B) Two-way ANOVA on ranks with repeated measures followed by post-hoc Tukey’s test: **p<0.01, ***p<0.001.
Figure 4 with 3 supplements
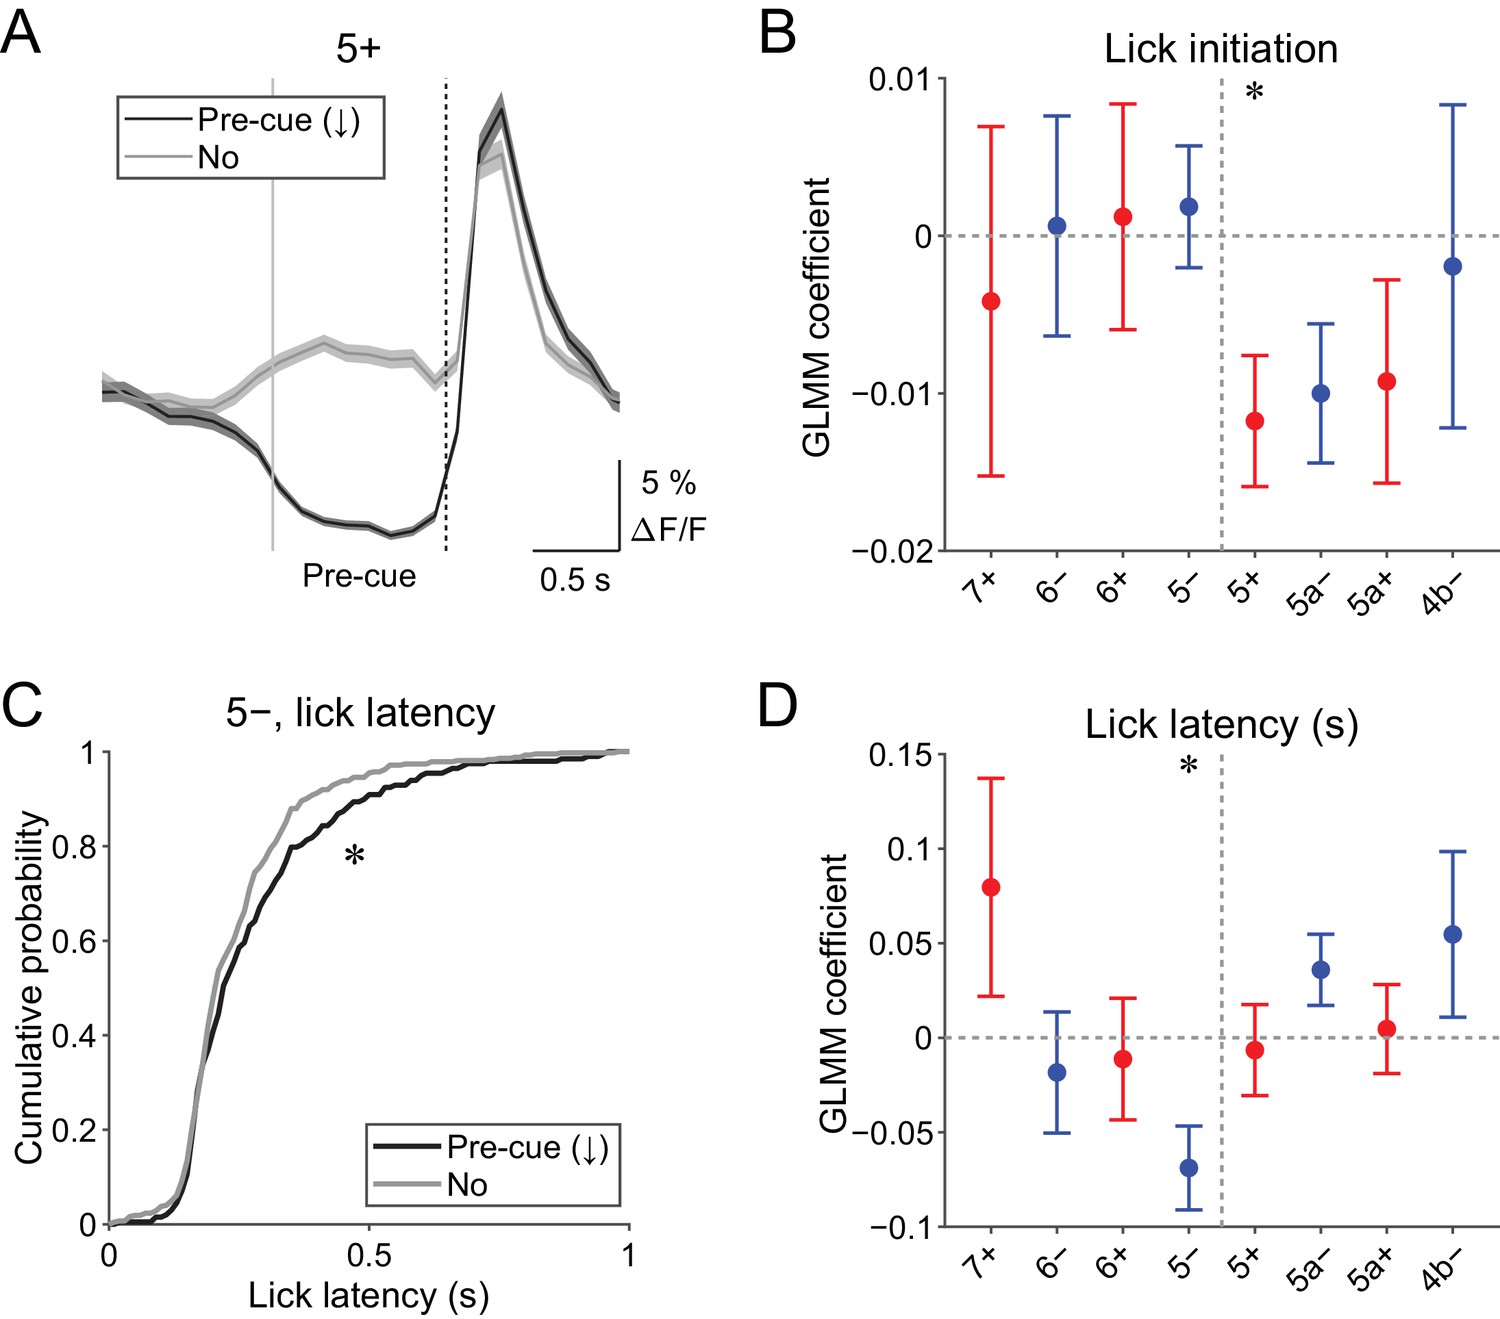
Behavioral relevance of pre-cue decrease in CF signals.
(A) Single trial calcium traces in a 5+ compartment with (pre-cue (↓); black) or without (no; gray) decreases in CF signals, showing difference in the pre-cue response window (–1 to 0 s from the cue onset; indicated by gray and dashed vertical lines). A dashed vertical line represents the cue onset. Thick lines and shadings represent mean ± s.e.m.. (B), Coefficients of GLMM fit for single trial pre-cue ΔF/F in each AldC compartment by the presence (1) or absence (0) of lick initiation in the following trial (n = 5, 6, 10, 12, 12, 10, 3, and two mice; 393, 605, 649, 1078, 1281, 1051, 664, and 253 trials for 7+, 6−, 6+, 5−, 5+, 5a−, 5a+, and 4b− compartments, respectively). (C), Cumulative distribution of lick latency from cue onsets during licking trials (hit and FA) with (pre-cue (↓); black) or without (no; gray) pre-cuedecreases in CF signals in a 5− compartment. (D) Coefficients of GLMM fit for single trial pre-cue ΔF/F in each AldC compartment before licking trials by latency of lick initiation in the trial (n = 5, 6, 10, 12, 12, 10, 3, and two mice; 225, 346, 384, 621, 722, 586, 353, and 131 trials for 7+, 6−, 6+, 5−, 5+, 5a−, 5a+, and 4b− compartments, respectively). (B, D), Colored dots and error bars represent mean ± s.e.m. Red and blue colors correspond to AldC+ and AldC− compartments, respectively. ANOVA on GLMM fit: *p<0.05. (C) KS test: *p<0.05.
-
Figure 4—source data 1
Datasets used to create Figure 4.
- https://doi.org/10.7554/eLife.47021.026
Figure 4—figure supplement 1
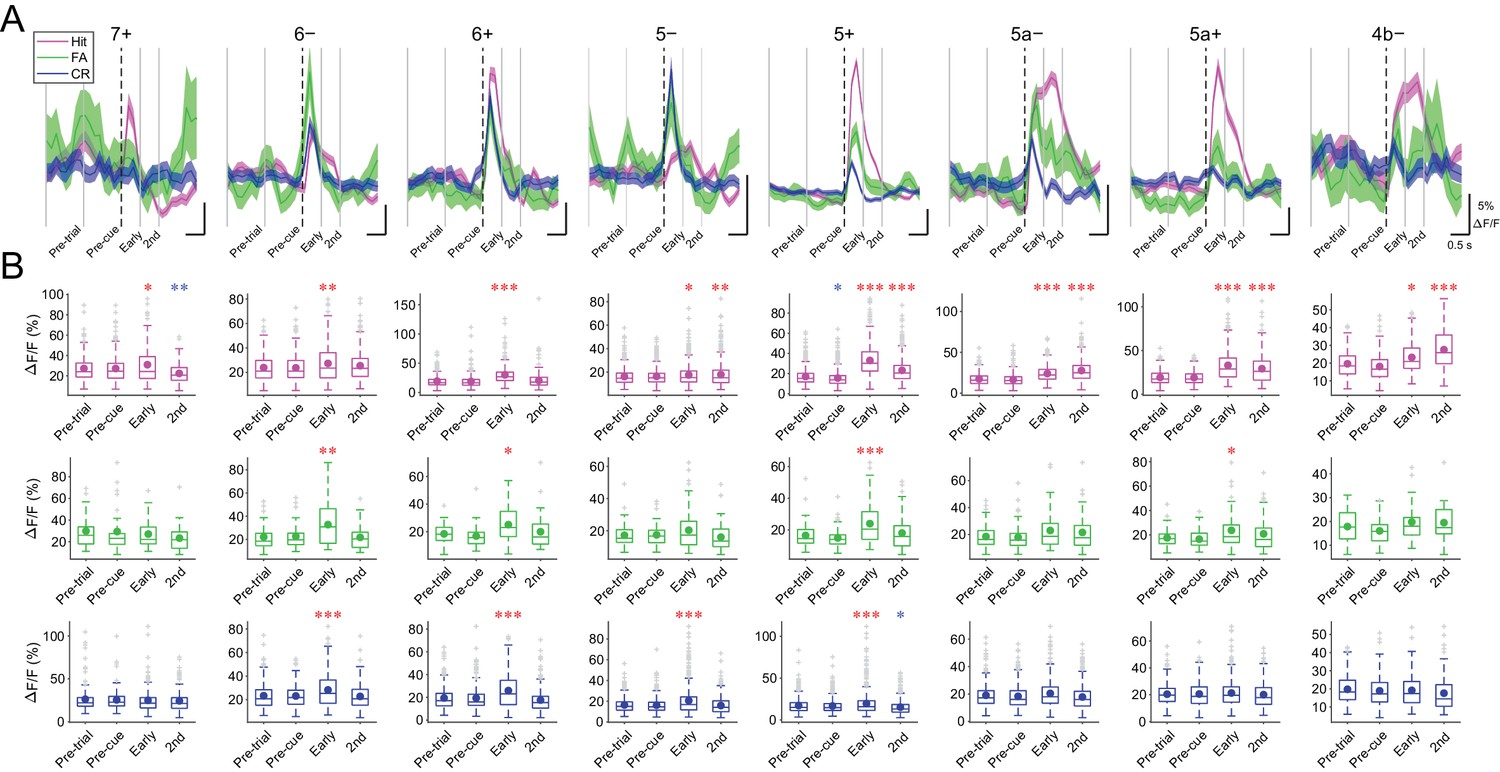
Task-related CF signals in all the compartments.
(A) ROI-averaged ΔF/F traces from single compartments in single trials were classified by trial types and averaged across sessions and animals. Thick colored lines represent mean and the shadings represent s.e.m. Vertical dashed lines represent cue onset, and gray solid lines represent the edges of response windows. (B) Averaged ΔF/F value within each response window per trial for each trial type pooled across sessions and animals ( 7+, n = 5 mice, 195, 30, and 155 trials for hit, FA, and CR trials; 6−, n = 6 mice, 305, 41, and 245 trials; 6+, n = 10 mice, 345, 39, and 261 trials; 5−, n = 12 mice, 555, 66, and 452 trials; 5+, n = 12 mice, 644, 78, and 553 trials; 5a−, n = 10 mice, 516, 70, and 454 trials; 5a+, n = 3 mice, 304, 49, and 302 trials; 4b−, n = 2 mice, 112, 19, and 120 trials). Colored dots represent means and gray crosses represent outliers. Asterisks represent significantly positive (red) or negative (blue) differences compared with pre-trial ΔF/F. One-way ANOVA with repeated measures followed by post-hoc Tukey’s test: *p<0.05, **p<0.01, ***p<0.001. (A,B) Only trials without appreciable licking (lick rate <1 Hz) during pre-trial period are included in the analyses.
-
Figure 4—figure supplement 1—source data 1
Datasets used to create Figure 4—figure supplements 1 and 3.
- https://doi.org/10.7554/eLife.47021.023
Figure 4—figure supplement 2

Single ROI single trial CF signals.
(A) Single trial calcium traces for single ROI in an example imaging session from a 5+ compartment. Trials detected as pre-cue decreases (P(↓)), early increases (E), and secondary increases (S) in CF signals in the 5+ compartment are indicated on the top. Note the coexistence of these responses in single trials and single ROIs. (B) Same as panels (A) but for late decreases (Late(↓)) in lick aligned traces. Vertical dashed lines represent cue onset, and solid lines represent the edges of response windows. Red bars represent their AldC+ identity.
Figure 4—figure supplement 3
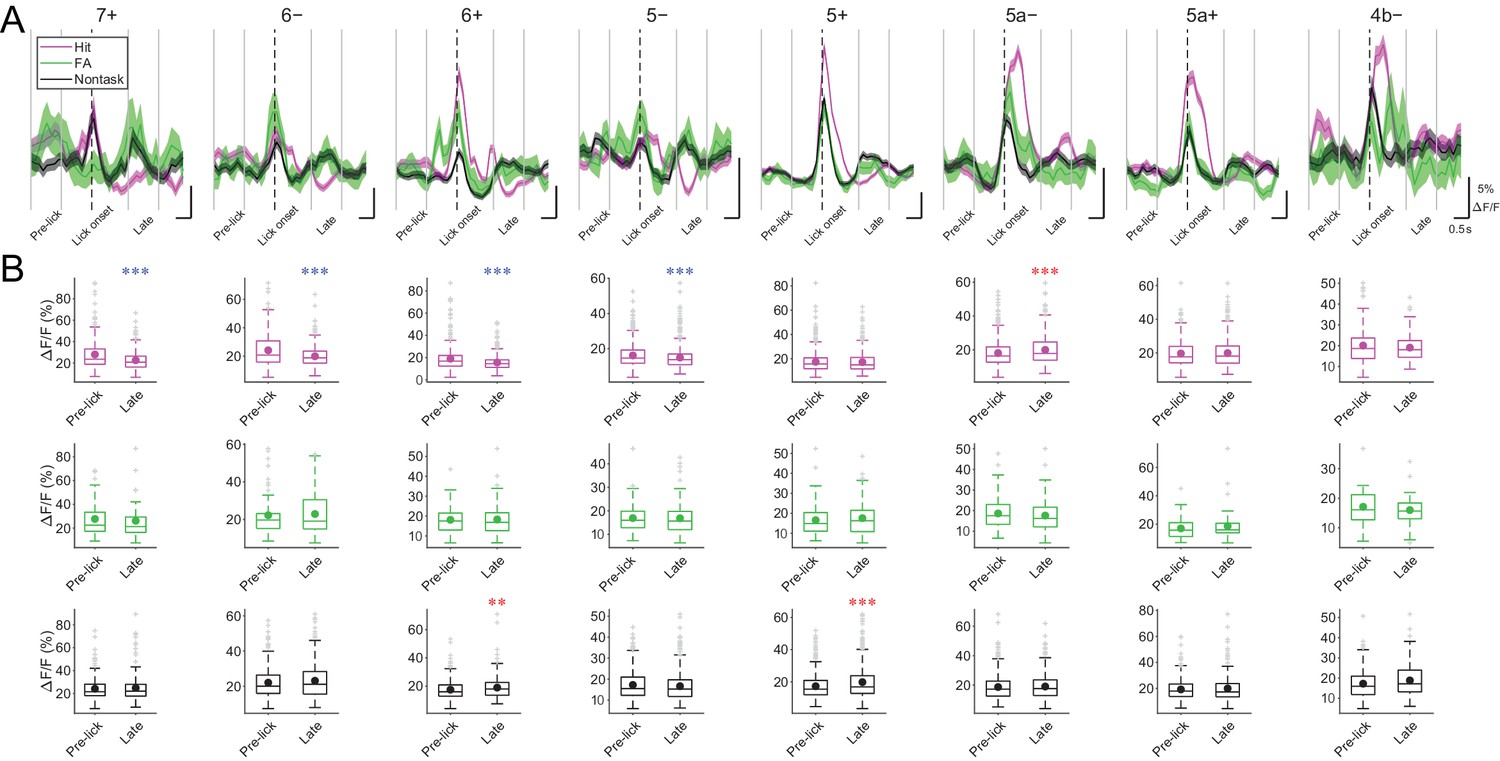
CF signals at late timing during licking trials and nontask licking epochs.
(A) ROI-averaged ΔF/F traces from single compartments in single licking trials (hit and FA) and nontask licking epochs were classified by trial types and averaged across sessions and animals. Thick colored lines represent means and the shadings represent s.e.m. Vertical dashed lines represent lick onset, and gray solid lines represent the edges of response windows. (B) Averaged ΔF/F value within each response window per trial for each trial type and epoch pooled across sessions and animals (hit, FA trials and non-task licking epochs; 7+, n = 5 mice, 240, 45, and 202 trials and epochs; 6−, n = 6 mice, 360, 59, and 281 trials and epochs; 6+, n = 10 mice, 435, 58, and 352 trials and epochs; 5−, n = 12 mice, 667, 94, and 460 trials and epochs; 5+, n = 12 mice, 761, 108, and 548 trials and epochs; 5a−, n = 10 mice, 631, 101, and 551 trials and epochs; 5a+, n = 3 mice, 365, 66, and 322 trials and epochs; 4b−, n = 2 mice, 143, 23, and 132 trials and epochs). Colored dots represent means and gray crosses represent outliers. Asterisks represent significantly positive (red) or negative (blue) differences compared with pre-trial ΔF/F. One-way ANOVA with repeated measures followed by post-hoc Tukey’s test: **p<0.01, ***p<0.001.
Figure 5
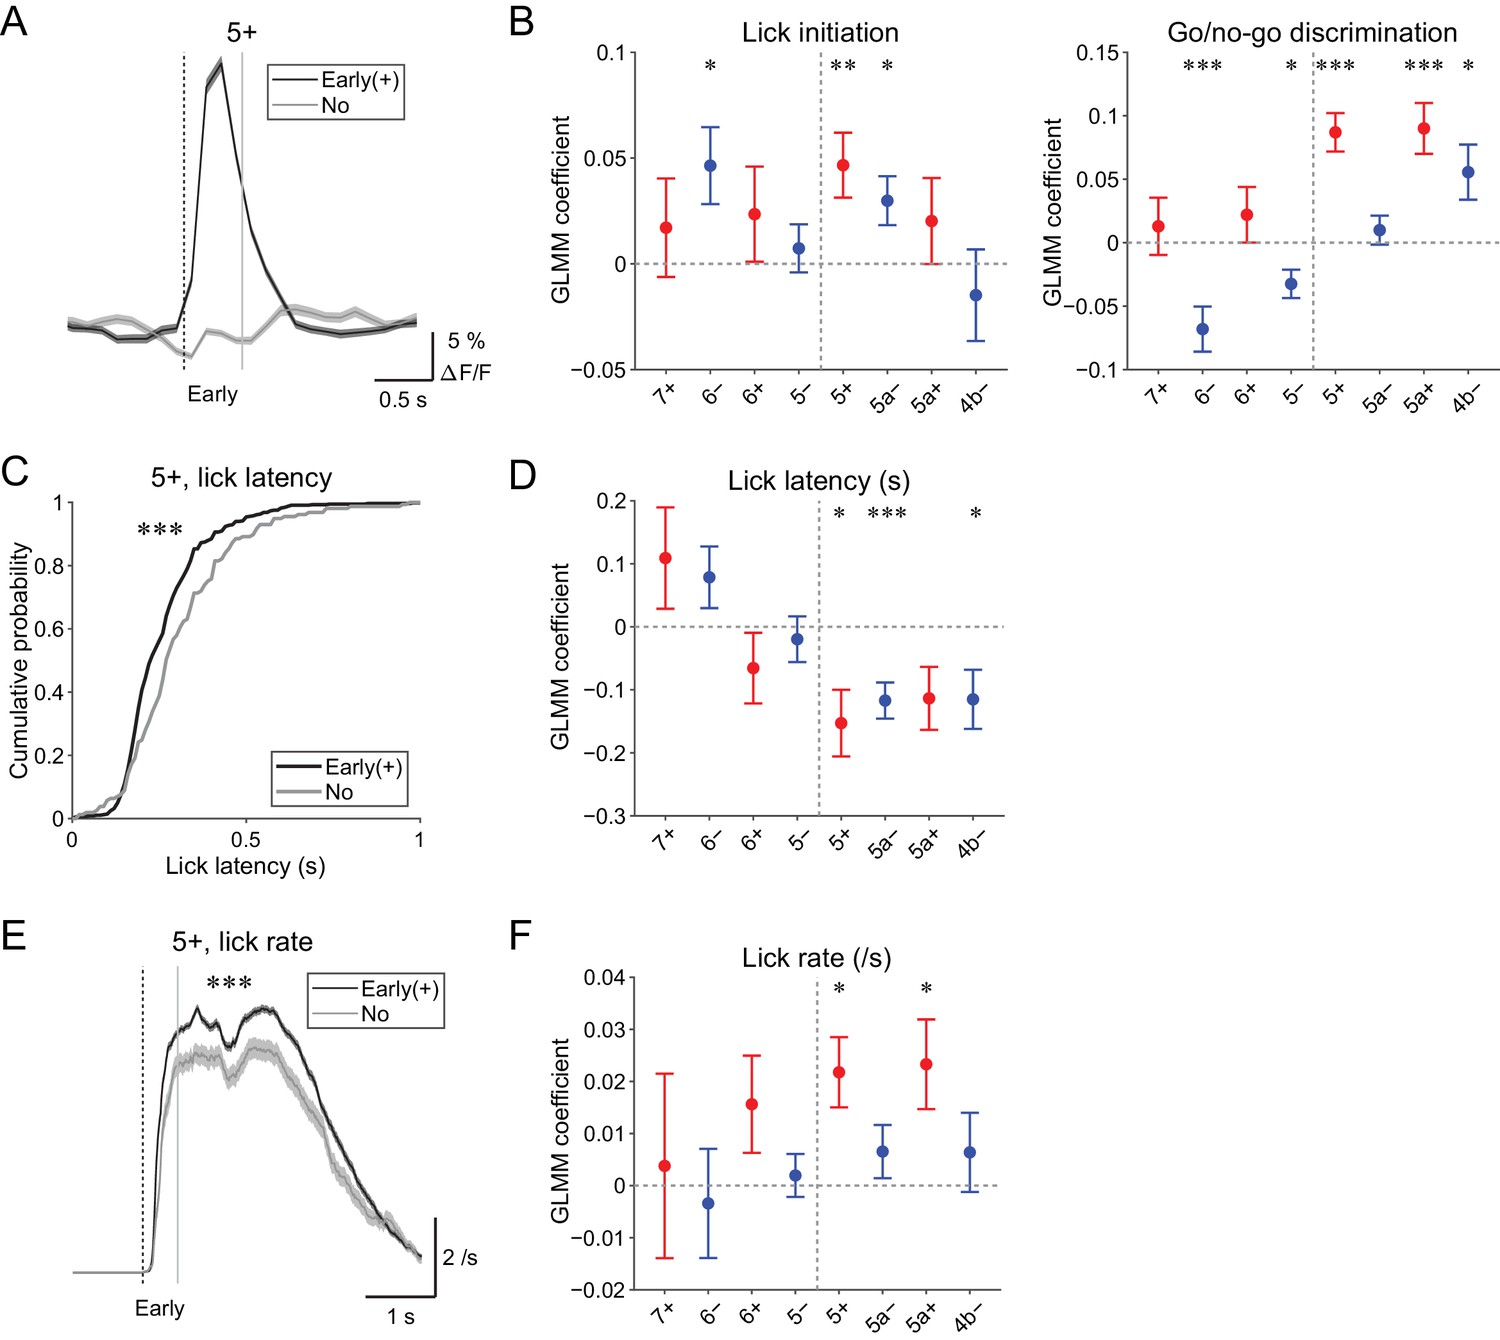
Behavioral relevance of early increase in CF signals.
(A) Single trial calcium traces in a 5+ compartment with (early (+); black) or without (no; gray) increases in CF signals showing a difference in the early response window (0 to 0.5 s from cue onset). (B) Left, coefficients for lick initiation from GLMM fit for single trial ΔF/F during the early response window in each AldC compartment during all trials by the presence (1) or absence (0) of lick initiation in the trial and go (1) or no-go (0) cue in the trial (n = 5, 6, 10, 12, 12, 10, 3, and two mice; 393, 605, 649, 1,078, 1,281, 1,051, 664, and 253 trials for 7+, 6−, 6+, 5−, 5+, 5a−, 5a+, and 4b− compartments, respectively). Right, same as left, but coefficients for go/no-go cue. (C) Cumulative distributions of lick latency from cue onset during licking trials (hit and FA) with (early (+); black) or without (no; gray) early increases in CF signals in a 5+ compartment. (D) Coefficients for latency of lick initiation from GLMM fit for trial-by-trial ΔF/F during the early response window in each compartment during licking trials in the trial by the lick latency (n = 5, 6, 10, 12, 12, 10, 3, and two mice; 225, 346, 384, 621, 722, 586, 353, and 131 trials for 7+, 6−, 6+, 5−, 5+, 5a−, 5a+, and 4b− compartments, respectively). (E), Instantaneous lick rate during licking trials (hit and FA) with (early (+); black) or without (no; gray) early increases in CF signals in a 5+ compartment (n = 12 mice, 565 and 157 trials, respectively). (F) Same as panel (D), but coefficients are for the lick rate of the first lick bout in the trial. (A, E) Early response window is indicated by a dashed vertical line representing the cue onset and a gray vertical line. Thick lines and shadings represent mean ± s.e.m. (B, D, F) Colored dots and error bars represent mean ± s.e.m. Red and blue colors correspond to the AldC+ and AldC− compartments, respectively. ANOVA on GLMM fit: *p<0.05, **p<0.01, ***p<0.001. (C) KS test: ***p<0.001. (E) One-way ANOVA with repeated measures: ***p<0.001.
-
Figure 5—source data 1
Datasets used to create Figure 5.
- https://doi.org/10.7554/eLife.47021.028
Figure 6
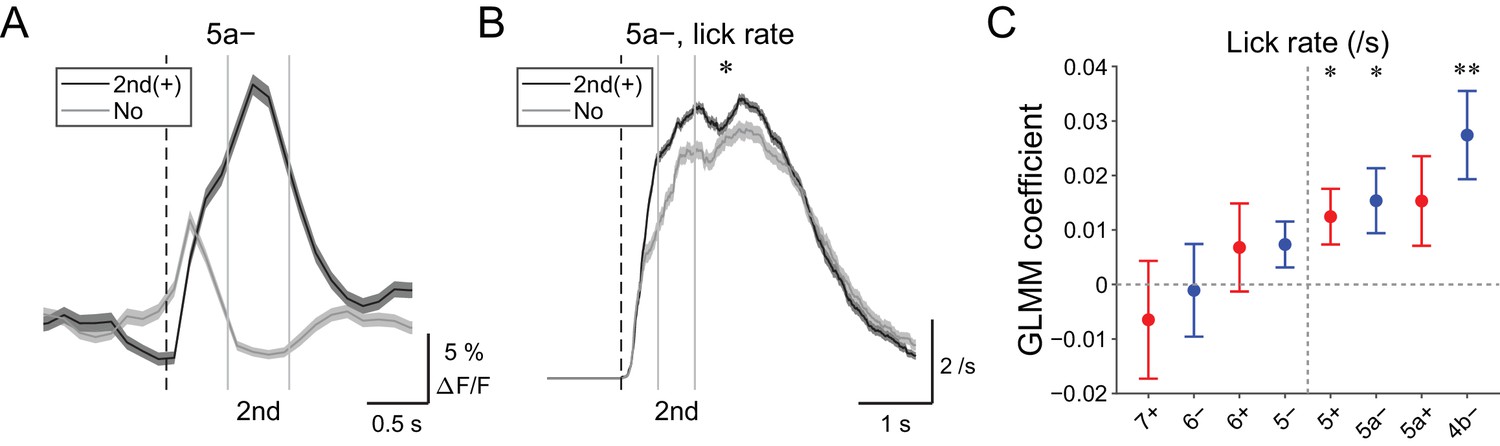
| Behavioral relevance of secondary increase in CF signals.
(A) Single trial calcium traces in a 5a− compartment with (2nd (+); black) or without (no; gray) increases in CF signals showing difference during the secondary response window (0.5 to 1 s from cue onset). (B) Instantaneous lick rate during licking trials (hit and FA) with (2nd (+); black) or without (no; gray) increases in CF signals during the secondary response window in a 5a− compartment (n = 10 mice, 349 and 237 trials, respectively). (C) Coefficients of GLMM fit for single trial ΔF/F during the secondary response window in each AldC compartment during licking trials by lick rate of the first lick bout in the trial (n = 5, 6, 10, 12, 12, 10, 3, and two mice; 225, 346, 384, 621, 722, 586, 353, and 131 trials for 7+, 6−, 6+, 5−, 5+, 5a−, 5a+, and 4b− compartments, respectively). Colored dots and error bars represent mean ± s.e.m. Red and blue colors correspond to AldC+ and AldC− compartments, respectively. (A, B) The secondary response window is indicated by gray vertical lines. A dashed vertical line represents the cue onset. Thick lines and shadings represent means ± s.e.m. (B) One-way ANOVA with repeated measures: *p<0.05. (C) ANOVA on GLMM fit: *p<0.05, **p<0.01.
-
Figure 6—source data 1
Datasets used to create Figure 6.
- https://doi.org/10.7554/eLife.47021.030
Figure 7
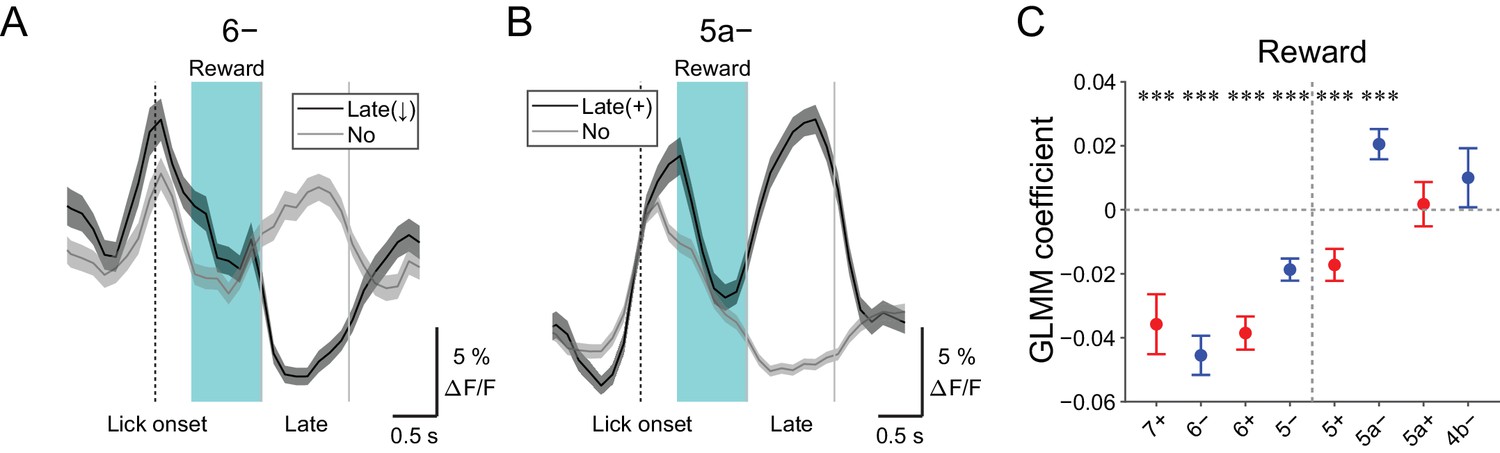
Late changes in CF signals represent positive reward outcomes.
(A) Single trial calcium traces in a 6− compartment with (late (↓); black) or without (no; gray) decreases in CF signals during the late response window aligned to lick onset during licking trials (hit and FA) and non-task licking epochs (1.2 to 2.2 s from lick onset). (B) Same as panel (A) but for increases (late (+)) in a 5a− compartment. (C) Coefficients of GLMM fit for single trial ΔF/F during the late response window in each AldC compartment during licking trials (hit and FA) and non-task licking epochs by the presence (1) or absence (0) of reward in the trial (n = 5, 6, 10, 12, 12, 10, 3, and two mice; 427, 627, 736, 1081, 1270, 1137, 675, and 263 trials and epochs for 7+, 6−, 6+, 5−, 5+, 5a−, 5a+ and 4b− compartments, respectively). Colored dots and error bars represent means ± s.e.m. Red and blue colors correspond to AldC+ and AldC− compartments, respectively. ANOVA on GLMM fit: ***p<0.001. (A, B) The late response window is indicated by gray vertical lines. A dashed vertical line represents the lick onset. Light blue shadings represent the window for reward delivery. Thick lines and shadings represent means ± s.e.m.
-
Figure 7—source data 1
Datasets used to create Figure 7.
- https://doi.org/10.7554/eLife.47021.032
Figure 8
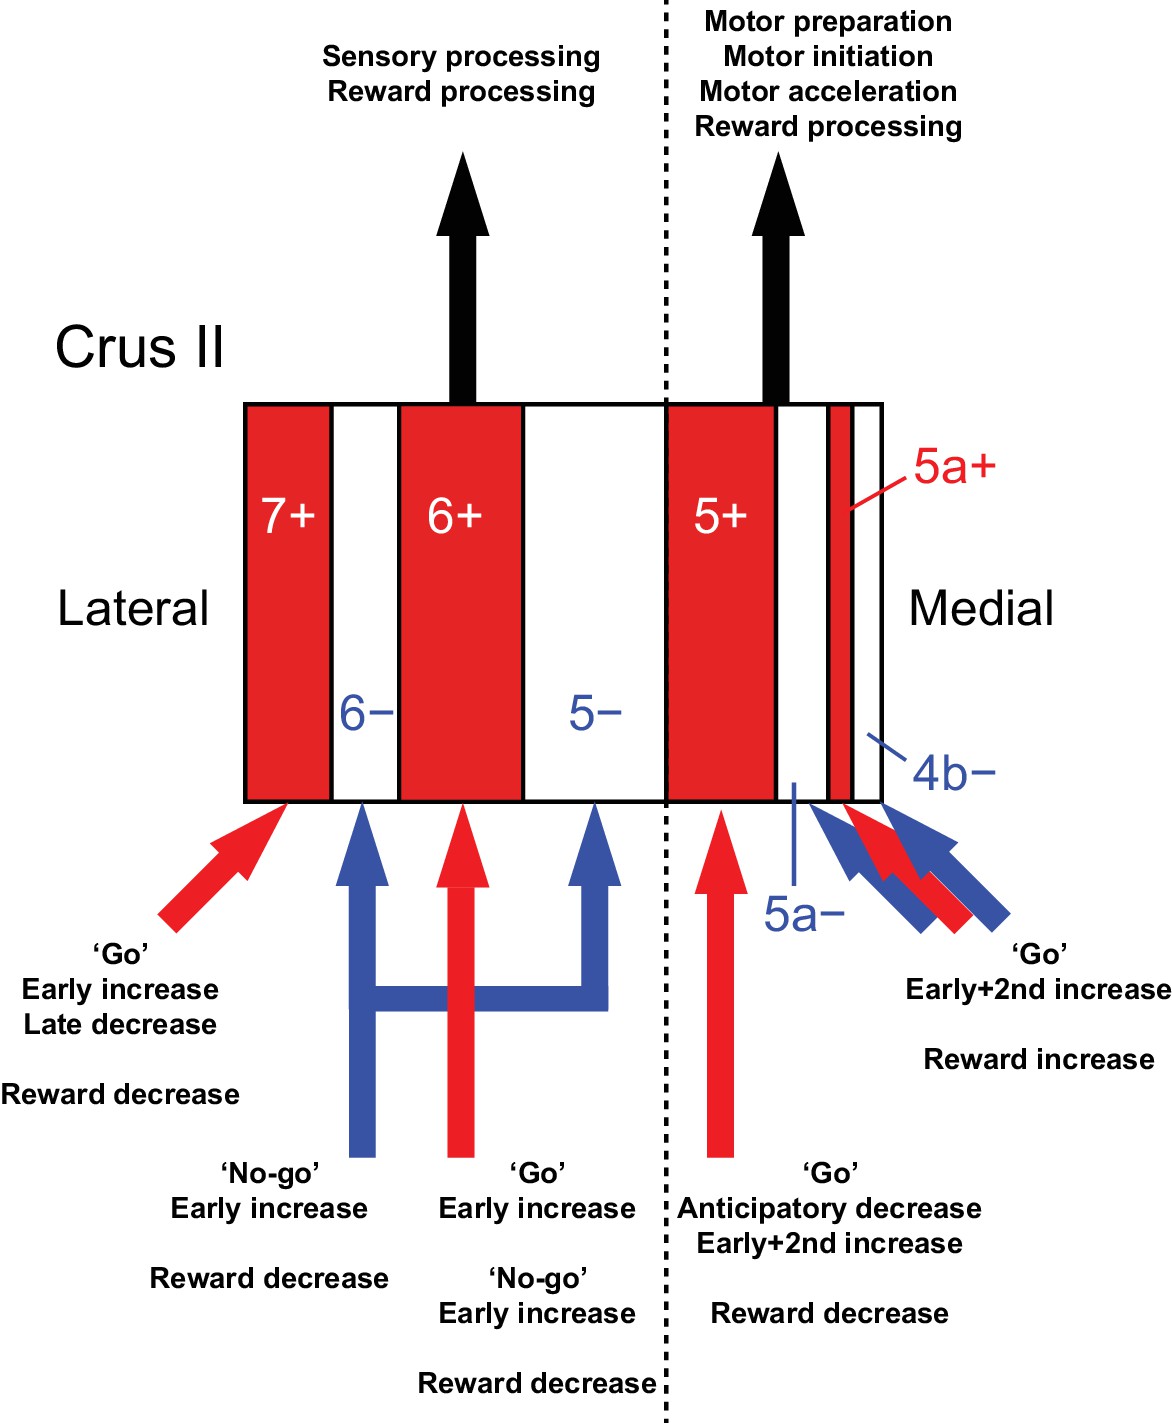
Diversity of CF signals across the entire Crus II and their functional implications.
A schematic of our main findings. Red and white stripes represent AldC+ and AldC− compartments, respectively. A dashed line represents the functional boundary of lateral and medial Crus II. Red and blue arrows represent CF inputs to each compartment. Black arrows represent outputs from lateral and medial Crus II.
Tables
Key resources table
| Reagent type | Designation | Source | Identifier |
|---|---|---|---|
| Recombinant DNA reagent | pENN.AAV1.CMVs.PI.Cre.rBG | Addgene | RRID: Addgene_105537 |
| Recombinant DNA reagent | pAAV1.CAG.Flex.GCaMP6f.WPRE.SV40 | Addgene | RRID: Addgene_100835 |
| Genetic Reagent (Mus musculus) | C57BL/6NCrSlc | Japan SLC, Inc | RRID: MGI:5295404 |
| Genetic Reagent (Mus musculus) | Aldoc-tdTomato KI, C57BL/6N-Aldoc<tm1(tdTomato)Ksak> | RIKEN BioResource Center | MGI:6324252 |
| Software, algorithm | Matlab | MathWorks | RRID: SCR_001622 |
| Software, algorithm | Labview | National Instruments | RRID: SCR_014325 |
| Software, algorithm | Suite2P | GitHub | https://github.com/cortex-lab/Suite2P |
| Software, algorithm | Lick/no-lick task | GitHub | https://github.com/stsutsumi223/Aldoc-behavior |
Additional files
-
Supplementary file 1
Statistics results.
Complete statistics results for all the figures.
- https://doi.org/10.7554/eLife.47021.034
-
Transparent reporting form
- https://doi.org/10.7554/eLife.47021.035
Download links
A two-part list of links to download the article, or parts of the article, in various formats.
Downloads (link to download the article as PDF)
Open citations (links to open the citations from this article in various online reference manager services)
Cite this article (links to download the citations from this article in formats compatible with various reference manager tools)
Modular organization of cerebellar climbing fiber inputs during goal-directed behavior
eLife 8:e47021.
https://doi.org/10.7554/eLife.47021


