Population rate-coding predicts correctly that human sound localization depends on sound intensity
- New Jersey Institute of Technology, United States
- Rutgers University, United States
- New York University, United States
Figures
Figure 1
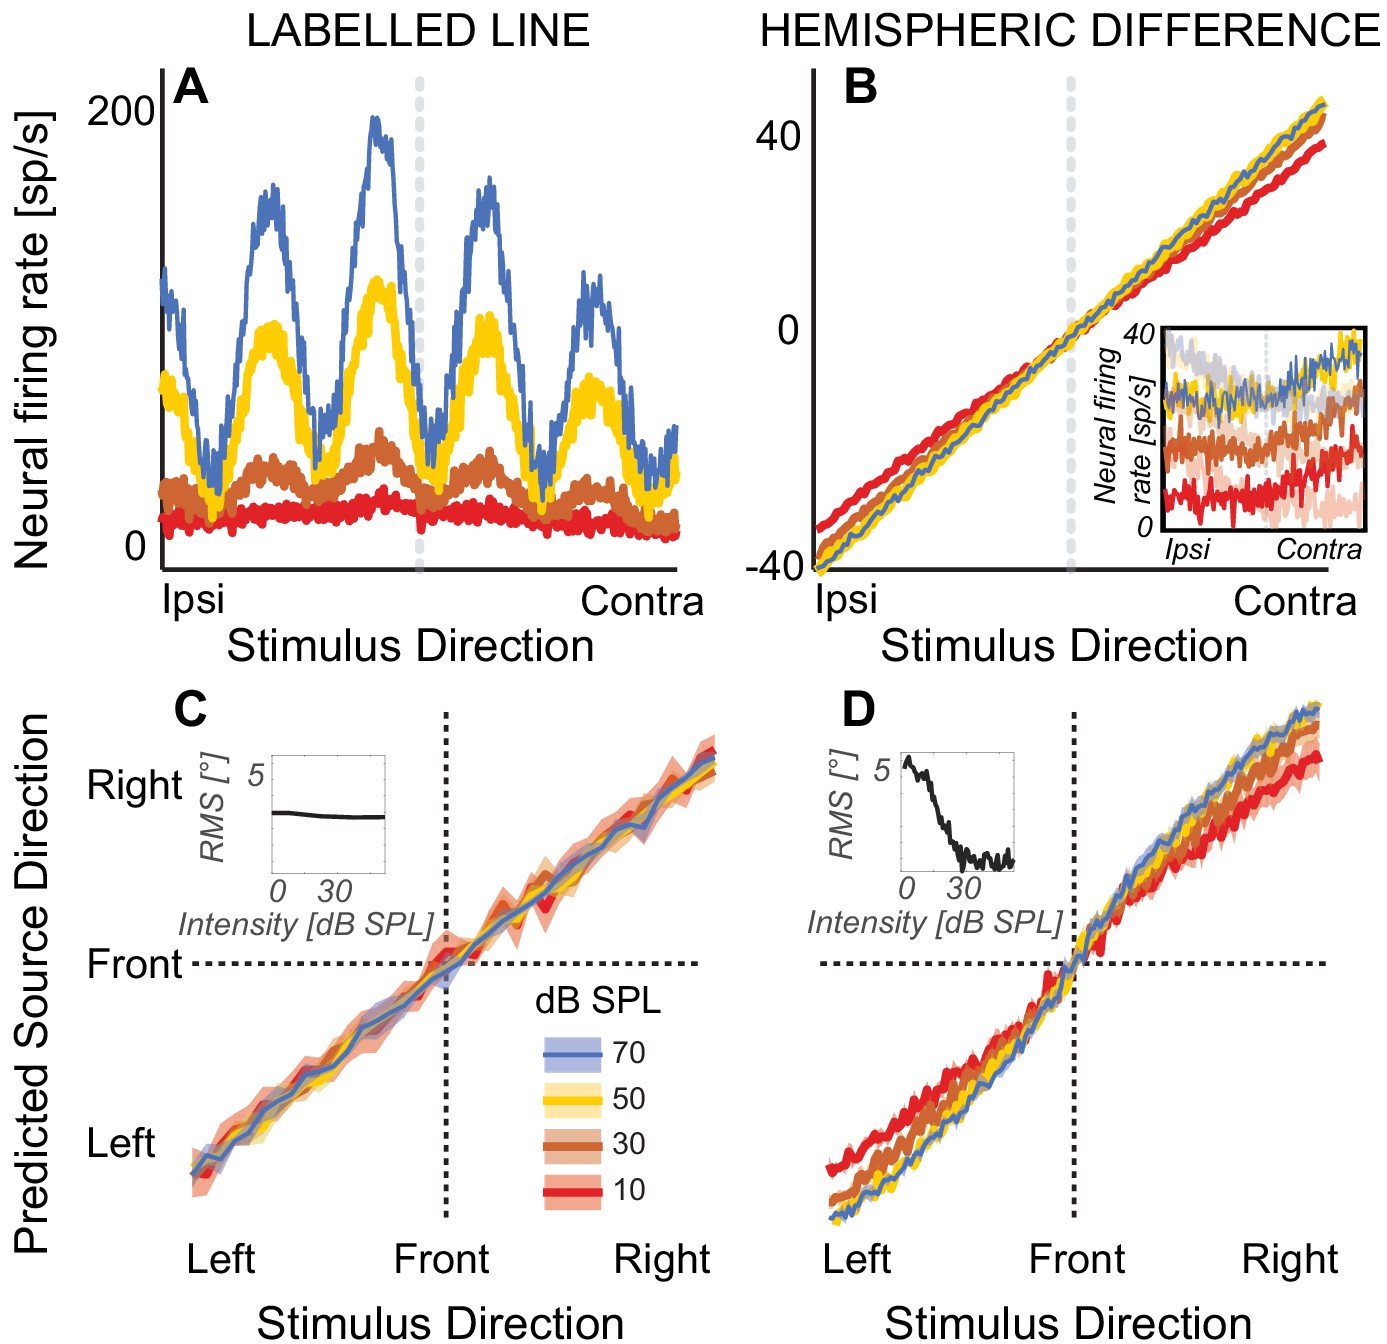
Modeling results.
(A) Firing rate of a simulated nucleus laminaris neuron with a preferred ITD of 375 µs, as a function of source ITD. The model predicts source laterality based on the locus of the peak of the firing rate function. (B) Hemispheric differences in firing rates, averaged across all 81 simulated inferior colliculus units. Rate models assume that source laterality is proportional to firing rate, causing ambiguities at the lowest sound intensities. Inset: Reconstructed responses of an inferior colliculus unit. The unit predominantly responds contralaterally to the direction of sound (high-contrast traces). The hemispheric difference model subtracts this activity from the average rate on the ipsilateral side (example shown with low-contrast traces). (C) Mean population response using labelled-line coding across a range of ITDs and sound intensities. Inset: The root-mean square (RMS) difference relative to estimated angle at 80 dB SPL does not change with sound intensity, predicting that sound laterality is intensity invariant. (D) Mean population response using hemispheric-difference coding. For lower sound intensities, predicted source direction is biased towards midline (compare red and orange versus blue or yellow). For higher sound intensities, predicted source direction is intensity invariant (blue on top of yellow line). Inset: RMS difference relative to estimated angle at 80 dB SPL decreases with increasing sound intensity, predicting that sound laterality is not intensity invariant. Ribbons show one standard error of the mean across 100 simulated responses. Sound intensity is denoted by color (see color key in the figure).
Figure 2
Behavioral results.
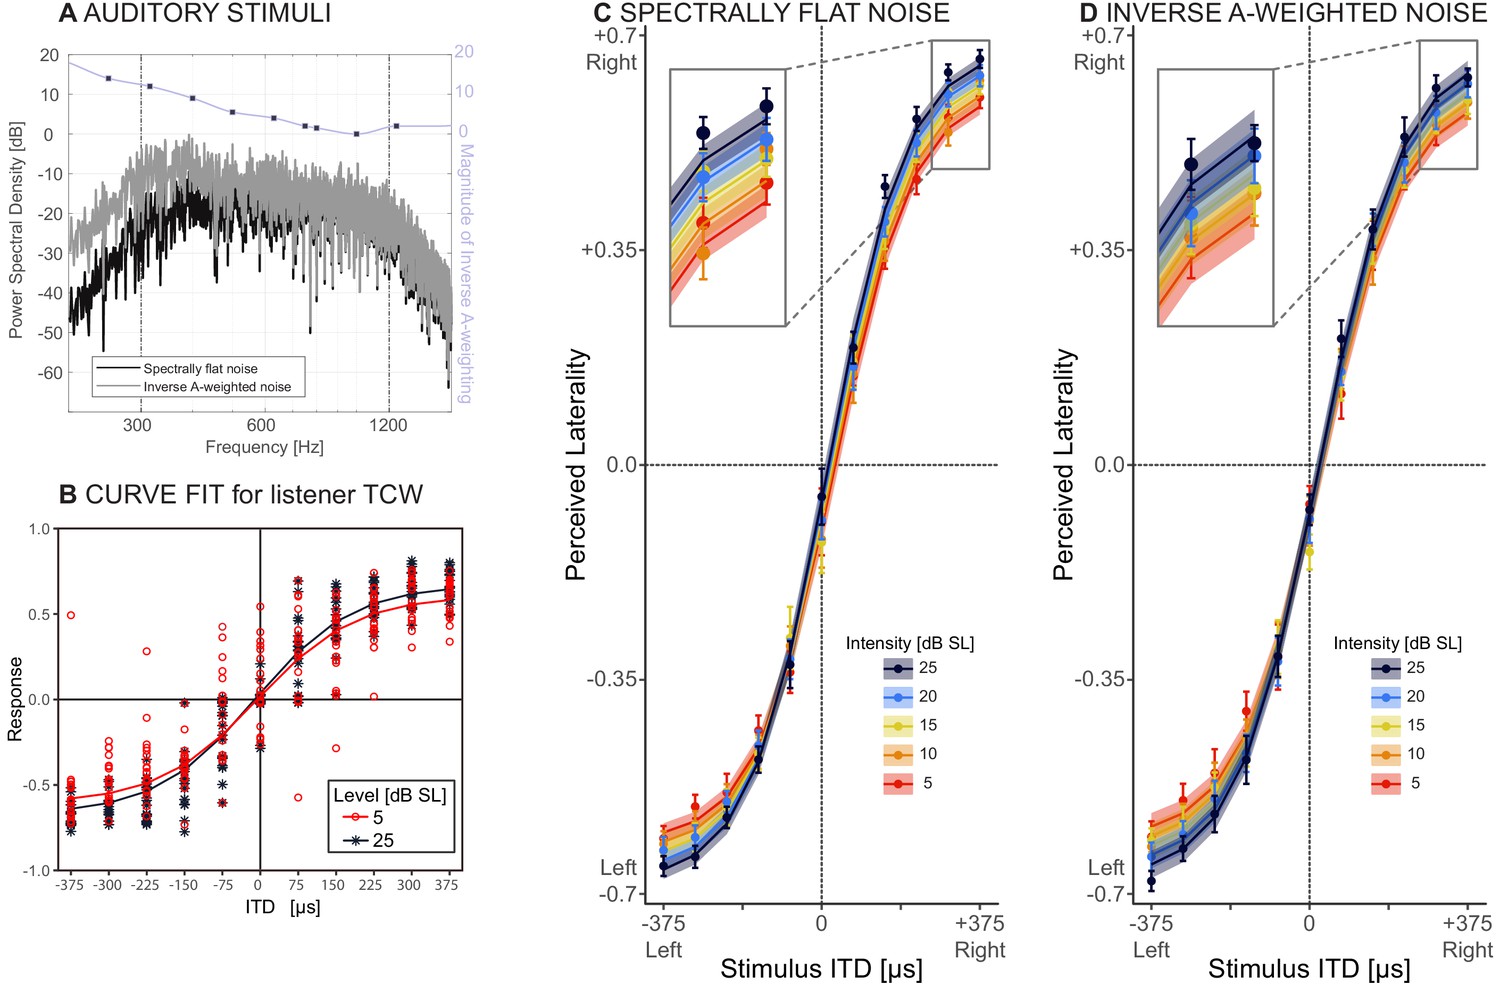
(A) Stimuli: spectrally flat noise, used in experiment 1 (dark grey) versus A-weighted noise, tested as a control for audibility in experiment 2 (light grey). The purple line shows the magnitude of the zero-phase inverse A-weighting filter. (B) Responses from one representative listener (TCW) across two sound intensities and the corresponding NLME fits for these data. (C and D) Perceived laterality as a function of ITD for C) spectrally flat noise (experiment 1) or D) A-weighted noise (experiment 2). Error bars, where large enough to be visible, show one standard error of the mean across listeners. Colors denote sound intensity. Insets illustrate magnified section of the plots. Circles show raw data, lines and ribbons show NLME fits and one standard of the mean.
Figure 3
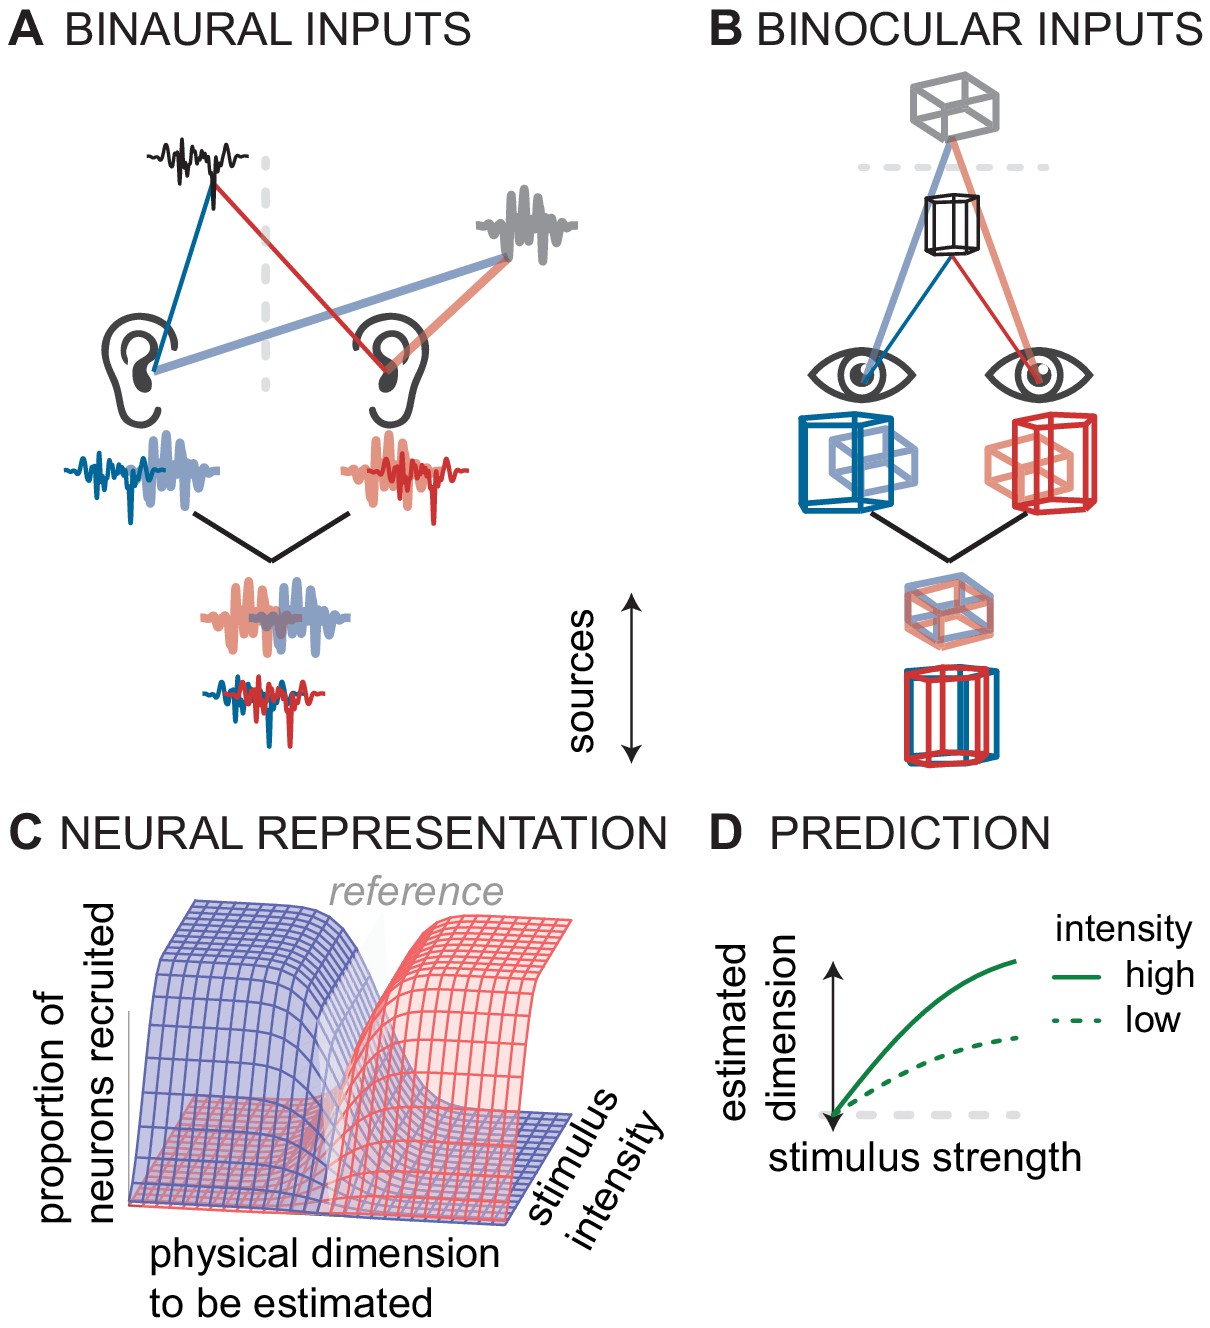
Conceptual model of canonical computation of location.
(A) Computing sound direction requires analysis of the binaural difference between the signals reaching the left and right ear. (B) Estimating visual depth hinges on analysis of the binocular disparity between the signals reaching left and right eye. (C) For both hearing and vision, the proportion of the neural population that is stimulated (in the inferior colliculus or V3) depends both on the physical dimension to be estimated (source laterality or source distance) and the intensity of the stimulus (sound intensity or visual contrast). For hearing and vision, ambiguity in this putative neural code predicts D) biased responses at low stimulus intensities (sound intensity or contrast).
Tables
Table 1
Results of Nonlinear Mixed Effects Model for flat-spectrum noise condition.
Note that Laterality:sound intensity refers to the NLME weight attributed to acoustic sound intensity of the auditory target. In contrast, Laterality:audibility captures the NLME weight attributed to pure tone audiometric thresholds based on the listeners’ perceptual abilities (see Materials and methods for details).
| Description | Value | Std.error | t-value | p-value | ||
|---|---|---|---|---|---|---|
| Intercept: ITD | 0.06 | 0.04 | 1.58 | 0.11 | ||
| Slope: ITD | 2.45 | 0.05 | 46.15 | <0.001 | *** | |
| Slope: sound intensity | 0.02 | 0.01 | 1.47 | 0.14 | ||
| Laterality: sound intensity | 0.05 | 0.01 | 7.59 | <0.001 | *** | |
| Laterality: audibility | 0.01 | 0.002 | 4.86 | <0.001 | *** |
-
10986 degrees of freedom.
Table 2
Results of Nonlinear Mixed Effects Model for inverse A-weighted noise condition.
https://doi.org/10.7554/eLife.47027.006| NLME weight | Value | Std.error | t-value | p-value | ||
|---|---|---|---|---|---|---|
| Intercept: ITD | −0.60 | 0.03 | −19.28 | <0.001 | *** | |
| Slope: ITD | 2.57 | 0.06 | 46.26 | <0.001 | *** | |
| Slope: sound intensity | 0.06 | 0.01 | 4.98 | <0.001 | *** | |
| Laterality: sound intensity | 0.04 | 0.01 | 7.10 | <0.001 | *** | |
| Laterality: audibility | 0.01 | 0.002 | 3.30 | <0.001 | *** |
-
10986 degrees of freedom.
Additional files
-
Transparent reporting form
- https://doi.org/10.7554/eLife.47027.008
Download links
A two-part list of links to download the article, or parts of the article, in various formats.
Downloads (link to download the article as PDF)
Open citations (links to open the citations from this article in various online reference manager services)
Cite this article (links to download the citations from this article in formats compatible with various reference manager tools)
Population rate-coding predicts correctly that human sound localization depends on sound intensity
eLife 8:e47027.
https://doi.org/10.7554/eLife.47027


