Transcriptome maps of general eukaryotic RNA degradation factors
- Max-Planck-Institute for Biophysical Chemistry, Germany
Figures
Figure 1 with 2 supplements
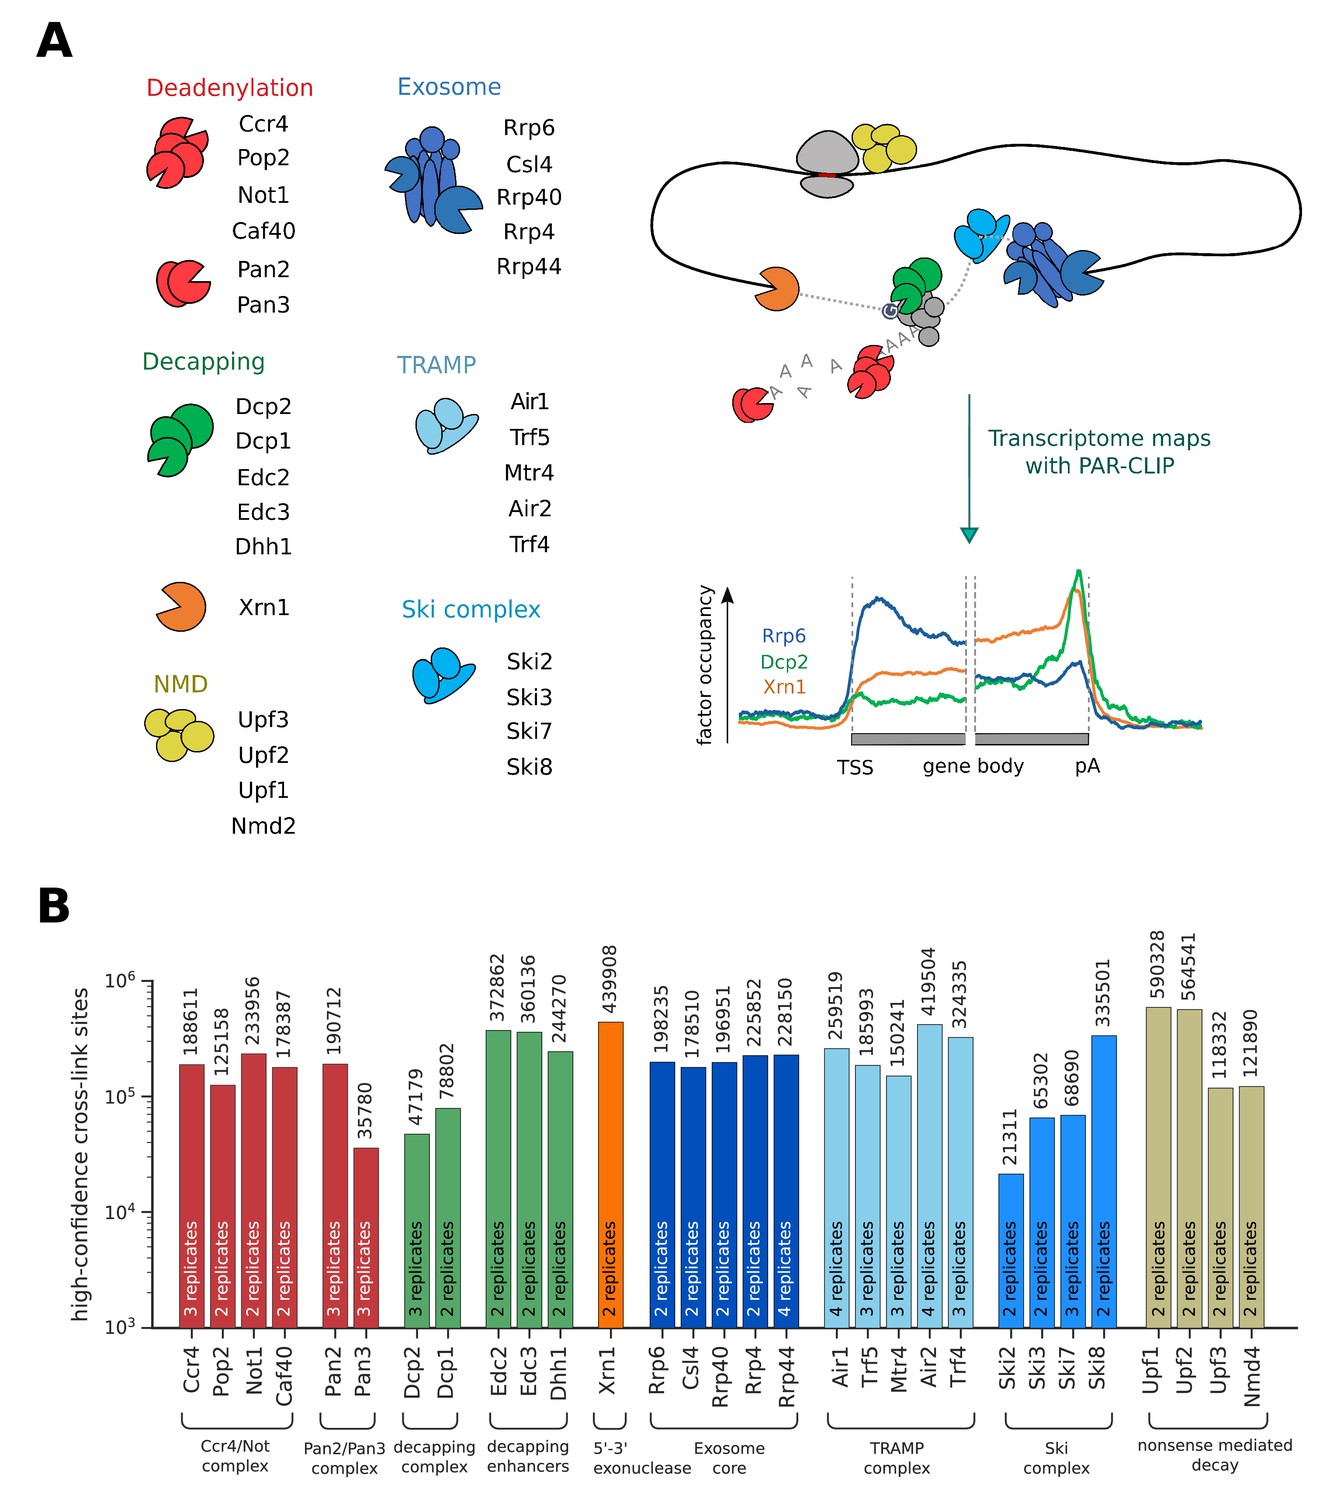
Overview of PAR-CLIP experiments performed in this study.
(A) Overview of degradation pathways studied. (B) Number of high-confidence PAR-CLIP cross-link sites obtained for each factor after merging data from replicates.
Figure 1—figure supplement 1

Biological replicate PAR-CLIP experiments have high correlation.
(A) Total transcript occupancy of factors in replicate experiments are plotted (in log2 space) and Spearman correlation values are shown for each pair. Each dot corresponds to a transcript. The color indicates dot density. (B) Comparison of coverage profiles obtained from CRAC experiments of Xrn1, Mtr4, Trf4, and Ski2 in S. cerevisiae (Tuck and Tollervey, 2013) with occupancy profiles from our PAR-CLIP experiments highlights reproducibility of transcriptome profiles across different methods. These profiles show the averaged binding of degradation factors over mRNAs (sense strand: left and anti-sense strand: right) in a window of [±700 nt] around their transcription start site (TSS) and their poly-adenylation (pA) site in a window of [±700 nt]. Regions that have neighboring transcripts on the same strand were removed to avoid contaminating profiles (Materials and methods).
Figure 1—figure supplement 2
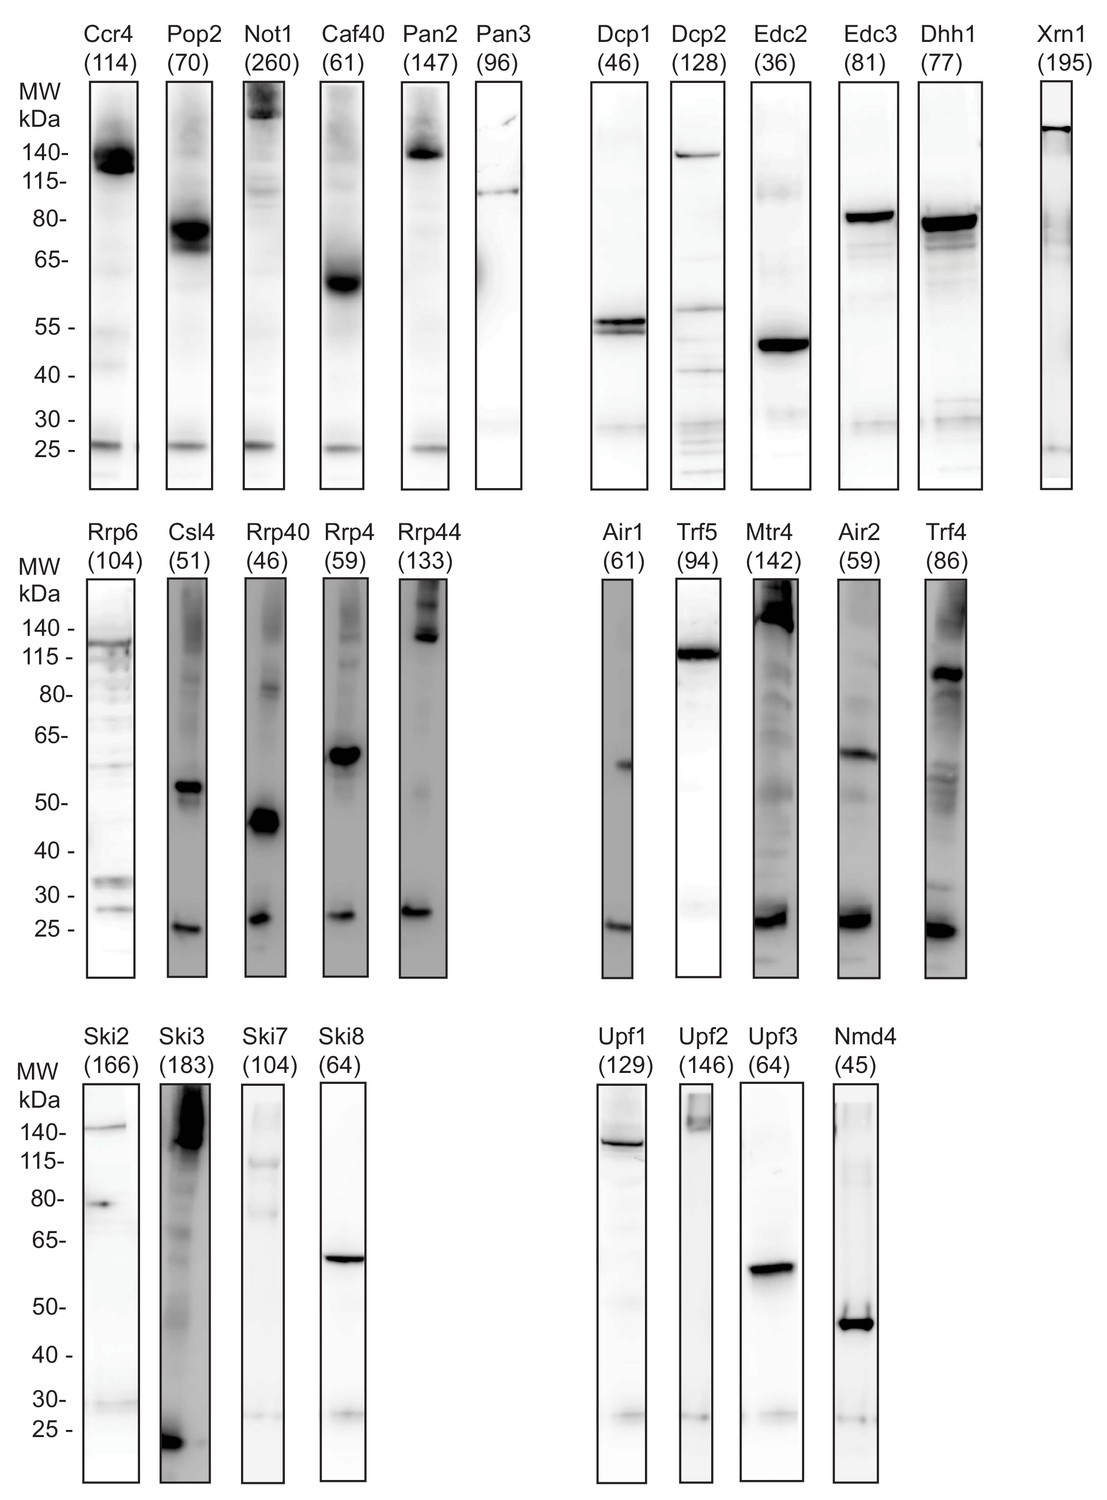
Western Blot analysis for all degradation factors analyzed in this study show IP efficiency.
IP using the TAP-tag is detected by Western Blot analysis with tag specific antibody to show the IP quality of the different PAR-CLIP experiments representative for one replicate per factor. The factors are sorted according to their complexes: deadenylation (Ccr4, Pop2, Not1, Caf40, Pan3, and Pan3), decapping (Dcp1, Dcp2, Edc2, Edc3, and Dhh1), 5´→3´ exonuclease (Xrn1), exosome (Rrp6, Csl4, Rrp40, Rrp4, and Rrp44), TRAMP (Air1, Trf5, Mtr4, Air2, and Trf4), Ski (Ski2, Ski3, Ski7, and Ski8), and NMD (Upf1, Upf2, Upf3, and Nmd4). The molecular weight including the weight of the TAP tag (in kDa) is indicated for each factor. The band at ~25 kDa is caused by cross-reactivity of the light chain of the used antibodies for IP and Western Blot. A shift to higher molecular weight than indicated can be caused by UV-crosslinking of proteins to RNA.
Figure 2 with 2 supplements
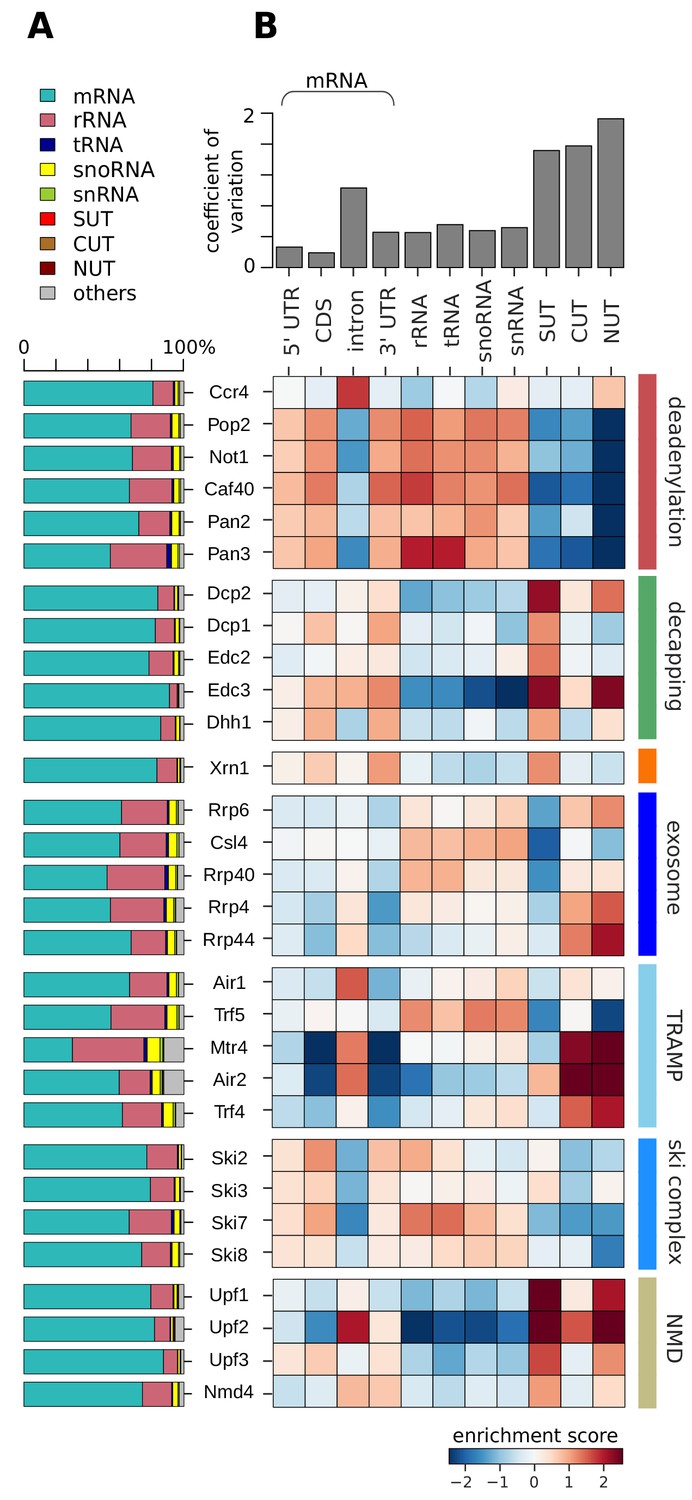
Distribution of degradation factor cross-link sites over the yeast transcriptome.
(A) Fractions of high confidence PAR-CLIP sequencing reads of 30 yeast degradation factors fall into various transcript classes. Depicted classes are the following: messenger RNA (mRNA) in turquoise (n = 4,928), ribosomal RNA (rRNA) in antique pink (n = 24), transfer RNA (tRNA) in dark blue (n = 299), small nucleolar RNA (snoRNA) in yellow (n = 77), small nuclear RNA (snRNA) in green (n = 6), stable unannotated transcripts (SUTs) in red (n = 318), cryptic unstable transcripts (CUTs) in light brown (n = 637), Nrd1-unterminated transcripts (NUTs) in dark brown (n = 298)(Materials and methods). (B) Enrichment z-scores of high confidence PAR-CLIP cross-link sites of 30 yeast degradation factors (rows) in various segments of mRNA transcripts (left columns; UTR: untranslated region; intron; CDS: coding sequence), or other transcript classes as in A (other columns). The color-coded enrichment score shows the column and row normalized enrichment values of binding preferences of each factor for each transcript class (color encoded, depleted in blue and enriched in red). The coefficient of variation on top is the standard deviation divided by the mean for each transcript class.
Figure 2—figure supplement 1

Metagene profiles for subunits of the TRAMP complexes on snoRNA genes.
Transcript averaged PAR-CLIP occupancy profiles are shown for Air1, Trf5, Mtr4, Air2, and Trf4. snoRNA genes are aligned either at their 5´ end or at their 3´ end (n = 77). Occupancy profiles are shown over the range of ±50 nt.
Figure 2—figure supplement 2
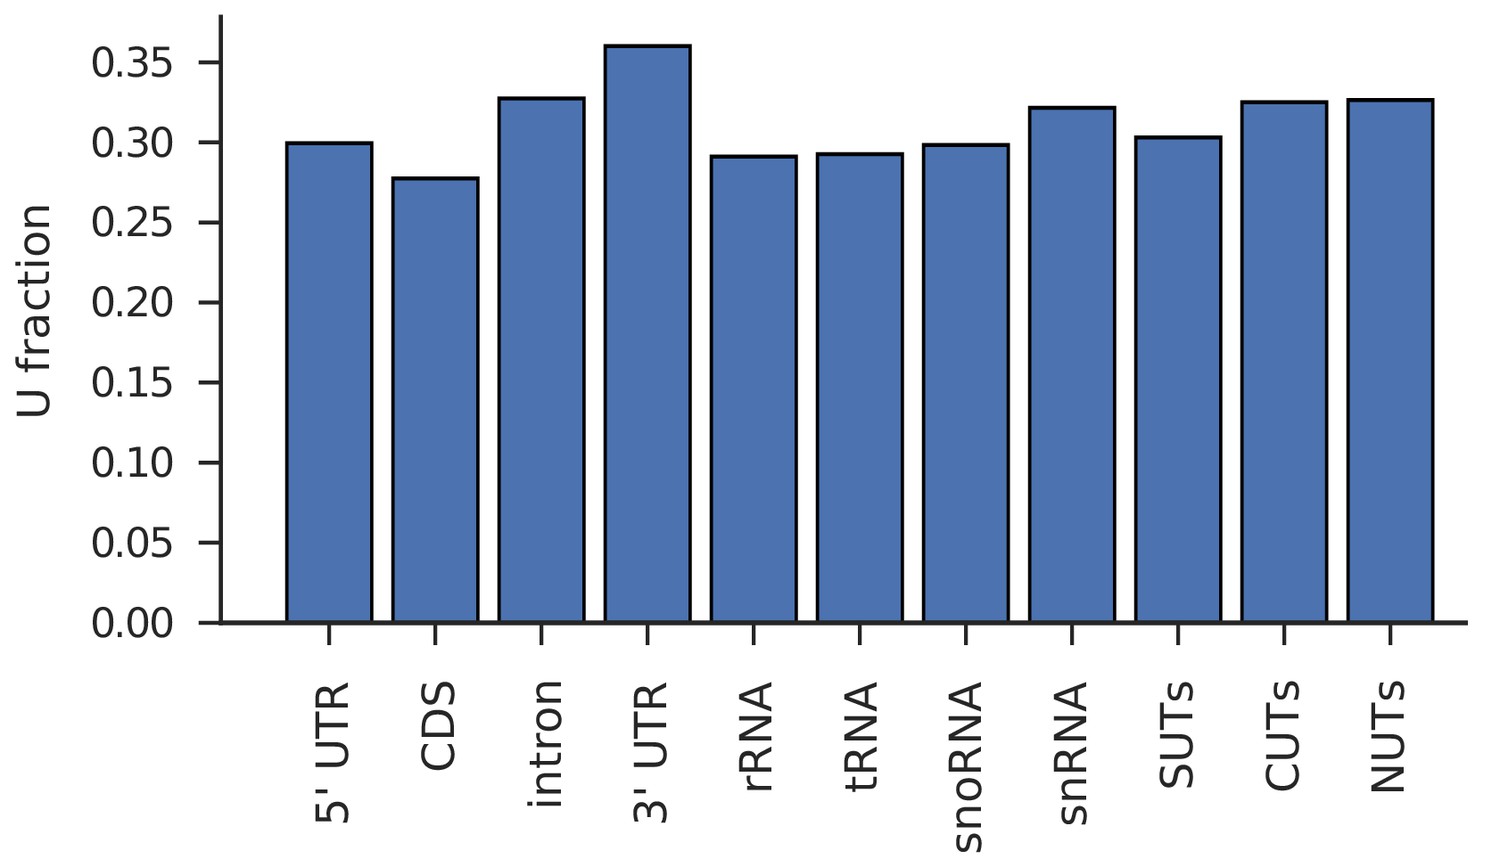
Different transcript classes have comparable U-content.
Fraction of U over all bases in transcript classes studied in Figure 2 (untranslated region (UTR); intron; coding sequence (CDS), ribosomal RNA (rRNA), transfer RNA (tRNA), small nucleolar RNA (snoRNA), small nuclear RNA (snRNA), stable unannotated transcripts (SUTs), cryptic unstable transcripts (CUTs), Nrd1- unterminated transcripts (NUTs)).
Figure 3 with 3 supplements

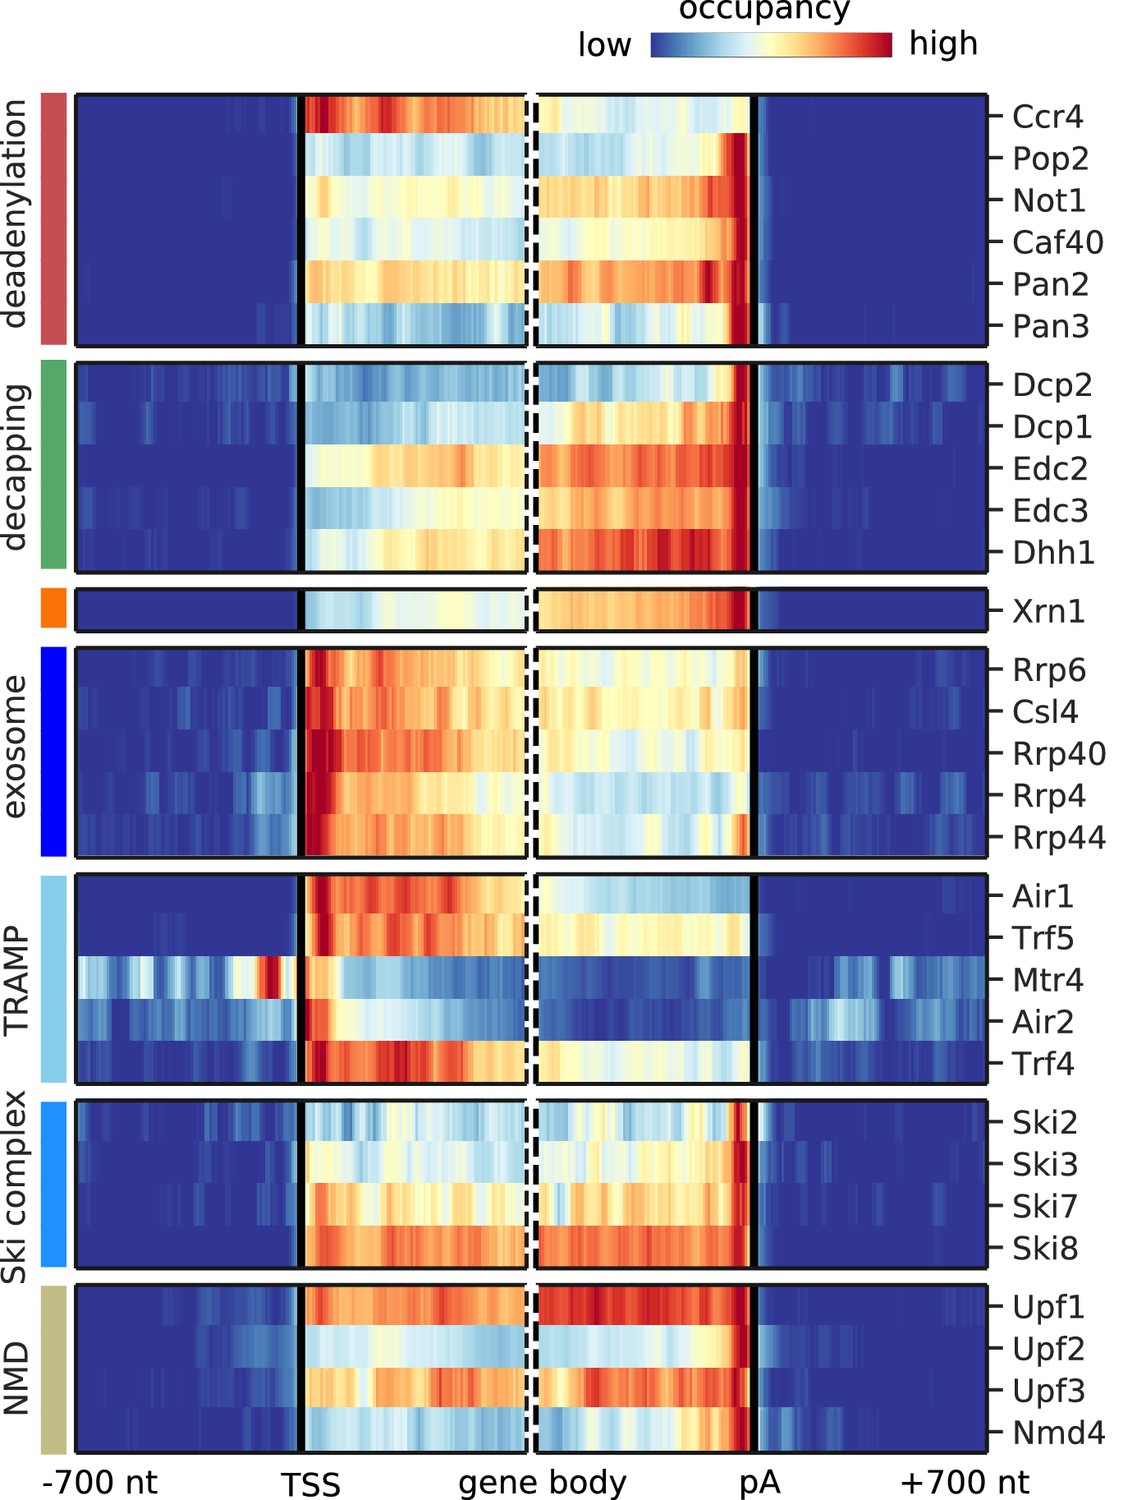
Metagene analysis of degradation factor binding on mRNAs.
Averaged occupancy profiles of degradation factors over mRNAs aligned around their transcription start site (TSS) (n = 3,193, left) and around their poly-adenylation (pA) site (n = 3,193, right) in a window of [±700 nt]. Regions that have neighboring transcripts on the same strand were removed to avoid contaminating profiles (Materials and methods). Factors are grouped according to their functional role; from top to bottom: deadenylation, decapping, Xrn1, exosome, TRAMP complex, Ski complex, or NMD. The color code shows the average occupancy normalized between the minimum (blue) and maximum (red) values per profile.
Figure 3—figure supplement 1

Metagene profiles of yeast RNA degradation factors centered on translation start and stop sites in comparison to TIF-annotated TSS and pA sites.
Transcript-averaged PAR-CLIP occupancy profiles are shown for RNA degradation factors involved in (A) deadenylation, (B) decapping, (C) 5´→3´ exonuclease Xrn1, (D) exosome, (E) TRAMP, (F) Ski, and (G) NMD. Transcripts are aligned either at transcript start site (TSS) and poly-adenylation (pA) site (marked with blue) or at their start and stop codons (marked with green). TIF-seq based annotation is shown in blue (n = 3193 for TSS and pA site profiles) (Pelechano et al., 2013). Open reading frames (ORF) annotated in the SGD (version 64.2.1) are shown in green (n = 4012 for TSS, and n = 3965 for pA site selected transcripts). To avoid contaminating signals from neighboring genes, we filtered out regions that had annotations upstream and downstream of the centered gene (up to 700 nt) (Materials and methods). Shaded areas (in blue TIF-seq annotation, or in green for ORF annotation) depict 95% confidence intervals derived from bootstrapping genes. Comparison between these two profiles highlights preferences for end binding degradation factors in binding to untranslated regions at the two sides of the transcript.
Figure 3—figure supplement 2
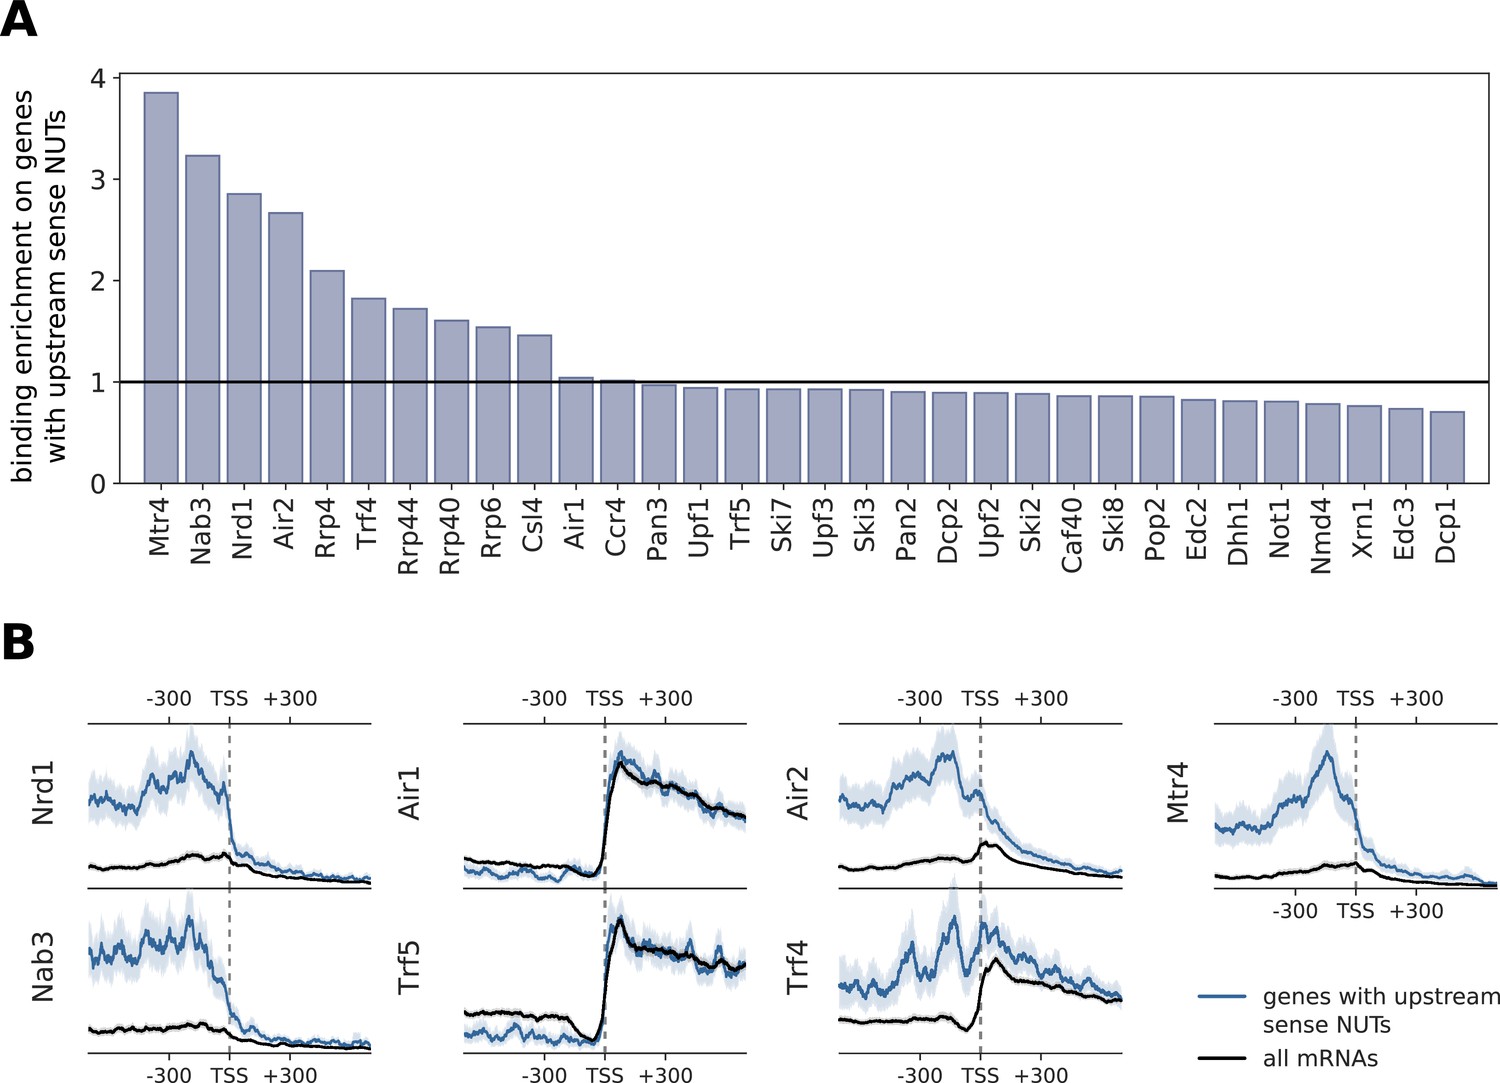
Comparison of binding profiles on genes containing annotated upstream sense NUTs with all mRNAs.
(A) Binding enrichment of degradation factors around the TSS of genes with an upstream sense NUT. Enrichment is defined as the ratio of the average occupancy in the interval [±300 nt] of the TSS on these genes that contain an upstream NUT (n = 459) (Schulz et al., 2013) divided by the average occupancy on all genes. (B) Transcript-averaged PAR-CLIP occupancy profiles for all mRNAs (black) is compared to patterns derived from genes with upstream sense NUTs (blue). Transcripts were aligned at their TSS and averaged over the interval of [±600 nt]. We compared Nrd1 and Nab3 profiles, known to process NUTs, with subunits of the TRAMP complex. 95% confidence intervals obtained from bootstrapping genes are shown with gray and blue shades.
Figure 3—figure supplement 3
Metagene analysis of degradation factor binding on mRNAs after removing signals from known NUTs and CUTs.
Cross-link sites were filtered to exclude regions that were previously annotated as NUTs and CUTs (Neil et al., 2009; Schulz et al., 2013). Averaged occupancy profiles of degradation factors are then shown over mRNAs aligned around their transcription start site (TSS) (n = 3,193, left) and around their poly-adenylation (pA) site (n = 3,193, right) in a window of [±700 nt]. Regions that have neighboring transcripts on the same strand were removed to avoid contaminating profiles (Materials and methods). Factors are grouped according to their functional role; from top to bottom: deadenylation, decapping, Xrn1, exosome, TRAMP complex, Ski complex, or NMD. The color code shows the average occupancy normalized between the minimum (blue) and maximum (red) values per profile.
Figure 4 with 2 supplements
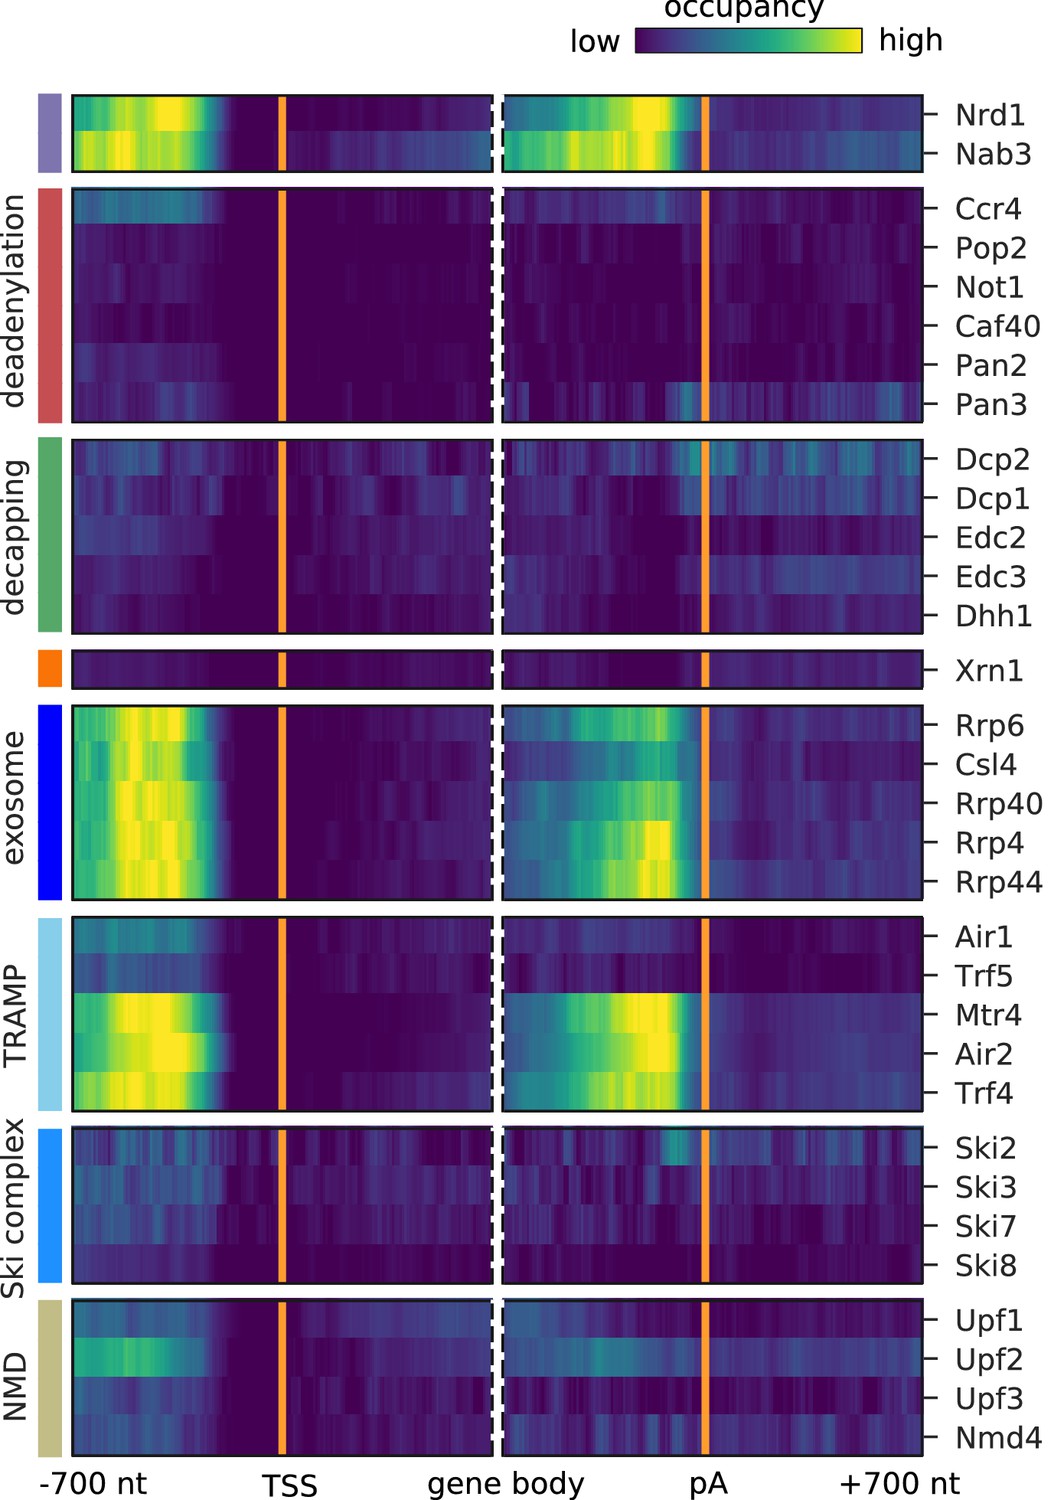
Surveillance of aberrant nuclear antisense RNAs by the exosome and the TRAMP4 complex.
Averaged occupancy profiles of degradation factors binding to transcripts antisense of mRNAs aligned around transcription start site (TSS) (n = 3,076, left) and around their poly-adenylation (pA) site (n = 2,705, right) in a window of [±700 nt]. Regions with annotated genes on the antisense strand are removed to avoid contaminating the profiles (Materials and methods). The color code shows the average occupancy normalized between the minimum (blue) and maximum (yellow) values per profile. On top, previously published PAR-CLIP profiles for Nrd1 and Nab3 are included for comparison (Schulz et al., 2013).
Figure 4—figure supplement 1

Motif enrichment analysis shows enrichment of Nrd1/Nab3 motifs for the TRAMP4 and the exosome complex.
Motif analysis was performed for all degradation factors in this study. Nrd1 and Nab3 are included for comparison (Schulz et al., 2013). Occurrences of Nrd1 motif (GTAG) and Nab3 motif (CTTG) are highlighted with red. The color code shows the log2 enrichment factor of top five enriched and top 3 depleted 4-mers around PAR-CLIP cross-link sites [±8 nt]. Dark red represents strong enrichment and dark blue shows strong depletion of a 4-mer. Infeasible combinations are shown with gray.
Figure 4—figure supplement 2

The aberrant nuclear ncRNAs bound by components of the exosome and the TRAMP4 complex are primarily NUTs and CUTs.
Cross-link sites were filtered to exclude regions that were previously annotated as NUTs and CUTs (Neil et al., 2009; Schulz et al., 2013). Averaged occupancy profiles of degradation factors are shown on transcripts antisense of mRNAs aligned around the transcription start site (TSS) (n = 3,076, left) and around their poly-adenylation (pA) site (n = 2,705, right) in a window of [±700 nt]. Regions with annotated genes on the antisense strand are removed to avoid contaminating the profiles (Materials and methods). The color code shows the average occupancy normalized between the minimum (blue) and maximum (yellow) values per profile. On top, previously published PAR-CLIP profiles for Nrd1 and Nab3 are included for comparison (Schulz et al., 2013).
Figure 5 with 3 supplements
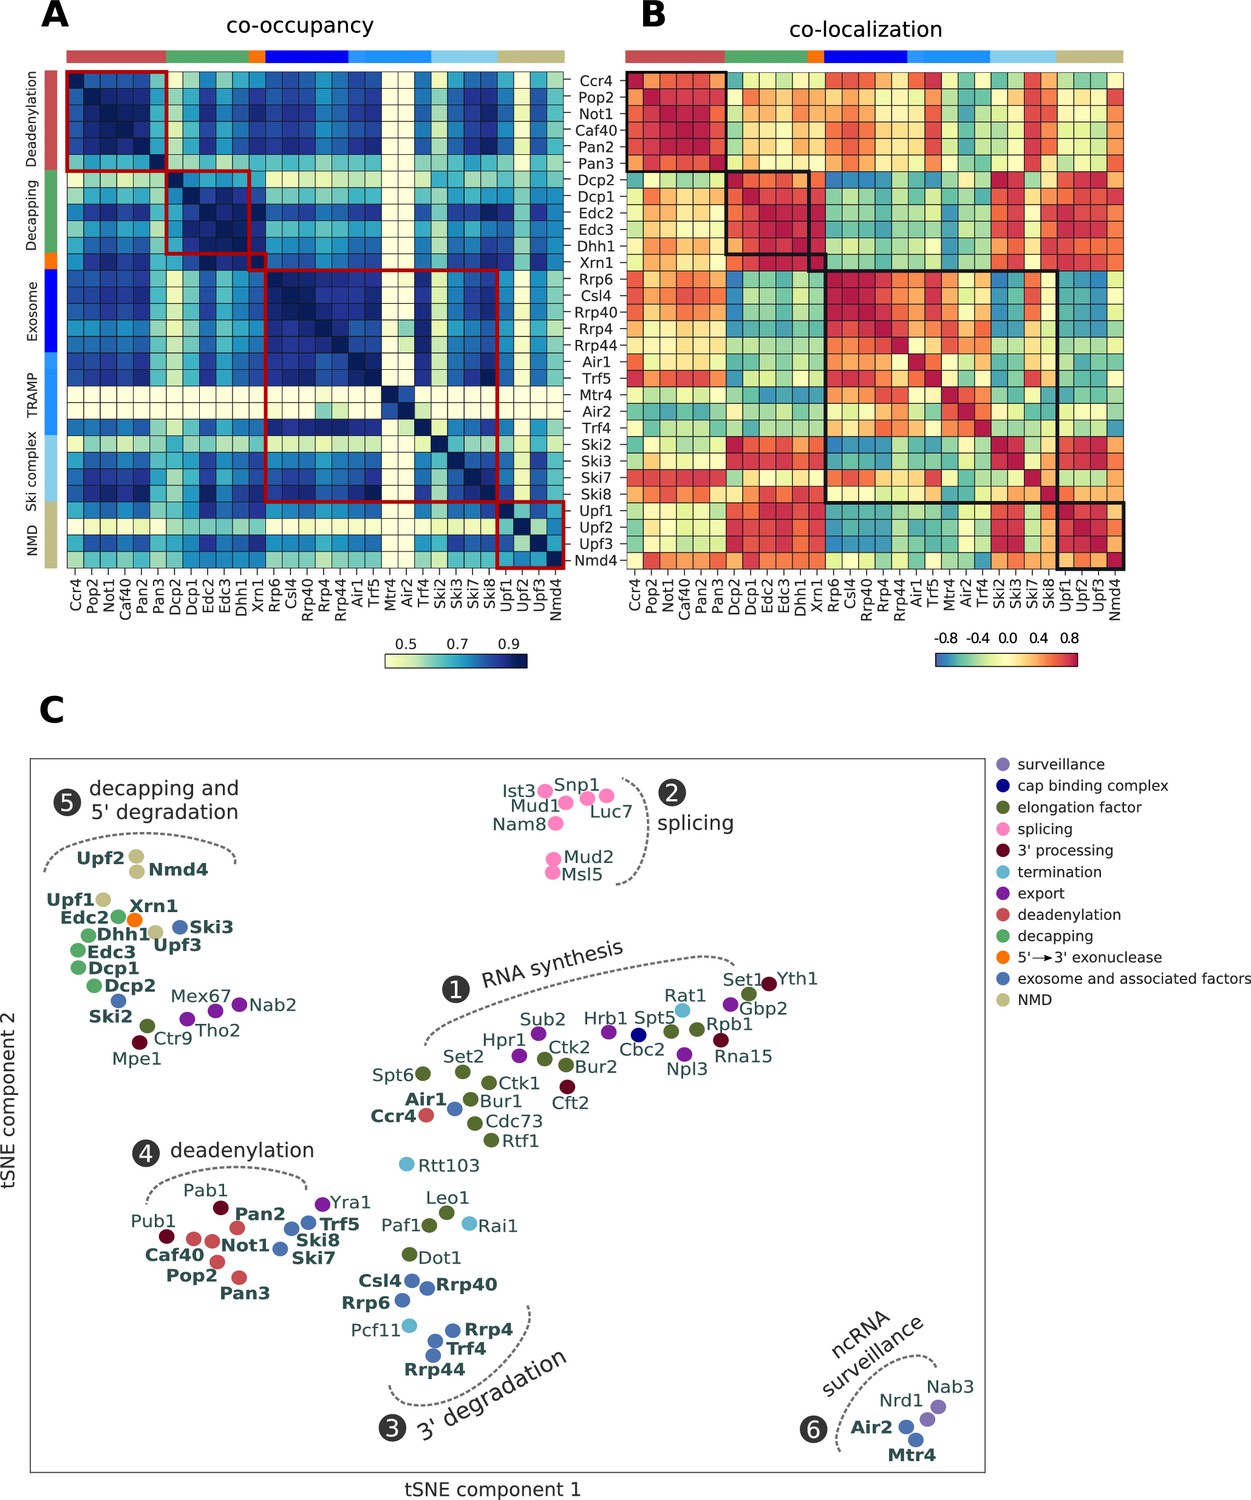
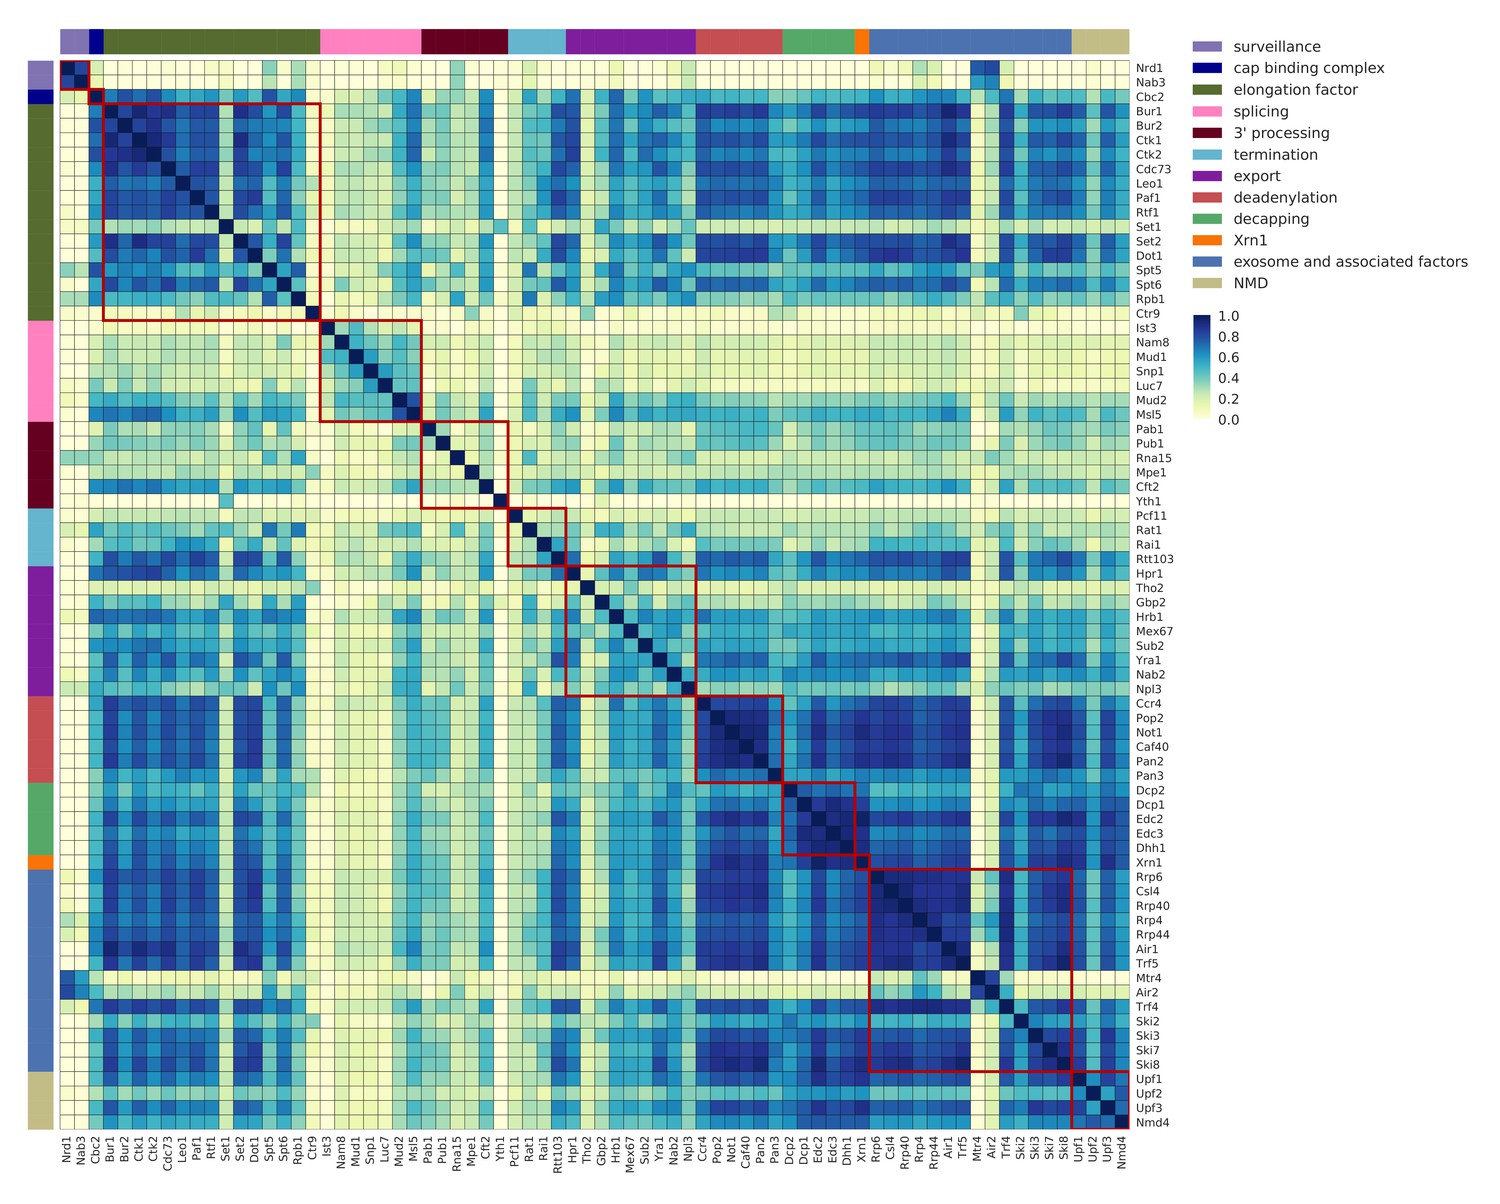
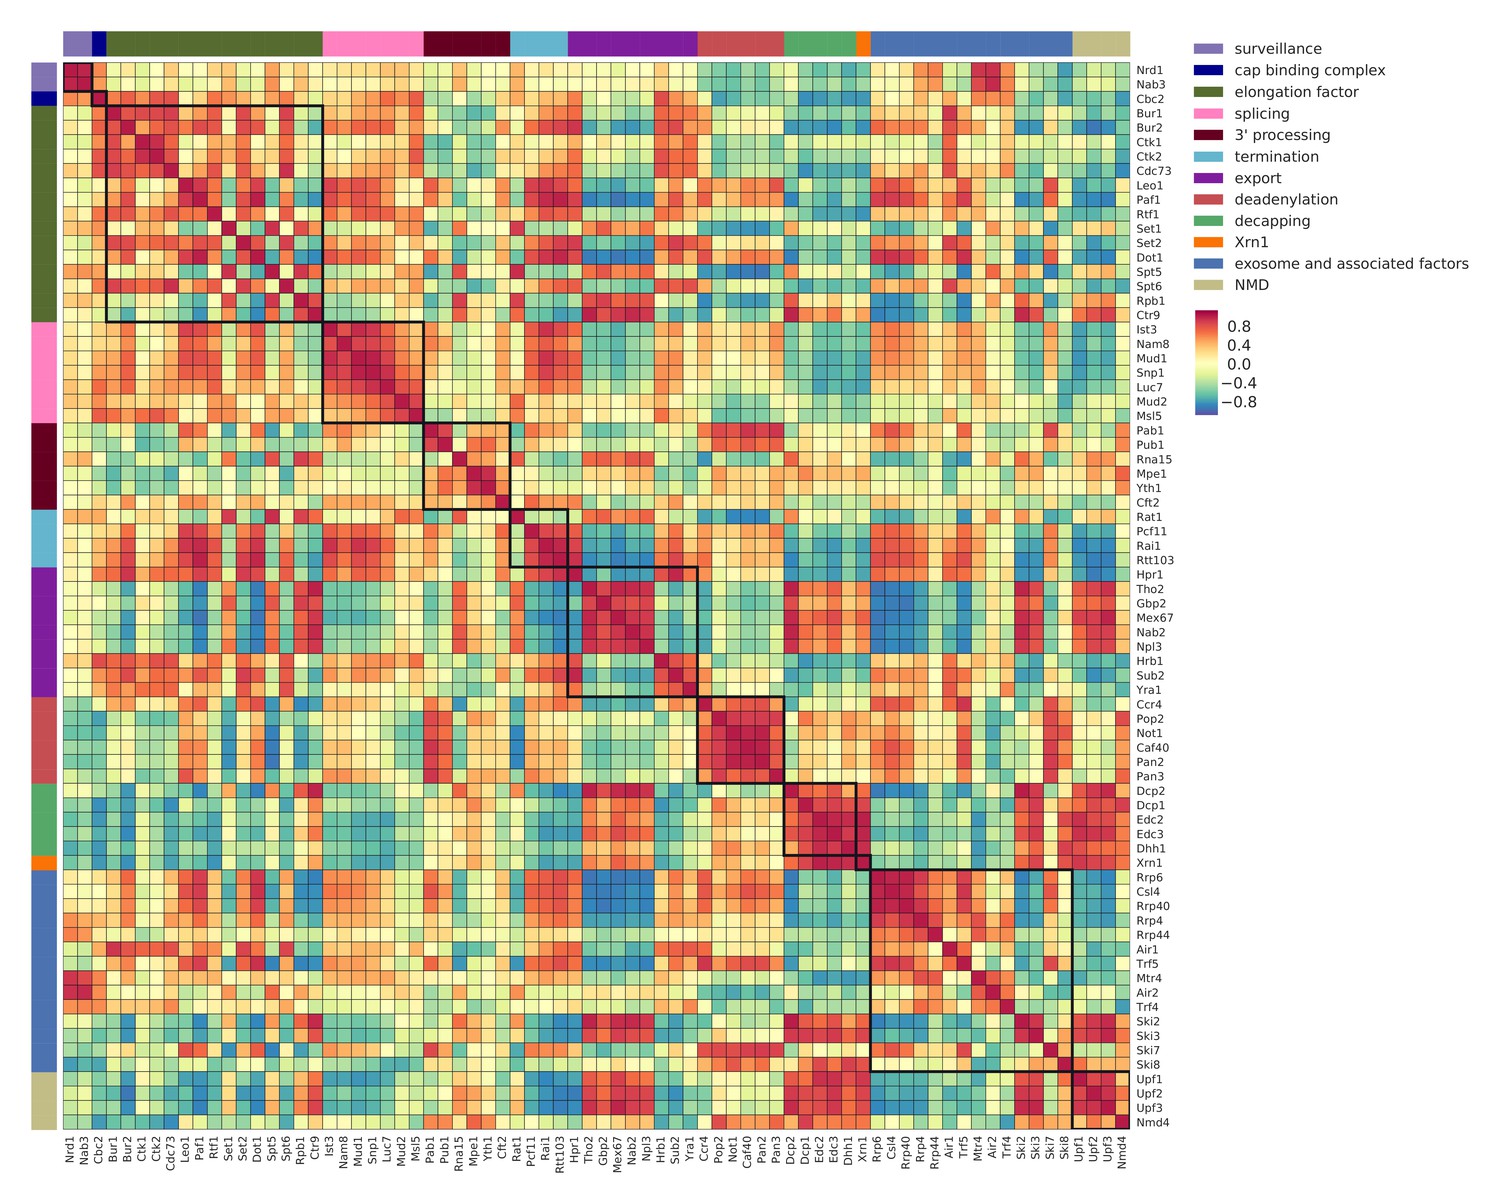
Global co-occupancy and co-localization analysis reveals unexpected cooperation between factors from different complexes and pathways.
(A) Matrix of pairwise correlation coefficients of factor occupancies evaluated over all transcripts. (B) Matrix of co-localization based on the enrichment of factor x binding within 40 nt of the cross-link site of factor x´ (Materials and methods). (C) Two-dimensional embedding of the co-occupancies in (A) analyzed for 74 RNA processing factors with tSNE, including 30 factors from this study (highlighted in bold), and 44 factors from previous studies (Baejen et al., 2017; Baejen et al., 2014; Battaglia et al., 2017; Schulz et al., 2013) (Supplementary file 1). Factors that are plotted in close proximity show a preference for binding to the same transcripts. Clusters present factors involved in RNA synthesis (1), splicing (2), 3´ processing (3), deadenylation (4), decapping (5), nuclear ncRNA processing (6), and surveillance (7).
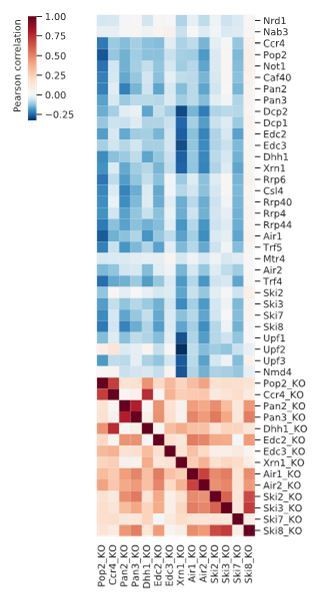
Figure 5—figure supplement 1
Co-occupancy for 74 RNA processing factors.
Matrix of pairwise correlation coefficients of factor occupancies evaluated over all transcripts. Analysis for 74 RNA processing factors, including 30 factors from this study, and 44 factors from previous studies (Baejen et al., 2017; Baejen et al., 2014; Battaglia et al., 2017; Schulz et al., 2013) (see Supplementary file 1). Dark blue represents high correlation in binding across all transcripts. Factors are sorted and color coded (left and upper border) according to their general function.
Figure 5—figure supplement 2
Co-localization coefficients for all 74 RNA processing factors.
Pairwise correlation between normalized co-localization profiles of factors in a window of 40 nt centered at PAR-CLIP cross-link sites. Analysis for 74 RNA processing factors, including 30 factors from this study, and 44 factors from previous studies (Baejen et al., 2017; Baejen et al., 2014; Battaglia et al., 2017; Schulz et al., 2013) (see Supplementary file 1). High co-localization represents binding to the same position on transcripts (marked with dark red). Factors are sorted and color coded (left and upper border) according to their general function.
Figure 5—figure supplement 3
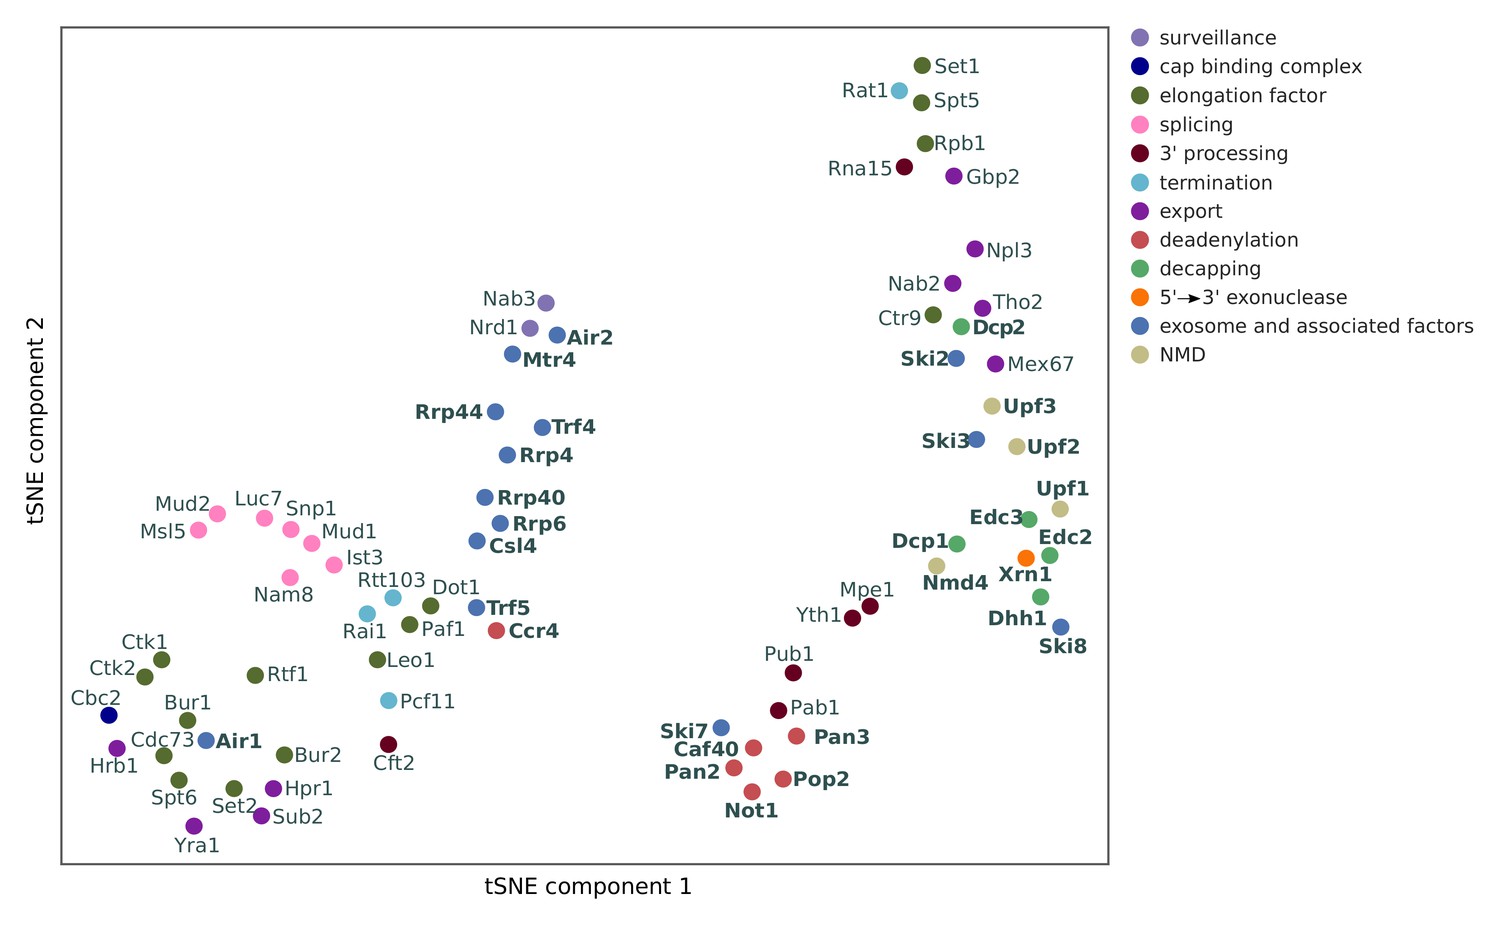
Two-dimensional embedding of co-localization between 74 RNA processing factors.
tSNE plot visualizes similarities in co-localization profiles between RNA processing factors (factors are color-coded based on their function). Analysis for 74 RNA processing factors, including 30 factors from this study (marked in bold), and 44 factors from previous studies (Baejen et al., 2017; Baejen et al., 2014; Battaglia et al., 2017; Schulz et al., 2013) (see Supplementary file 1).
Figure 6 with 9 supplements
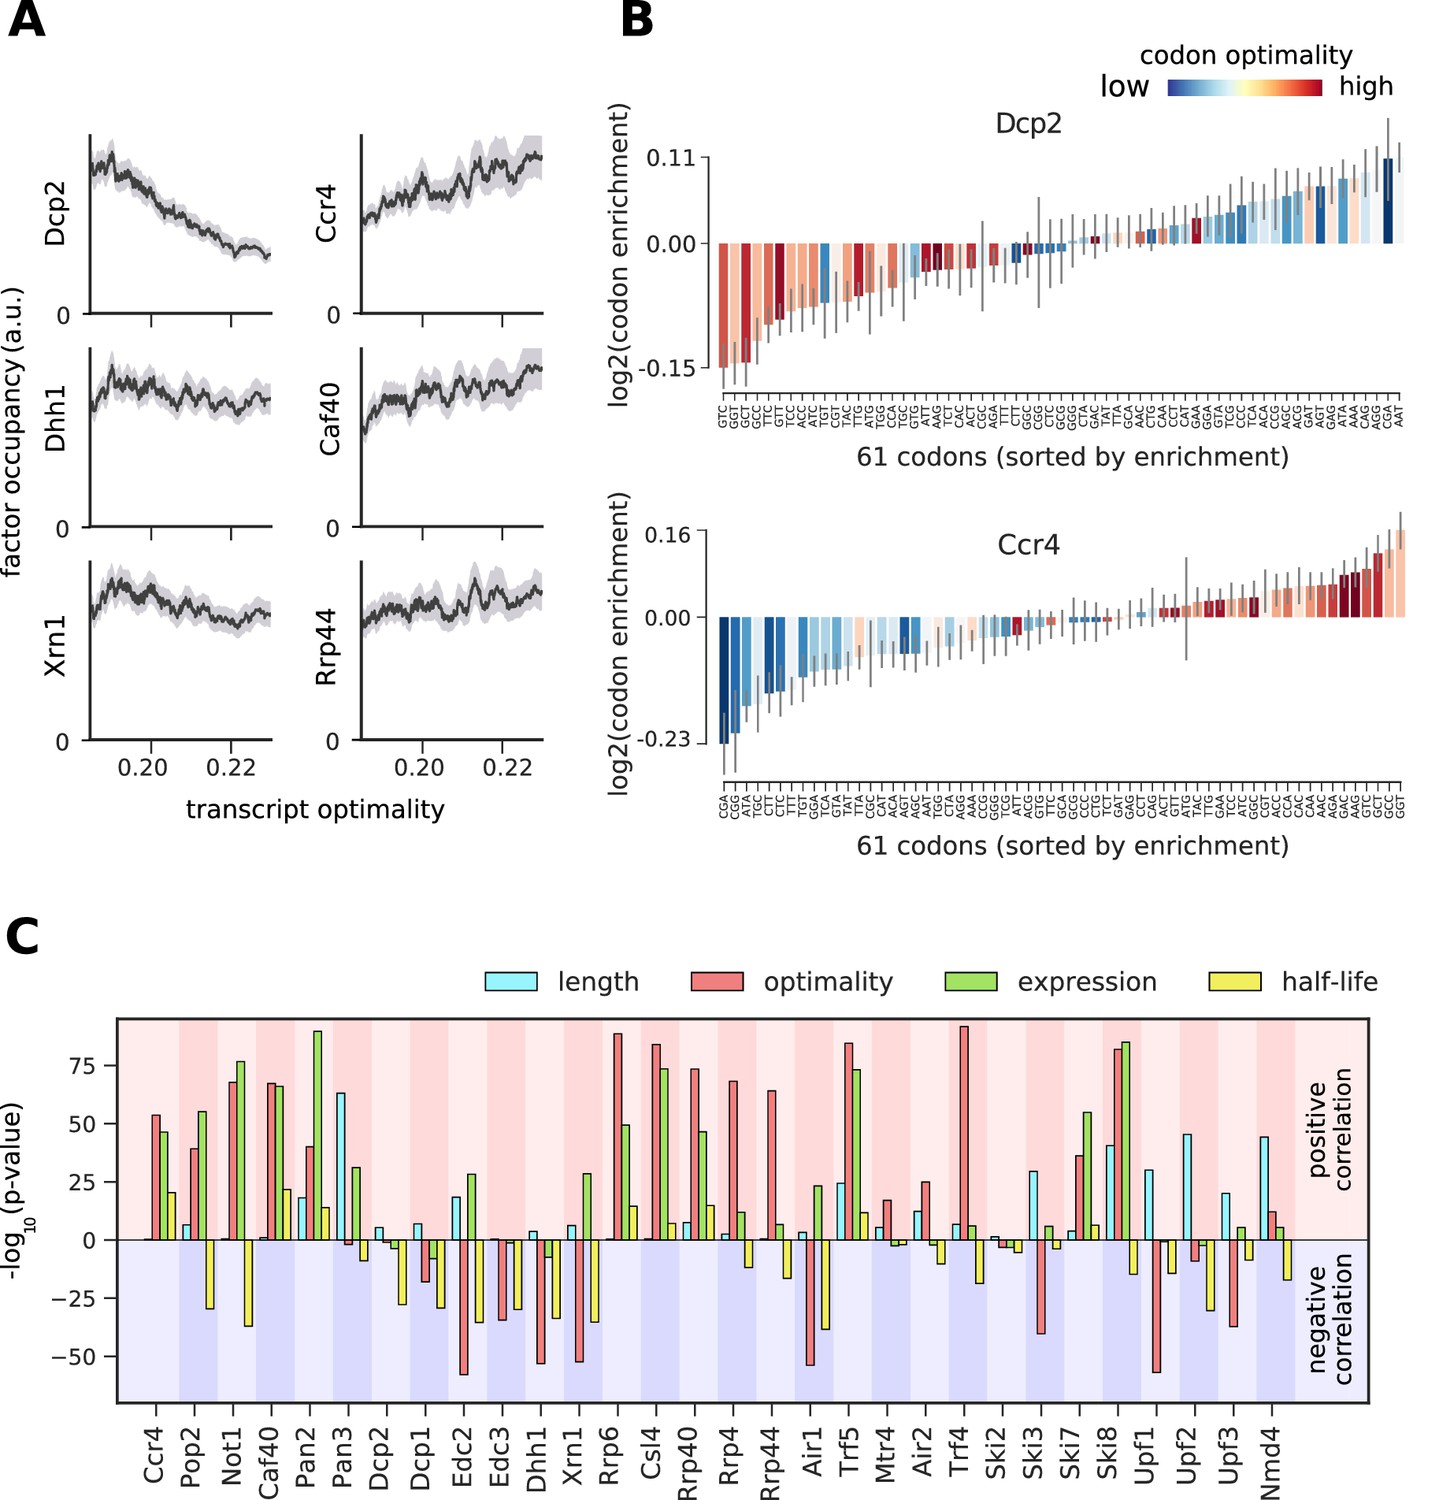
Binding preferences reveal a link between decapping-mediated degradation and translation.
(A) Total occupancy per mRNA (according to TIF-seq annotation) for six factors as a function of the average mRNA codon optimality (transcript optimality). The occupancy of factors from the 5´→3´ degradation machinery (decapping and Xrn1, left) decreases with increasing transcript optimality, whereas the occupancy of factors from the 3´→5´ degradation machinery (Ccr4 and Caf40 deadenylation complex subunits and exosome subunit Rrp44, right) increases with increasing average codon optimality. (Gray shading: 95% confidence intervals generated by bootstrapping mRNAs). (B) Codon enrichment in transcripts bound by Dcp2 and Ccr4 compared to the average frequency over all mRNAs. The bar colors represent codon optimality, with highly optimal codons shown in dark red. (Thin gray lines: 90% confidence intervals generated by bootstrapping coding sequences.) (C) Significance of correlations between the binding strength of degradation factors and transcript length, transcript optimality (Pechmann and Frydman, 2013), expression level (Baejen et al., 2017), and half-life derived by multivariate linear regression analysis (Materials and methods). Bars are separated according to the direction of correlation with positive correlation marked by a red background and negative correlation marked by a blue background.
Figure 6—figure supplement 1
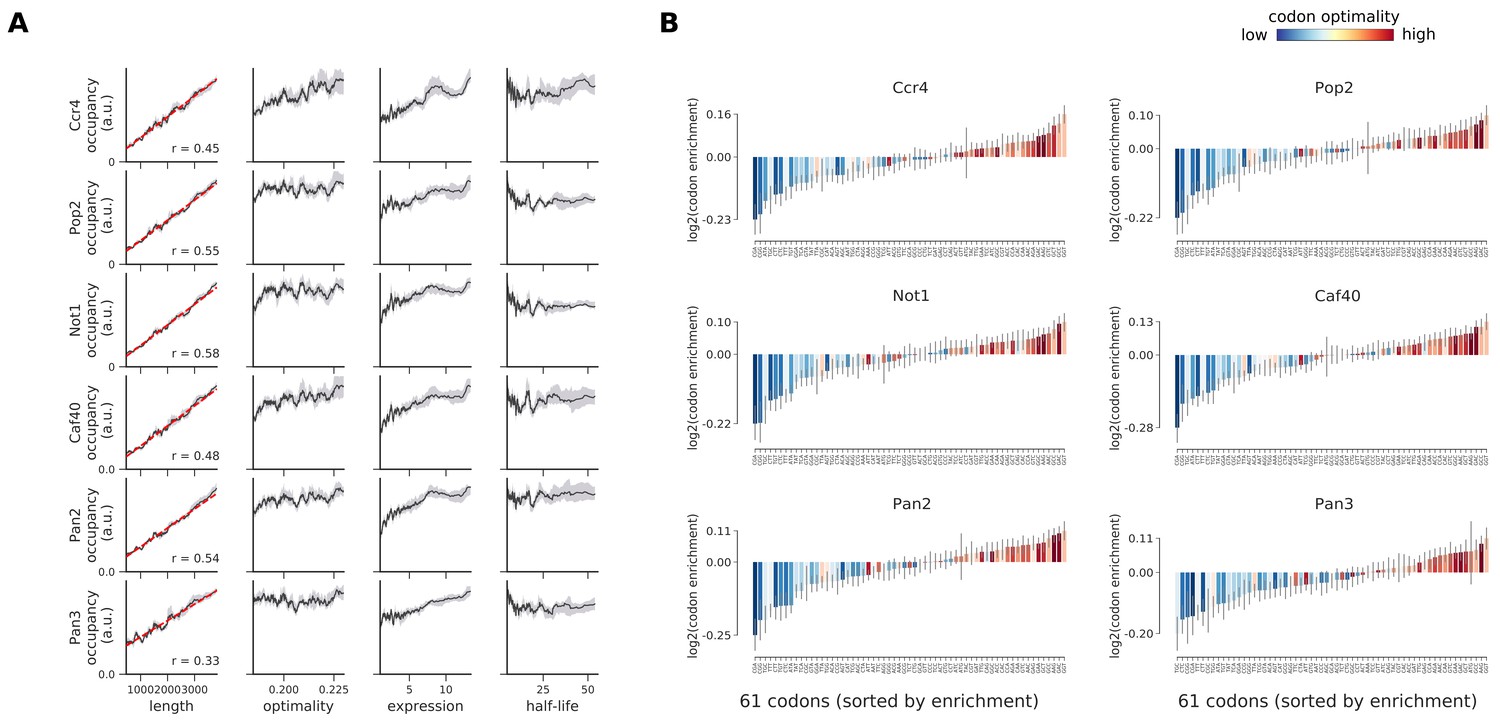
Occupancies of deadenylation factors (Ccr4, Pop2, Not1, Caf40, Pan2, and Pan3) compared to transcript length, optimality, expression level, and half-life.
(A) To understand binding specificity of deadenylation factors, the total occupancy of each factor on a transcript is plotted against various transcript features (Gray shading: 95% confidence intervals generated by bootstrapping transcripts). (B) Same analysis as in Figure 6B: Codon enrichment shows deviations in codon frequencies of transcripts bound by a degradation factor compared to each codon’s frequency on all coding sequences. Each bar is colored according to its codon-optimality with highly optimal codons in dark red and highly non-optimal codons in dark blue. (Gray lines: 90% confidence intervals generated by bootstrapping coding sequences).
Figure 6—figure supplement 2
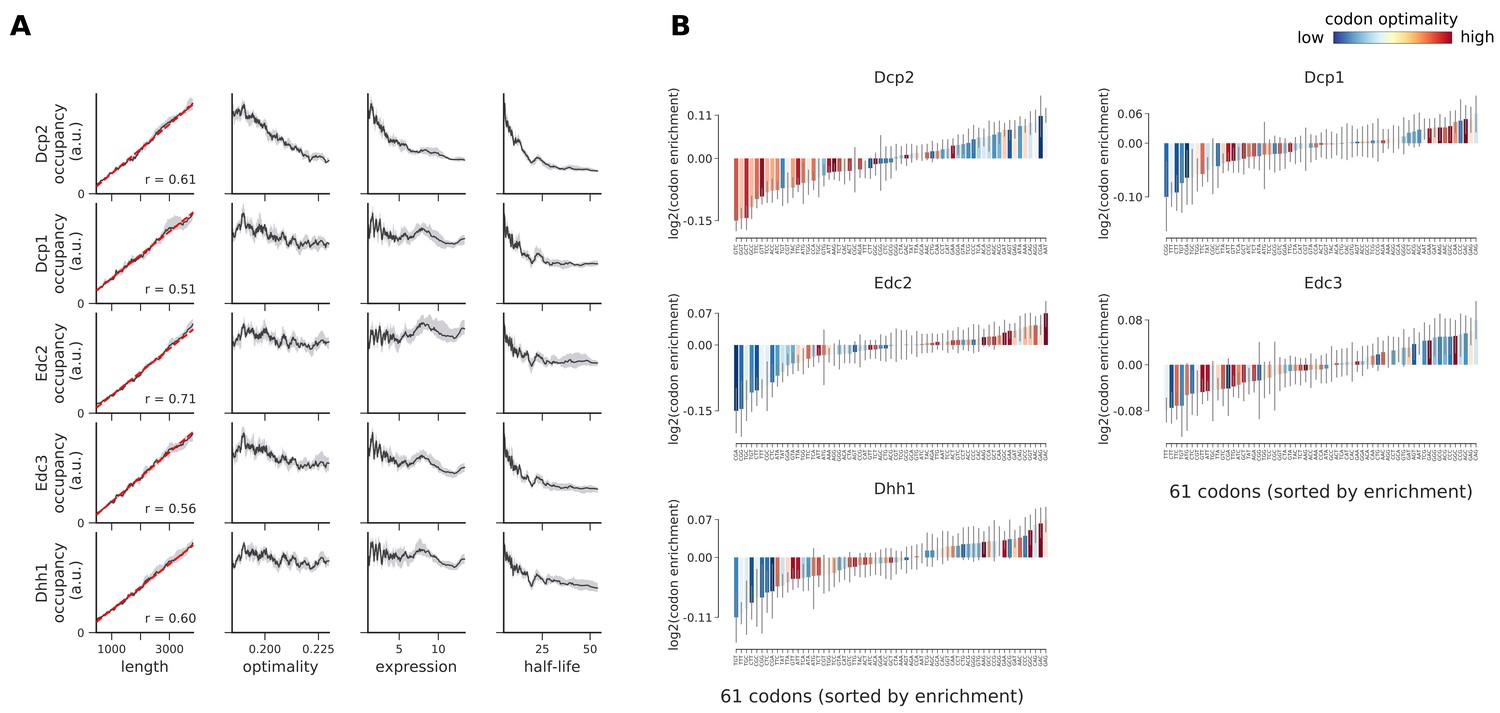
Occupancies of decapping factors (Dcp2, Dcp1, Edc2, Edc3, and Dhh1) compared to transcript length, optimality, expression level, and half-life.
(A) To understand binding specificity of decapping factors, the total occupancy of each factor on a transcript is plotted against various transcript features (Gray shading: 95% confidence intervals generated by bootstrapping transcripts). (B) Same analysis as in Figure 6B: Codon enrichment shows deviations in codon frequencies of transcripts bound by a degradation factor compared to each codon’s frequency on all coding sequences. Each bar is colored according to its codon-optimality with highly optimal codons in dark red and highly non-optimal codons in dark blue. (Gray lines: 90% confidence intervals generated by bootstrapping coding sequences).
Figure 6—figure supplement 3
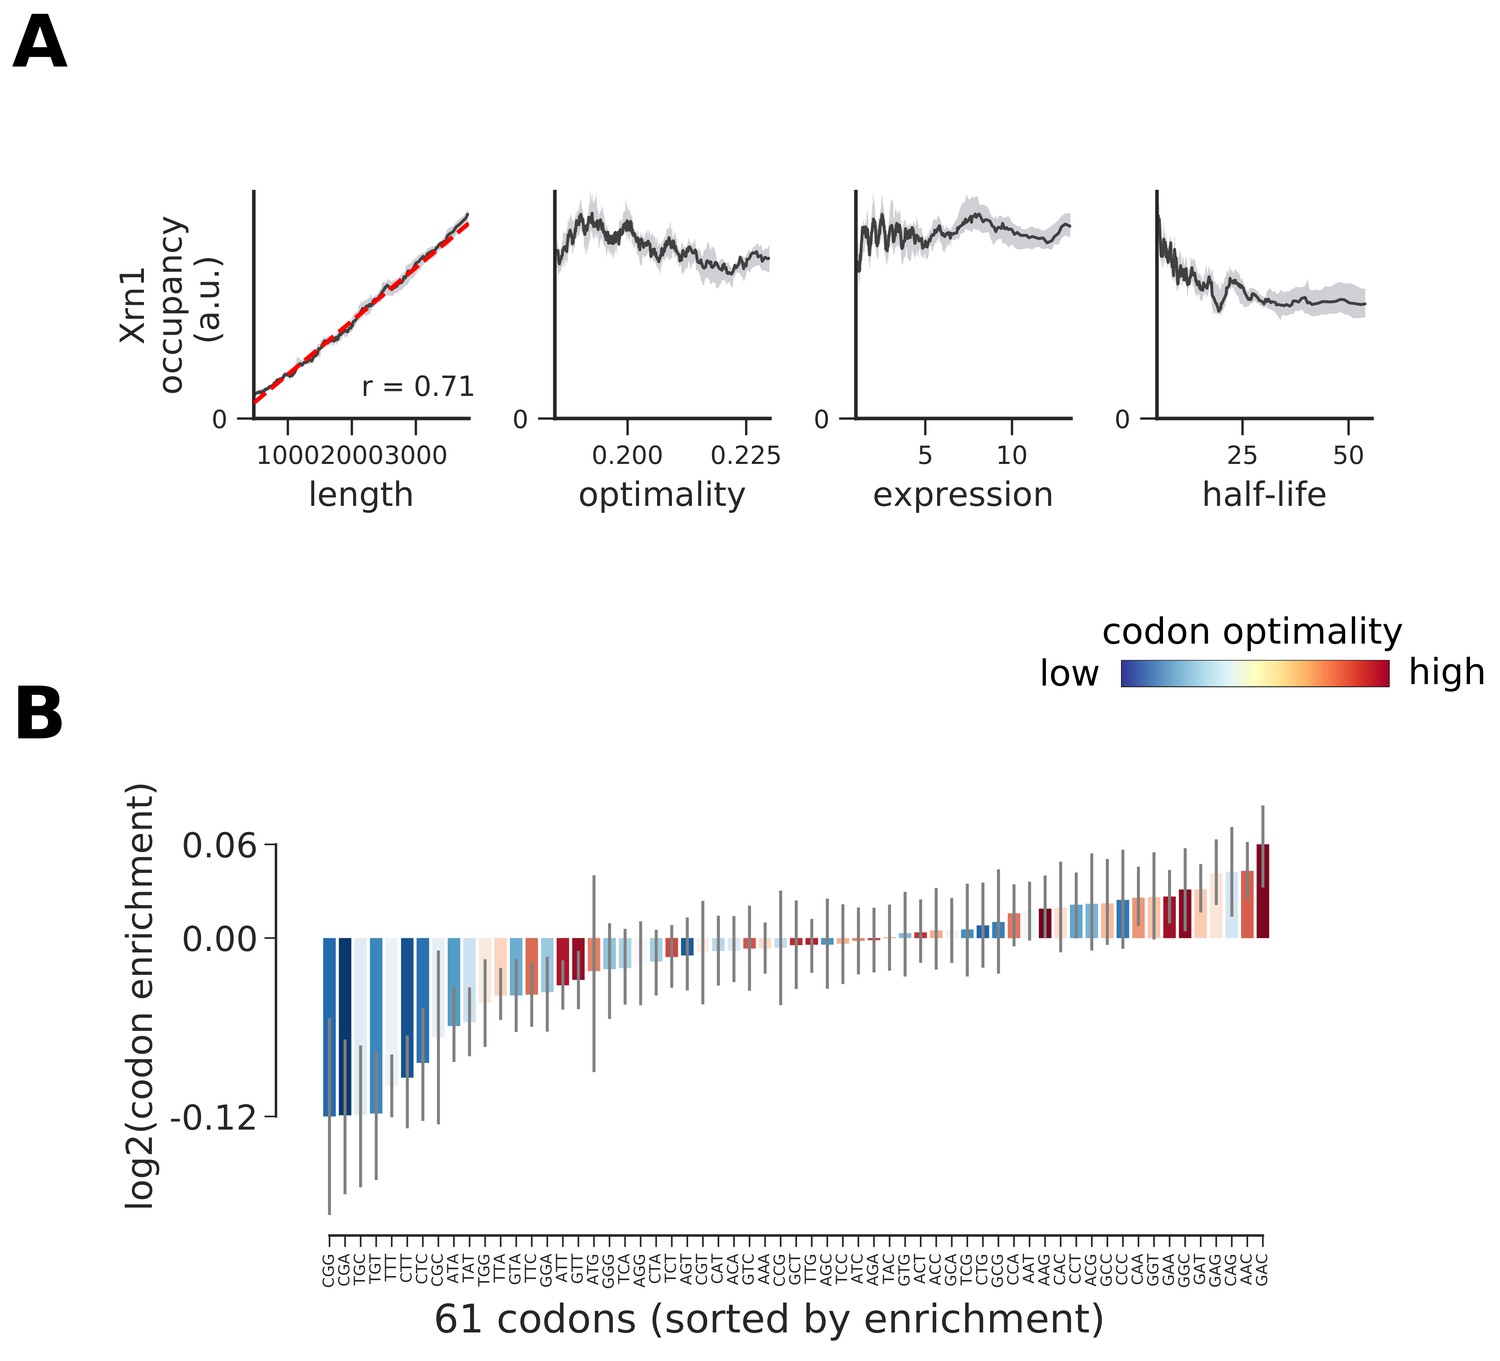
Occupancy of Xrn1 compared to transcript length, optimality, expression level, and half-life.
(A) To understand binding specificity of Xrn1 on various mRNAs, the total occupancy of Xrn1 on a transcript is plotted against various transcript features (Gray shading: 95% confidence intervals generated by bootstrapping transcripts). (B) Same analysis as in Figure 6B: Codon enrichment shows deviations in codon frequencies of transcripts bound by a degradation factor compared to each codon’s frequency on all coding sequences. Each bar is colored according to its codon-optimality with highly optimal codons in dark red and highly non-optimal codons in dark blue. (Gray lines: 90% confidence intervals generated by bootstrapping coding sequences).
Figure 6—figure supplement 4

Occupancies of exosome components (Rrp6, Csl4, Rrp40, Rrp4, and Rrp44) compared to transcript length, optimality, expression level, and half-life.
(A) To understand binding specificity of exosome components, the total occupancy of each factor on a transcript is plotted against various transcript features (Gray shading: 95% confidence intervals generated by bootstrapping transcripts). (B) Same analysis as in Figure 6B: Codon enrichment shows deviations in codon frequencies of transcripts bound by a degradation factor compared to each codon’s frequency on all coding sequences. Each bar is colored according to its codon-optimality with highly optimal codons in dark red and highly non-optimal codons in dark blue. (Gray lines: 90% confidence intervals generated by bootstrapping coding sequences).
Figure 6—figure supplement 5
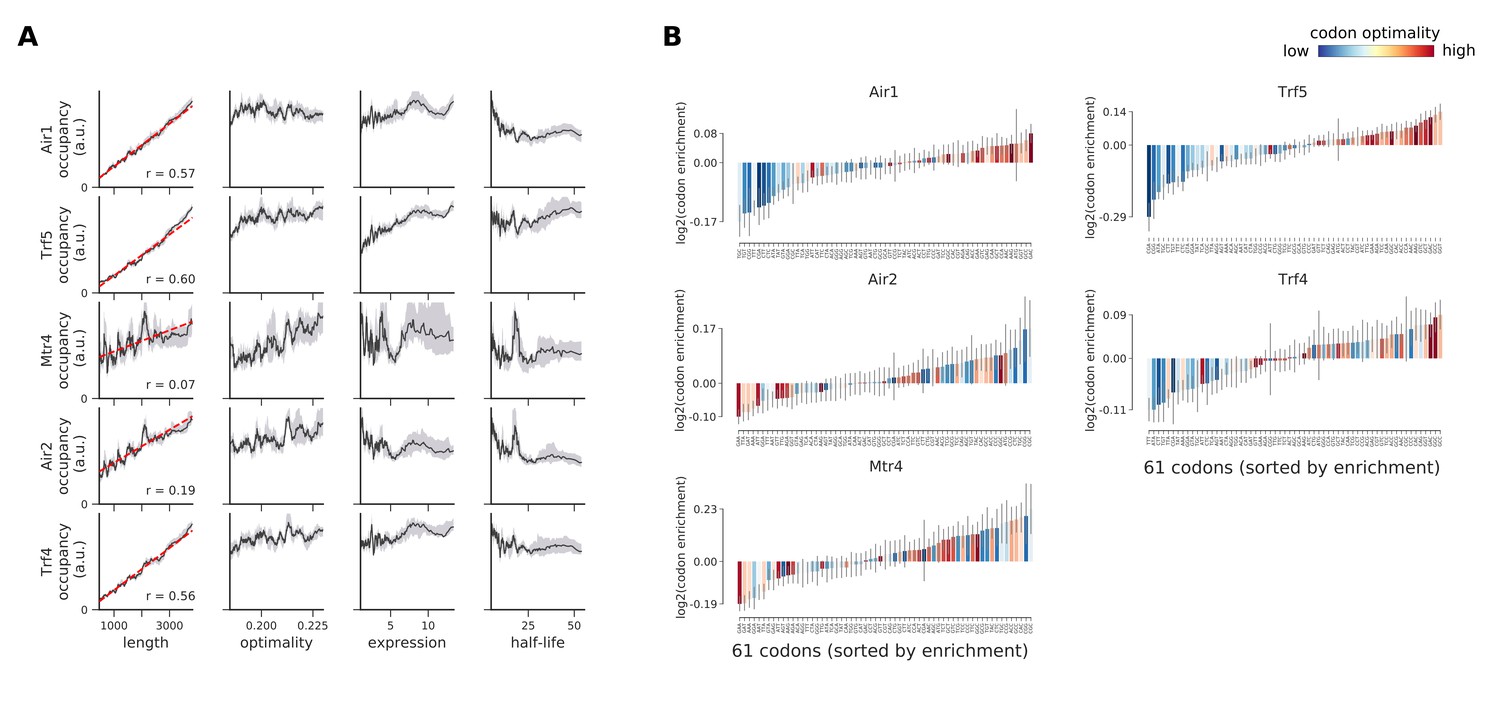
Occupancies for components of the TRAMP complex (Air1, Trf5, Mtr4, Air2, and Trf4) compared to transcript length, optimality, expression level, and half-life.
(A) To understand binding specificity of TRAMP components, the total occupancy of each factor on a transcript is plotted against various transcript features (Gray shading: 95% confidence intervals generated by bootstrapping transcripts). (B) Same analysis as in Figure 6B: Codon enrichment shows deviations in codon frequencies of transcripts bound by a degradation factor compared to each codon’s frequency on all coding sequences. Each bar is colored according to its codon-optimality with highly optimal codons in dark red and highly non-optimal codons in dark blue. (Gray lines: 90% confidence intervals generated by bootstrapping coding sequences).
Figure 6—figure supplement 6
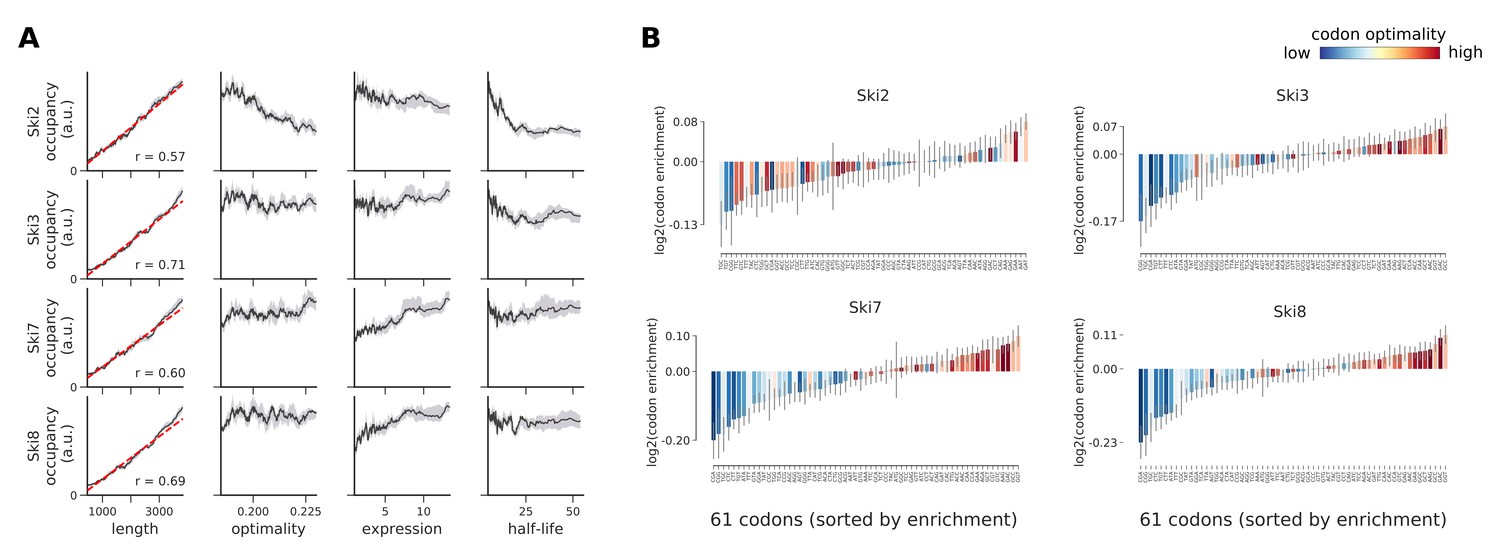
Occupancies for components of the Ski complex (Ski2, Ski3, Ski7, and Ski8) compared to transcript length, optimality, expression level, and half-life.
(A) To understand binding specificity of factors in the Ski complex, the total occupancy of each factor on a transcript is plotted against various transcript features (Gray shading: 95% confidence intervals generated by bootstrapping transcripts). (B) Same analysis as in Figure 6B: Codon enrichment shows deviations in codon frequencies of transcripts bound by a degradation factor compared to each codon’s frequency on all coding sequences. Each bar is colored according to its codon-optimality with highly optimal codons in dark red and highly non-optimal codons in dark blue. (Gray lines: 90% confidence intervals generated by bootstrapping coding sequences).
Figure 6—figure supplement 7
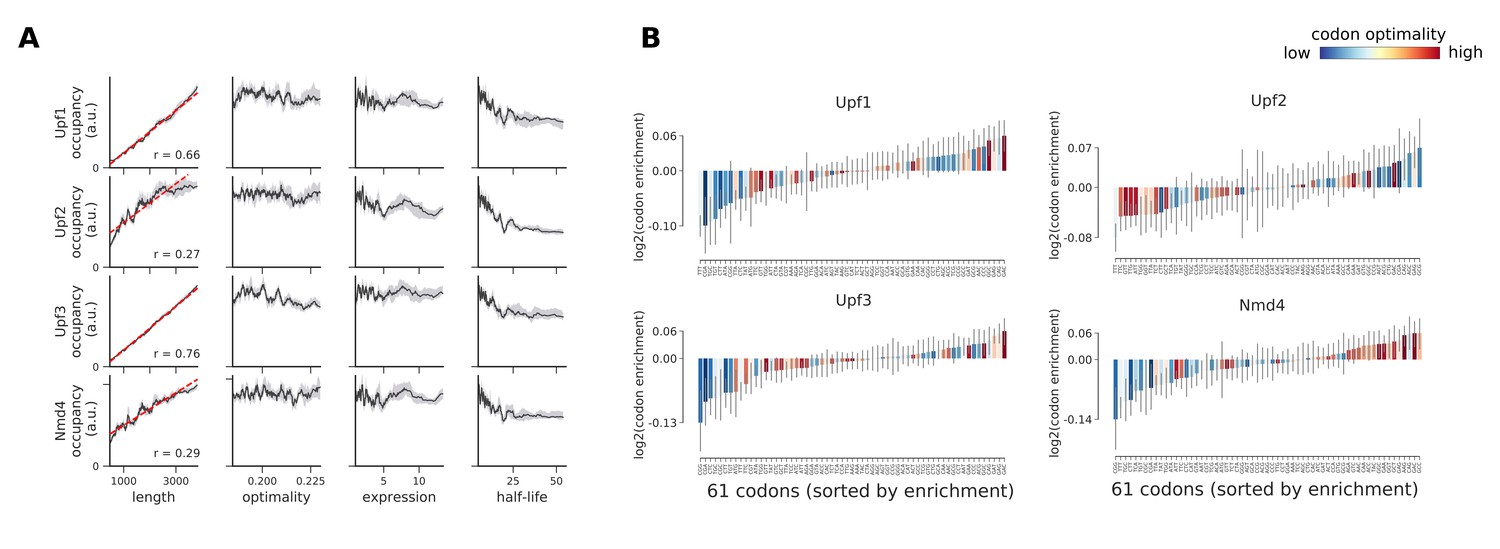
Occupancies for components of the NMD pathway (Upf1, Upf2, Upf3, and Nmd4) compared to transcript length, optimality, expression level, and half-life.
(A) To understand binding specificity of factors in the NMD pathway, the total occupancy of each factor on a transcript is plotted against various transcript features (Gray shading: 95% confidence intervals generated by bootstrapping transcripts). (B) Same analysis as in Figure 6B: Codon enrichment shows deviations in codon frequencies of transcripts bound by a degradation factor compared to each codon’s frequency on all coding sequences. Each bar is colored according to its codon-optimality with highly optimal codons in dark red and highly non-optimal codons in dark blue. (Gray lines: 90% confidence intervals generated by bootstrapping coding sequences).
Figure 6—figure supplement 8
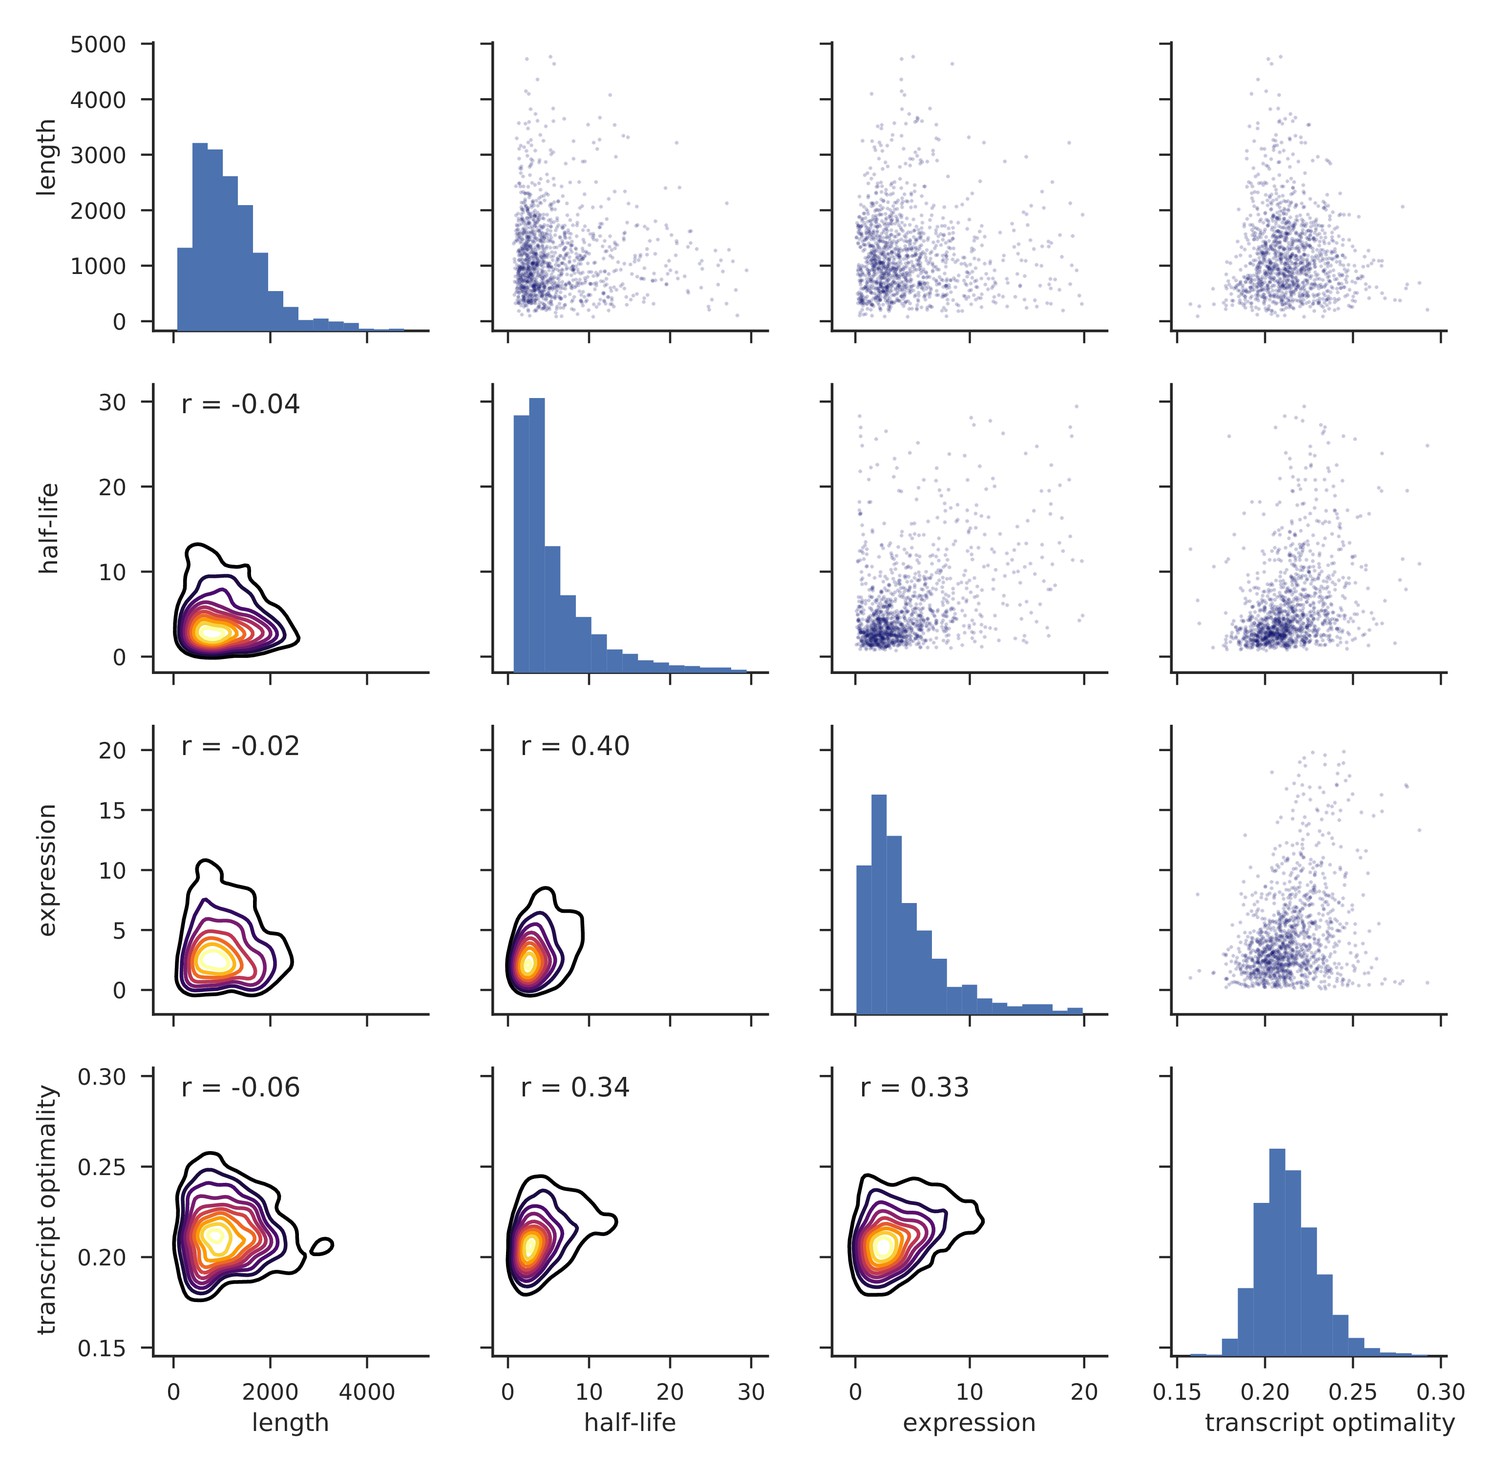
Distributions of transcript length, half-life, expression level and transcript optimality for yeast mRNAs.
Histograms on the diagonal show distributions of length, half-life (Materials and methods), expression level (Baejen et al., 2017) and transcript optimality (Pechmann and Frydman, 2013). Pairwise comparisons of features are shown as scatter plots (top right) and kernel density estimates (KDEs) of bivariate densities are shown in the bottom with Pearson correlation values (r) (Materials and methods).
Figure 6—figure supplement 9
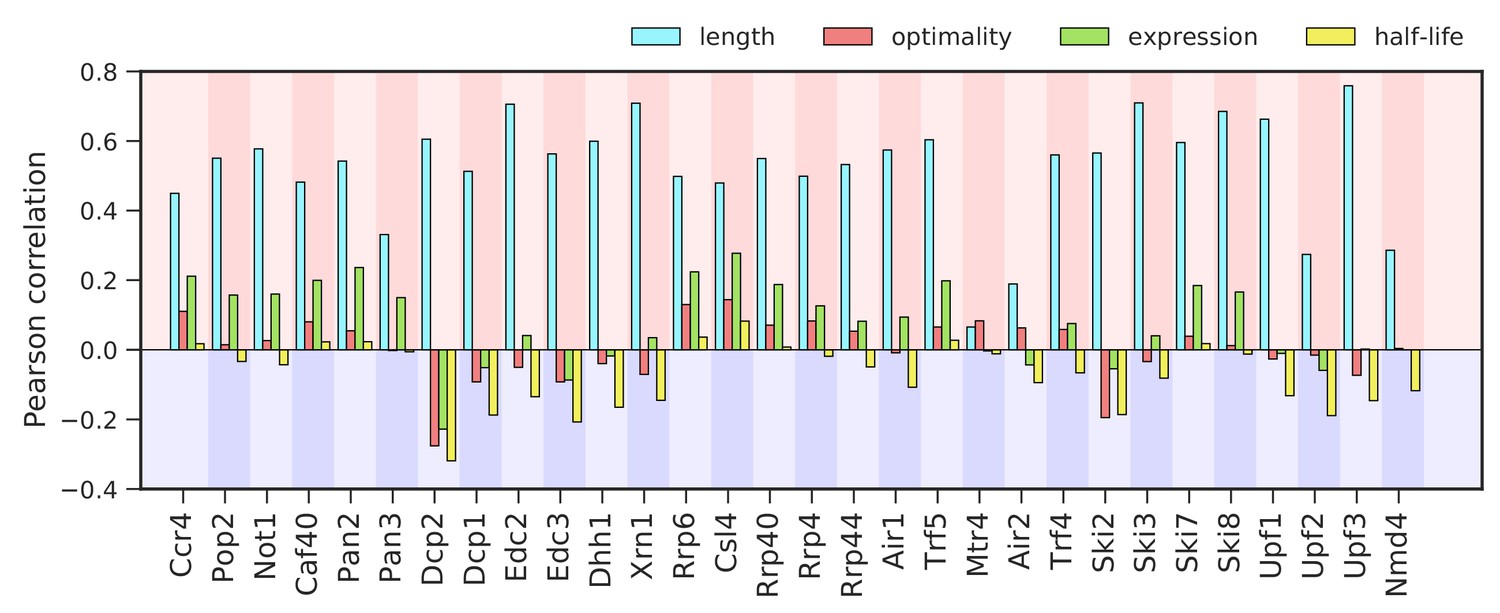
Correlation between binding to degradation factors and transcript length, codon-optimality, expression, and half-life.
Pearson correlation values between the binding strength of degradation factors (total occupancy over each transcript) and transcript length, transcript optimality (Pechmann and Frydman, 2013), expression level (Baejen et al., 2017), and half-life derived by multivariate linear regression analysis (Materials and methods).
Figure 7
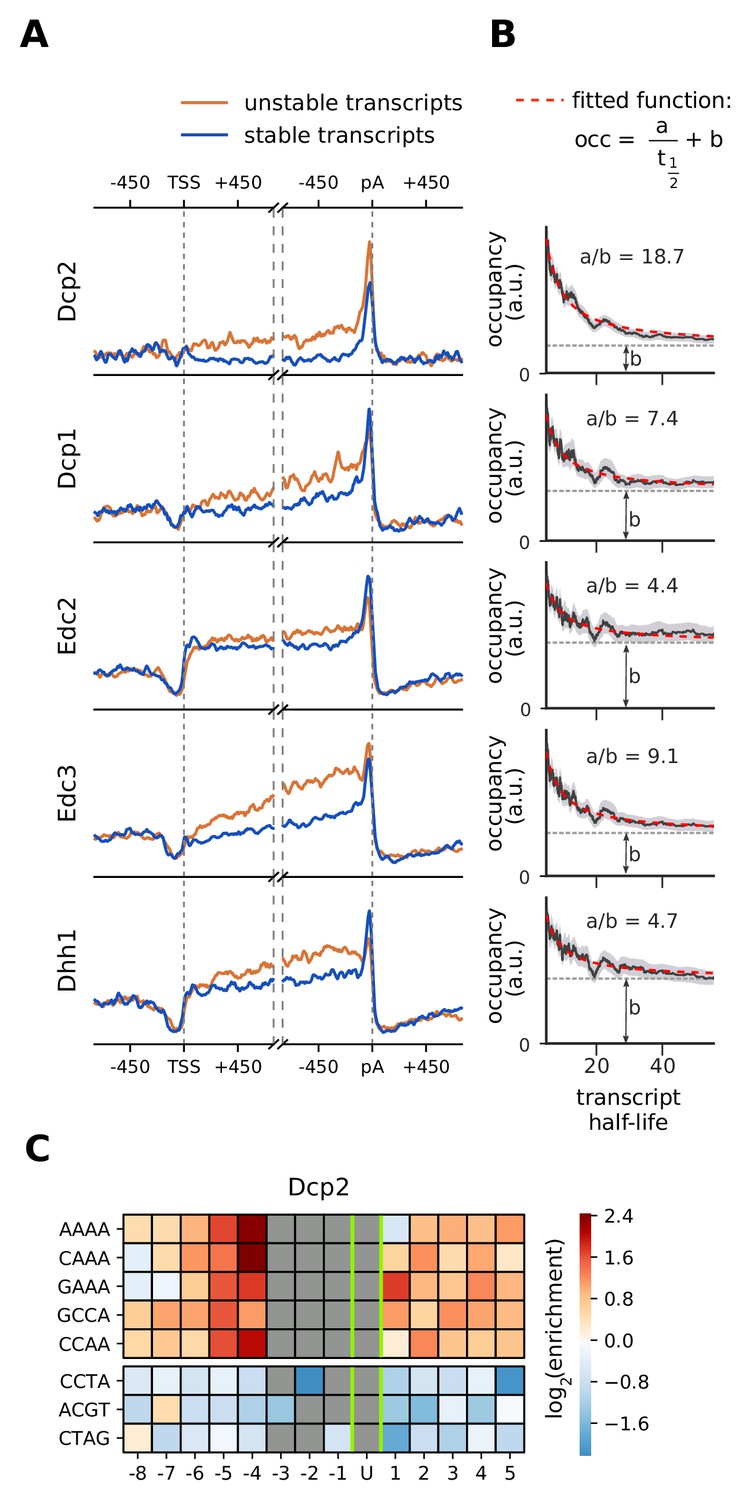
Location and recruitment of the decapping complex Dcp1/Dcp2 and decapping enhancers Edc3, Dhh1, and Edc2.
(A) Smoothed, transcript-averaged PAR-CLIP occupancy profiles aligned at TSS and pA sites [±750 nt] of unstable and stable transcripts (first and fourth quantile of half-life distribution, respectively). (B) Dependence of total occupancy of factors on the transcripts half-life. The fitting function is plotted in red and the fitted value for b is marked with a dashed gray line. (Gray shade: 95% confidence intervals generated by bootstrapping transcripts). (C) Sequence binding preference for the catalytically active subunit of decapping complex (Dcp2), illustrated with the five most enriched and the 3 most depleted 4-mers. The color code shows the log2 enrichment factor of 4-mers around PAR-CLIP cross-link sites [±8 nt]. Dark red represents strong enrichment and dark blue shows strong depletion of a 4-mer. Infeasible combinations are shown with gray. The most highly enriched field is binding AAAAU with the cross-link at the U, which is enriched over random expectation approximately 22.3 = 5-fold.
Author response image 1
Tables
Key resources table
| Reagent type (species) or resource | Designation | Source or reference | Identifiers | Additional information |
|---|---|---|---|---|
| Strain, strain background (S. cerevisiae, BY4741) | Ccr4_TAP | C-terminally tagged gene (Open Biosystems, Germany). | SGD: S000000019 | |
| Strain, strain background (S. cerevisiae, BY4741) | Pop2_TAP | C-terminally tagged gene (Open Biosystems, Germany). | SGD: S000005335 | |
| Strain, strain background (S. cerevisiae, BY4741) | Not1_TAP | C-terminally tagged gene (Open Biosystems, Germany). | SGD: S000000689 | |
| Strain, strain background (S. cerevisiae, BY4741) | Caf40_TAP | C-terminally tagged gene (Open Biosystems, Germany). | SGD: S000005232 | |
| Strain, strain background (S. cerevisiae, BY4741) | Pan2_TAP | C-terminally tagged gene (Open Biosystems, Germany). | SGD: S000003062 | |
| Strain, strain background (S. cerevisiae, BY4741) | Pan3_TAP | C-terminally tagged gene (Open Biosystems, Germany). | SGD: S000001508 | |
| Strain, strain background (S. cerevisiae, BY4741) | Dcp1_TAP | C-terminally tagged gene (Open Biosystems, Germany). | SGD: S000005509 | |
| Strain, strain background (S. cerevisiae, BY4741) | Dcp2_TAP | C-terminally tagged gene (Open Biosystems, Germany). | SGD: S000005062 | |
| Strain, strain background (S. cerevisiae, BY4741) | Edc2_TAP | C-terminally tagged gene (Open Biosystems, Germany). | SGD: S000000837 | |
| Strain, strain background (S. cerevisiae, BY4741) | Edc3_TAP | C-terminally tagged gene (Open Biosystems, Germany). | SGD: S000000741 | |
| Strain, strain background (S. cerevisiae, BY4741) | Dhh1_TAP | C-terminally tagged gene (Open Biosystems, Germany). | SGD: S000002319 | |
| Strain, strain background (S. cerevisiae, BY4741) | Xrn1_TAP | C-terminally tagged gene (Open Biosystems, Germany). | SGD: S000003141 | |
| Strain, strain background (S. cerevisiae, BY4741) | Rrp6_TAP | C-terminally tagged gene (Open Biosystems, Germany). | SGD: S000005527 | |
| Strain, strain background (S. cerevisiae, BY4741) | Csl4_TAP | C-terminally tagged gene (Open Biosystems, Germany). | SGD: S000005176 | |
| Strain, strain background (S. cerevisiae, BY4741) | Rrp40-TAP | C-terminally tagged gene (Open Biosystems, Germany). | SGD: S000005502 | |
| Strain, strain background (S. cerevisiae, BY4741) | Rrp4_TAP | C-terminally tagged gene (Open Biosystems, Germany). | SGD: S000001111 | |
| Strain, strain background (S. cerevisiae, BY4741) | Rrp44_TAP | C-terminally tagged gene (Open Biosystems, Germany). | SGD: S000005381 | |
| Strain, strain background (S. cerevisiae, BY4741) | Air1_TAP | C-terminally tagged gene (Open Biosystems, Germany). | SGD: S000001341 | |
| Strain, strain background (S. cerevisiae, BY4741) | Trf5_TAP | C-terminally tagged gene (Open Biosystems, Germany). | SGD: S000005243 | |
| Strain, strain background (S. cerevisiae, BY4741) | Mtr4_TAP | C-terminally tagged gene (Open Biosystems, Germany). | SGD: S000003586 | |
| Strain, strain background (S. cerevisiae, BY4741) | Air2_TAP | C-terminally tagged gene (Open Biosystems, Germany). | SGD: S000002334 | |
| Strain, strain background (S. cerevisiae, BY4741) | Trf4_TAP | C-terminally tagged gene (Open Biosystems, Germany). | SGD: S000005475 | |
| Strain, strain background (S. cerevisiae, BY4741) | Ski2_TAP | C-terminally tagged gene (Open Biosystems, Germany). | SGD: S000004390 | |
| Strain, strain background (S. cerevisiae, BY4741) | Ski3_TAP | C-terminally tagged gene (Open Biosystems, Germany). | SGD: S000006393 | |
| Strain, strain background (S. cerevisiae, BY4741) | Ski7_TAP | C-terminally tagged gene (Open Biosystems, Germany). | SGD: S000005602 | |
| Strain, strain background (S. cerevisiae, BY4741) | Ski8_TAP | C-terminally tagged gene (Open Biosystems, Germany). | SGD: S000003181 | |
| Strain, strain background (S. cerevisiae, BY4741) | Upf1_TAP | C-terminally tagged gene (Open Biosystems, Germany). | SGD: S000004685 | |
| Strain, strain background (S. cerevisiae, BY4741) | Upf2_TAP | C-terminally tagged gene (Open Biosystems, Germany). | SGD: S000001119 | |
| Strain, strain background (S. cerevisiae, BY4741) | Upf3_TAP | C-terminally tagged gene (Open Biosystems, Germany). | SGD: S000003304 | |
| Strain, strain background (S. cerevisiae, BY4741) | Nmd4_TAP | C-terminally tagged gene (Open Biosystems, Germany). | SGD: S000004355 | |
| Antibody | IgG | Sigma-Aldrich | Cat#: I5006, RRID:AB_1163659 | IP: 0.1 mg per IP |
| Antibody | PAP anti-TAP | Sigma Aldrich | Cat#: P1291, RRID:AB_1079562 | WB (1:2000) |
| Commercial assay or kit | Dynabeads Protein G | Invitrogen | Cat#: 10003D | 330 µl per IP |
| Commercial assay or kit | RNase T1 | Thermo Fisher Scientific | Cat#: EN0541 | |
| Commercial assay or kit | Antarctic Phosphatase | NEB | Cat#: M0289S | |
| Commercial assay or kit | RNase OUT | Invitrogen | Cat#: 10777019 | |
| Commercial assay or kit | T4 Polynucleotide Kinase | Invitrogen | Cat#: EK0032 | |
| Commercial assay or kit | T4 RNA ligase 2, truncated KQ | NEB | Cat#: M0373S | |
| Commercial assay or kit | T4 RNA ligase 1 | NEB | Cat#: M0437M | |
| Commercial assay or kit | Proteinase K | NEB | Cat#: P8107S | |
| Commercial assay or kit | SuperScript III RT | Thermo Fisher Scientific | Cat#: 18080093 | |
| Commercial assay or kit | Phusion High-Fidelity PCR Master Mix | Thermo Fisher Scientific | Cat#: F531S | |
| Chemical compound, drug | 4-thiouracil | Carbosynth | Cat#: 591-28-6 | 1 mM final conc. |
| Software, algorithm | mockinbird | Roth and Torkler, 2018;https://github.com/soedinglab/Degradation_scripts | ||
| Software, algorithm | UMI-tools | Smith et al., 2017; doi:10.1101/gr.209601.116 | ||
| Software, algorithm | Skewer | Jiang et al., 2014; doi: 10.1186/1471-2105-15-182 | ||
| Software, algorithm | Bowtie | Langmead et al., 2009; doi: 10.1186/gb-2009-10-3-r25 | ||
| Software, algorithm | tSNE | Van Der Maaten and Hinton, 2008; doi: 10.1007/s10479-011-0841-3 |
Additional files
-
Supplementary file 1
Overview of RNA processing factors and their respective PAR-CLIP experiments used in this study.
- https://doi.org/10.7554/eLife.47040.031
-
Transparent reporting form
- https://doi.org/10.7554/eLife.47040.032
Download links
A two-part list of links to download the article, or parts of the article, in various formats.
Downloads (link to download the article as PDF)
Open citations (links to open the citations from this article in various online reference manager services)
Cite this article (links to download the citations from this article in formats compatible with various reference manager tools)
Transcriptome maps of general eukaryotic RNA degradation factors
eLife 8:e47040.
https://doi.org/10.7554/eLife.47040


