Molecular mechanisms of human P2X3 receptor channel activation and modulation by divalent cation bound ATP
- National Institute of Neurological Disorders and Stroke, National Institutes of Health, United States
- Fudan University, China
- National Heart, Lung and Blood Institute, National Institutes of Health, United States
Figures
Figure 1 with 1 supplement
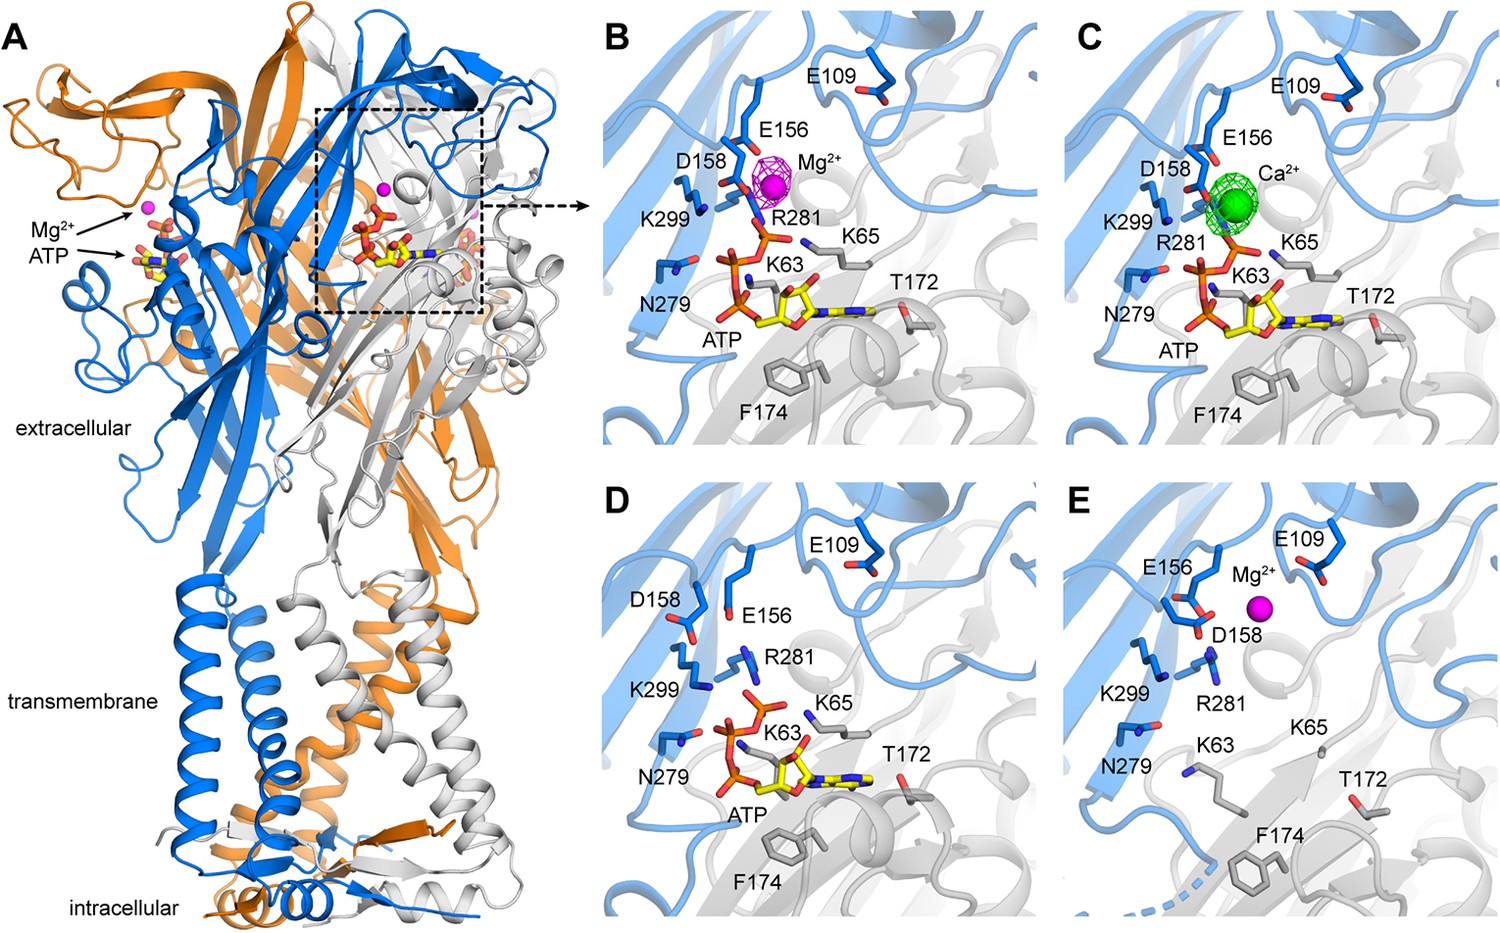
X-ray structures of hP2X3 receptors with divalent ions bound..
(A) Overall structure of hP2X3 MFCslow with ATP and Mg2+ bound (PDB ID 6AH5). Agonist binding pockets are formed at each of the three interfaces between adjacent subunits (blue, orange, gray). (B) Close-up view of the binding site for Mg2+-ATP in hP2X3 MFCslow, highlighting key interactions between the receptor and both ligands. In this ‘lower mode’, Mg2+ interacts directly with the γ phosphate of ATP and acidic residues in the receptor. The omit Fo-Fc density map for Mg2+ is overlaid (magenta mesh), contoured at 3.5σ. (C) Same as B), for the structure of hP2X3 MFCslow with ATP and Ca2+ bound (PDB ID 6AH4). The omit Fo-Fc density map for Ca2+ (green) is contoured at 5σ. (D) Same view of the agonist-binding pocket in an existing structure of hP2X3 MFCslow bound to ATP only (PDB ID 5SVK). Note the mode of ATP binding is nearly identical to that in B) and C), except for the acidic sidechains near Mg2+ or Ca2+. (E) Same view of the agonist-binding pocket in an existing structure of hP2X3 MFCslow bound to Mg2+ only (PDB ID: 5SVJ). In this ‘upper mode’, Mg2+ shifts upwards and is stabilized by a cluster of acidic sidechains. .
Figure 1—figure supplement 1

Conformational changes associated with ATP binding in the presence and absence of Mg2+.
(A) Overall structure of hP2X3 MFCslow with ATP and Mg2+ bound (PDB ID 6AH5). The cytoplasmic domain is omitted for clarity. (B) Comparison of the structures of hP2X3 MFCslow bound to ATP only (PDB ID: 5SVK) and bound to ATP and Mg2+. The structures are highly similar, except for changes in the vicinity of the Mg2+ ion, consistent with the fact that both ATP and ATP-Mg2+ activate the receptor. Only one subunit is shown for clarity. (C, D) Comparison of the structures of hP2X3 MFCslow bound to Mg2+ only (PDB ID 5SVJ) and bound to ATP and Mg2+ (orange/light gray and blue/dark gray, respectively). ATP recognition appears to induce a contraction in the extracellular domain of the adjacent subunit, which propagates to the transmembrane domain. Mg2+ shifts downwards to directly coordinate ATP.
Figure 2 with 3 supplements
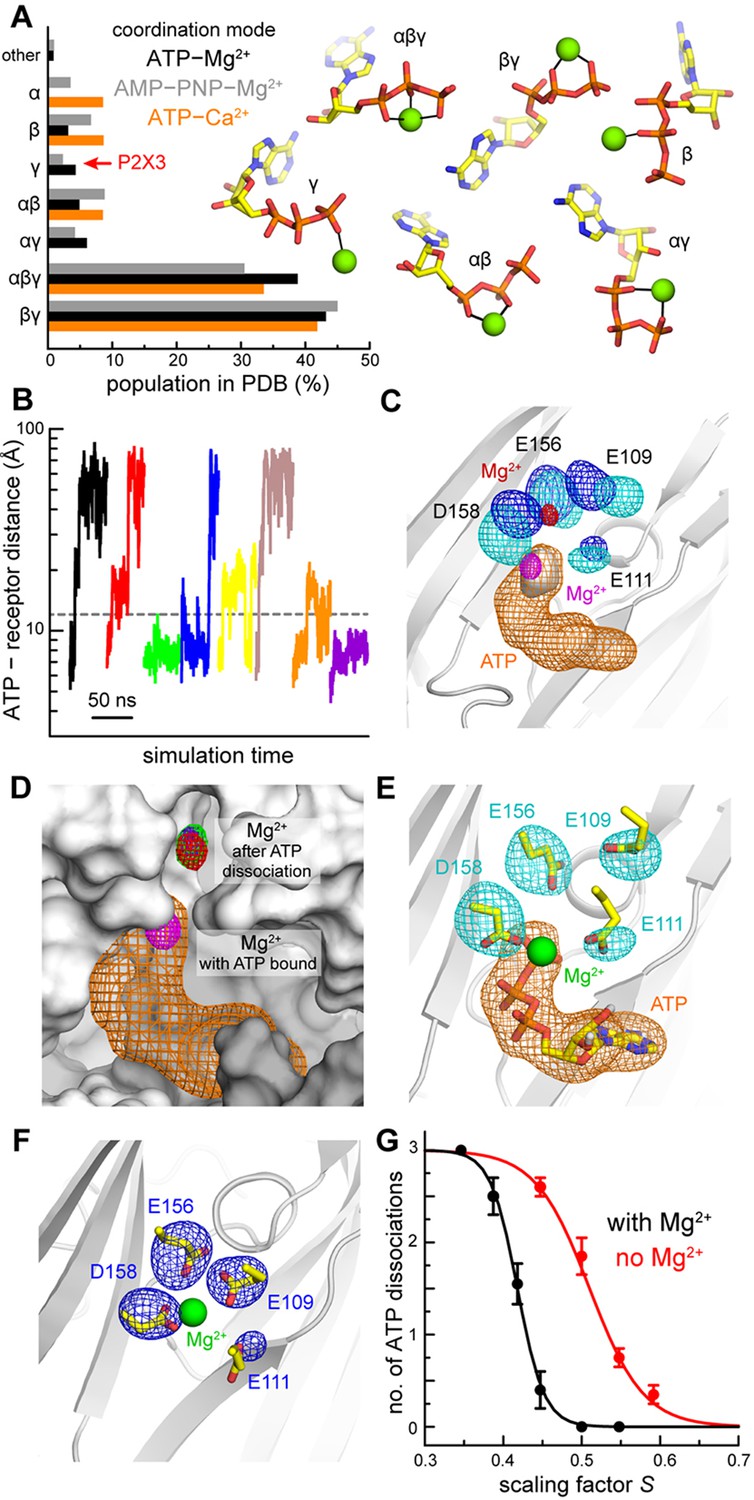
Computational study of the mode of ATP and Mg2+ recognition by P2X3.
(A) Occurrence of different modes of Mg2+-ATP and Ca2+-ATP interaction in non-redundant high-resolution crystal structures available in the Protein Data Bank. Each mode is indicated by the phosphate groups in ATP that coordinate the cation. Analogous data is shown for complexes of Mg2+ with the non-hydrolyzable analog AMP-PNP. (B) A sample of the simulated trajectories of the P2X3-ATP-Mg2+ complex produced with the solute-tempering protocol (S = 0.39). Trajectories showing spontaneous ATP dissociation from P2X3 (and Mg2+) are those in which the distance between the center of ATP and the center of the binding site in the receptor exceed 12 Å. Additional trajectories are depicted in Figure 2—figure supplement 1. (C) Comparison of P2X3-ATP-Mg2+ and P2X3-Mg2+ following ATP dissociation. For P2X3-ATP-Mg2+, 3D density maps calculated from the simulation data (see Materials and methods) are shown for ATP (orange), the γ-phosphate (gray surface), Mg2+ (magenta) and the surrounding carboxyl groups of acidic residues (cyan). Analogous maps are shown for ion and sidechains (red and blue, respectively), following ATP dissociation. The maps shown are averages of the data for the three protein subunits. The contour levels used for Mg2+ are the same in both cases; likewise for the sidechains. The protein conformation (gray cartoons) is a snapshot of the ATP-bound state. (D) Same as panel C, for Mg2+ and ATP in the ATP-bound state. For the ATP-free state, individual Mg2+ density maps are shown for each binding site in the trimer (red, green, purple), to demonstrate the observed displacement is reproducible. The protein snapshot is that in panel C, now represented as a surface, with adjacent protein subunits in light and dark gray. (E) Same as panel C, for the ATP-bound state, now showing a randomly selected configuration of Mg2+, ATP and the four acidic sidechains that represents the density. Non-polar hydrogen atoms and other components of the simulation system are omitted for clarity. (F) Same as panel E, for the ATP-dissociated state, in a slightly different view, for clarity. (G) Impact of Mg2+ on the nature of the interaction between ATP and P2X3. The plot quantifies the number of ATP dissociation events expected to occur in a 50-ns time-window, deduced from our simulation data, for each value of the scaling factor S, and in the presence or absence of Mg2+. Note that one ATP molecule is bound to each of the three protein subunits, and hence the maximum number of dissociation events is also 3. Each data point is an average of N = 20 independent simulations. Error bars denote the S.E.M. The data was fitted to a sigmoidal function f = 3/(1 + exp [m (S - n)]. The resulting parameters (C.C. > 99%) are: with Mg2+, m = 58.6, n = 0.42; without Mg2+, m = 29.1, n = 0.51.
Figure 2—figure supplement 1
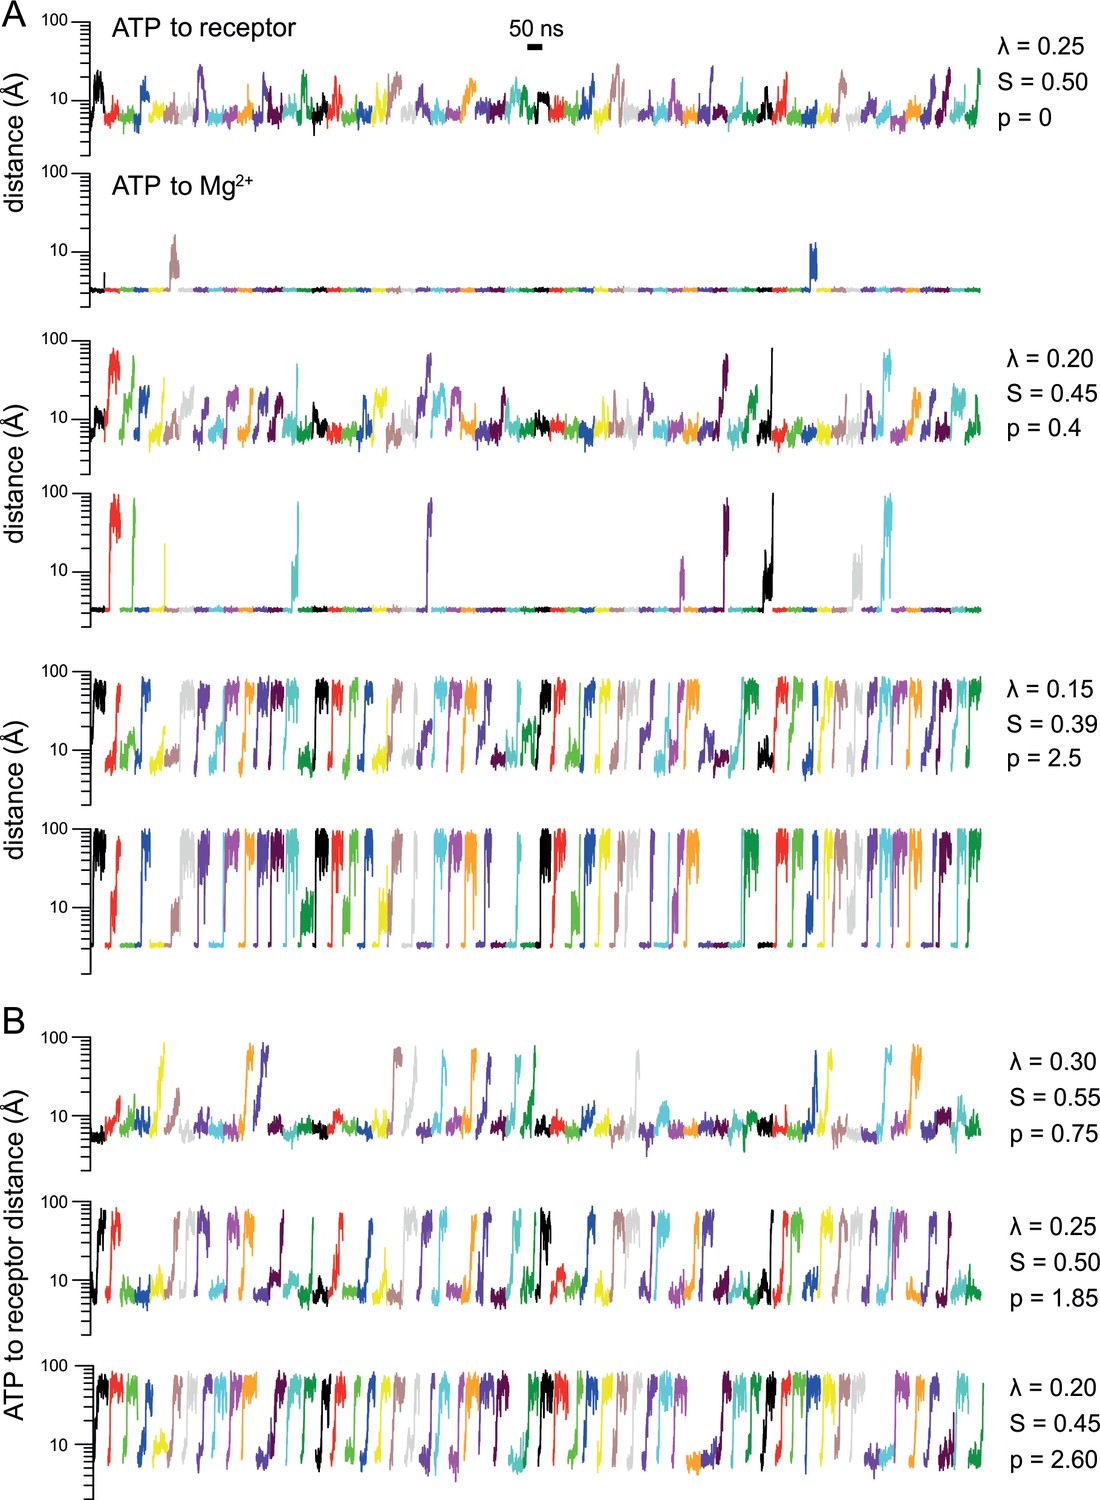
Simulated ATP dissociation from P2X3 in the presence and in the absence of Mg2+.
(A) Solute-tempering simulations of the P2X3-ATP-Mg2+ complex. The plots quantify the distance between ATP and either its binding site in P2X3 or Mg2+, as a function of simulation time. Each plot includes 60 time-series corresponding to 20 independent simulations of 50 ns each (3 binding sites are analyzed in each simulation). The factor that scales the interactions of ATP with protein, ion and solvent, to facilitate its dissociation, is indicated alongside each pair of plots. The resulting ATP dissociation probability () is also indicated. Dissociations require the ATP-receptor distance to exceed 12 Å, while simultaneously, the ATP-Mg2+ distance must exceed 5 Å. (B) Same as (A) for analogous solute-tempering simulations of P2X3-ATP without Mg2+ bound. The plot in Fig. 2G is based in part on the p values presented in this figure.
Figure 2—figure supplement 2
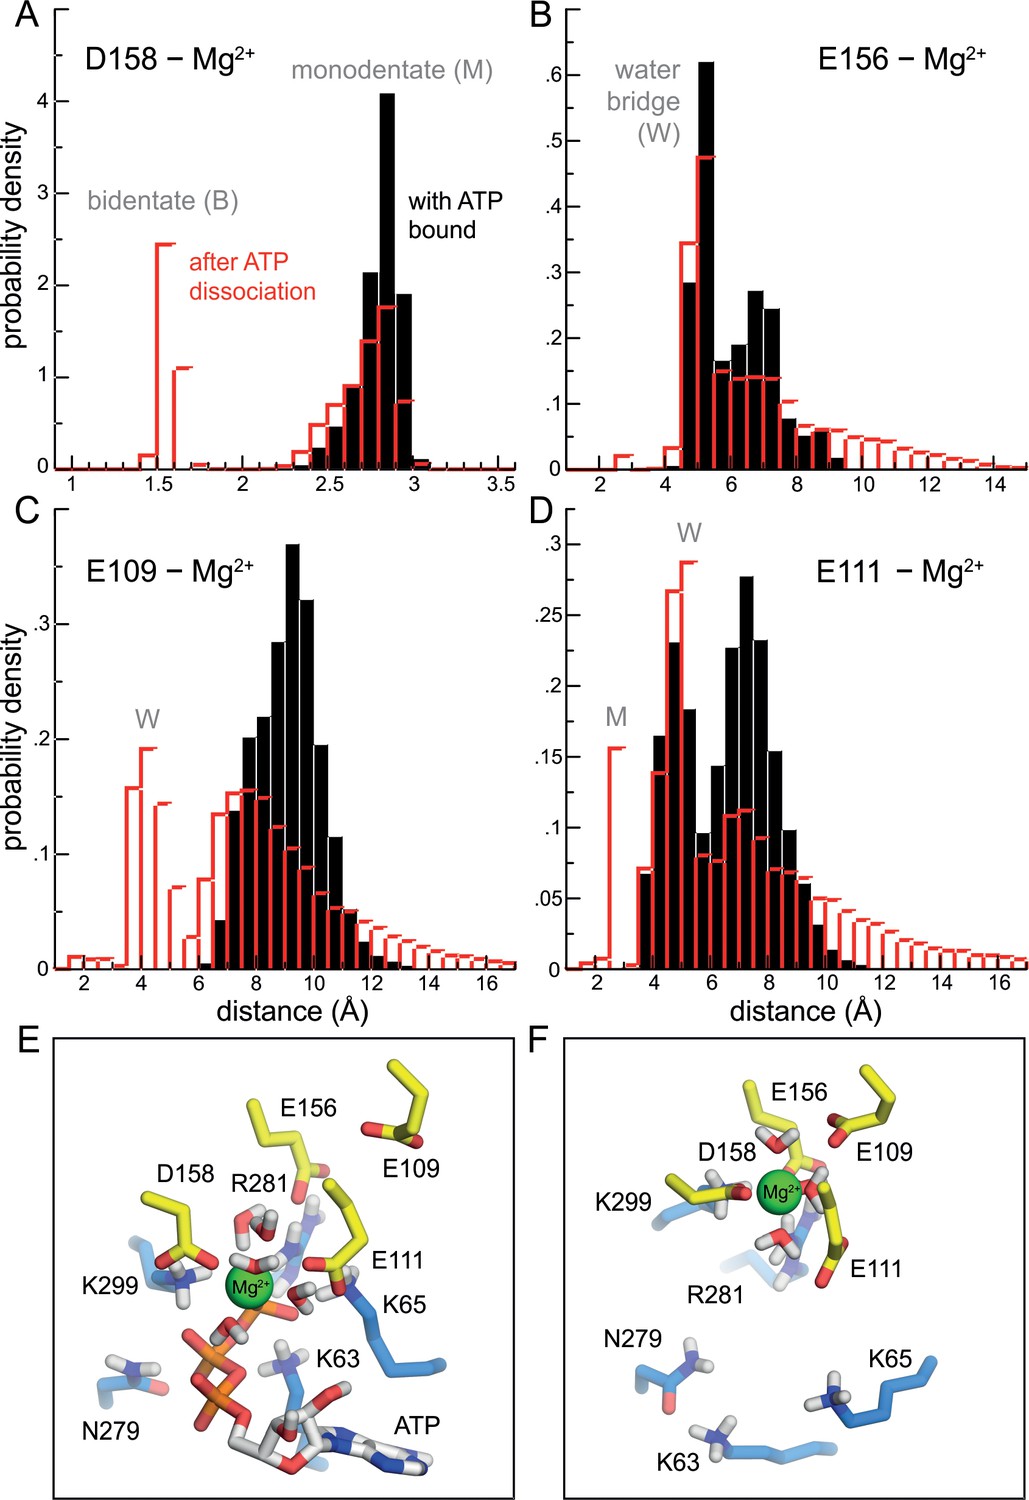
Change in the mode of Mg2+ binding to P2X3 following ATP dissociation.
(A–D) Distance between Mg2+ and the carboxyl groups of D158, E156, E111 and E109, in the ATP-bound state (black) and following ATP dissociation (red). The data are shown as histograms calculated from the simulated trajectories, combining the data for each of the three binding sites in the receptor. The histograms describing the ATP bound state (black) derive from analysis of a conventional MD simulation with an unperturbed forcefield (e.g. same as Figure 2E); for the ATP-dissociated state (red), the histograms derives from analysis of all solute-tempering simulations, that is for all values of S, but considering only snapshots where the distance between ATP and its binding site (center to center) is greater than 12 Å, while simultaneously the ATP-Mg2+ distance is greater than 5 Å. (Note that the magnitude of the interactions between ion, protein and solvent are not altered in the solute-tempering scheme.) The most prominent peaks reflect bidentate (B), monodentate (M) and water-mediated (W) interactions between the ion and the carboxyl groups. (E) Same snapshot as that shown in Figure 2E, for P2X3 bound to Mg2+-ATP, showing the set of basic and polar sidechains that coordinate the ATP tri-phosphate group, as well as water molecules near the Mg2+ ion. Non-polar hydrogen atoms and other component of the simulation system are omitted for clarity. See also Video 1. (F) Same as panel E, for the same snapshot shown in Figure 2F, in the ATP-dissociated state. See also Video 2.
Figure 2—figure supplement 3
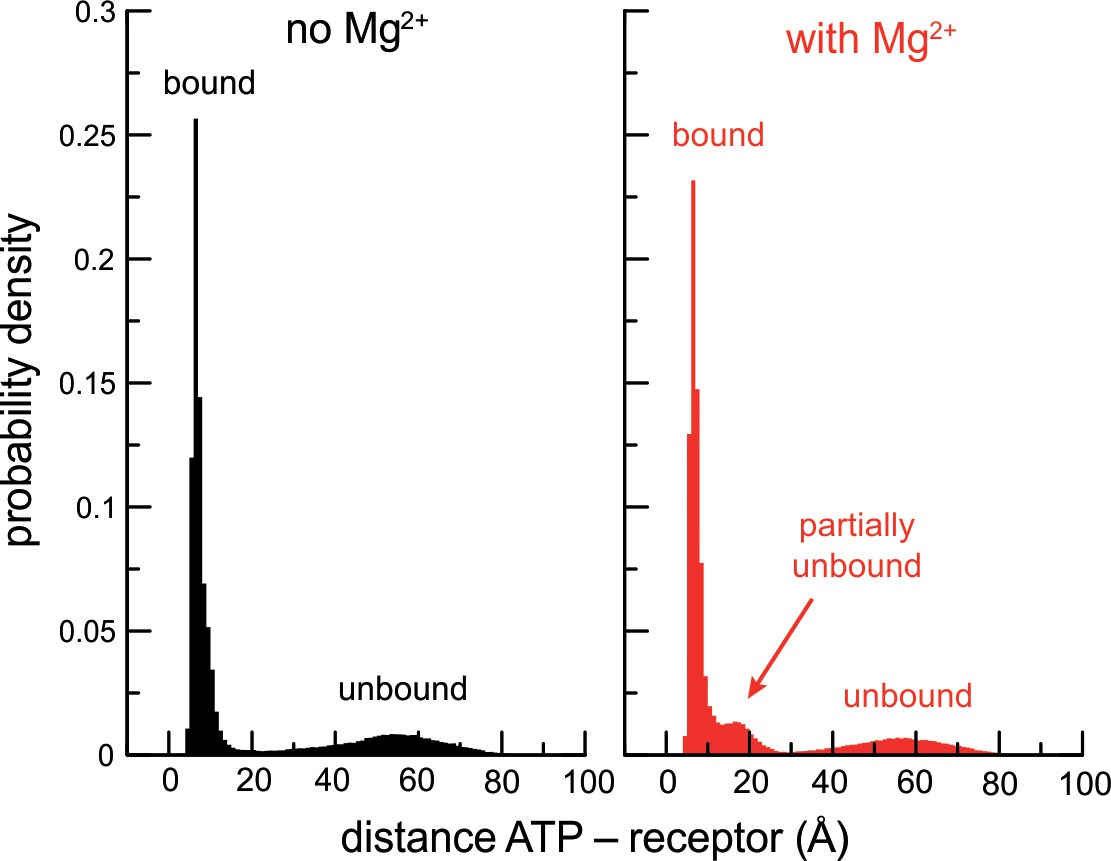
Cooperativity between Mg2+ and P2X3 slows down ATP dissociation.
Histograms of the ATP-receptor distance, for either P2X3 ATP (black) or P2X3-ATP-Mg2+ (red), calculated from all the solute-tempering simulations carried out in each case. The peaks at ~ 10 Å reflect the ATP-bound state. The shallow peaks centered at ~ 50 Å reflect ATP-dissociated states. Note that the histograms must tail off to zero at 100 Å as the periodic box that encompasses the simulation system is a finite cube of side 100 Å. Also note that because the histograms derive from simulations carried out with different scaling factors (and therefore different ATP-dissociation probabilities), the relative heights of the peaks are not meaningful. The emergence of a third peak in the presence of Mg2+, however, is worth noting. This population reflects partially unbound ATP (primarily from the receptor though not Mg2+, and in fewer instances the other way around). As the time-traces in Figure 2—figure supplement 1A illustrate, ATP often rebinds fully after populating this state. That is, Mg2+ and the receptor cooperate to hold on to ATP and slow down its dissociation.
Figure 3 with 3 supplements
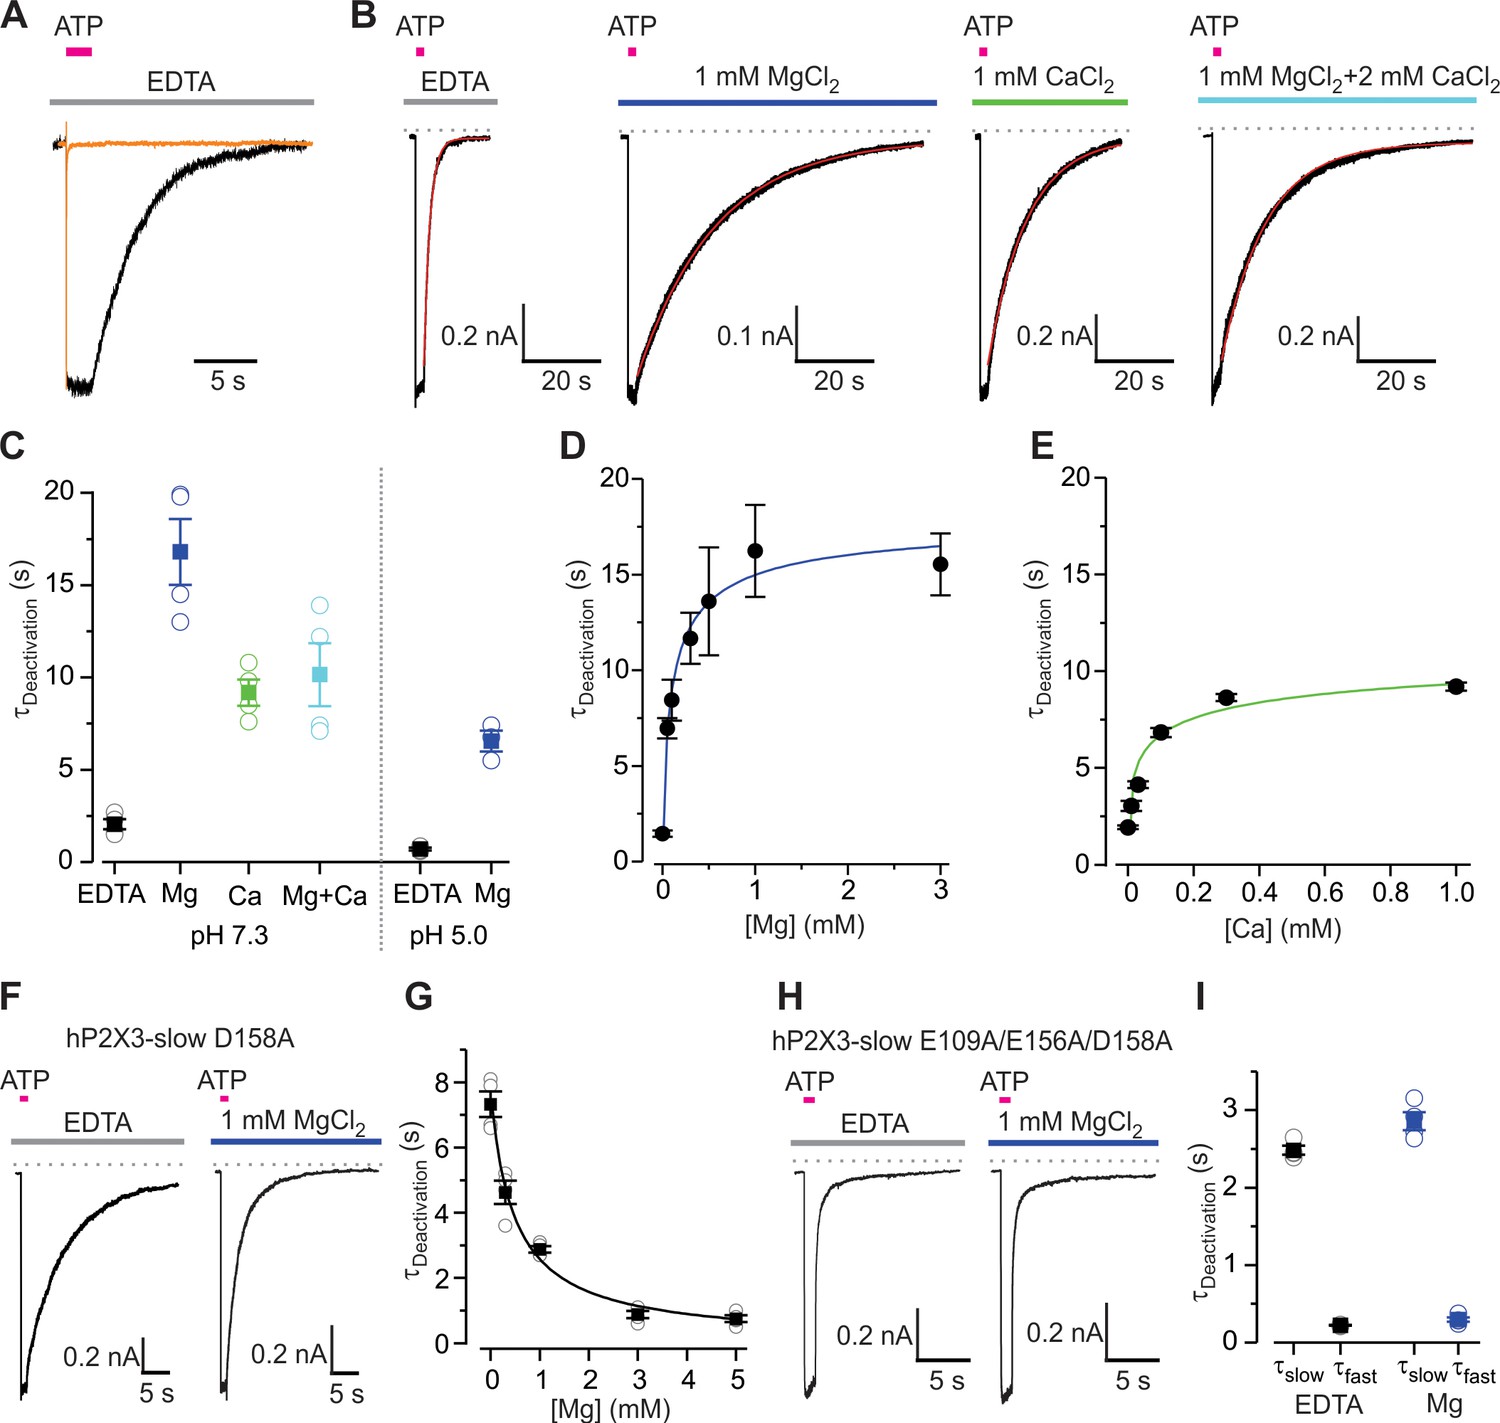
Mg2+ and Ca2+ slow deactivation of hP2X3 receptors.
(A) Superimposed fast-desensitizing hP2X3 wt (orange) and slow-desensitizing hP2X3 slow (black) macroscopic receptor channel currents activated by extracellular application of a saturating concentration of free ATP (10 µM) in the presence of EDTA (10 mM). (B) hP2X3 slow receptor channel currents activated by ATP (10 μM) were recorded in different extracellular divalent cation concentrations at pH 7.3 and shown on the same time scale. A single exponential function was fit to current deactivation and fits are shown in red, superimposed with the currents in black. (C) Summary of deactivation time constants in the absence and presence of different divalent cations at neutral or acidic pH, with individual cells shown in open symbols and filled symbols representing the mean and error bars S.E.M. (n = 4 for each). (D and E) Concentration-response relations for divalent cation slowing hP2X3 slow channel deactivation at pH 7.3. Each data point is the mean ± S.E.M. with n = 3. The Hill equation was fit to the data in D (Mg2+) with EC50 = 102 ± 56 μM and nH = 0.7 ± 0.3, and to the data in E (Ca2+) with EC50 = 39 ± 6 μM and nH = 0.5 ± 0.4. (F) 100 μM ATP activated macroscopic currents for D158A hP2X3 slow were recorded in the absence or presence of MgCl2. (G) Deactivation time constants obtained from single exponential fits to current decay recorded after removing ATP in the absence and presence of Mg2+ at different concentrations. Filled symbols are the mean ± S.E.M. with n = 4, individual measurements are shown as open symbols. The Hill equation was fit to the data (EC50 = 482 ± 106 μM, nH = 0.9). (H) 300 μM ATP activated macroscopic currents for the E109A/E156A/D158A hP2X3 slow triple mutant were recorded in the absence or presence of MgCl2. (I) Deactivation time constants obtained from double exponential fits to current deactivation. Filled symbols are the mean ± S.E.M. with n = 4, individual measurements are shown as open symbols.
Figure 3—figure supplement 1
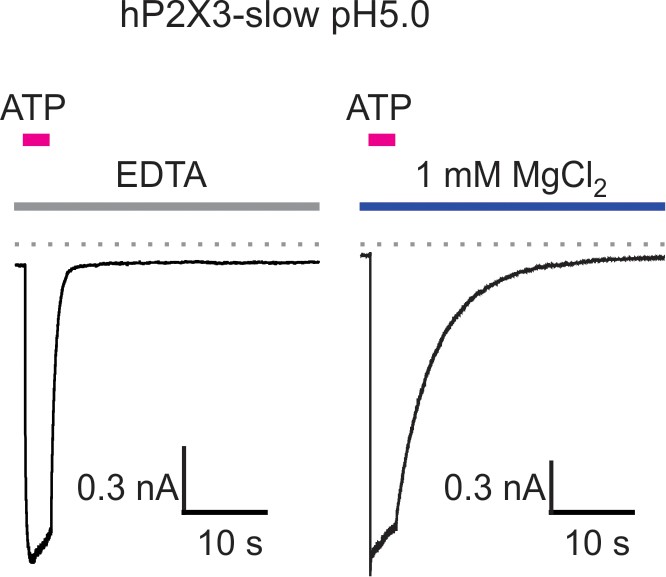
Mg2+ slows deactivation of hP2X3 slow receptor channel currents at acid pH.
Macroscopic hP2X3 slow receptor channel currents activated by 100 μM ATP in the presence of EDTA (10 mM; left) or MgCl2 (right) at pH 5. Similar results were obtained from four different cells and the calculated deactivation time constants are shown in Figure 3C.
Figure 3—figure supplement 2
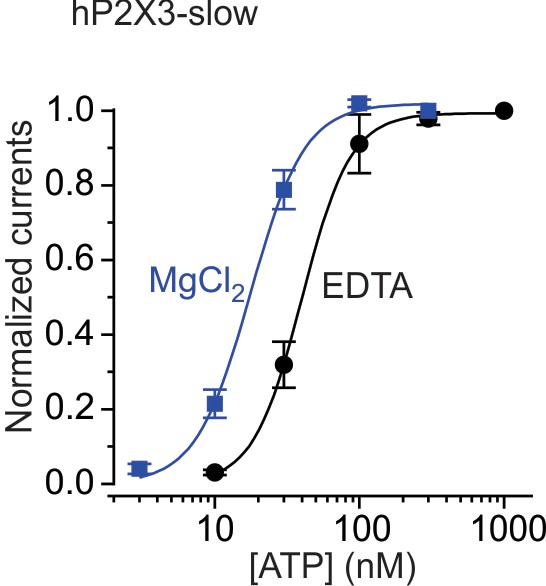
Mg2+ increases the apparent affinity for activation of hP2X3 slow receptor channels by ATP.
Concentration-response relations for ATP activation of hP2X3 slow receptor channels in the absence and presence of 0.5 mM MgCl2. In each case, currents were normalized to the maximal current in the absence or presence of Mg2+, with n = 4 and error bars representing the S.E.M. Smooth curves are fits of the Hill equation to the data. Mg2+ shifts EC50 for activation from 40.0 ± 0.8 nM (nH = 2.6 ± 0.1) to 17.6 ± 0.9 nM (nH = 2.3 ± 0.2).
Figure 3—figure supplement 3
Effects of Mg2+ on single mutations in the lower or upper modes within the divalent cation binding chamber.
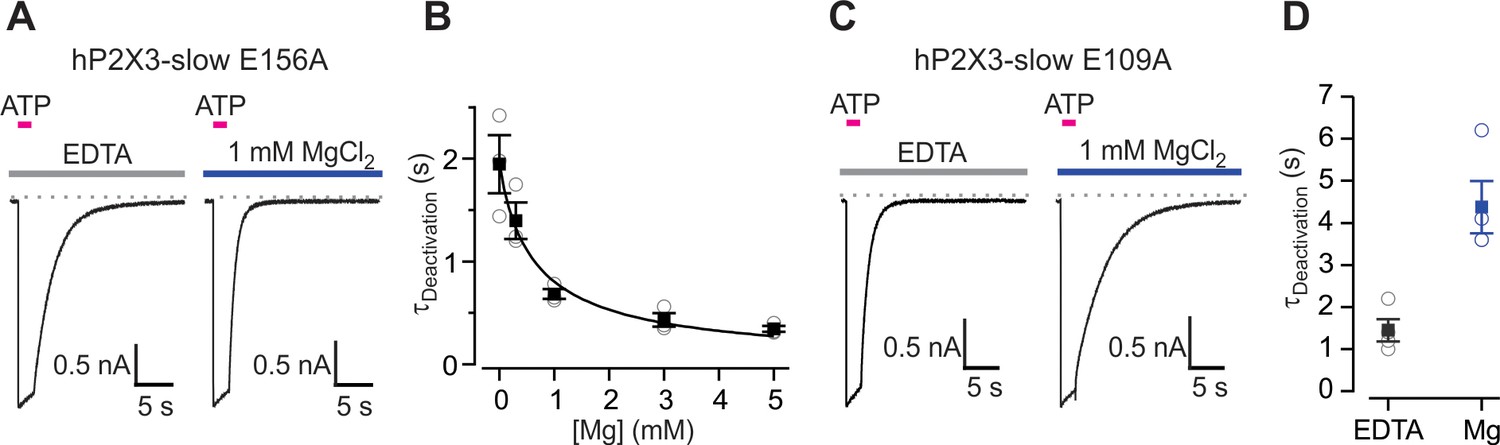
(A) 100 μM ATP activated macroscopic ATP-activated currents for E156A hP2X3 slow recorded in the presence of 10 mM EDTA (10 mM; left) or MgCl2 (right). (B) Deactivation time constants obtained by fitting single exponential functions to the current decay following ATP removal in the absence and presence of Mg2+ at different concentrations. Filled symbols are the mean ± S.E.M. with n = 3, individual measurements are shown as open symbols. The Hill equation was fit the data (EC50 = 657 ± 158 μM, nH = 0.9). (C) 100 μM ATP activated macroscopic E109A hP2X3 slow receptor channel currents in the presence of EDTA (10 mM; left) or MgCl2. (D) Deactivation time constants obtained from single exponential fits to current decay following ATP removal from the extracellular solution. Filled symbols are the mean ± S.E.M. with n = 4, individual measurements are shown as open symbols.
Figure 4 with 1 supplement
Influence of Mg2+ and Ca2+ on desensitization of hP2X3 receptor channels.
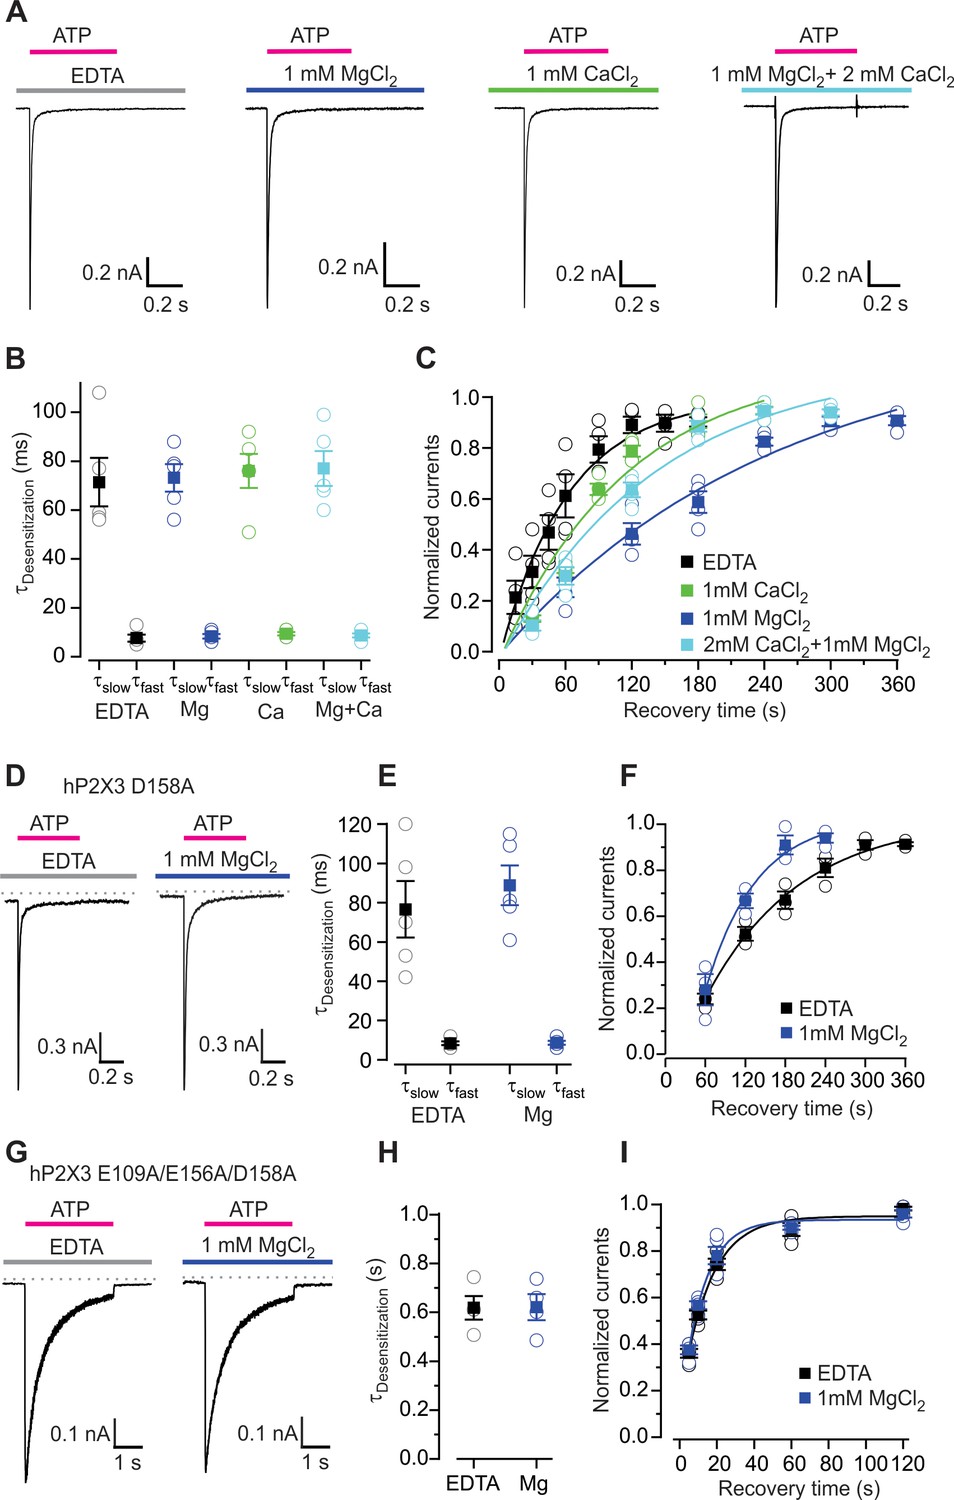
(A) Macroscopic wt hP2X3 receptor channel currents activated by a saturating concentration of ATP (300 μM) under different conditions. (B) Summary of desensitization time constants obtained by double exponential fits of desensitizing currents in the absence and presence of Mg2+ or Ca2+, with individual cells shown in open symbols and mean values in filled symbols, with error bars representing S.E.M. (n = 5 for each). (C) Time courses for recovery from desensitization of hP2X3 receptor channels in the absence and presence of divalent cations. Responses were normalized to the amplitude of current activated by the first application of a saturating concentration of ATP (300 µM) for 500 ms (n = 4). Smooth lines are single exponential fits to the time courses with τ = 63 ± 8 s for EDTA, τ = 248 ± 71 s for Mg2+, τ = 115 ± 42 s for Ca2+ and τ = 140 ± 44 s for Mg2+ plus Ca2+. (D) 300 μM ATP activated macroscopic currents for D158A were recorded in the absence or presence of MgCl2. (E) Desensitization time constants obtained by fitting a double exponential function to the current decay during ATP (100 µM) application with individual cells shown in open symbols and mean values in filled symbols, with error bars representing S.E.M. (n = 5 for each). (F) Time courses for recovery from desensitization obtained as in panel C (n = 3). Smooth lines are single exponential fits to the time courses with τ = 140 ± 21 s for EDTA and τ = 76 ± 25 s for Mg2+. (G) ATP activated macroscopic currents recorded for the E109A/E156A/D158A triple mutant were recorded in response to 1 mM ATP in the absence or presence of MgCl2. (H) Desensitization time constants obtained by single exponential fits to the current decay during ATP (1 mM) application with individual cells shown in open symbols and mean values in filled symbols, with error bars representing S.E.M. (n = 4 for each). (I) Time courses for recovery from desensitization obtained as in panel C (n = 5). Smooth lines are single exponential fits to the time courses with τ = 15 ± 3 s for EDTA and τ = 12 ± 2 s for Mg2+.
Figure 4—figure supplement 1| A
Triple mutation in the Mg2+ binding chamber eliminates inhibition caused by Mg2+.
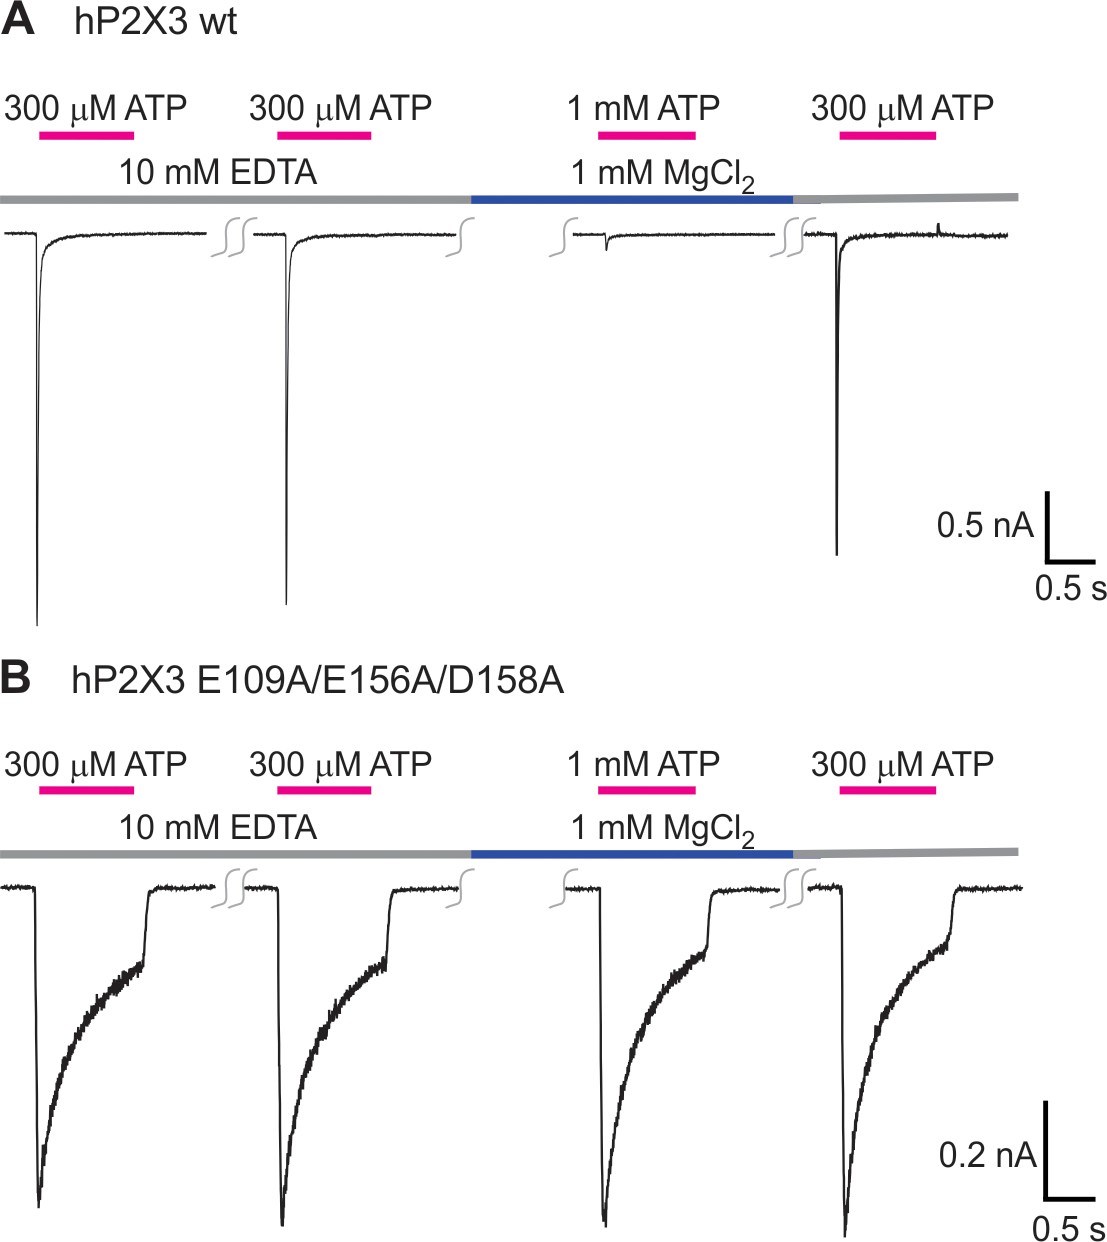
A) Mg2+ can inhibit wt hP2X3 receptor channels when applied during repetitive activation of the channel by ATP. ATP was applied every 2 min. In four cells, Mg2+ inhibited current activation by 93 ± 2% when compared to the last application of free ATP. (B) Mg2+ has no discernable effect on the E109A/E156A/D158A triple mutant. In five cells, there is 103 ± 3% current after Mg2+ application when compared to the last application of free ATP.
Figure 5 with 3 supplements
The divalent cation binding chamber is critical for Mg2+-ATP activation.
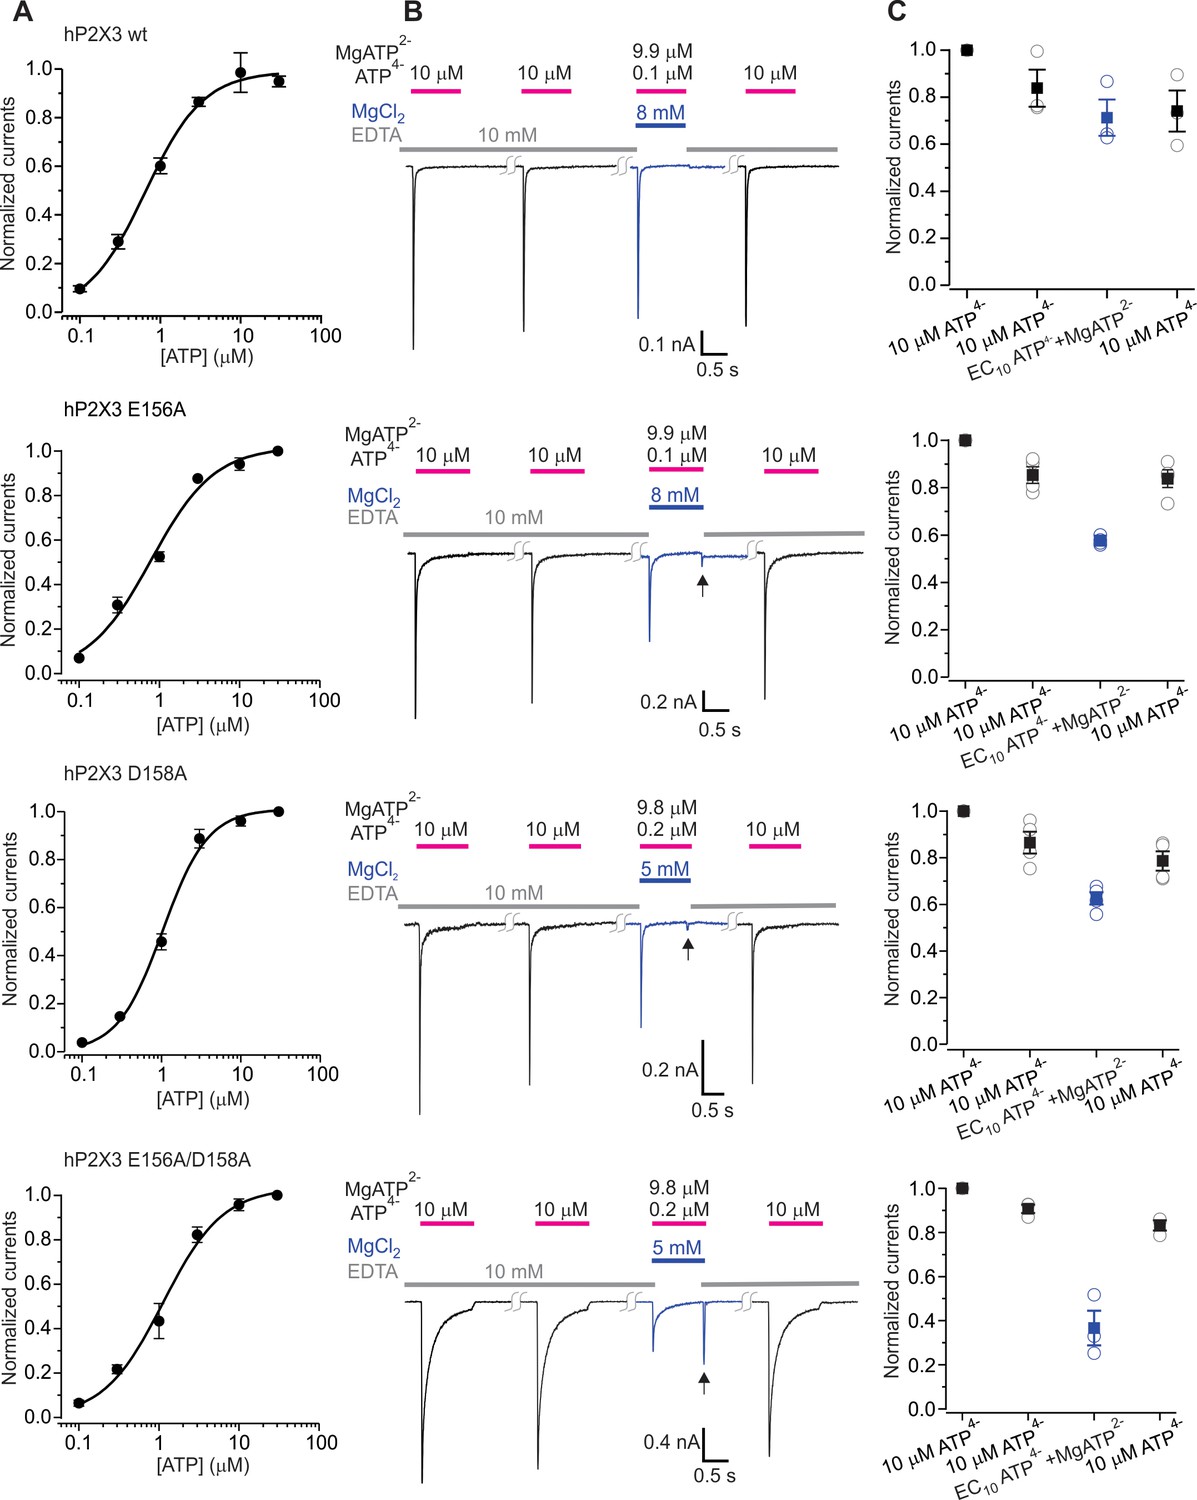
(A) Concentration-response relations for ATP activation of wt hP2X3, E156A, D158A and the E156A/D158A double mutant in divalent-free solution. Each data point is the mean of four measurements (± S.E.M.). Smooth lines are fits of the Hill equation to the data where EC50 and nH are 0.7 ± 0.1 μM and 1.2 ± 0.1 for wt hP2X3, 0.8 ± 0.1 μM and 1.1 ± 0.2 for E156A, 1.0 ± 0.1 μM and 1.5 ± 0.2 for D158A and 1.1 ± 0.2 μM and 1.2 ± 0.2 for E156A/D158A. (B) Macroscopic currents activated with solutions containing either a saturating concentration of free ATP or one containing mostly Mg2+-ATP plus an EC10 quantity of free ATP for wt hP2X3, E156A, D158A or the E156A/D158 double mutant. The first applications of free ATP at 2 min intervals were used to estimate the extent of rundown between consecutive applications of ATP. Note the resurgent current (black arrows) for E156A, D158A and the E156A/D158A double mutant upon removal of Mg2+-ATP solution. (C) Summary of currents in response to each ATP application, normalized to the amplitude of the first. Open symbols are individual cells and fill symbols are the mean, with error bars representing S.E.M. (n = 3 for wt and the double mutant and n = 4 for all others).
Figure 5—figure supplement 1
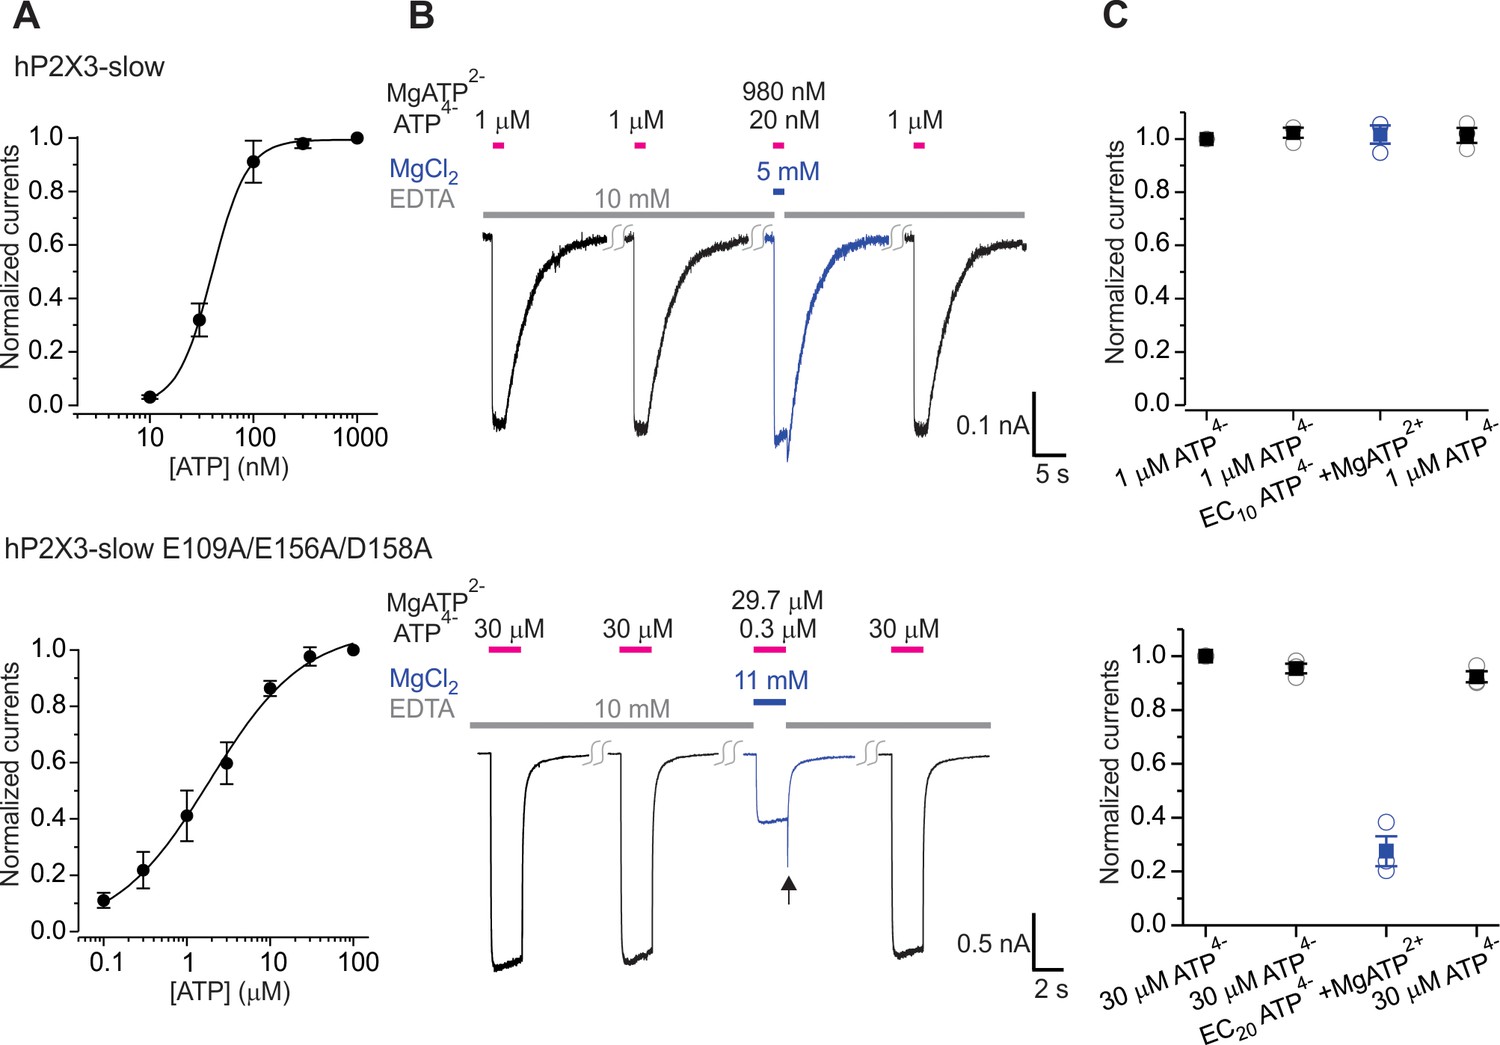
The divalent cation binding chamber is critical for Mg-ATP activation of hP2X3 slow.
A) Concentration-response relations for ATP activation of hP2X3 slow and with the E109A/E156A/D158A triple mutant. Each data point is an average of four measurements. Smooth lines are fits of the Hill equation to the data where EC50 and nH are 40.0 ± 0.8 nM and 2.6 ± 0.1 for hP2X3 slow and 1.9 ± 0.3 μM and 0.8 ± 0.1 for hP2X3 slow containing the E109A/E156A/D158A triple mutant. (B) Macroscopic currents activated with solutions containing either a saturating concentration of free ATP or one containing mostly MgATP plus an EC10 quantity of free ATP for hP2X3 slow and the E109A/E156A/D158 triple mutant of hP2X3 slow. The first applications of free ATP at 2 min intervals were used to estimate the extent of rundown between consecutive applications of ATP. Same protocol as in Figure 5. Note the resurgent currents (black arrow) for the triple mutant upon removal of Mg-ATP solution. (C) Summary of currents in response to each ATP application, normalized to the amplitude of the first. Open symbols are individual cells and fill symbols the mean, with error bars representing S.E.M. (n = 3).
Figure 5—figure supplement 2
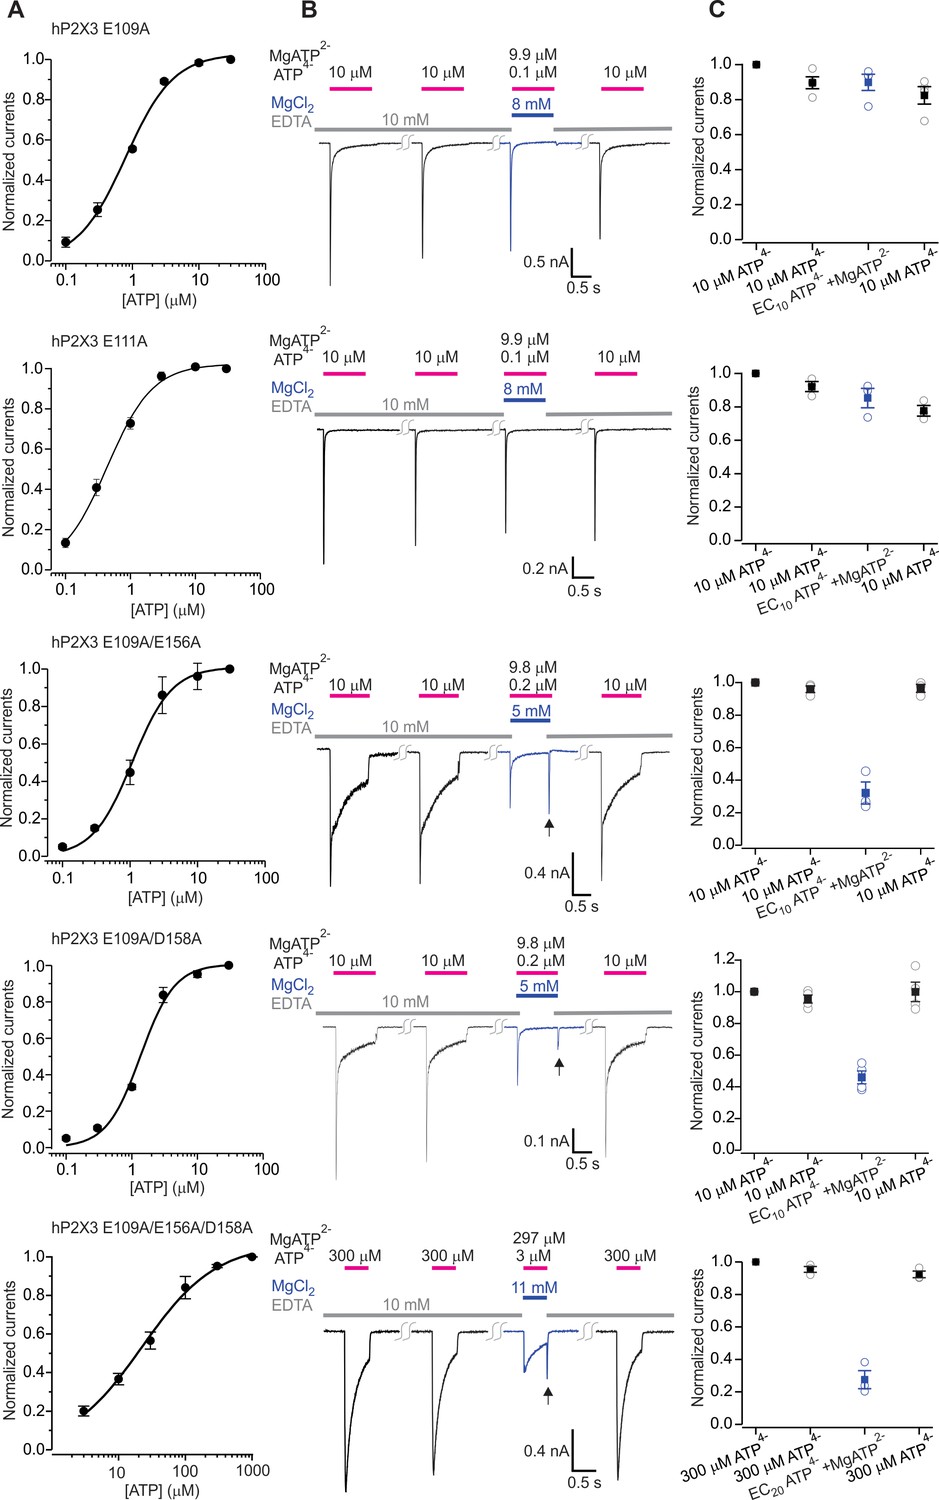
The divalent cation binding chamber is critical for Mg-ATP activation of hP2X3.
A) Concentration-response relations for ATP activation of hP2X3 E109A, E109A/E156A, E109A/D158A and the E109A/E156A/D158A triple mutant in divalent-free solution. Each data point is an mean of four measurements (± S.E.M.). Smooth lines are fits of the Hill equation to the data where EC50 and nH are 0.8 ± 0.1 μM and 1.2 ± 0.1 for E109A, 1.1 ± 0.1 μM and 1.5 ± 0.2 for E109A/E156A, 1.4 ± 0.2 μM and 1.7 ± 0.4 for E109A/D158A and 22.5 ± 3.3 μM and 0.8 ± 0.1 for E109A/E156A/D158A. (B) Macroscopic currents activated with solutions containing either a saturating concentration of free ATP or one containing mostly MgATP plus an EC10 or EC20 quantity of free ATP for hP2X3 E109A, E109A/E156A, E109A/D158A or the E109A/E156A/D158 triple mutant. The first applications of free ATP at 2 min intervals were used to estimate the extent of rundown between consecutive applications of ATP. Note the resurgent currents (black arrows) for both double mutants and the triple mutant upon removal of Mg-ATP solution. (C) Summary of currents in response to each ATP application, normalized to the amplitude of the first. Open symbols are individual cells and fill symbols the mean, with error bars representing S.E.M. (n = 3 for E109A/E156A and E109A/E156A/D158A, and n = 4 for all others).
Figure 5—figure supplement 3
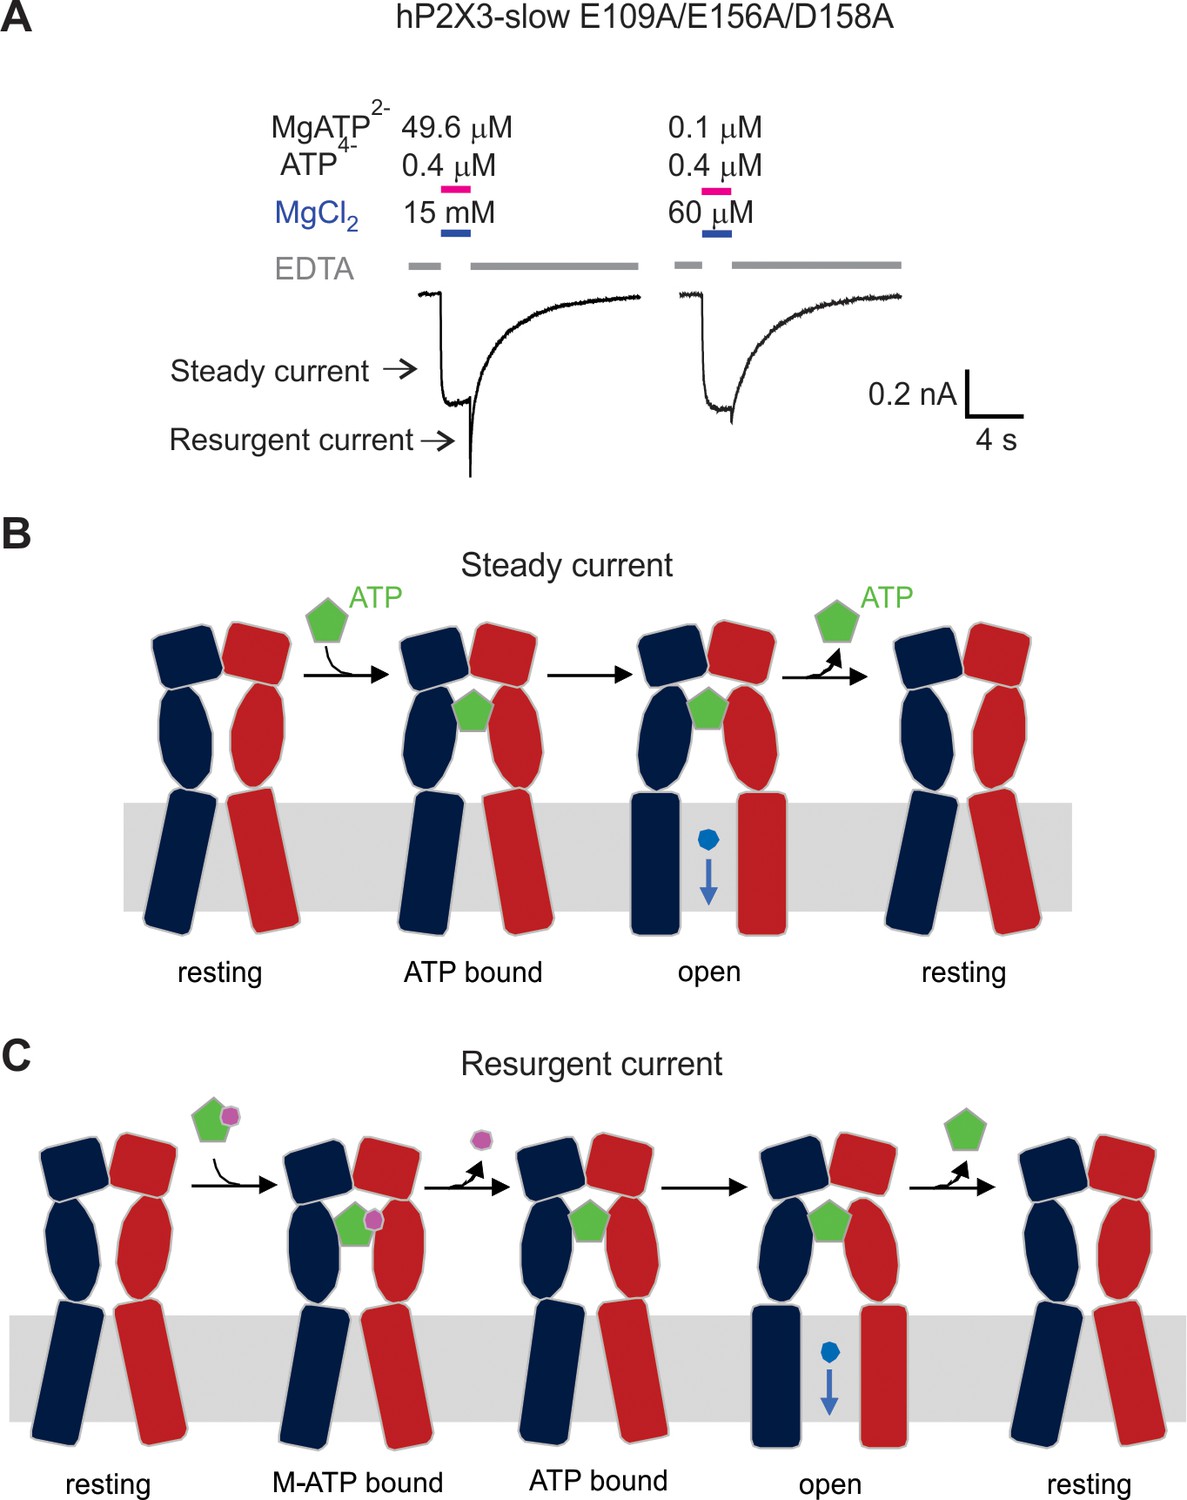
Mg2+-ATP can bind but not activate hP2X3 slow receptors when the acidic chamber is mutated.
A) hP2X3 slow currents activated by 0.4 μM ATP4− and two different concentrations of Mg2+-ATP. EDTA solution was applied to the cell between the ATP application. Resurgent current marked with an arrow is significantly larger with 49.6 μM Mg2+-ATP because Mg2+-ATP binds but does not effectively activate the receptor when the acidic chamber has been mutated. Similar results were observed from three cells. (B) Schematic illustration to show activation of hP2X3 slow E109A/E156A/D158A receptor channels by free ATP (the steady current). (C) Schematic illustration to show the mechanism of resurgent current. M-ATP (Mg2+-ATP or Ca2+-ATP) can bind to the triple mutant but does not effectively promote opening. Upon removing M-ATP from solution, the M ion unbinds more rapidly than ATP leading to transient activation by free ATP until free ATP unbinds.
Figure 6
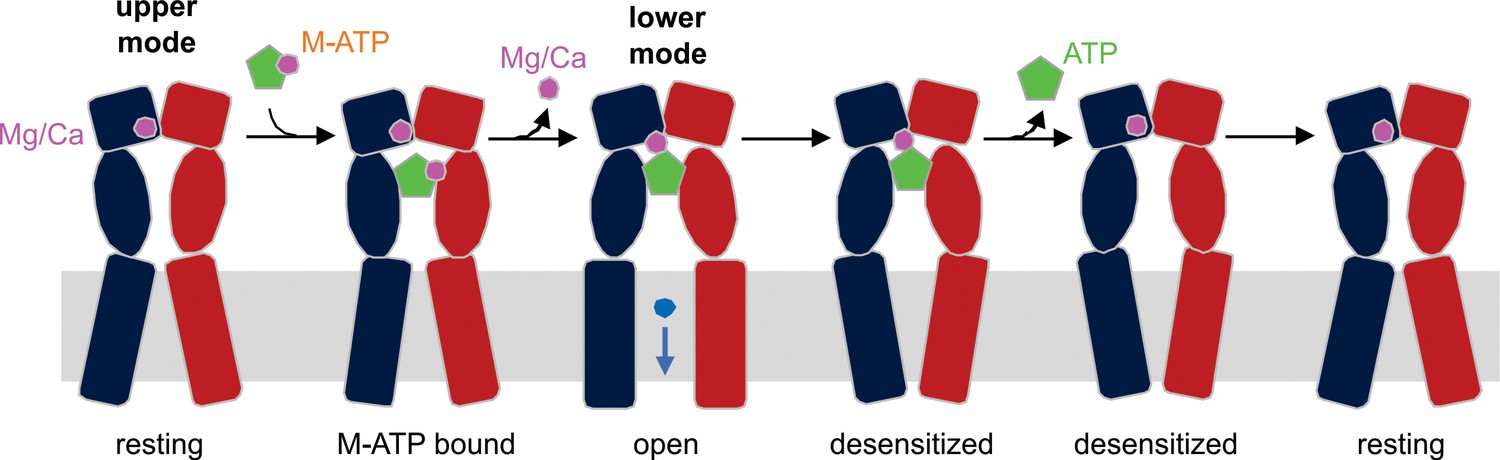
Schematic illustration of the mechanism of Mg2+-ATP/Ca2+-ATP activation of P2X3 receptor channels.
Mg2+ or Ca2+ binds to hP2X3 receptors in the upper mode under physiological conditions. When ATP divalent cation complex (M-ATP) enters the nucleotide binding pocket, a divalent cation will rapidly dissociate, leaving one to be coordinated by the γ-phosphate of ATP and residues E156 and D158. The divalent cation sandwiched between ATP and receptor strengthens the effective ATP-receptor interaction, and also fosters re-binding of ATP molecules that become transiently dislodged from the nucleotide-binding pocket, rendering a very slow recovery from desensitization for hP2X3 receptors. Only two of three subunits of a hP2X3 receptor are shown for clarity.
Videos
Video 1
Close-up of the binding site for ATP-Mg2+ in P2X3, in the ATP-bound state, in a representative simulation snapshot (same as Figure 2E and Figure 2—figure supplement 2E).
Residue numbers are indicated in Figure 2—figure supplement 3.
Video 2
Close-up of the binding site for ATP-Mg2+ in P2X3, in the ATP-dissociated state, in a representative simulation snapshot (same as Figure 2F and Figure 2—figure supplement 2F).
Residue numbers are indicated in Figure 2—figure supplement 2F.
Additional files
-
Supplementary file 1
Data collection, phasing and refinement statistics.
- https://doi.org/10.7554/eLife.47060.021
-
Transparent reporting form
- https://doi.org/10.7554/eLife.47060.022
Download links
A two-part list of links to download the article, or parts of the article, in various formats.
Downloads (link to download the article as PDF)
Open citations (links to open the citations from this article in various online reference manager services)
Cite this article (links to download the citations from this article in formats compatible with various reference manager tools)
Molecular mechanisms of human P2X3 receptor channel activation and modulation by divalent cation bound ATP
eLife 8:e47060.
https://doi.org/10.7554/eLife.47060


