Epithelial geometry regulates spindle orientation and progenitor fate during formation of the mammalian epidermis
- Princeton University, United States
Figures
Figure 1 with 2 supplements
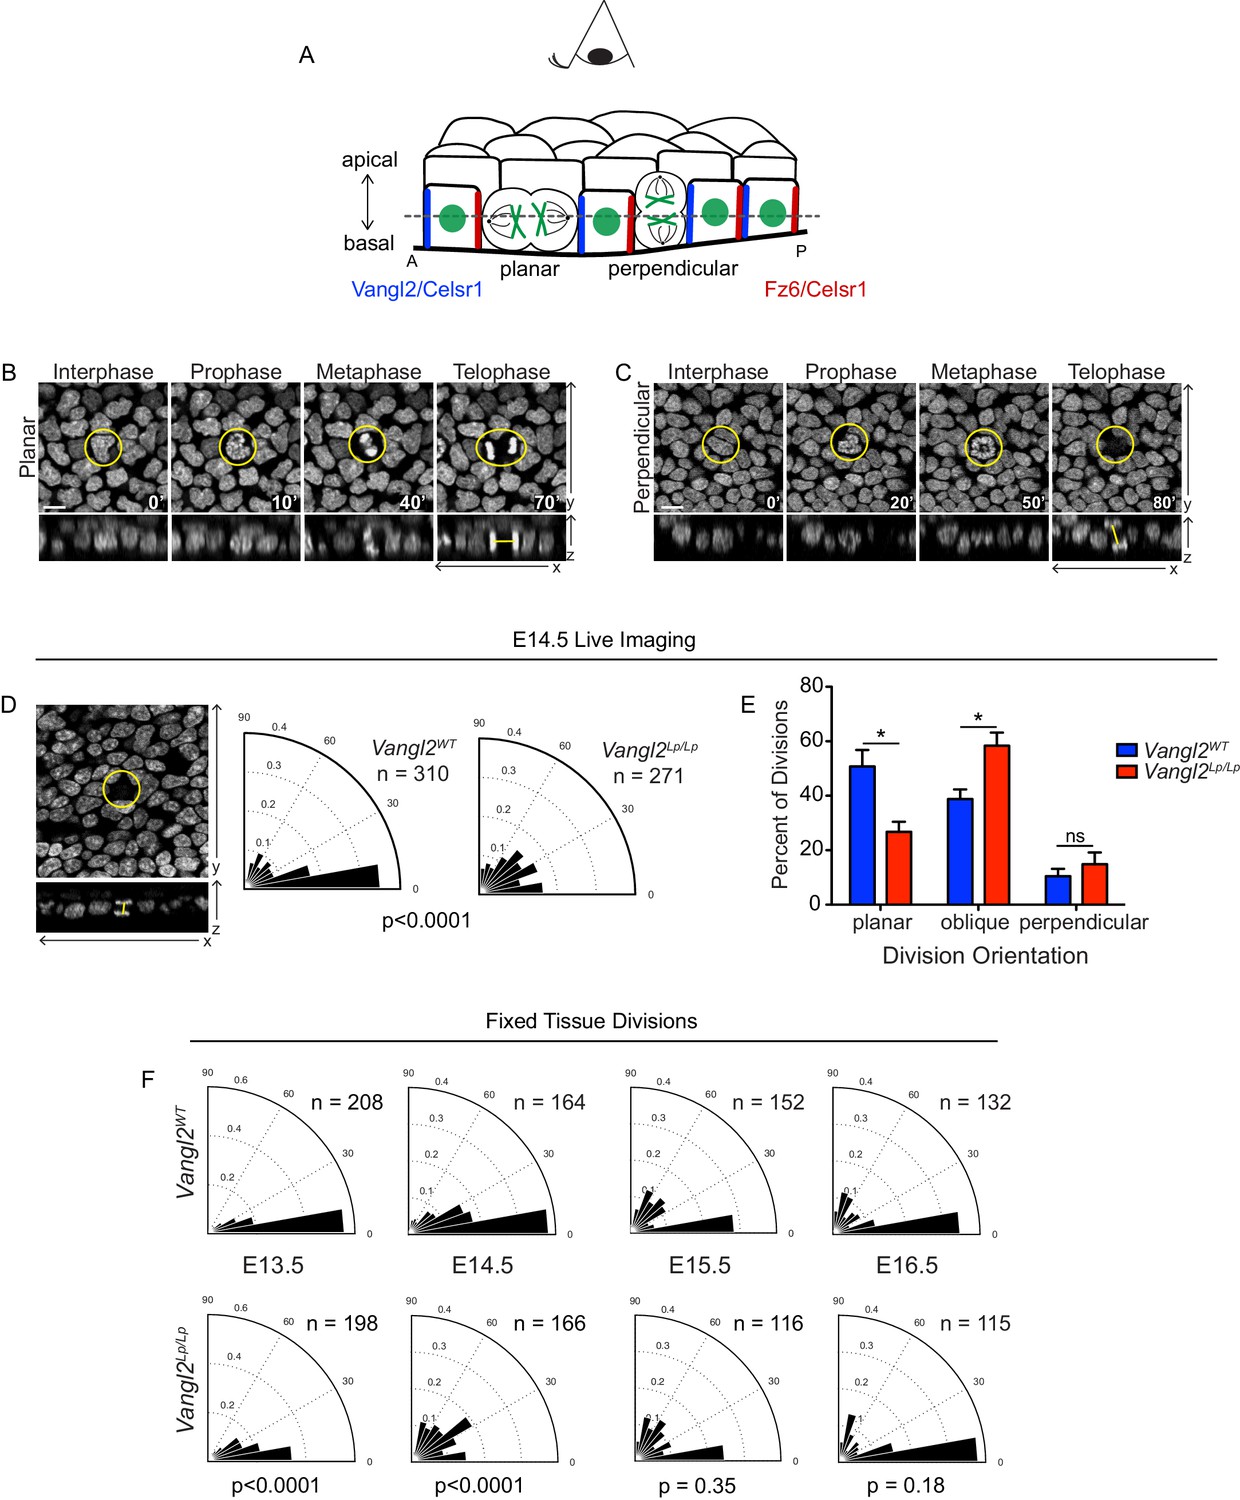
Basal cell division orientations in wildtype and Vangl2 mutant embryos.
(A) Schematic of E14.5 skin depicting several planar cell polarity components and example division orientations. Dotted line represents focal plane for live imaging. (B,C) Stills from time-lapse movies of Vangl2WT E14.5 skin explants expressing K14-H2B-GFP, showing examples of planar (B) and perpendicular (C) division orientations. Top panels are the planar view of the basal layer of the epidermis, bottom panels are XZ dimension. Scale bar = 10 μm. See also Figure 1—video 1 and Figure 1—video 2. (D) Example and quantification of division angles in live epidermal explants at E14.5. Vangl2WT, n = 310 divisions pooled from three embryos. Vangl2Lp/Lp, n = 271 divisions from three embryos. Modified Kuiper’s Test, p=1.7523e-15. (E) Distribution of division orientations in live epidermal explants at E14.5. Planar: Θ <= 20°, unpaired two-tailed t-test p=0.027; oblique: 20°>Θ>=70°, p=0.030; perpendicular: 70°>Θ>=90°, p=0.427. n = 3 explants from each genotype. (F) Angular frequency of division angles quantified from fixed whole mount skins dissected from embryos e13.5 – e16.5. E13.5: Vangl2WT, n = 208 divisions from three embryos; Vangl2Lp/Lp, n = 198 divisions from two embryos; p=2.8648e-08. E14.5: Vangl2WT, n = 164 divisions from three embryos; Vangl2Lp/Lp, n = 166 divisions from three embryos; p=1.5118e-18. E15.5: Vangl2WT, n = 152 divisions from three embryos; Vangl2Lp/Lp, n = 116 divisions from three embryos; p=0.3482. E16.5: Vangl2WT, n = 132 divisions from three embryos; Vangl2Lp/Lp, n = 115 divisions from three embryos; p=0.1785.
Figure 1—video 1
Planar view of a basal cell from an E14.5 Vangl2WT skin explant expressing K14-H2B-GFP undergoing a planar division.
https://doi.org/10.7554/eLife.47102.003
Figure 1—video 2
Example from an E14.5 Vangl2Lp/Lp skin explant expressing K14-H2B-GFP showing a basal cell undergoing a perpendicular division.
Top panel is planar view, bottom panel is XZ dimension.
Figure 2
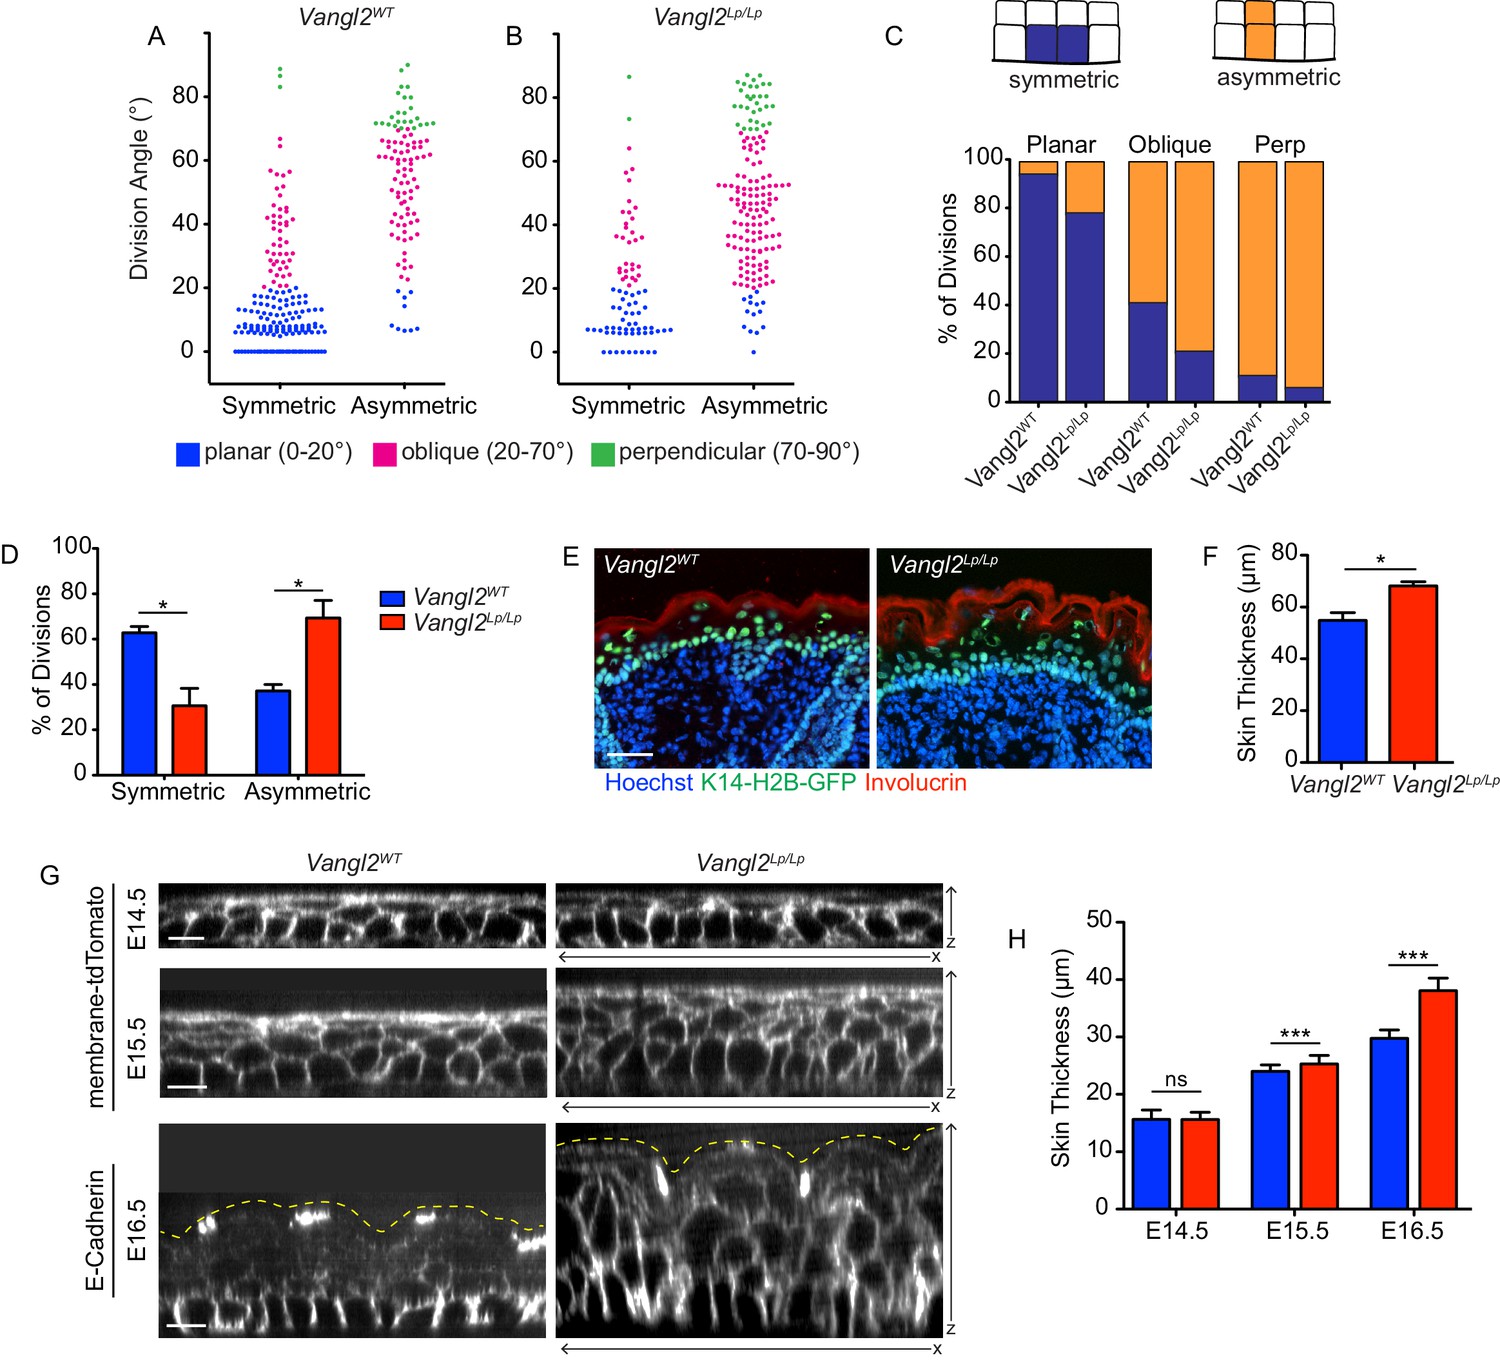
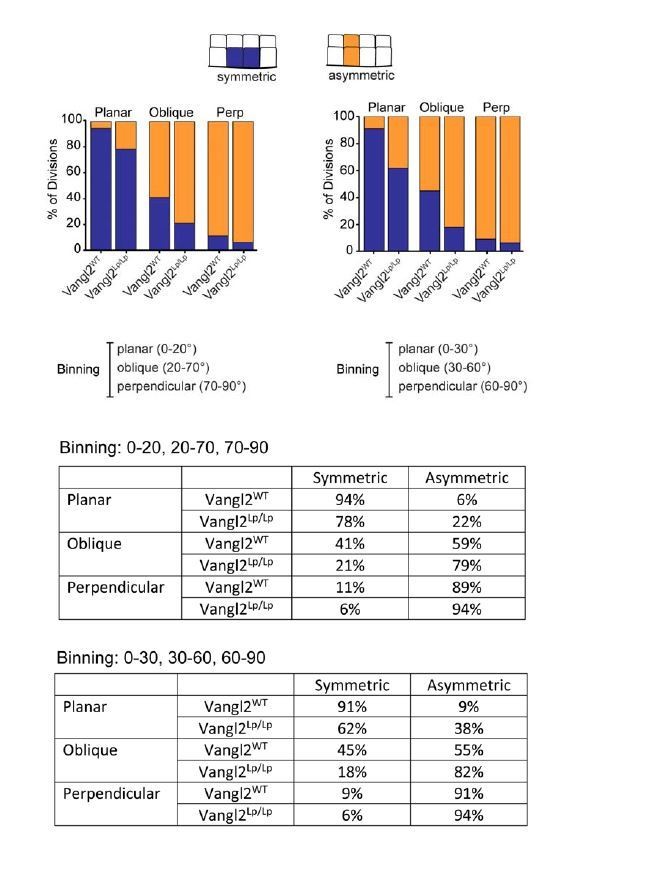
Positional cell fates correlate with division orientation.
(A, B) The relationship between division angle and final cell positions. Daughter cells were followed for 1.5 hr after cell division, and assigned a positional fate: symmetric or asymmetric. Each dot represents a single division event. (C) Representation of the same data in (A,B), showing the distribution of fates for each division orientation. For planar divisions: symmetric fates = 94% [Vangl2WT], 78% [Vangl2Lp/Lp]. Oblique divisions: symmetric fates = 41% [Vangl2WT], 21% [Vangl2Lp/Lp]. Perpendicular divisions: asymmetric fates = 89% [Vangl2WT], 94% [Vangl2Lp/Lp]. (D) Combining all division orientations, Vangl2Lp/Lp embryos display an overall bias toward asymmetric final cell positions. Unpaired two-tailed t-test, p=0.017. For (A–D), n = 284 divisions pooled across three Vangl2WT embryos; n = 238 divisions pooled from three Vangl2Lp/Lp embryos. (E) Sagittal sections of E18.5 skin from Vangl2WT; K14-H2B-GFP and Vangl2Lp/Lp; K14-H2B-GFP embryos. Involucrin (red) labels the outer stratified layers and nuclei are labeled with Hoechst. Scale bar = 50 μm. (F) Quantification of skin thickness at E18.5. n = 10 images for each of three embryos per genotype. Bars represent means of the three embryos, error bars are SEM. Unpaired two-tailed t-test, p=0.017. (G) XZ panels from whole mount images of Vangl2WT and Vangl2 mutant skins at E14.5 – E16.5, expressing membrane-tdTomato or immunostained for E-Cadherin. Yellow dotted lines outline the outermost epidermal layer. Scale bars = 10 μm. (H) Quantification of skin thickness at E14.5 – E16.5. n = 30 measurements per genotype per stage. Bars represent means, error bars are SD. E14.5: unpaired two-tailed t-test, p=0.9340; E15.5: unpaired two-tailed t-test, p=0.0003; E16.5: unpaired two-tailed t-test, p<0.0001.
Figure 3 with 1 supplement
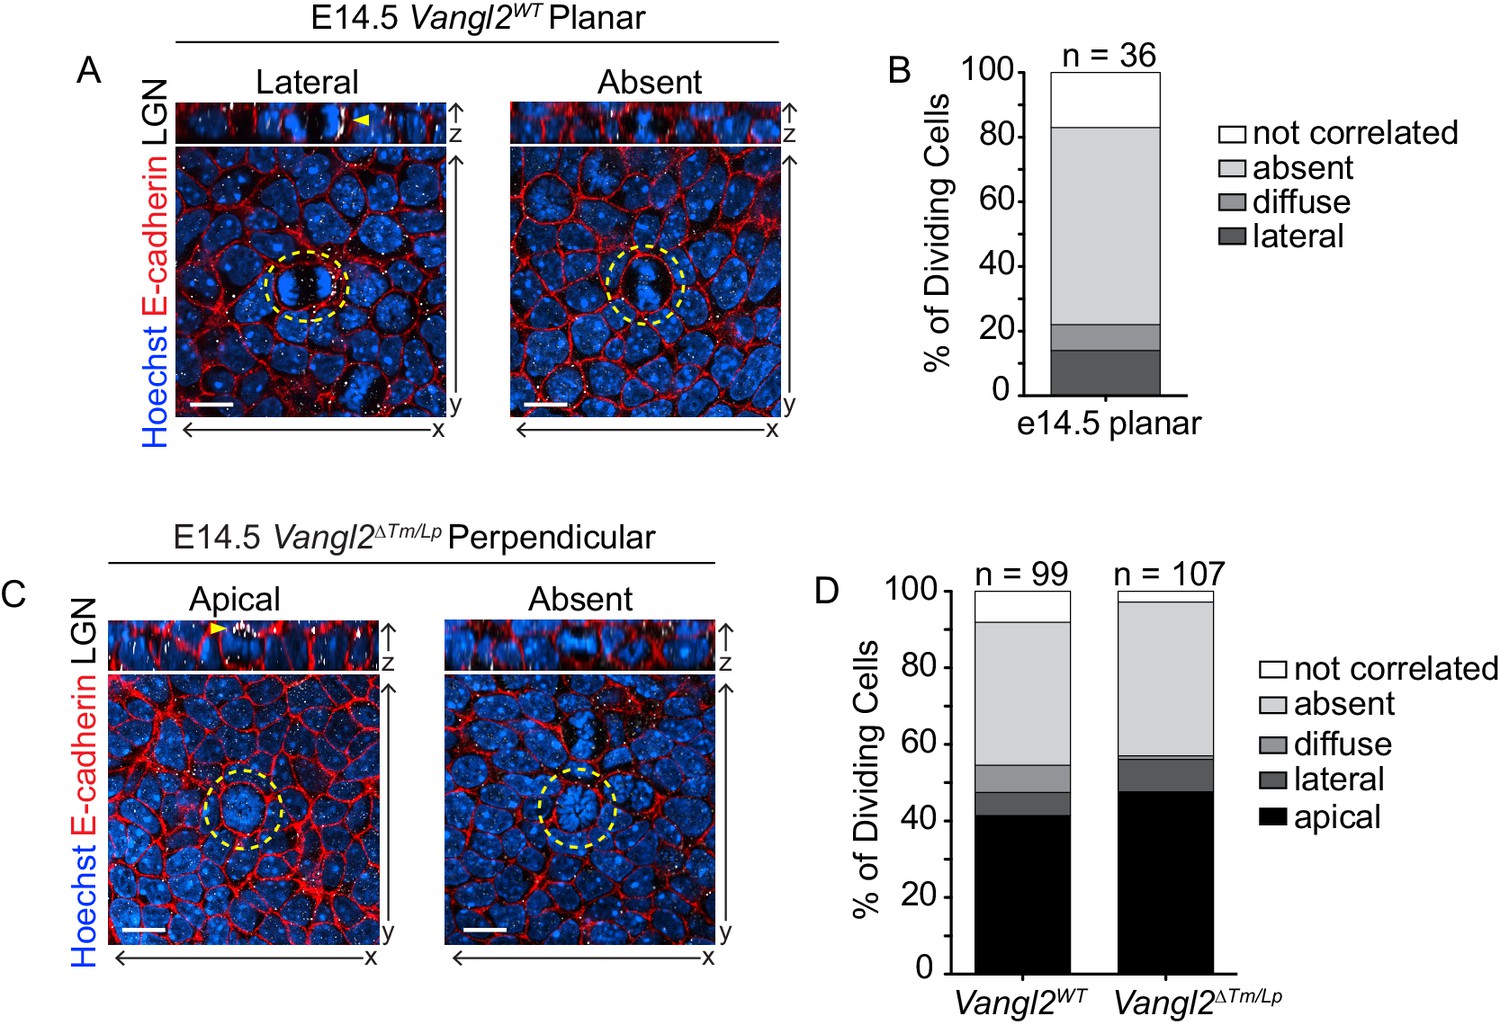
LGN localization does not determine planar division orientation.
(A) Examples from Vangl2WT embryos of cells dividing in a planar orientation with unilateral (left) and absent (right) LGN localization. In all images, Hoechst labels the nuclei, cell membranes are marked with E-Cadherin (red) and LGN is white. Yellow dashed lines outline the dividing cell, and yellow arrowheads mark LGN localization. (B) Frequency of LGN localization patterns in planar cell divisions in Vangl2WT embryos at E14.5. n = 36 cells (metaphase-telophase). ‘Not correlated’ LGN refers to a detectable signal that does not correlate with division plane (i.e., basal in a perpendicularly dividing cell). (C) Examples from Vangl2ΔTm/Lp embryos of cells dividing in a perpendicular orientation with apical (left) and absent (right) LGN. (D) Frequency of LGN localization patterns in all dividing cells in Vangl2WT and Vangl2ΔTm/Lp embryos at E14.5. n = 99 and 107 cells, respectively (metaphase-telophase). All scale bars = 10 μm.
Figure 3—figure supplement 1

Apical LGN localization at E16.5.
(A) Example image of apical LGN localization in a Vangl2WT E16.5 embryo. Shown is a mitotic cell in metaphase, poised to divide perpendicularly. In all images, Hoechst labels the nuclei, cell membranes are marked with E-Cadherin (red) and LGN is white. Yellow dashed lines outline the dividing cell, and yellow arrowheads mark LGN localization.
Figure 4 with 4 supplements
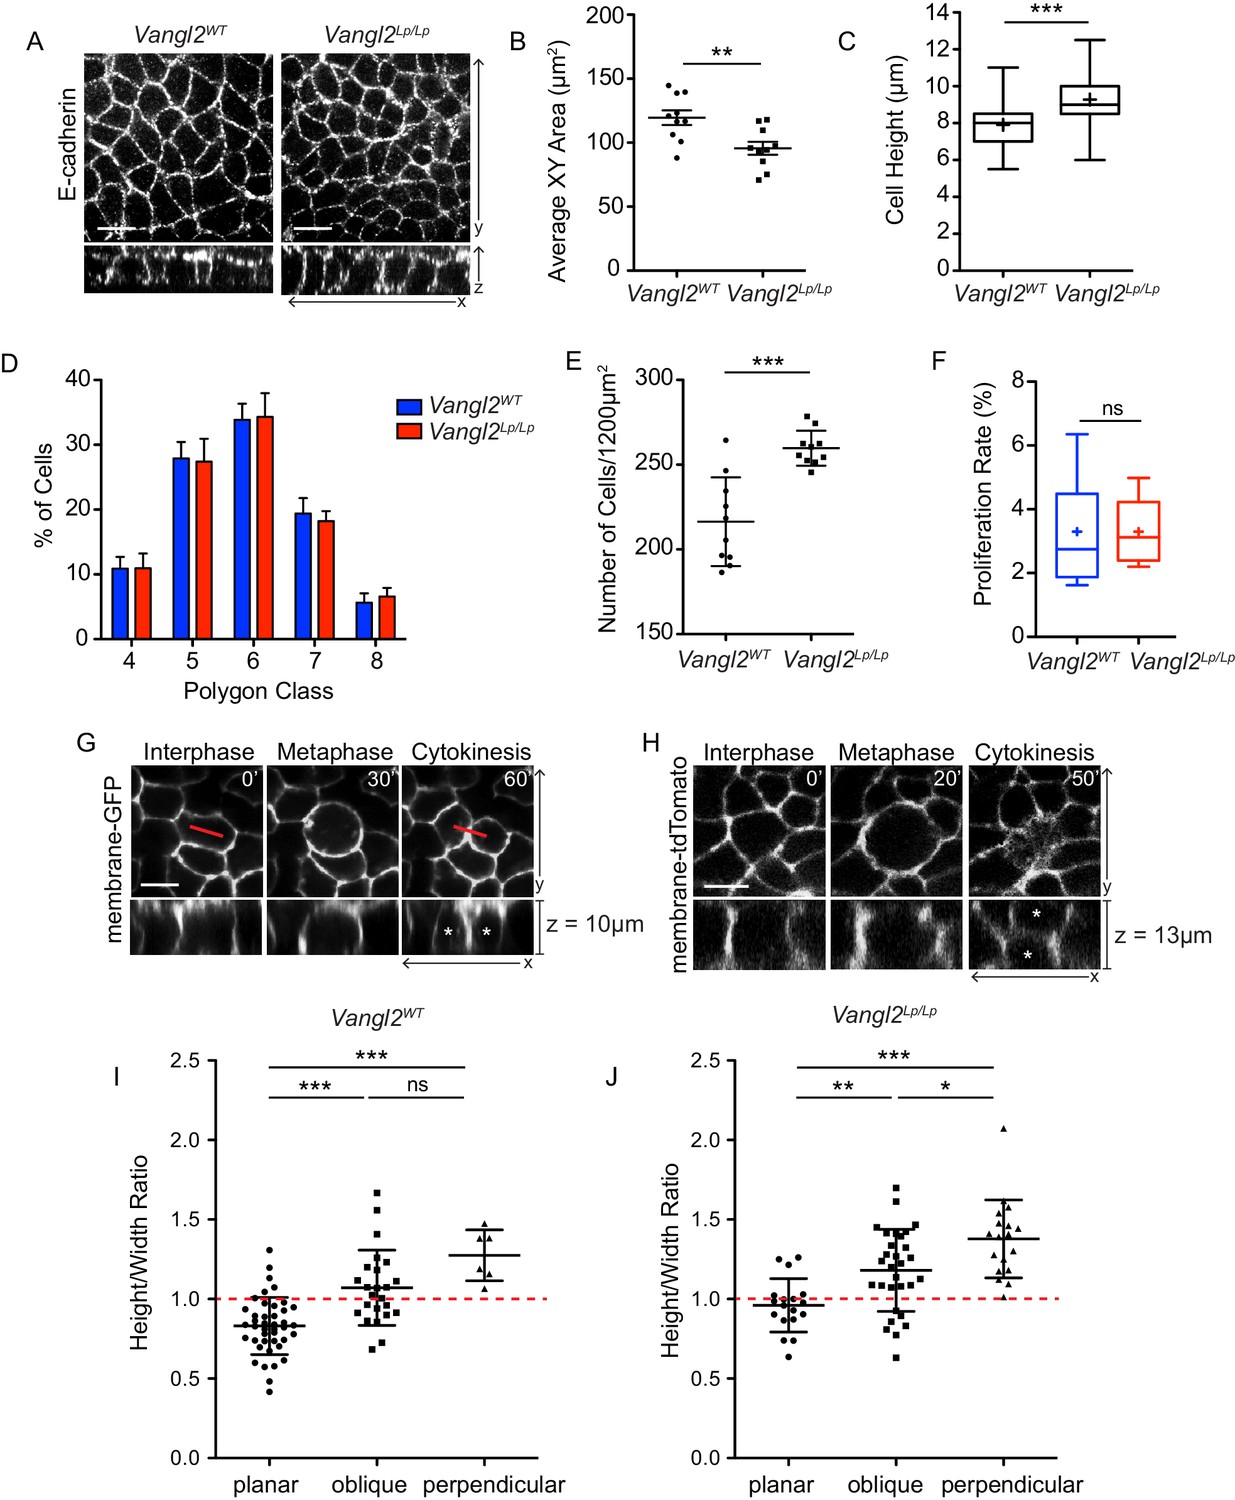
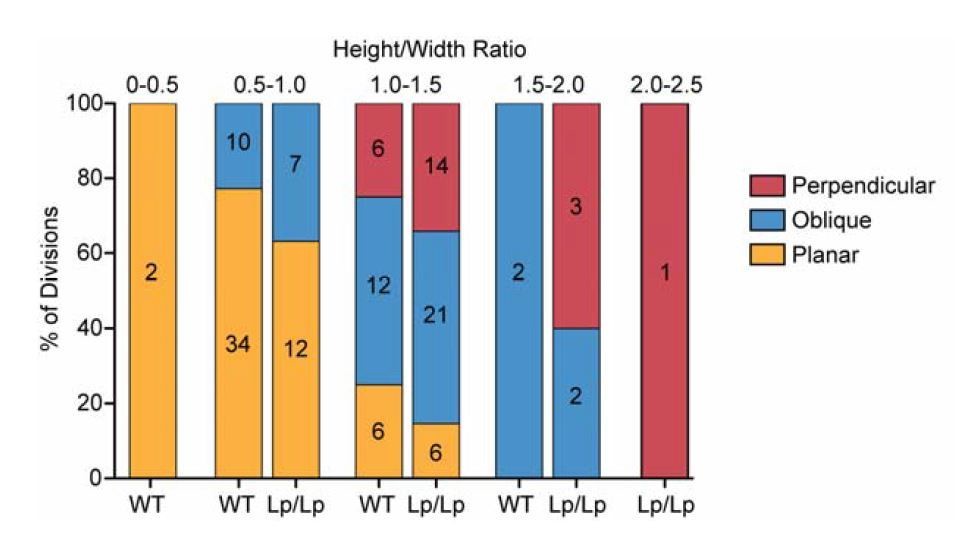
Cell division orientation correlates with basal cell geometry.
(A) Representative images of basal layer labeled with E-Cadherin from E14.5 Vangl2WT and Vangl2Lp/Lp embryos. (B) Quantification of cross sectional areas of basal cells. Each dot represents average area of all cells in a single field of view. n = 10 total fields of view from three embryos per genotype. Bars are mean with SEM. Unpaired two-tailed t-test, p=0.0057 (C) Quantification of cell height along apical-basal axis. 300 cells were measured from across three embryos per genotype. Whiskers indicate minimum and maximum values, + indicates the mean. Unpaired two-tailed t-test, p<0.0001. (D) Quantification of distribution of polygon classes, as defined by the number of each cell’s neighbors. n = 10 total fields of view from three embryos per genotype. Error bars denote SD. (E) Quantification of cell density, as number of cells per field of view (1200 μm2). Each dot represents a single field of view. n = 10 fields of view across three embryos per genotype. Bars are mean with SD. Unpaired two-tailed t-test, p=0.0001. (F) Proliferation rates, quantified as the number of mitotic cells in a field of view as a percentage of total number of cells. n = 10 fields of view across three embryos. Whiskers denote min-max values, mean shown as ‘+.’ Unpaired two-tailed t-test, p=0.9987. (G) Still images from a time-lapse movie of E14.5 Vangl2WT; K14-Cre; mTmG explant showing an example of a basal cell dividing within the plane of the epidermis, along its longest interphase axis. Red line denotes orientation of the longest XY axis of the cell. See also Figure 4—video 1. (H) Still images from a time-lapse movie of an E14.5 skin explant from Vangl2ΔTm/Lp; mTmG embryo showing a cell dividing in a perpendicular orientation. Daughter cells are marked with asterisks in the XZ view. See also Figure 4—video 2. (I,J) Relationship between height:width aspect ratio and division orientation. H:W ratios were measured from interphase cells at the time just before the onset of mitotic rounding. Width is defined as the longest planar axis of the cell. Each dot corresponds to a single division event, and divisions were binned according to the angle of the division plane in cytokinesis. Bars are mean with SD. (I) n = 72 divisions pooled from three E14.5 embryos. One-way ANOVA, p<0.0001. Tukey’s Multiple Comparison Test: planar vs oblique, p<0.05; planar vs perpendicular, p<0.05; oblique vs perpendicular, p>0.05. (J) n = 66 divisions from two E14.5 Vangl2ΔTm/Lp embryos. One-way ANOVA, p<0.0001. Tukey’s Multiple Comparison Test: planar vs oblique, p<0.05; planar vs perpendicular, p<0.05; oblique vs perpendicular, p<0.05. All scale bars = 10 μm.
Figure 4—figure supplement 1
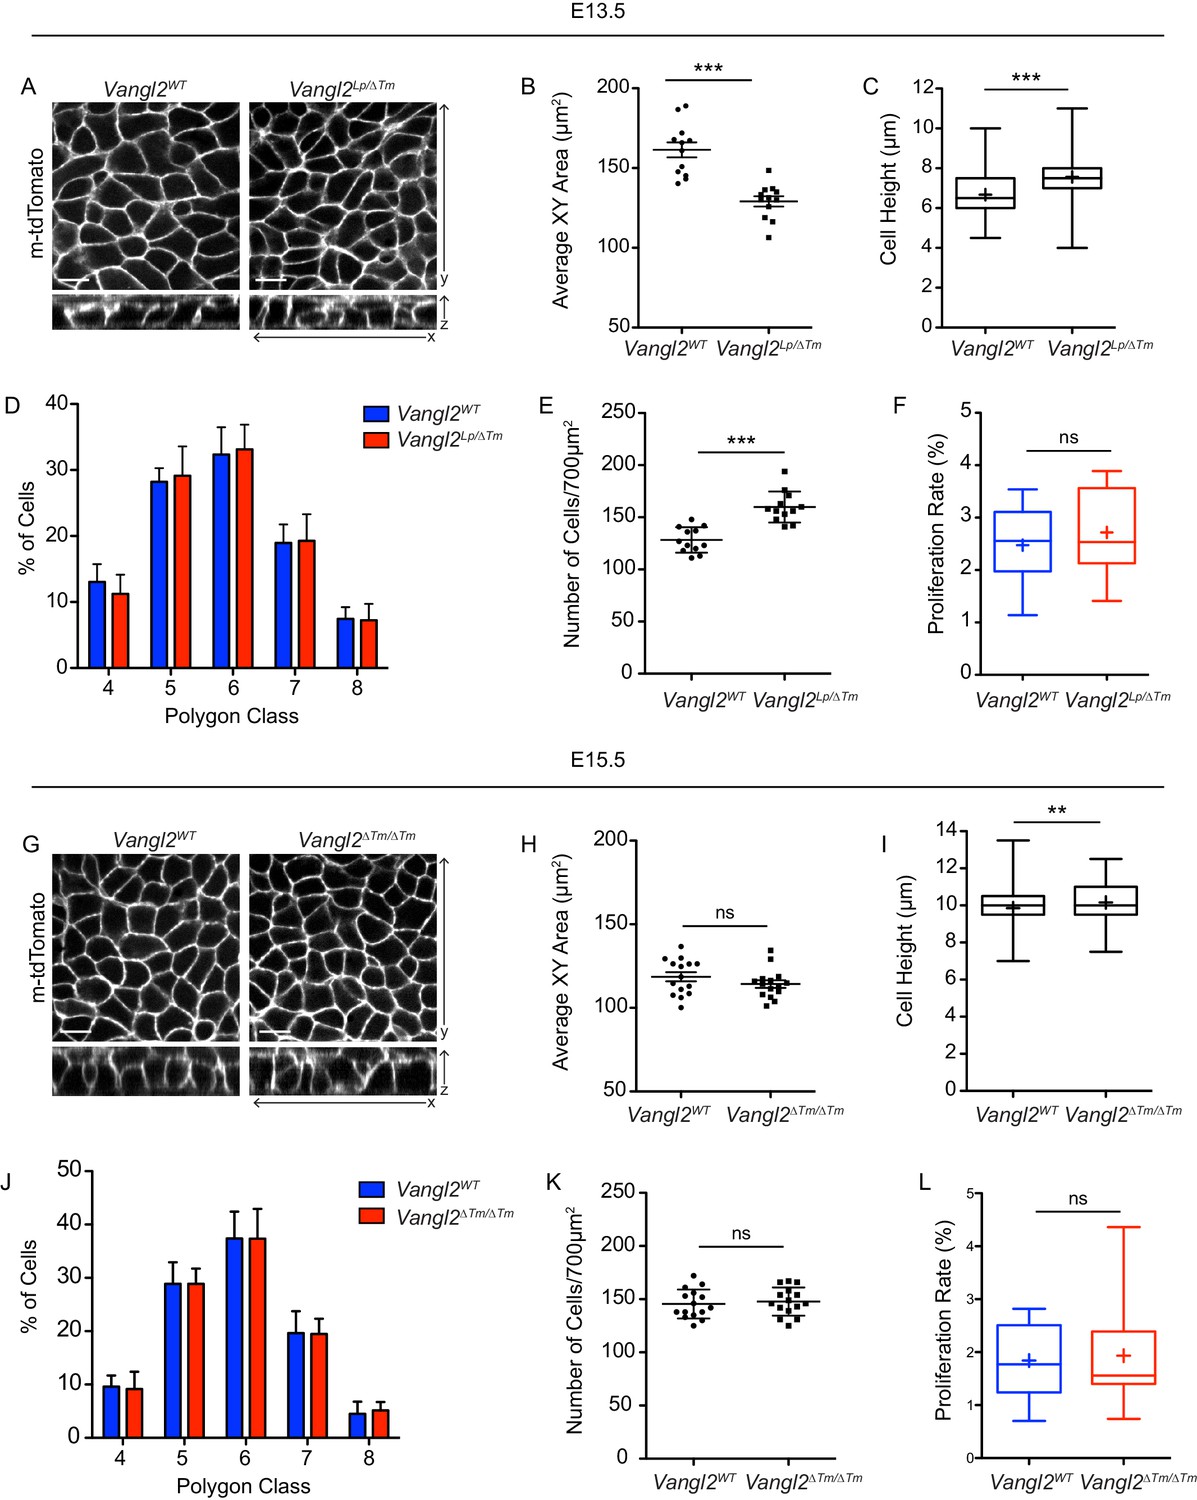
Characterization of epidermal cell shape and denisty at E13.5 and E15.5.
(A) Representative images of basal layer labeled with membrane-tdTomato from E13.5 Vangl2WT and Vangl2Lp/ΔTm embryos. (B) Quantification of cross sectional areas of basal cells. Each dot represents average area of all cells in a single field of view. n = 12 total fields of view from three Vangl2WT embryos and two Vangl2Lp/ΔTm embryos. Bars are mean with SEM. Unpaired two-tailed t-test, p<0.0001. (C) Quantification of cell height along apical-basal axis. n = 300 cells from across three Vangl2WT embryos and two Vangl2Lp/ΔTm embryos. Whiskers indicate minimum and maximum values, + indicates the mean. Unpaired two-tailed t-test, p<0.0001. (D) Quantification of distribution of polygon classes, as defined by the number of each cell’s neighbors. n = 12 fields of view per genotype. Error bars denote SD. (E) Quantification of cell density, as number of cells per field of view (700 μm2). Each dot represents a single field of view. n = 12 fields of view per genotype. Bars are mean with SD. Unpaired two-tailed t-test, p<0.0001. (F) Proliferation rates, quantified as the number of mitotic cells in a field of view as a percentage of total number of cells. n = 12 fields of view per genotype. Whiskers denote min-max values, mean shown as ‘+.’ Unpaired two-tailed t-test, p=0.4416. (G) Representative images of basal layer labeled with membrane-tdTomato from E15.5 Vangl2WT and Vangl2ΔTm/ΔTm embryos. (H) Quantification of cross sectional areas of basal cells. Each dot represents average area of all cells in a single field of view. n = 15 total fields of view from three embryos per genotype. Bars are mean with SEM. Unpaired two-tailed t-test, p=0.2314. (I) Quantification of cell height along apical-basal axis. n = 300 cells from across three embryos per genotype. Whiskers indicate minimum and maximum values, + indicates the mean. Unpaired two-tailed t-test, p<0.0001. (J) Quantification of distribution of polygon classes, as defined by the number of each cell’s neighbors. n = 15 fields of view per genotype. Error bars denote SD. (K) Quantification of cell density, as number of cells per field of view (700 μm2). Each dot represents a single field of view. n = 15 fields of view per genotype. Bars are mean with SD. Unpaired two-tailed t-test, p=0.6472. (L) Proliferation rates, quantified as the number of mitotic cells in a field of view as a percentage of total number of cells. n = 15 fields of view per genotype. Whiskers denote min-max values, mean shown as ‘+.’ Unpaired two-tailed t-test, p=0.7641. All scale bars = 10 μm.
Figure 4—figure supplement 2
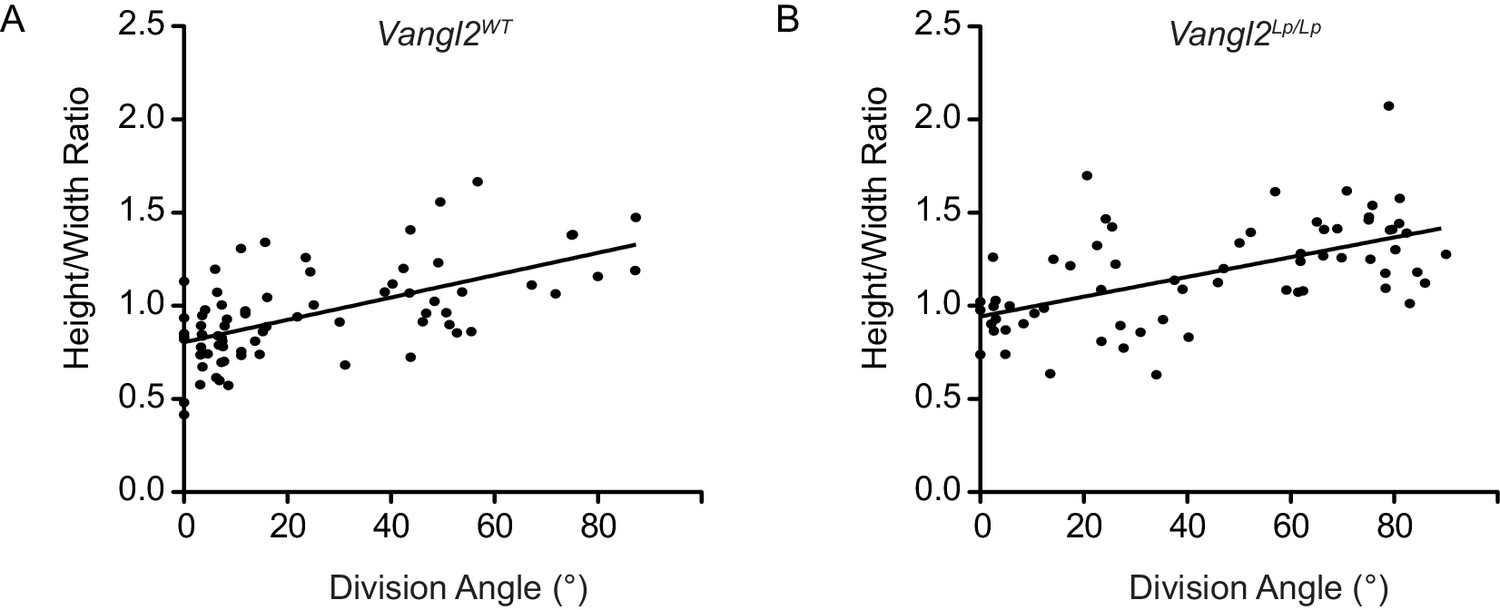
Correlation between division angle and height:width ratio.
(A) Relationship between division angle and height:width ratio in E14.5 Vangl2WT skin explants. Slope = 0.006090 ± 0.0009291; R2 = 0.3803. Pearson’s correlation coefficient R = 0.62. (B) Relationship between division angle and height:width ratio in E14.5 Vangl2Lp/ΔTm skin explants. Slope = 0.005308 ± 0.0009498; R2 = 0.3280. Pearson’s correlation coefficient R = 0.57.
Figure 4—video 1
Planar view of a basal cell from an E14.5 Vangl2WT skin explant expressing membrane-GFP, undergoing a planar cell division along its longest interphase axis.
The height:width aspect ratio of the dividing cell = 0.8.
Figure 4—video 2
Planar view of a basal cell from an E14.5 Vangl2ΔTm/Lp skin explant expressing membrane-tdTomato, undergoing a perpendicular cell division.
The dividing basal cell is elongated along its apical-basal axis. Height:width aspect ratio of the dividing cell = 1.38.
Figure 5 with 1 supplement
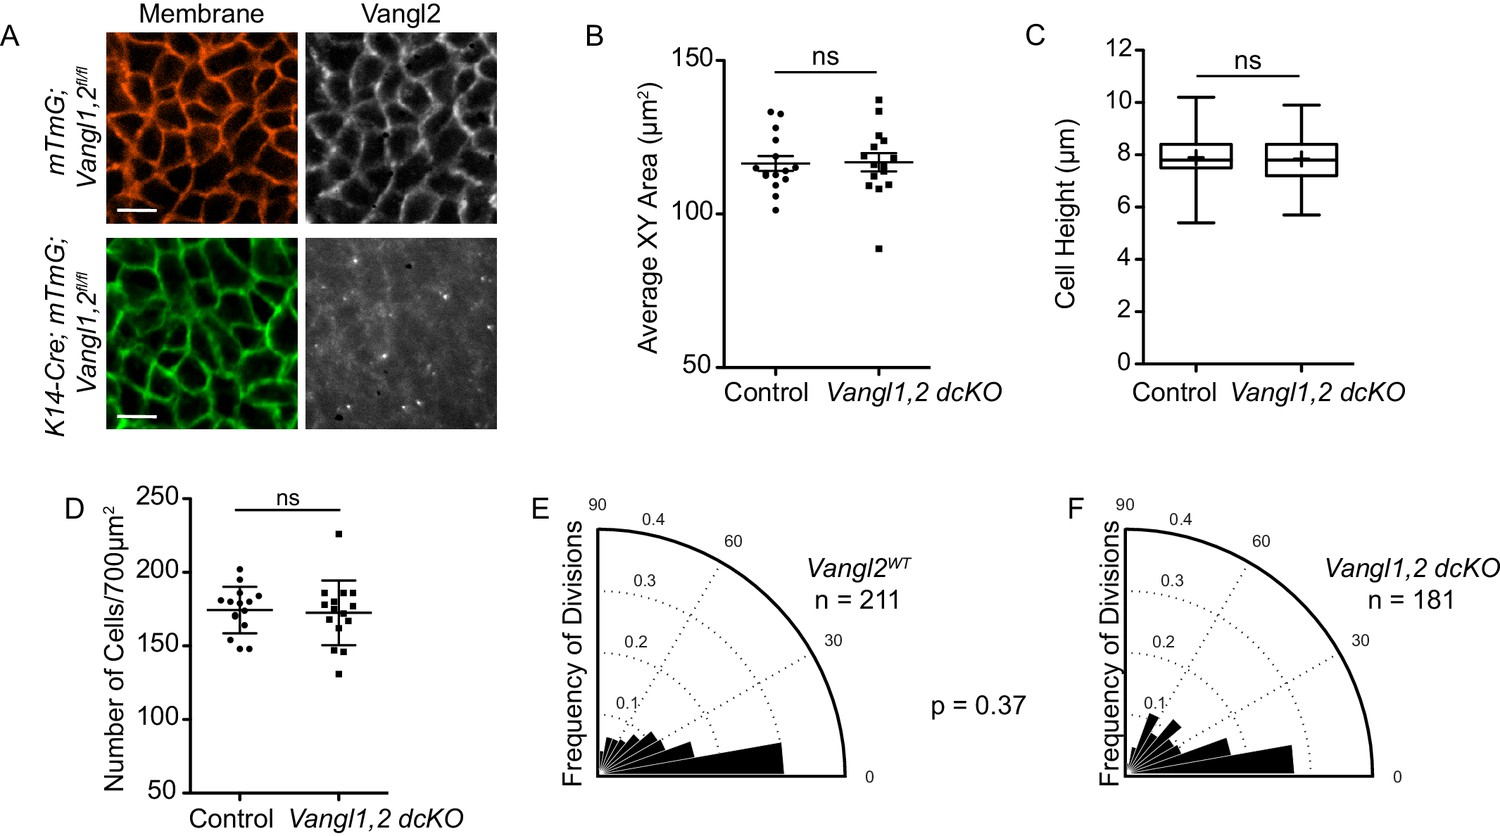
PCP mutants that undergo proper neural tube closure do not display altered cell shapes or division orientations.
(A) Representative images of the basal layer of Vangl1fl/fl; Vangl2fl/fl; mTmG control and Vangl1fl/fl, Vangl2fl/fl; K14-Cre; mTmG embryos. Brightness of Vangl2 panel in Vangl1fl/fl; Vangl2fl/fl; K14-Cre; mTmG was increased to show lack of Vangl2 staining. Scale bars = 10 μm. (B) Quantification of basal cell cross-sectional areas. Each dot represents average area of all cells in a single field of view. n = 15 fields of view across three embryos per genotype. Bars are mean with SEM. Unpaired two-tailed t-test, p=0.9209. (C) Quantification of cell height along apical-basal axis. n = 300 cells per genotype. Whiskers indicate minimum and maximum values, + indicates the mean. Unpaired two-tailed t-test, p=0.4209. (D) Quantification of cell density, as number of cells per field of view (700 μm2). Each dot represents a single field of view. n = 15 fields of view across three embryos per genotype. Bars are mean with SD. Unpaired two-tailed t-test, p=0.7840. (E) Division orientations in Vangl1fl/fl; Vangl2fl/fl; mTmG control embryos. n = 211 divisions, from 45 images across three embryos. (F) Division orientations in Vangl1fl/fl; Vangl2fl/fl; K14-Cre; mTmG embryos. n = 181 divisions, from 45 images across three embryos. Modified Kuiper’s Test, p=0.3743.
Figure 5—figure supplement 1
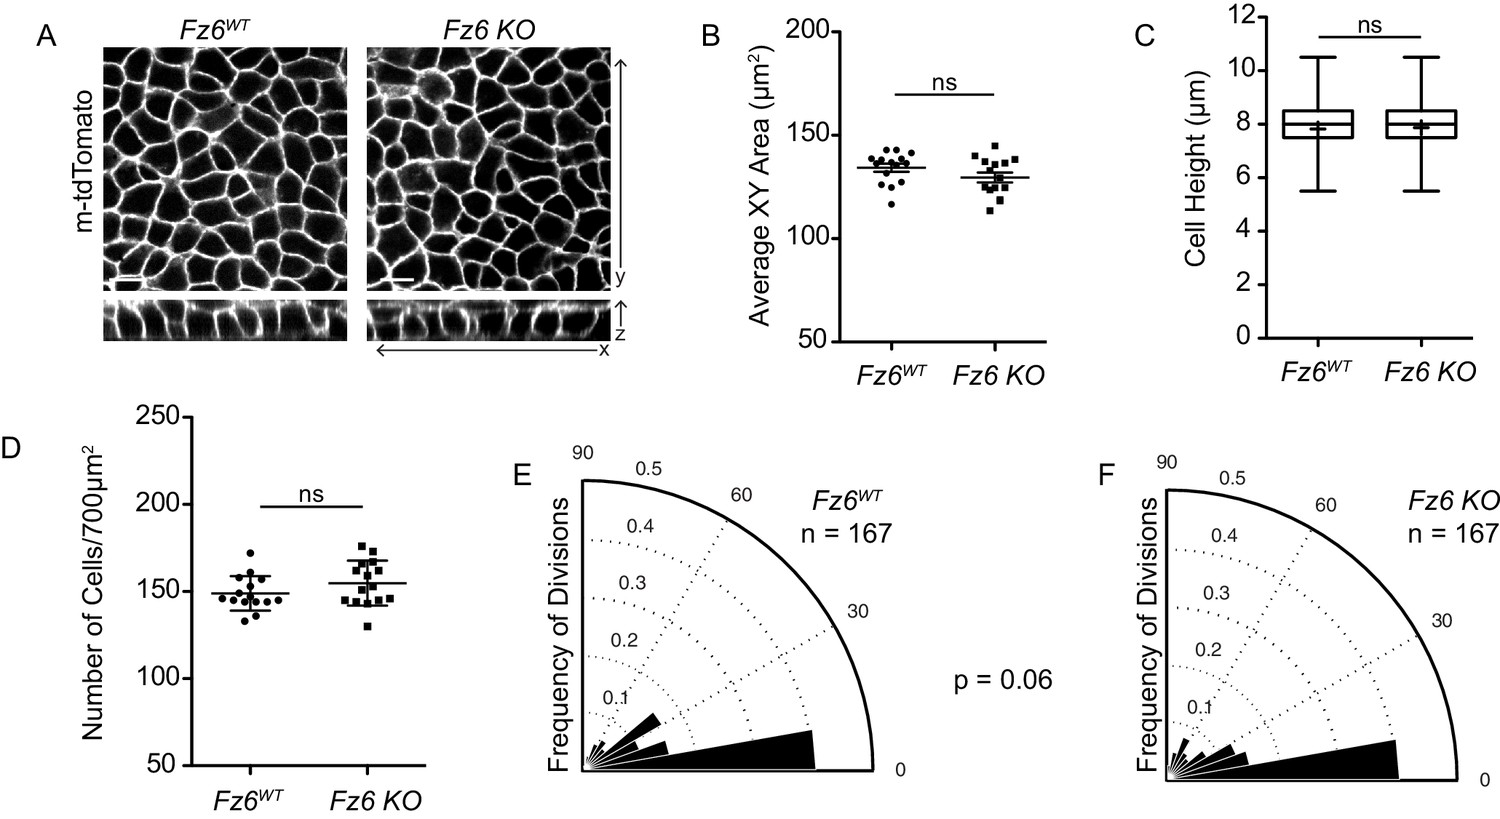
Basal cell shape and division orientations are unaffected in Fz6 knockout embryos.
(A) Representative images of the basal layer of Fz6WT and Fz6-/- embryos expressing membrane-tdTomato. Scale bars = 10 μm. (B) Quantification of basal cell cross-sectional areas. Each dot represents average area of all cells in a single field of view. n = 15 fields of view across three embryos per genotype. Bars are mean with SEM. Unpaired two-tailed t-test, p=0.1357. (C) Quantification of cell height along apical-basal axis. n = 300 cells per genotype. Whiskers indicate minimum and maximum values, + indicates the mean. Unpaired two-tailed t-test, p=0.4283. (D) Quantification of cell density, as number of cells per field of view (700 μm2). Each dot represents a single field of view. n = 15 fields of view across three embryos per genotype. Bars are mean with SD. Unpaired two-tailed t-test, p=0.1739. (E) Division orientations in Fz6WT embryos. n = 167 divisions, from three embryos. (F) Division orientations in Fz6-/- embryos. n = 167 divisions, from three embryos. Modified Kuiper Test, p=0.0644.
Figure 6
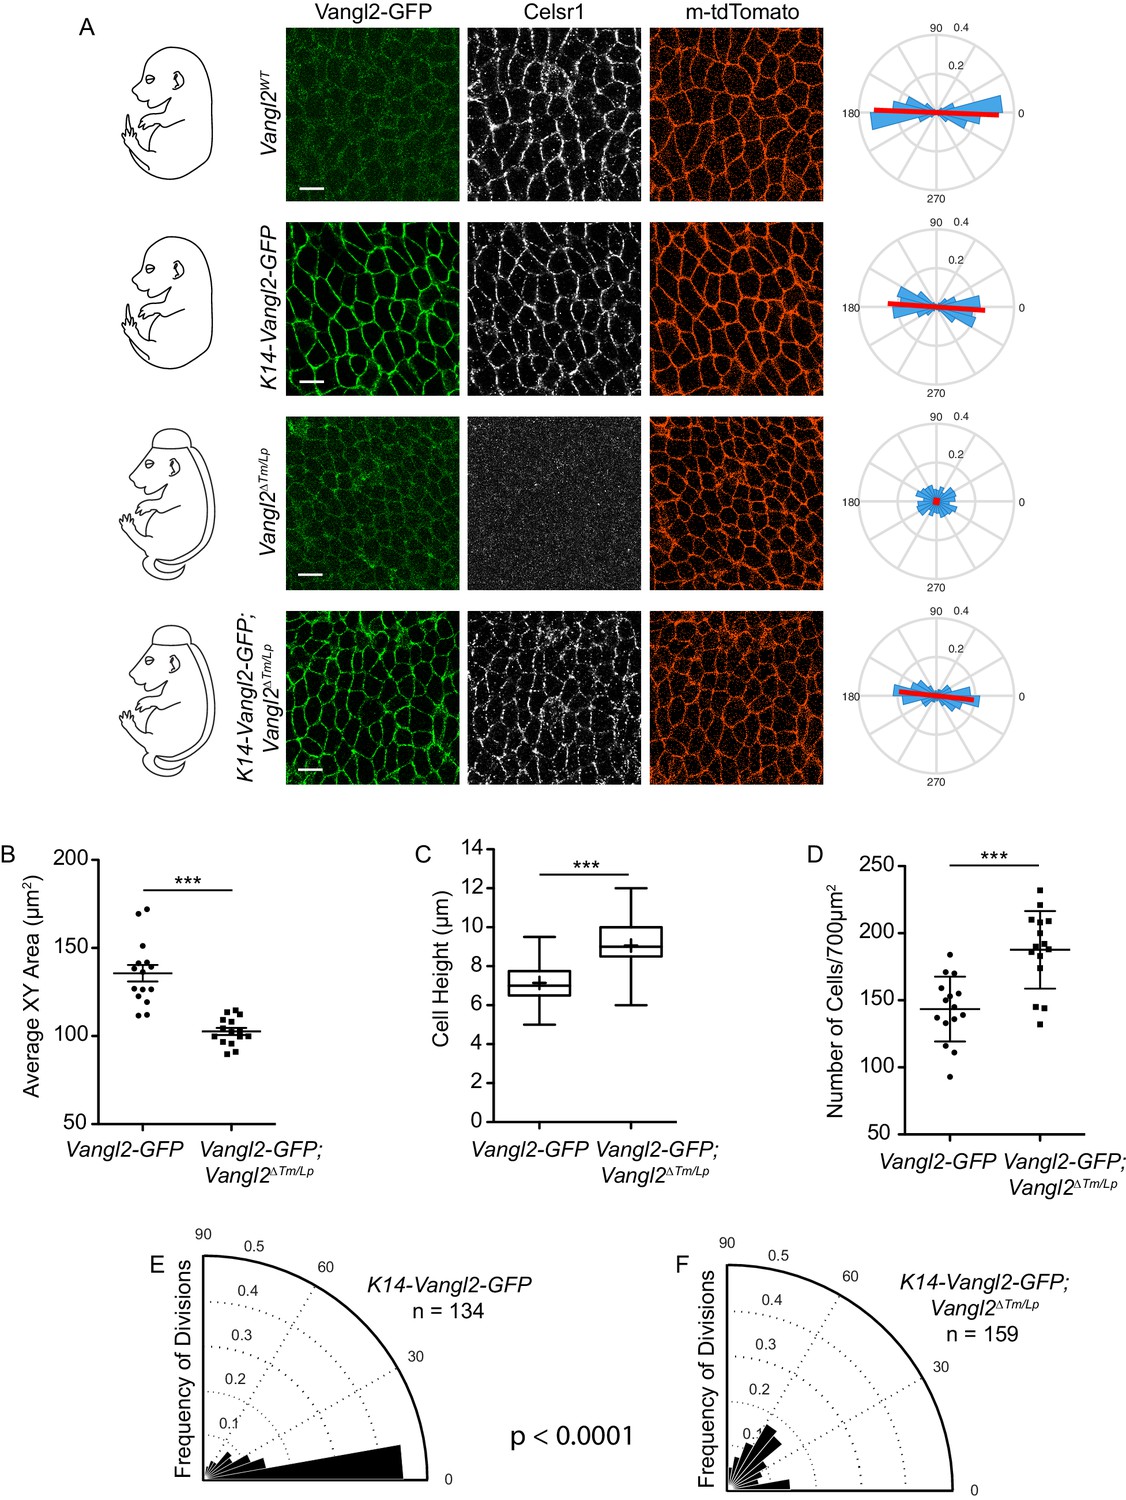
Cell shape and division orientation defects in Vangl2 mutants are indirect, and likely a consequence of failed neural tube closure.
(A) Representative images of the basal layer of Vangl2WT and Vangl2ΔTm/Lp embryos with or without K14-Vangl2-GFP. Green = 488 channel, Greyscale = Celsr1, Red = membrane tdTomato. Rose plots quantify Celsr1 polarity in the basal layer. Red line indicates the average magnitude and direction of polarity. Rose plots were generated from three images per genotype. All scale bars = 10 μm. (B) Quantification of cell surface areas. Each dot represents average surface area of all cells in a single field of view. n = 15 fields of view across three embryos per genotype. Bars are mean with SEM. Unpaired two-tailed t-test, p<0.0001. (C) Quantification of cell height along apical-basal axis. n = 300 cells per genotype. Whiskers indicate minimum and maximum values, + indicates the mean. Unpaired two-tailed t-test, p<0.0001. (D) Quantification of cell density, as number of cells per field of view (700 μm2). Each dot represents a single field of view. n = 15 fields of view across three embryos per genotype. Bars are mean with SD. Unpaired two-tailed t-test, p<0.0001. (E) Division orientations in Vangl2WT; K14-Vangl2-GFP embryos. n = 134 divisions, from 45 images across three embryos. (F) Division orientations in Vangl2ΔTm/Lp; K14-Vangl2-GFP embryos. n = 159 divisions, from 45 images across three embryos. Modified Kuiper Test, p=1.6201e-19.
Figure 7 with 1 supplement
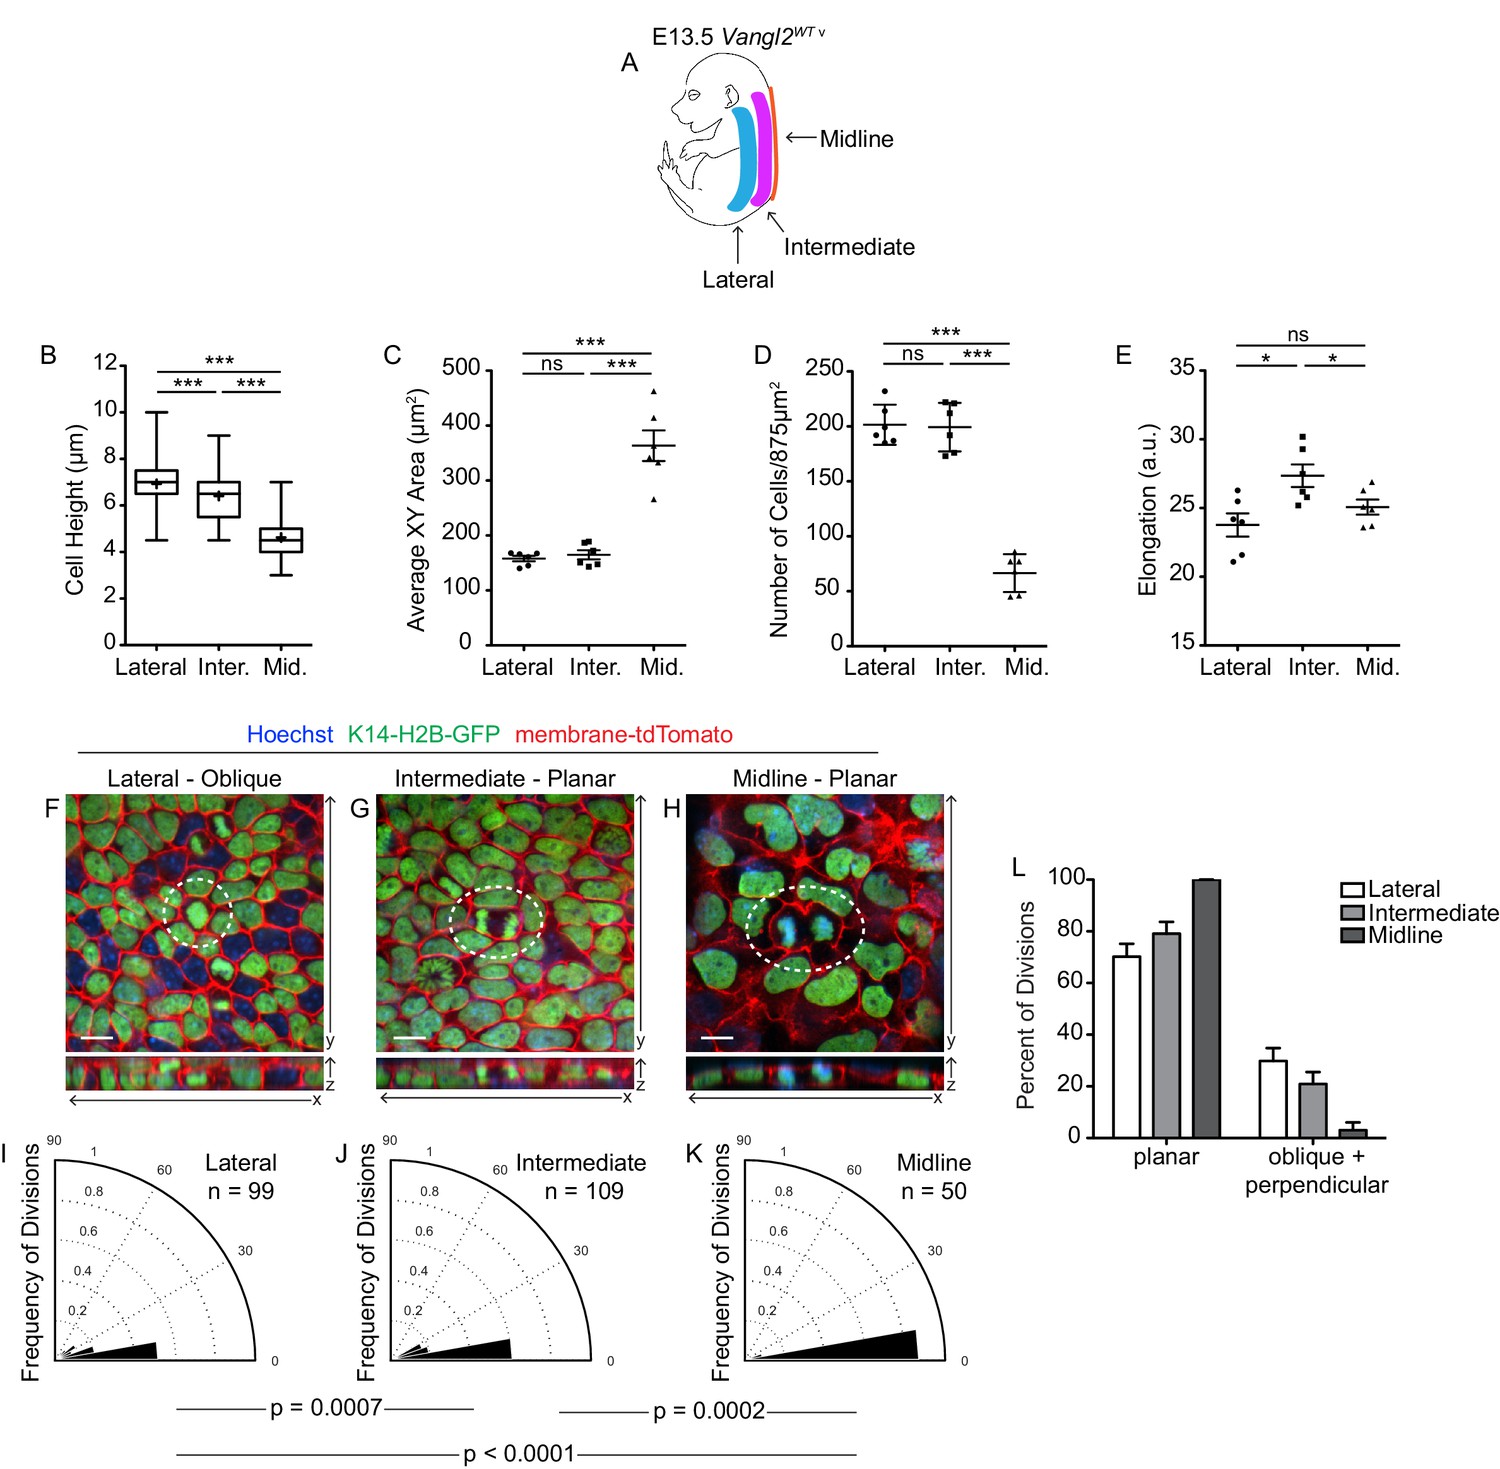
Spatial differences in cell geometries are associated with regional changes in division orientations.
(A) Schematic of an E13.5 Vangl2WT embryo, depicting the lateral, intermediate, and midline regions. (B) Quantification of cell height along apical-basal axis. n = 300 cells per genotype. Whiskers indicate minimum and maximum values, + indicates the mean. Lateral vs Intermediate, unpaired two-tailed t-test, p<0.0001; Lateral vs Midline, unpaired two-tailed t-test, p<0.0001; Intermediate vs Midline, unpaired two-tailed t-test, p<0.0001. (C) Quantification of basal cross-sectional areas. Each dot represents average surface area of all cells in a single field of view. Two images per region were analyzed, from each of three embryos, for a total of 6 measurements per region. Bars are mean with SEM. Lateral vs Intermediate, unpaired two-tailed t-test, p=0.4872; Lateral vs Midline, unpaired two-tailed t-test, p<0.0001; Intermediate vs Midline, unpaired two-tailed t-test, p<0.0001. (D) Quantification of cell elongations. Each dot represents the average elongation value of all cells in a field of view. Two images per region were analyzed, from each of three embryos, for a total of 6 measurements per region. Bars represent mean with SEM. Lateral vs Intermediate, unpaired two-tailed t-test, p=0.0125; Lateral vs Midline, unpaired two-tailed t-test, p=0.2256; Intermediate vs Midline, unpaired two-tailed t-test, p=0.0432. (E) Quantification of cell density, as number of cells per image (875 μm2). Each dot represents a single field of view. Two images per region were analyzed, from each of three embryos, for a total of 6 measurements per region. Bars represent mean with SD. Lateral vs Intermediate, unpaired two-tailed t-test, p=0.8567; Lateral vs Midline, unpaired two-tailed t-test, p<0.0001; Intermediate vs Midline, unpaired two-tailed t-test, p<0.0001. (F–H) Representative images of cell divisions in the lateral, intermediate, and midline regions in E13.5 Vangl2WT; K14-H2B-GFP embryos. Hoechst and membrane-tdTomato mark the nuclei and cell membranes, respectively. (I–K) Division orientations in the lateral, intermediate, and midline regions. Lateral: n = 99 divisions pooled from three embryos; Intermediate: n = 109 divisions pooled from three embryos; Midline: n = 50 divisions pooled from three embryos. Modified Kuiper’s Test: lateral vs intermediate, p=7.2638e-04; lateral vs midline, p=9.8559e-06; intermediate vs midline, p=1..5851e-04. (L) Distribution of planar vs oblique + perpendicular division orientations in the lateral, intermediate, and midline regions.
Figure 7—figure supplement 1
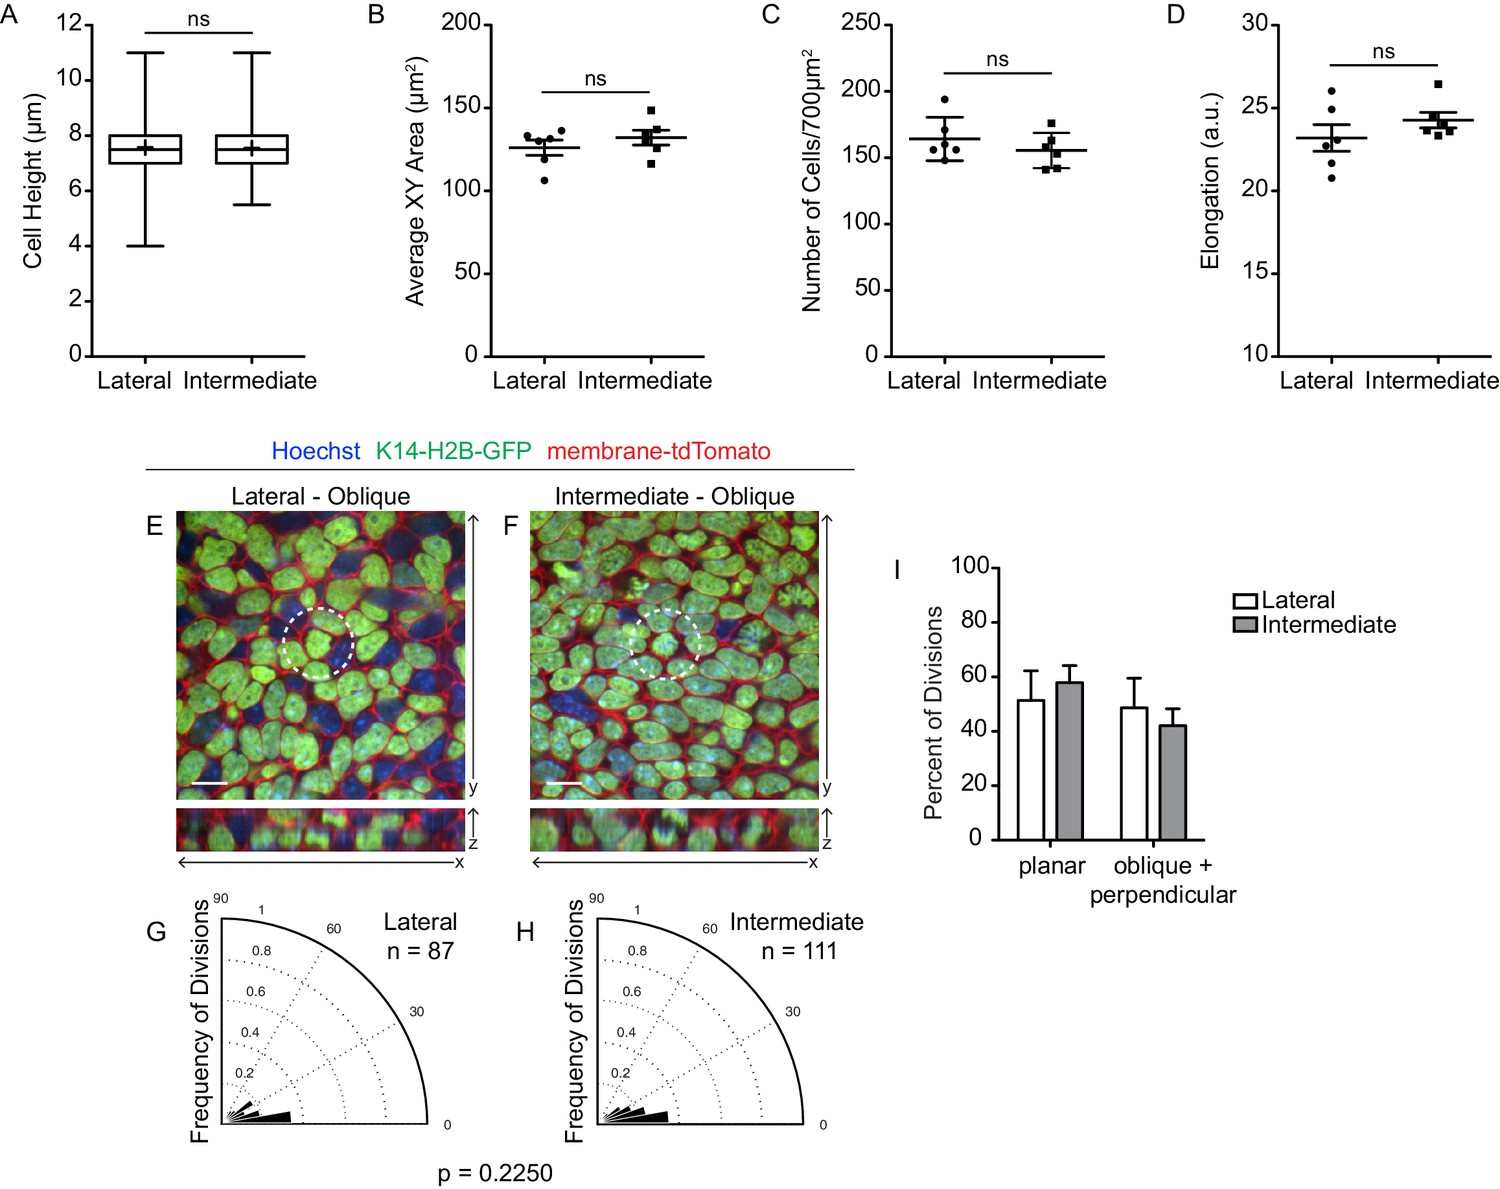
Spatial differences in cell geometry and division orientation are lost in Vangl2 mutant embryos.
(A) Quantification of cell height along apical-basal axis. n = 300 cells per region. Whiskers indicate minimum and maximum values, + indicates the mean. Unpaired two-tailed t-test, p=0.9412. (B) Quantification of basal cross-sectional areas. Each dot represents average surface area of all cells in a single field of view. Three images per region were analyzed, from each of two embryos, for a total of 6 measurements per region. Bars are mean with SEM. Unpaired two-tailed t-test, p=0.3670. (C) Quantification of cell density, as number of cells per image (875 μm2). Each dot represents a single field of view. Two images per region were analyzed, from each of three embryos, for a total of 6 measurements per region. Bars represent mean with SD. Unpaired two-tailed t-test, p=0.3385. (D) Quantification of cell elongations. Each dot represents the average elongation value of all cells in a field of view. Three images per region were analyzed, from each of two embryos, for a total of 6 measurements per region. Bars represent mean with SEM. Unpaired two-tailed t-test, p=0.2755. (E,F) Representative images of cell divisions in the lateral and intermediate regions in E13.5 Vangl2Lp/ΔTm; K14-H2B-GFP embryos. Hoechst and membrane-tdTomato mark the nuclei and cell membranes, respectively. (G,H) Division orientations in the lateral and intermediate regions. Lateral: n = 87 divisions pooled from two embryos; Intermediate: n = 111 divisions pooled from two embryos. Modified Kuiper’s test, p=0.2250. (I) Distribution of planar vs oblique + perpendicular division orientations in the lateral and intermediate regions.
Figure 8 with 1 supplement
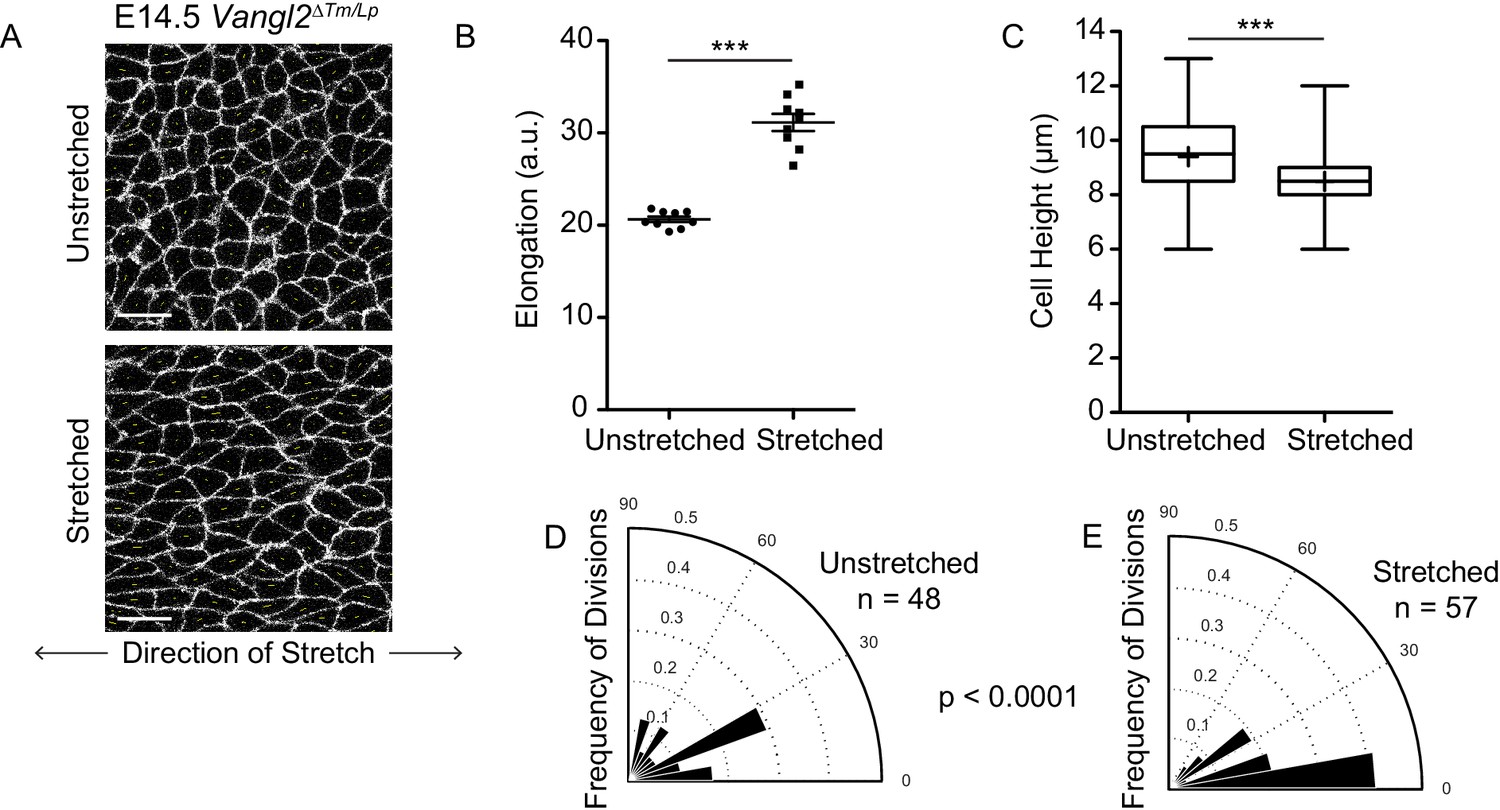
Basal cell divisions shift towards planar orientations under exogenously applied stretch.
(A) Representative images of the basal layer of E14.5 Vangl2ΔTm/Lp unstretched and stretched skin explants. White, membrane-tdTomato. Scale bars = 10 μm. (B) Quantification of cell elongation in unstretched vs stretched skins. Each dot represents the average elongation value of all cells in a field of view. n = three images from each of three separate experiments. Bars are mean with SEM. Unpaired two-tailed t-test, p<0.0001. (C) Quantification of cell height along apical-basal axis. n = 450 cells per genotype. Whiskers indicate minimum and maximum values, + indicates the mean. Unpaired two-tailed t-test, p<0.0001. (D) Division orientations in unstretched E14.5 Vangl2ΔTm/Lp explants. n = 48 divisions pooled from three explants. (E) Division orientations in stretched E14.5 Vangl2ΔTm/Lp embryos. n = 57 divisions pooled from three explants. Modified Kuiper’s Test, p=3.9430e-06.
Figure 8—figure supplement 1
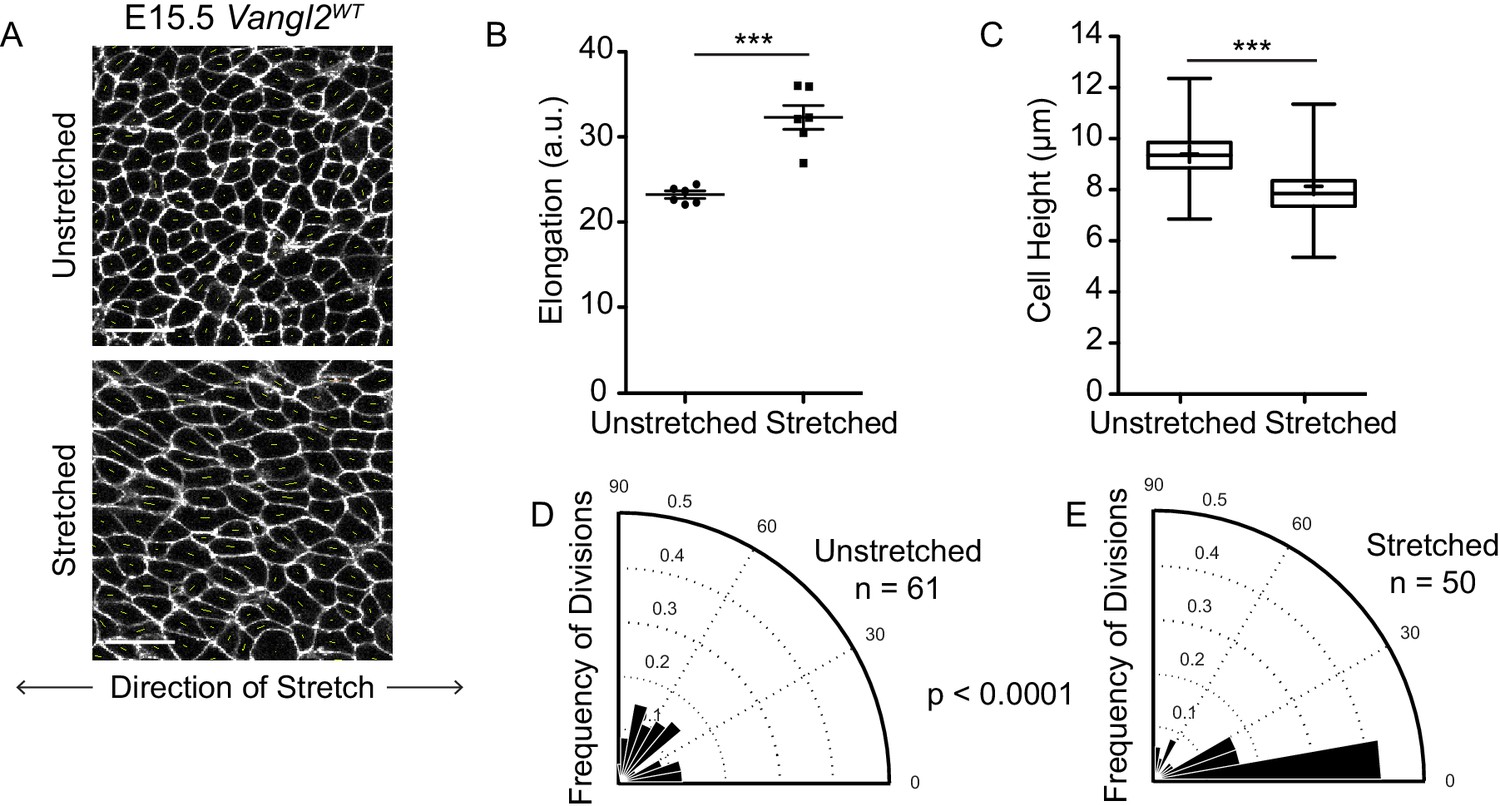
Exogenously applied stretch shifts E15.5 basal cell divisions toward planar orientations.
(A) Representative images of the basal layer of E15.5 Vangl2WT unstretched and stretched skin explants with vectors illustrating direction and magnitude of cell elongation. White, membrane-tdTomato. Scale bars = 10 μm. (B) Quantification of cell elongation in unstretched vs stretched skins. Each dot represents the average elongation value of all cells in a field of view. n = three images from each of two separate embryos/experiments. Bars are mean with SEM. Unpaired two-tailed t-test, p=0.0001. (C) Quantification of cell height along apical-basal axis. n = 450 cells per genotype. Whiskers indicate minimum and maximum values, + indicates the mean. Unpaired two-tailed t-test, p<0.0001. (D) Division orientations in control E15.5 Vangl2WT explants. n = 61 divisions pooled from two explants. (E) Division orientations in stretched E15.5 Vangl2WT skin explants. n = 50 divisions pooled from two explants. Modified Kuiper’s Test, p=1.0967e-08.
Author response image 1
Author response image 2
Tables
Key resources table
| Reagent type (species) or resource | Designation | Source or reference | Identifiers | Additional information |
|---|---|---|---|---|
| Strain, strain background (M. Musculus) | CD1 | Charles River | Crl:CD1(ICR); Strain 022 | |
| C56BL/6 | The Jackson Laboratory | C57BL/6J; Stock No: 000664 | ||
| Vangl2 (Lp) | Kibar et al., 2001 | MGI: 1857642 | Elaine Fuchs | |
| Vangl2 (dTM) | Copley et al., 2013 | MGI: 5551989 | Michael Deans | |
| K14-H2B-GFP | Tumbar et al., 2004 | Elaine Fuchs | ||
| K14-Cre | Vasioukhin et al., 1999 | Elaine Fuchs | ||
| Rosa26-mTmG | Muzumdar et al., 2007 | MGI: 3716464 | Liqun Luo | |
| Vangl1 flox/flox | Wang et al., 2016 | MGI: 5440498 | Jeremy Nathans | |
| Vangl2 flox/flox | Copley et al., 2013 | MGI: 5551989 | Michael Deans | |
| K14-Vangl2-GFP | Devenport et al., 2011 | Elaine Fuchs | ||
| Frizzled-6 KO | Guo et al., 2004 | MGI: 3050103 | Saori Haigo and Jeremy Reiter | |
| Antibody | anti-Involucrin (rabbit polyclonal) | Covance | (1:500), Elaine Fuchs | |
| anti-Celsr1 (guinea pig polyclonal) | D Devenport | (1:1000) | ||
| anti-E-Cadherin (rat monoclonal) | Masatoshi Takeichi | (1:25) purified in lab from ECCd2 clonal hybridomas | ||
| anti-E-Cadherin (rat monoclonal) | Thermo Fisher | MA1-25160 | (1:2000) | |
| anti-LGN (guinea pig polyclonal) | Scott Williams | (1:500) | ||
| anti-LGN (rabbit polyclonal) | Scott Williams | (1:3000) | ||
| anti-Vangl2 (rat monoclonal) | Millipore | Cat: MABN750 | (1:100) | |
| Alexa Fluor-488; −555; −647 secondary antibodies | Invitrogen | (1:2000) | ||
| Alexa Fluor-488; −555; −647 secondary antibodies | Jackson Immuno-Research | (1:2000) | ||
| Software, algorithm | Packing Analyzer | Aigouy et al., 2010 | Benoit Aiguoy |
Additional files
-
Source code 1
Matlab codes for data analysis.
- https://doi.org/10.7554/eLife.47102.020
-
Transparent reporting form
- https://doi.org/10.7554/eLife.47102.021
Download links
A two-part list of links to download the article, or parts of the article, in various formats.
Downloads (link to download the article as PDF)
Open citations (links to open the citations from this article in various online reference manager services)
Cite this article (links to download the citations from this article in formats compatible with various reference manager tools)
Epithelial geometry regulates spindle orientation and progenitor fate during formation of the mammalian epidermis
eLife 8:e47102.
https://doi.org/10.7554/eLife.47102


