Testis single-cell RNA-seq reveals the dynamics of de novo gene transcription and germline mutational bias in Drosophila
- The Rockefeller University, United States
Figures
Figure 1 with 3 supplements
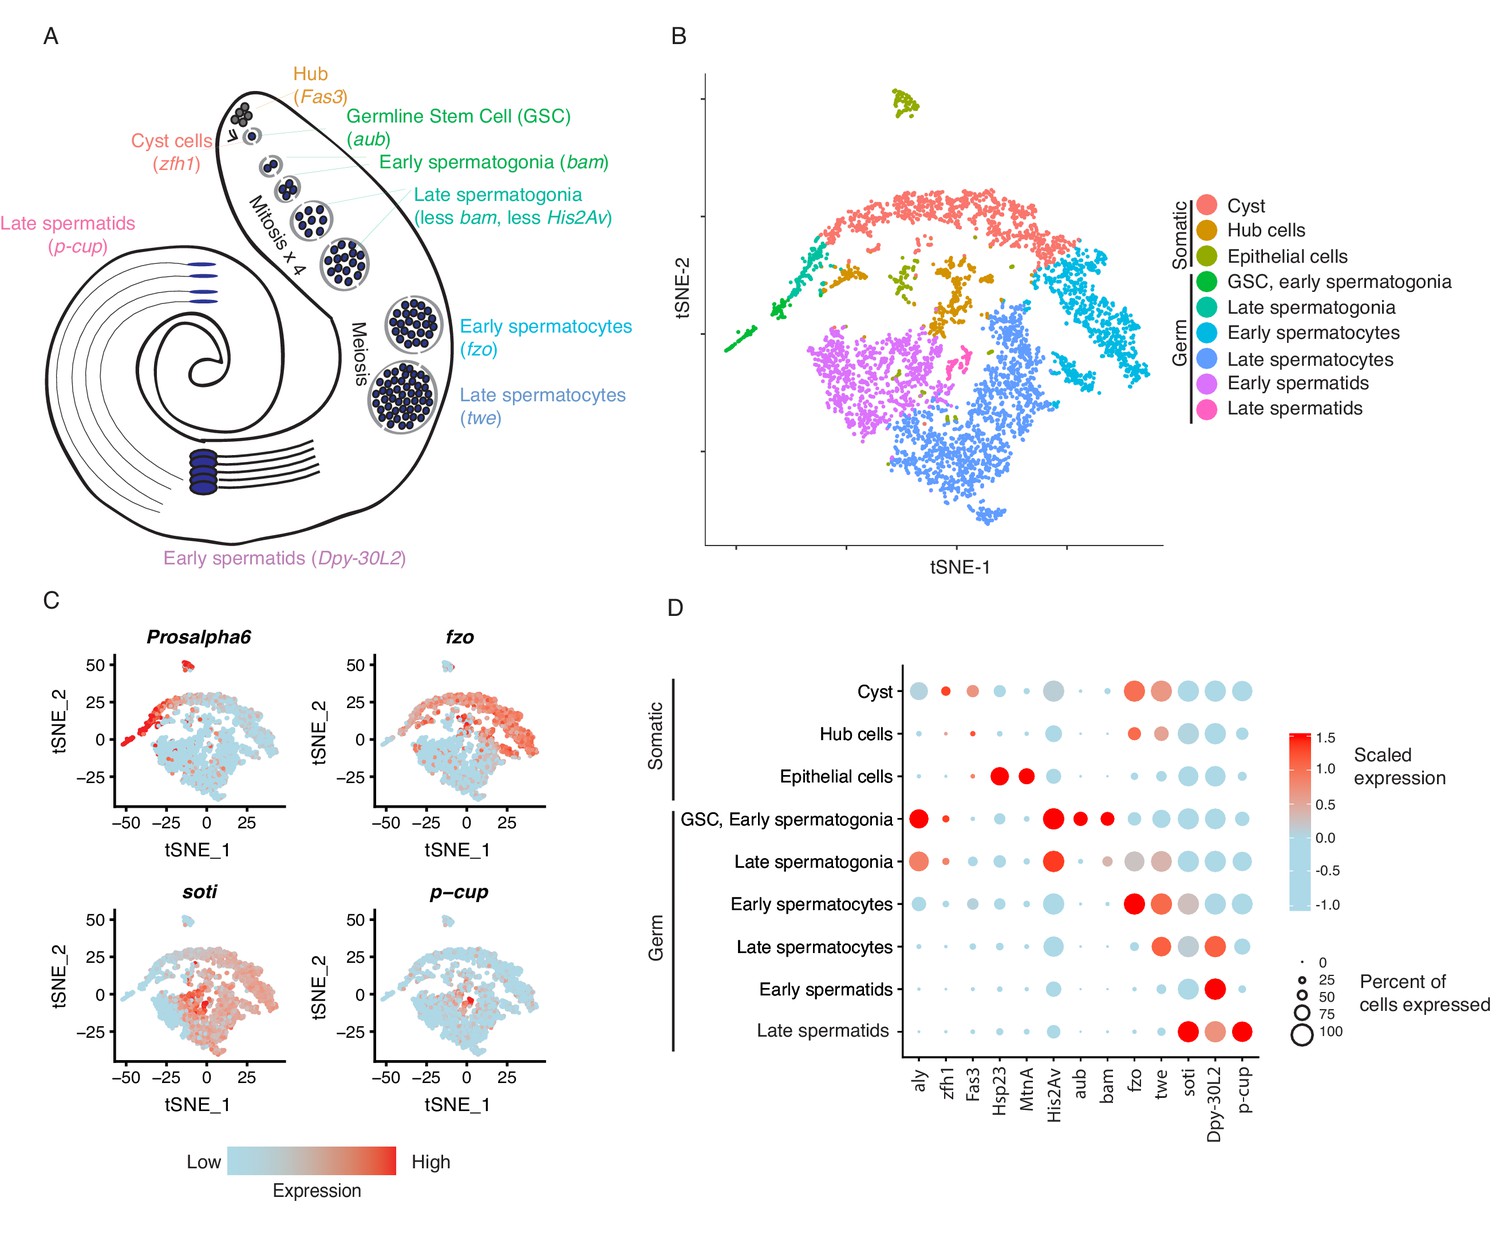
Clustering and cell-type assignment of single cells in Seurat.
(A) An illustration of the major cell types in the testis, and the marker genes we used to identify them are in brackets. Somatic cells are hub, cyst, and epithelial cells. Spermatogenesis begins with germline stem cells which undergo mitotic divisions to form spermatogonia. These become spermatocytes which undergo meiosis and differentiate into spermatids. (B) A t-SNE projection of every cell type identified in the data. (C) Examples of marker genes that vary throughout spermatogenesis. His2Av is most active in early spermatogenesis, fzo and soti are active in intermediate and late stages, respectively, and p-cup is exclusively enriched in late spermatids. (D) Dotplot of scaled expression of marker genes in each inferred cell type. The size of each dot refers to the proportion of cells expressing a gene, and the color of each dot represents the calculated scaled expression value; blue is lowest, red is highest. 0 is the gene’s mean scaled expression across all cells and the numbers in the scale are z scores. The cutoffs shown here were chosen to emphasize cell-type-specific enrichment of key marker genes. The genes used to assign each cell type are detailed in the Materials and methods section.
Figure 1—figure supplement 1
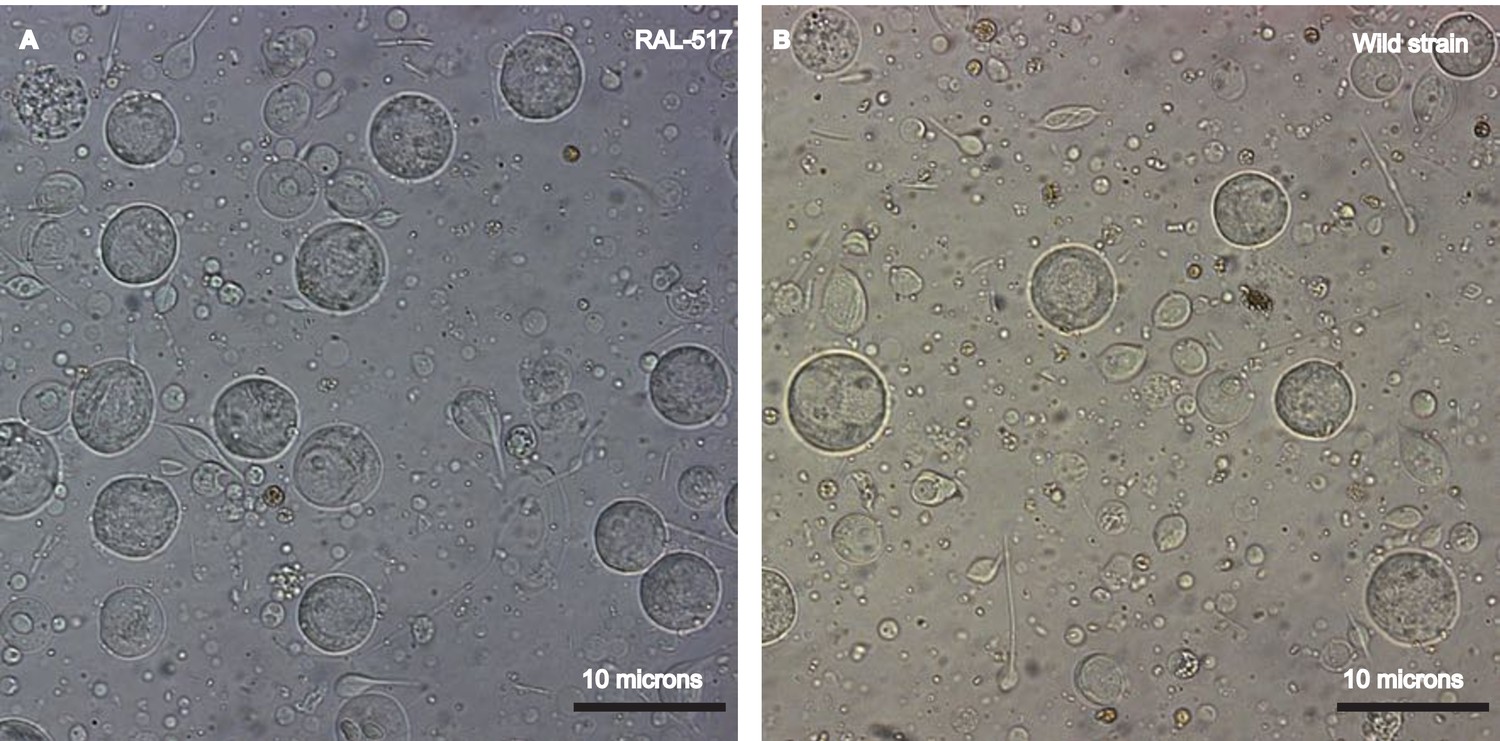
Establishing a single cell suspension from Drosophila testes.
Representative images of single cell suspensions from two D. melanogaster strains, RAL 517 (A) and our lab’s wild strain (B). Dissected testes were treated with proteases followed by straining and washes (see Materials and methods). The images contain single cells of various developmental stages, some with tails of various lengths. Cells were imaged using a 40X magnification and scale bars represent 10 μm. Since cells are present in many focal planes, the size of some cells may not correspond to the scale bar shown.
Figure 1—figure supplement 2

Reproducibility of RAL517 single-cell sequencing data.
(A) Correlation between DESeq2 regularized log-transformed TPM (transcripts per million) of genes in 517 whole-tissue RNA-seq data and our single-cell RNA-seq data. Despite different library strategies and sequencing methods our data correlate extremely well with whole-tissue RNA-seq data indicating that our dataset has captured an accurate sampling of testis-expressed genes and our results are reproducible. (B) Correlation between our RAL517 single-cell library and a library of a wild D. melanogaster strain from our lab. Despite being from different strains, the libraries show a high correlation in normalized TPM. This result shows, however, that many genes vary between D. melanogaster strains, necessitating further work to understand transcriptome evolution on a single-cell level.
Figure 1—figure supplement 3
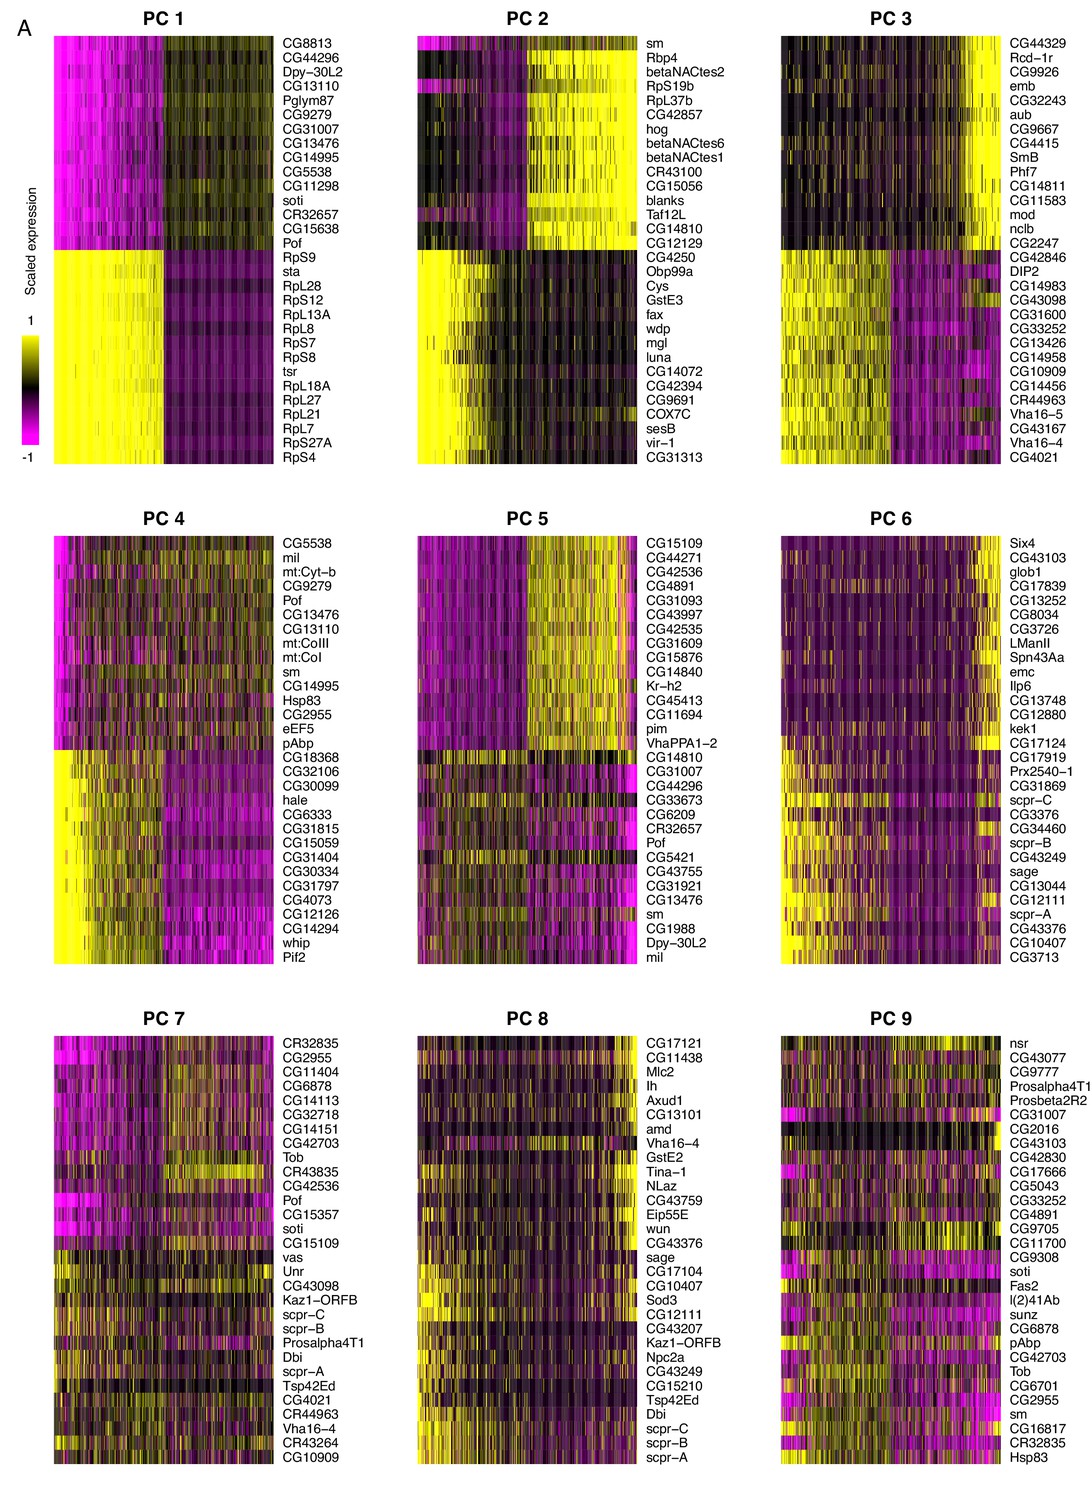
Principal component analysis of testis-expressed genes.
Horizontally, each line is 500 randomly selected cells, and vertically, the expression of the 15 genes with the highest positive and negative scores for the principal component. For PC 1, one interpretation could be that soti, a marker of late spermatocytes/early spermatids, is negatively correlated with the expression of many ribosomal protein genes. This is consistent with our finding that ribosomal protein genes peak in early spermatogenesis. It is worth noting that the higher numbered PCs become more and more diffuse, as they each explain a smaller proportion of variance than the PCs 1 and 2.
Figure 2
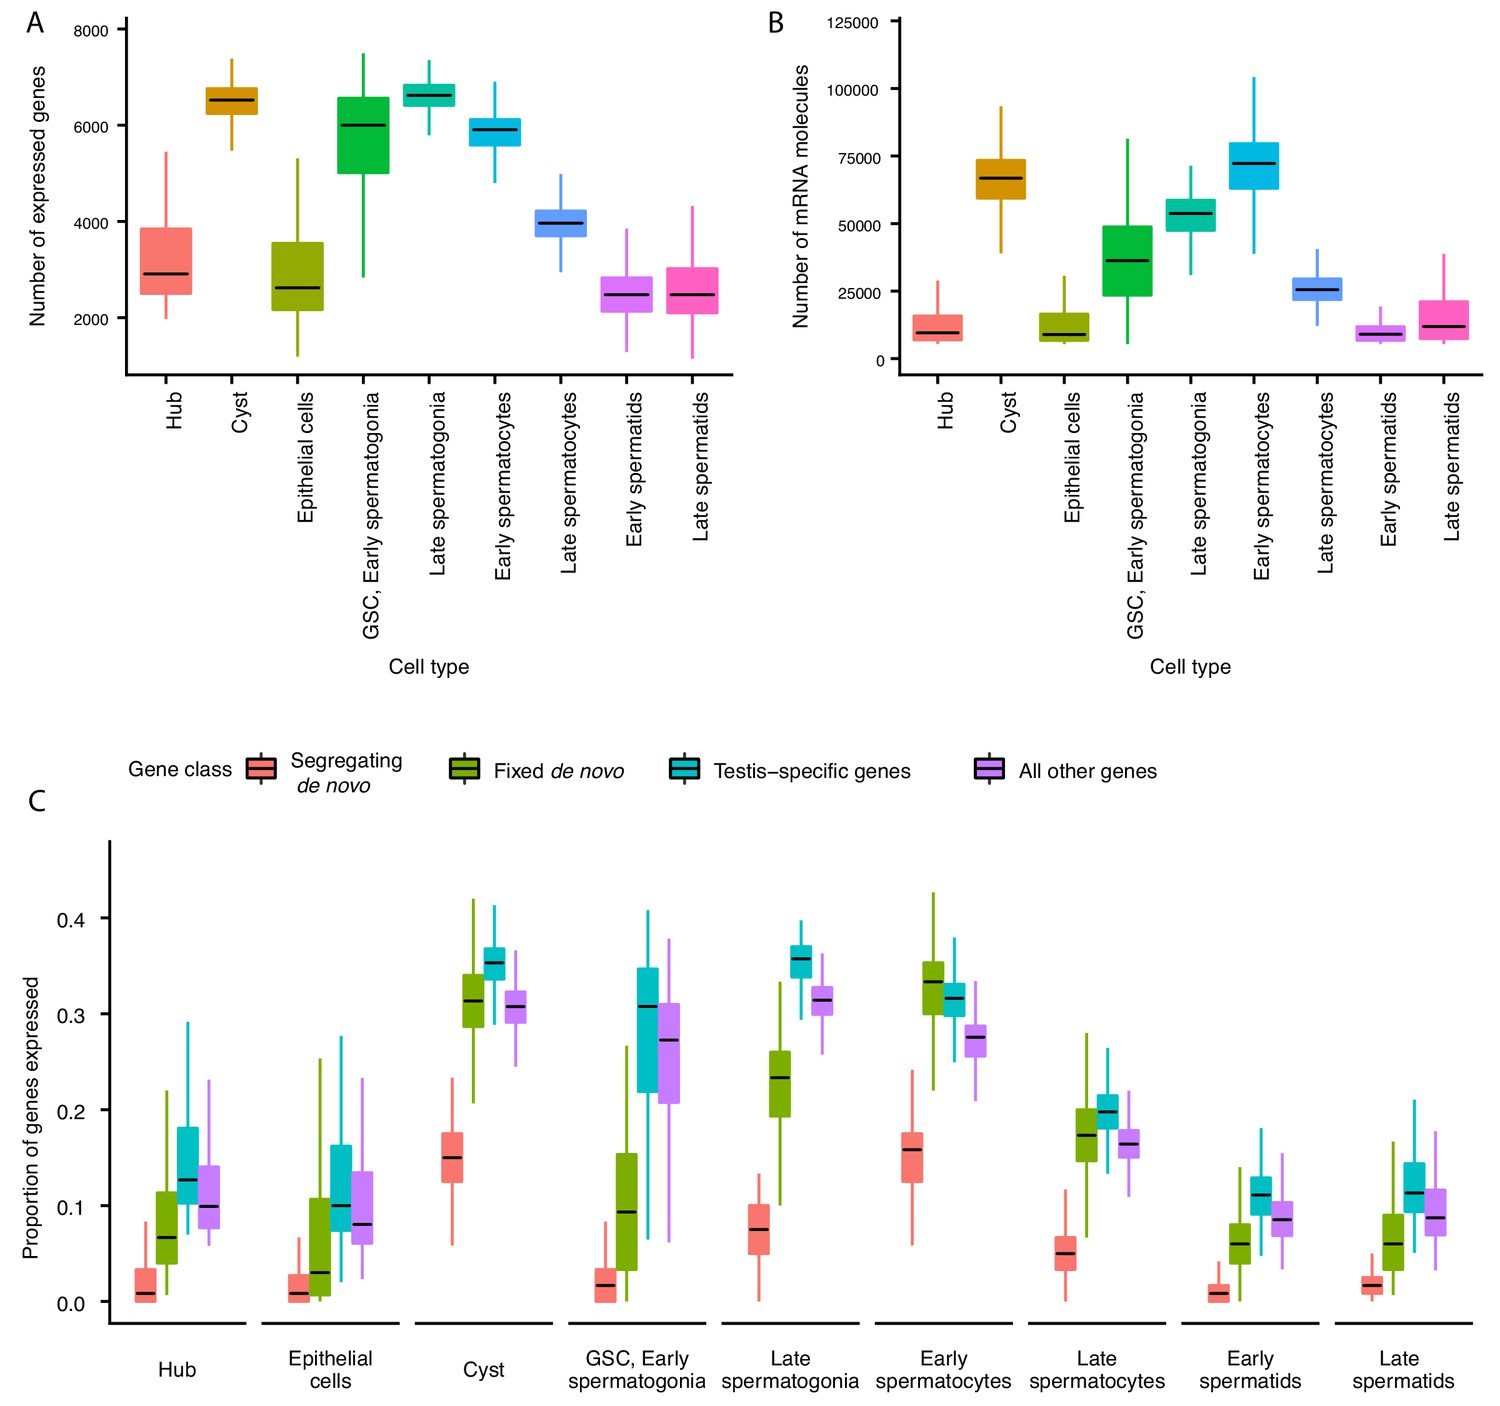
Gene expression and RNA content through spermatogenesis.
(A) Boxplots of the number of genes expressed in each cell, binned by assigned cell type. Late spermatogonia and early spermatocytes express the most genes, and spermatids the least. (B) The number of Unique Molecular Indices (UMIs) detected for each cell, a proxy of RNA content. By this metric RNA content peaks in early spermatocytes, and is reduced thereafter by post-meiotic transcriptional suppression. (C) The proportion of segregating de novo, fixed de novo, testis-specific, and all genes expressed in every cell. For each cell, we counted the number of each class of gene with non-zero expression and divided it by the total number of genes of that type, grouping by cell type. For every cell type except spermatocytes, segregating de novo genes are the least commonly expressed, fixed de novo genes are more commonly expressed and all genes are most commonly expressed. In every cell type except early spermatocytes, a smaller proportion of fixed de novo genes are expressed than testis-specific genes, but early and late spermatocytes express similar proportions of fixed de novo genes and testis-specific genes. It is important to note that this measure looks at the number of genes of each type detected in a cell, not the expression level of each, and does not distinguish between high and low expression.
Figure 3 with 1 supplement
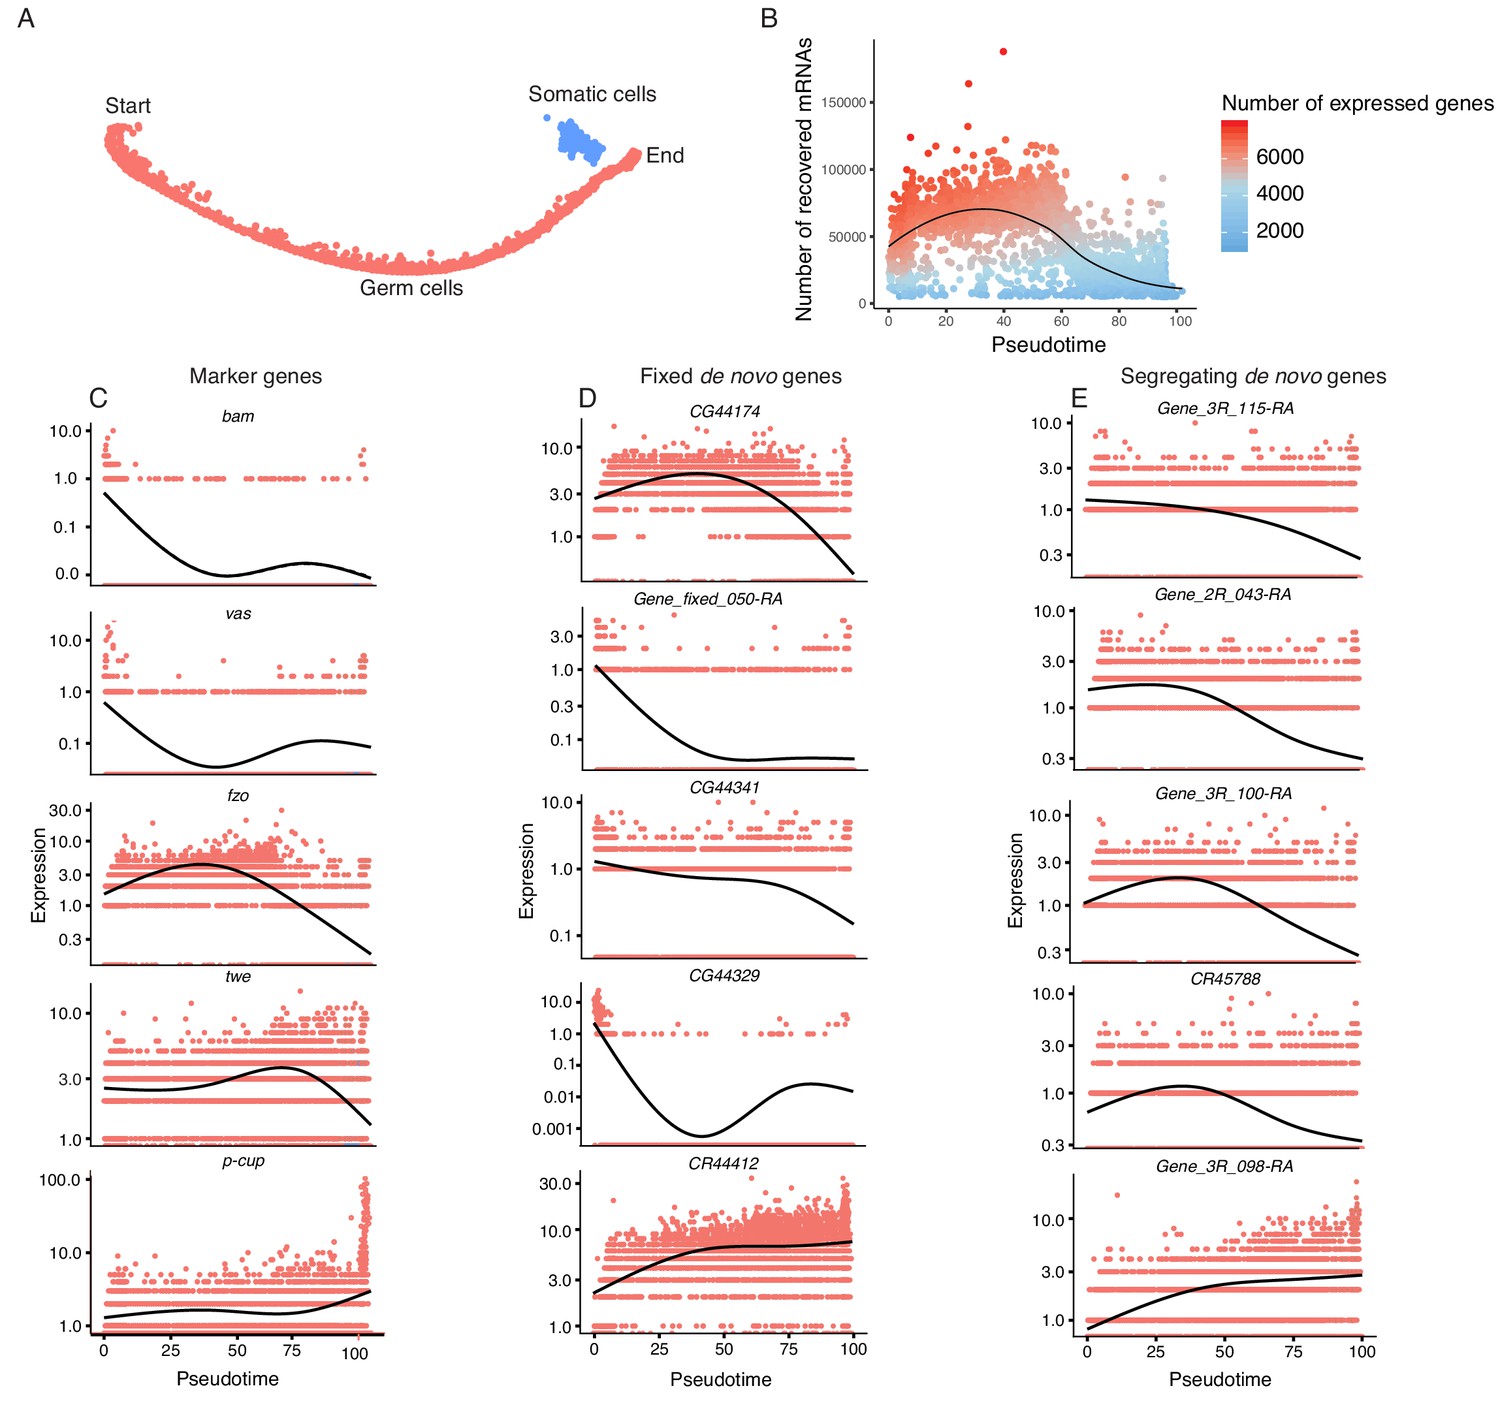
Pseudotime approximates the developmental trajectory of spermatogenesis.
(A) We aligned every cell from our testis sample along an unsupervised developmental trajectory. From the expression of marker genes, we found somatic cells (blue) which were forced onto the developmental trajectory. For further analysis we disregard this branch (See Materials and methods, Figure 3—figure supplement 1). Spermatogenesis begins at the far-left end of the trajectory. (B) The relative RNA content per cell peaks in mid-spermatogenesis, and declines during spermatid maturation, as approximated by the number of UMIs detected per cell. The number of genes expressed declines as well. The black line is a Loess-smoothed regression of the data, which should be thought of as a general trend among stochastic data and not a mathematical model. (C) Loess-smoothed expression of marker genes along the red germ cell lineage assigned in panel A. Along this lineage, the relative expression of marker genes is consistent with their temporal dynamics inferred from previous work. (D) Fixed de novo genes show a variety of expression patterns, including biphasic, early-biased, and late-biased. (E) Segregating de novo genes are often biased towards early/mid spermatogenesis.
Figure 3—figure supplement 1
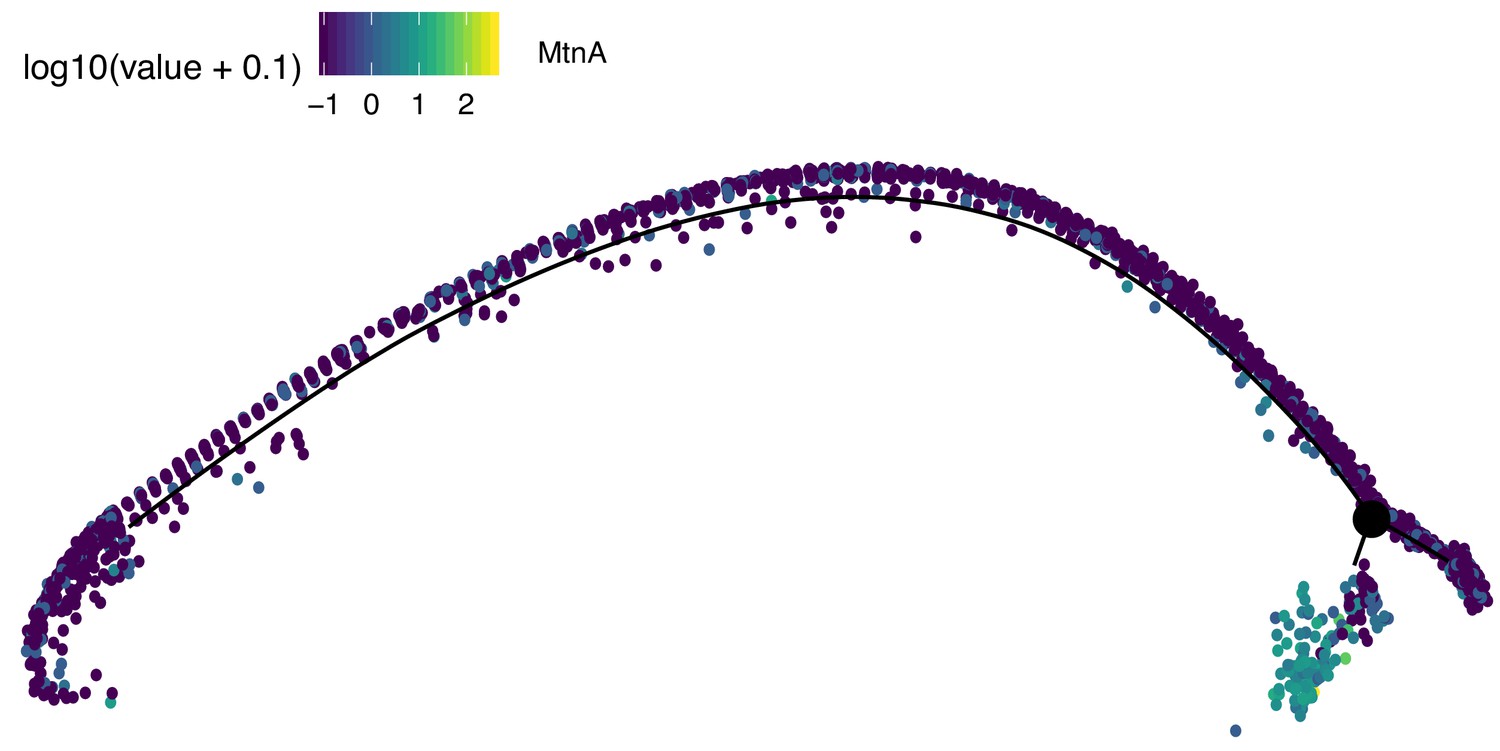
Assignment of somatic branch of pseudotime trajectory.
This is the same pseudotime developmental trajectory from Figure 3A, but each cell has been colored according to its expression of MtnA, a marker of somatic cells. This led us to conclude that state three in Figure 2A is mostly somatic cells and is not part of the germ lineage since it is enriched in MtnA.
Figure 4 with 1 supplement
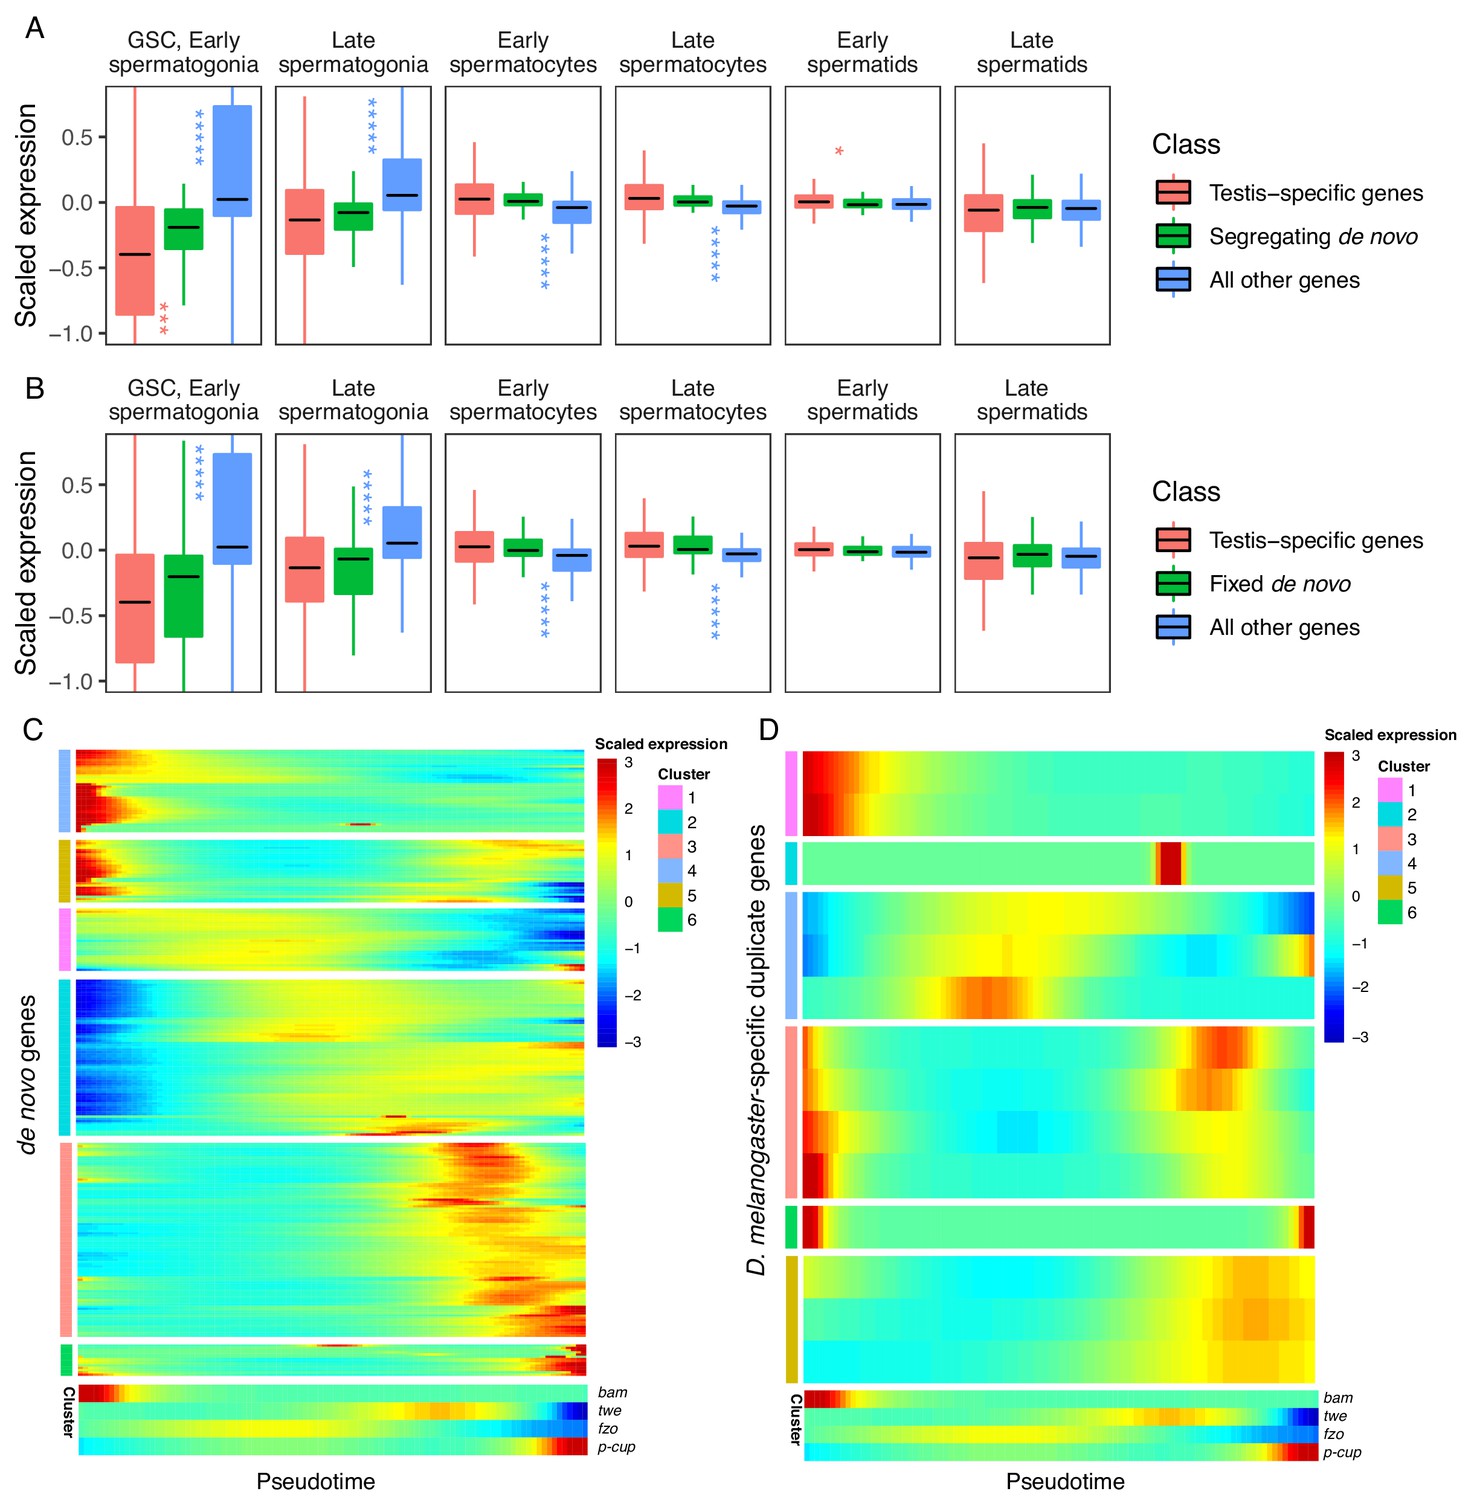
Expression bias of young genes.
Spermatogenesis starts at GSC, early spermatogonia and proceeds rightward. (A) The scaled expression distribution of segregating de novo genes in each cell type, compared with the distribution of every other gene and testis-specific genes. For every gene, 0 is its mean scaled expression in a cell type, and the Y axis corresponds to Z scores of deviations higher or lower than that mean value. Asterixis represent Hochberg-corrected p values. The color of the asterixis indicates which gene set is being compared to de novo genes, and their placement above or below the boxplots indicates that gene set’s relationship (higher or lower) to de novo genes. By this measure, de novo genes are biased downwards in early spermatogenesis and upwards in early spermatids. (B) The scaled expression patterns of fixed de novo genes are typical of testis-specific genes. (C) The scaled expression of detected fixed de novo genes across pseudotime (left to right), clustered by monocle’s plot_pseudotime_heatmap function. While most de novo genes are biased towards intermediate cell-types, a small portion of de novo genes are most expressed during early and late spermatogenesis. (D) The scaled expression of melanogaster-specific duplicate genes over pseudotime. Despite being a similar evolutionary age to fixed de novo genes, young duplicate genes are more likely to be biased towards early and late spermatogenesis.
Figure 4—figure supplement 1
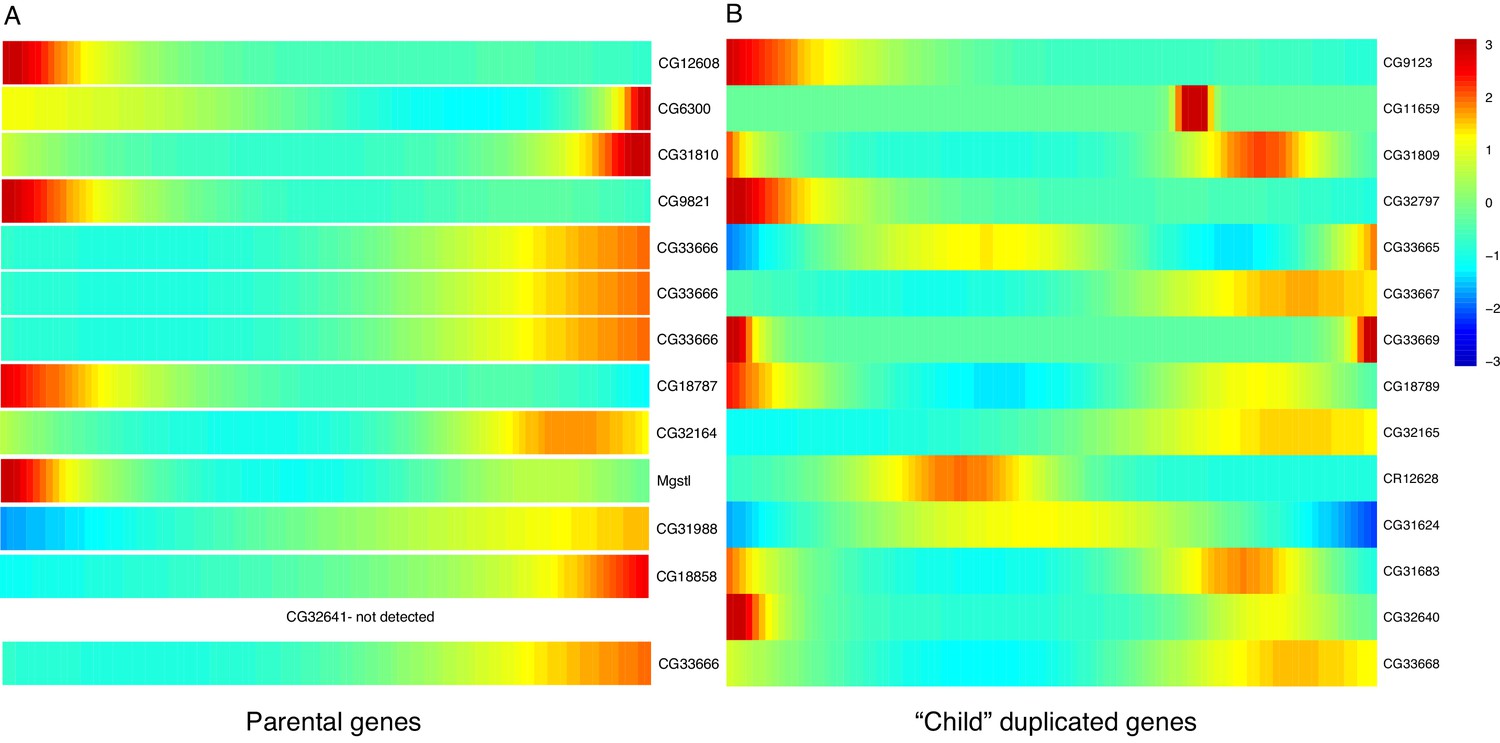
Expression heatmaps of parental and derived duplicated genes.
A row is a gene, shown as it progresses along pseudotime from left to right. (A) The scaled expression of a set of parental copies of duplicated genes, plotted in pseudotime. (B) The scaled expression of the derived copies of duplicated genes.
Figure 5 with 1 supplement
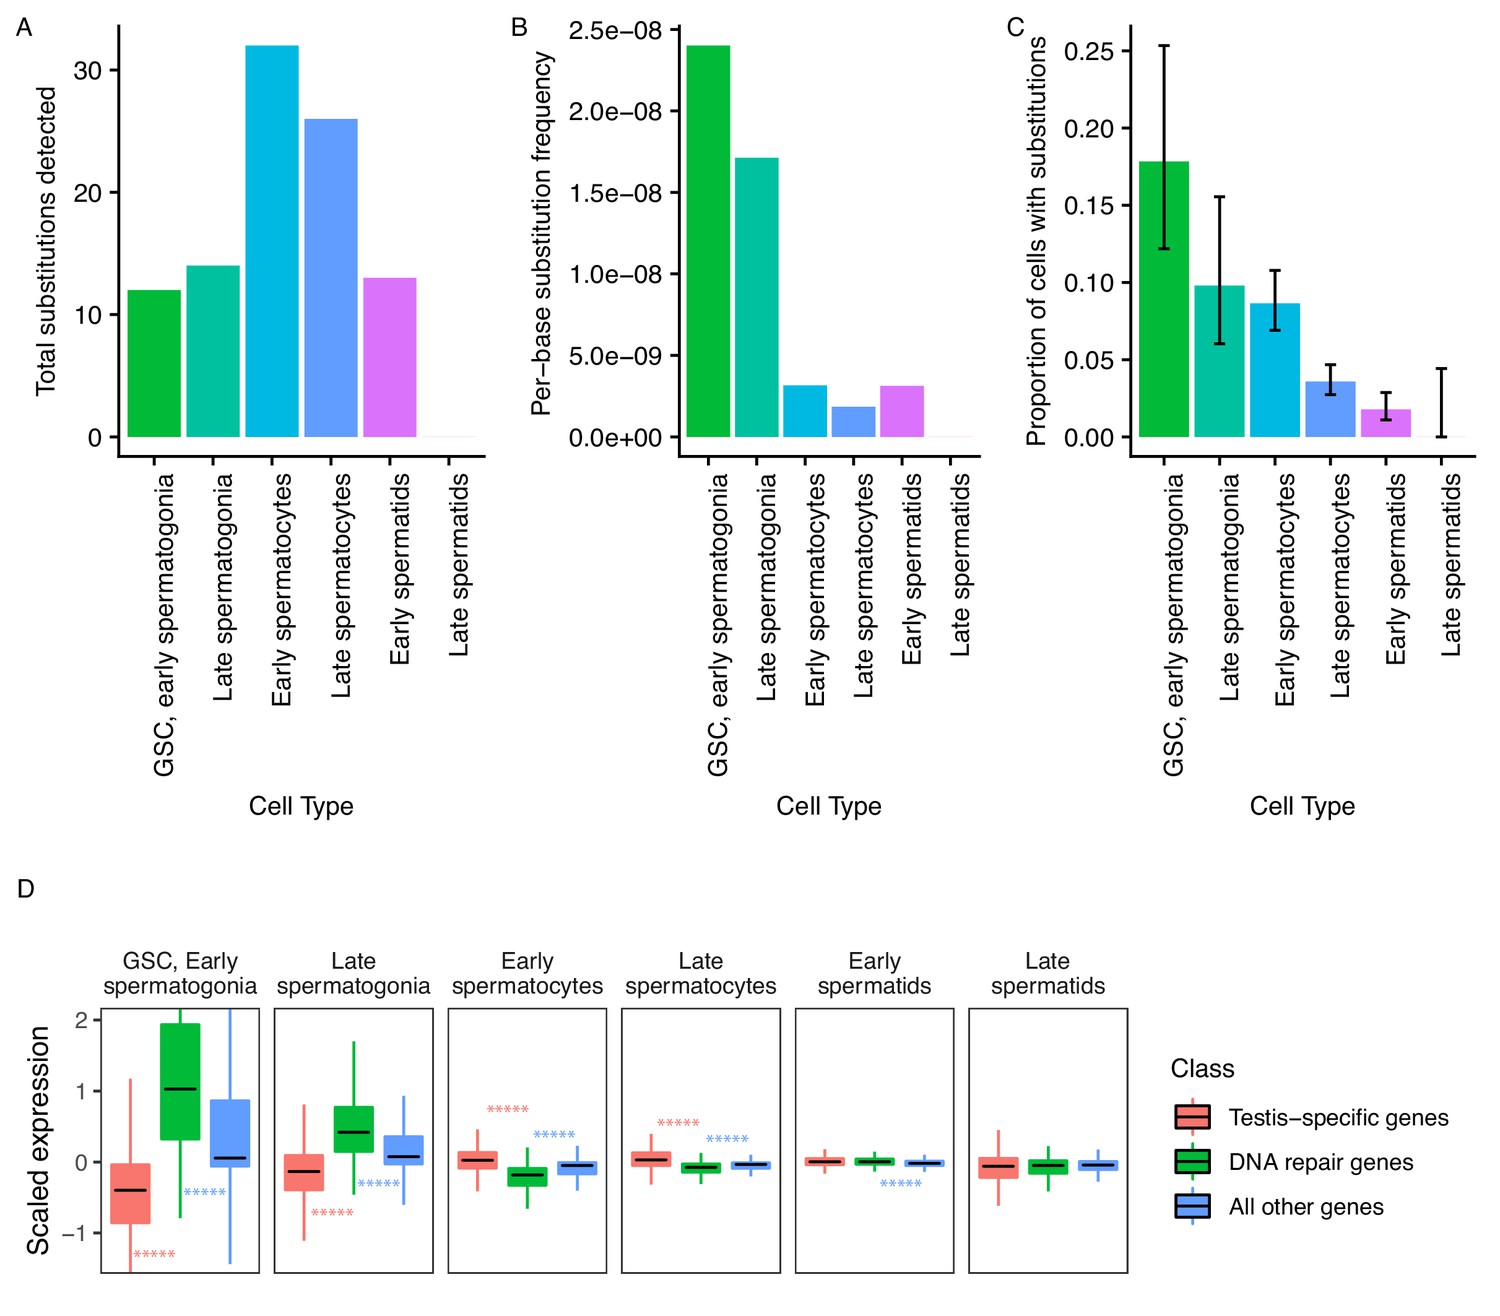
Abundance of putative de novo germline mutations.
(A) For every cell type, the total number of high-quality polymorphisms identified. Out of 2590 candidate variants, we excluded all substitutions that could be found in any somatic cell, leaving 73 variants. We then counted clustered polymorphisms as single mutational events and removed variants that could have resulted from RNA editing. See Materials and methods for details. (B) Dividing the number of polymorphisms in a cell type by the number of cells of that type, and the number of bases covered with at least 10 reads in that cell type (Supplementary file 5) yields an approximate relative substitution frequency for each cell type. By this metric, substitutions are most prevalent in early spermatogenesis, and decrease in relative abundance during spermatid development. This could be due to the apoptosis of mutated cells, or the systematic repair of DNA lesions during spermatogenesis. (C) The proportion of cells of each type with at least one identified germline lesion. Error bars are the 95 percent confidence intervals for each proportion. A Chi-square test for trend in proportions gives a p value of 2.20E-16, indicating strong evidence of a linear downward trend. (D) DNA repair genes are generally biased towards early spermatogenesis, statistically enriched compared to the distribution of all other genes. (Wilcoxon adjusted p value < 0.05).
Figure 5—figure supplement 1
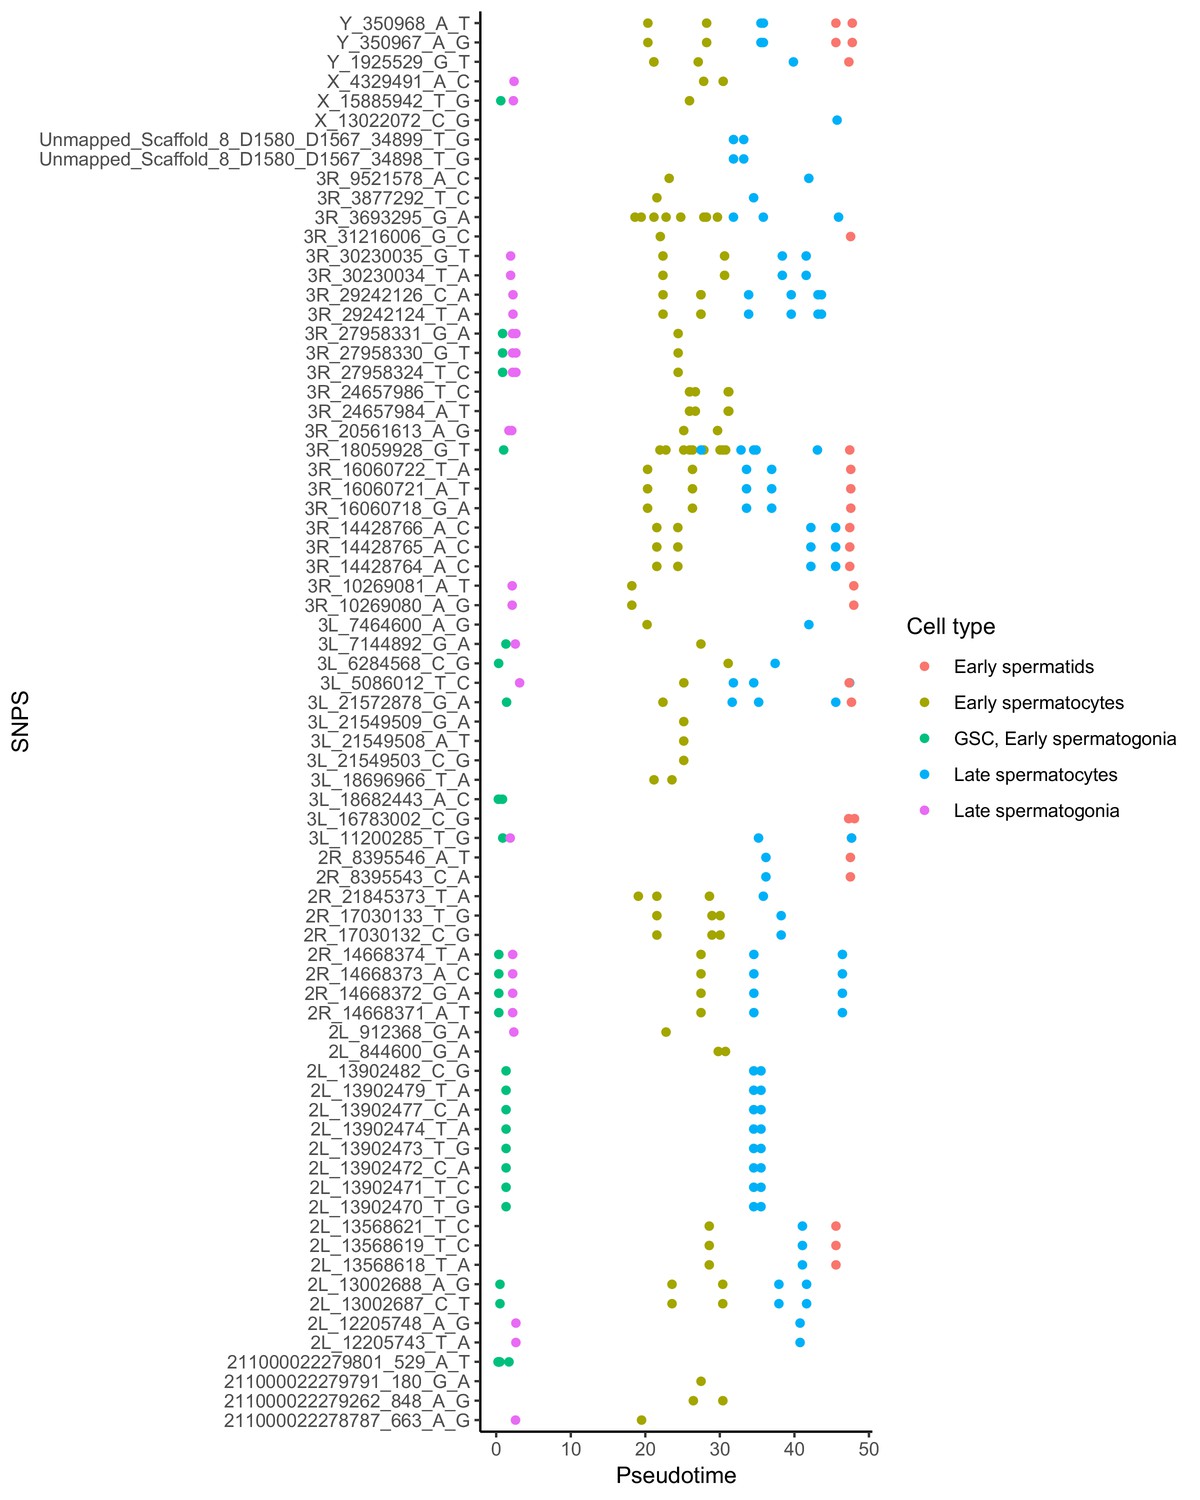
Alignment of germline mutations along pseudotime.
For the 73 germline SNPS, we plotted every cell containing the SNP according to its pseudotime value inferred by monocle. Some SNPs are found in multiple cell types. Other SNPs are actually clustered close to other SNPS found in the same cells, such as the SNPS from 2L_13902470 to 2L_13902482. For the purposes of calculating mutational abundance in Figure 5, we considered clusters of SNPS within 10 bp of each other to be a single mutational event, to prevent clusters of SNPs from biasing our inferred mutational abundance. Raw numbers of SNPs per cell type and corrected mutational events for each cell type are available in Supplementary file 5.
Tables
Table 1
Adjusted p values and direction of bias for gene expression biases of selected gene groups in germ cells.
Spermatogenesis progresses downward from GSC/Early spermatogonia and ends in late spermatids. Upwards arrows indicate that the top group of genes is biased upwards compared to the bottom group, and downwards arrows indicate that it is biased downward according to a directional Hochberg test. For example, ribosomal proteins are more expressed in late spermatogonia than all other genes, with an adjusted p value of 1.24E-75. Note that while segregating de novo genes are expressed differently from testis-specific genes in GSC, early spermatogonia and early spermatids, fixed de novo genes do not significantly deviate from expression patterns of testis-specific genes in any cell type.
| Versus: | Ribosomal protein genes | Segregating de novo genes | Fixed de novo genes | DNA repair genes | ||||
|---|---|---|---|---|---|---|---|---|
| All other genes | Testis-specific genes | All other genes | Testis-specific genes | All other genes | Testis-specific genes | All other genes | Testis-specific genes | |
| GSC, early spermatogonia | ↑ 1.13E-82 | ↑ 1.44E-84 | ↓ 1.46E-21 | ↑ 9.35E-04 | ↓ 2.92E-22 | ns | ↑ 4.69E-26 | ↑ 8.14E-62 |
| Late spermatogonia | ↑ 1.24E-75 | ↑ 1.62E-74 | ↓ 8.22E-19 | ns | ↓ 5.89E-18 | ns | ↑ 2.30E-20 | ↑ 5.80E-44 |
| Early spermatocytes | ↓ 2.53E-76 | ↓ 1.08E-71 | ↑ 4.08E-15 | ns | ↑ 5.31E-13 | ns | ↓ 6.50E-23 | ↓ 1.75E-38 |
| Late spermatocytes | ↓ 2.51E-57 | ↓ 1.90E-58 | ↑ 1.09E-10 | ns | ↑ 2.17E-15 | ns | ↓ 3.96E-09 | ↓ 4.58E-29 |
| Early spermatids | ↓ 8.94E-03 | ↓ 1.57E-08 | ns | ↓ 1.70E-02 | ns | ns | ↑ 5.89E-08 | ns |
| Late spermatids | ↓ 7.40E-10 | ↓ 1.70E-02 | ns | ns | ns | ns | ns | ns |
Table 2
Frequency of pseudotime expression patterns for melanogaster-specific fixed de novo genes and melanogaster-specific duplicate genes.
For genes in Figure 4C and D, we counted the number of genes showing a strong bias for early pseudotime, late pseudotime, mid-pseudotime, or a bimodal expression pattern. Fixed de novo genes are most frequently biased towards mid-pseudotime and the plurality of melanogaster-specific child duplicate genes show a bimodal expression pattern. Pseudotime expression plots of the parent-child duplicate gene pairs used in this analysis are in Figure 4—figure supplement 1. Proportions are rounded to two decimal places and may not add up to 1.
| Pattern | Fixed de novo proportion | Parental duplicate proportion | melanogaster-specific child duplicate proportion |
|---|---|---|---|
| Early | 0.26 | 0.37 | 0.14 |
| Mid | 0.62 | 0.00 | 0.21 |
| Late | 0.11 | 0.63 | 0.21 |
| Bimodal | 0.01 | 0.00 | 0.43 |
Key resources table
| Reagent type (species) or resource | Designation | Source or reference | Identifiers | Additional information |
|---|---|---|---|---|
| Strain, strain background (Drosophila melanogaster, male) | RAL517 | Mackay et al., 2012 | BDSC:25197 | |
| Commercial assay or kit | 10X chromium 3' kit V2 | 10X genomics | 10X genomics product number CG00052 | |
| Chemical compound, drug | Gibco Collagenase, type I | Thermo Fisher | Thermo Fisher catalog number 17018029 | |
| Chemical compound, drug | Trypsin LE | Thermo Fisher | Thermo Fisher catalog number 12605036 | |
| Software, algorithm | Cellranger | 10X genomics | ||
| Software, algorithm | Hisat2 | PMID:25751142 | ||
| Software, algorithm | Stringtie | PMID:25690850 | ||
| Software, algorithm | Seurat | Satija et al., 2015 | ||
| Software, algorithm | bcftools | PMID:28205675 | ||
| Software, algorithm | samJDK | Lindenbaum and Redon, 2018 | ||
| Software, algorithm | Monocle | Trapnell et al., 2014 |
Additional files
-
Supplementary file 1
Table of the 50 most enriched genes within cell types.
Calculated by Seurat, positive markers only, ranked by average fold change.
- https://doi.org/10.7554/eLife.47138.015
-
Supplementary file 2
Top 10 enriched Gene Ontology (GO) terms in every cell type.
For every gene that Seurat deemed enriched in a given cell type with a q value < 0.05, we queried the ID’s against the PANTHER web database for Drosophila melanogaster (default parameters) and kept the top 10 enriched GO terms with the highest fold change and Bonferroni-adjusted p value < 0.05.
- https://doi.org/10.7554/eLife.47138.016
-
Supplementary file 3
Mathematical comparisons of gene bias between cell types for various gene groups.
Corresponding to Figures 4 and 5, and Table 1, this table indicates the raw and Hochberg-adjusted p. values comparing each gene group’s scaled expression distribution to the scaled expression distribution of testis-specific genes and all other genes within a cell type. P.greater is the p value for the gene set being expressed higher than the control set, and p.less is the p value for the gene set being expressed less than the control set in the cell type. Hochberg-corrected p values are the final two columns in each table. For example, in early spermatids, de novo genes have a p of 2.47E-04 and an adjusted p. value of 2.72E-03 to have higher scaled expression than testis-specific genes. A simplified version of this data is presented in Table 1.
- https://doi.org/10.7554/eLife.47138.017
-
Supplementary file 4
Filtering steps for Single Nucleotide Polymorphism calls.
The 44 variants remaining at the end of the process were considered candidates for de novo germline mutations, since the reference allele is present in the population but the mutant allele is only present in germline cells.
- https://doi.org/10.7554/eLife.47138.018
-
Supplementary file 5
Counts of Single Nucleotide Polymorphisms per cell type.
‘Polymorphisms detected’ is the raw values for Figure 5A. Included for each cell type is the mean number of genes expressed and the number of cells of that type, allowing the calculation of variants/cell/covered base in Figure 5B. This table also contains, for each cell type, the number of cells with detected mutations. This is used to calculate the proportion of mutated cells in Figure 5C.
- https://doi.org/10.7554/eLife.47138.019
-
Supplementary file 6
Gene lists used to compare scaled expression bias of gene groups.
- https://doi.org/10.7554/eLife.47138.020
-
Transparent reporting form
- https://doi.org/10.7554/eLife.47138.021
Download links
A two-part list of links to download the article, or parts of the article, in various formats.
Downloads (link to download the article as PDF)
Open citations (links to open the citations from this article in various online reference manager services)
Cite this article (links to download the citations from this article in formats compatible with various reference manager tools)
Testis single-cell RNA-seq reveals the dynamics of de novo gene transcription and germline mutational bias in Drosophila
eLife 8:e47138.
https://doi.org/10.7554/eLife.47138


