Characterizing functional pathways of the human olfactory system
- Northwestern University, United States
Figures
Figure 1
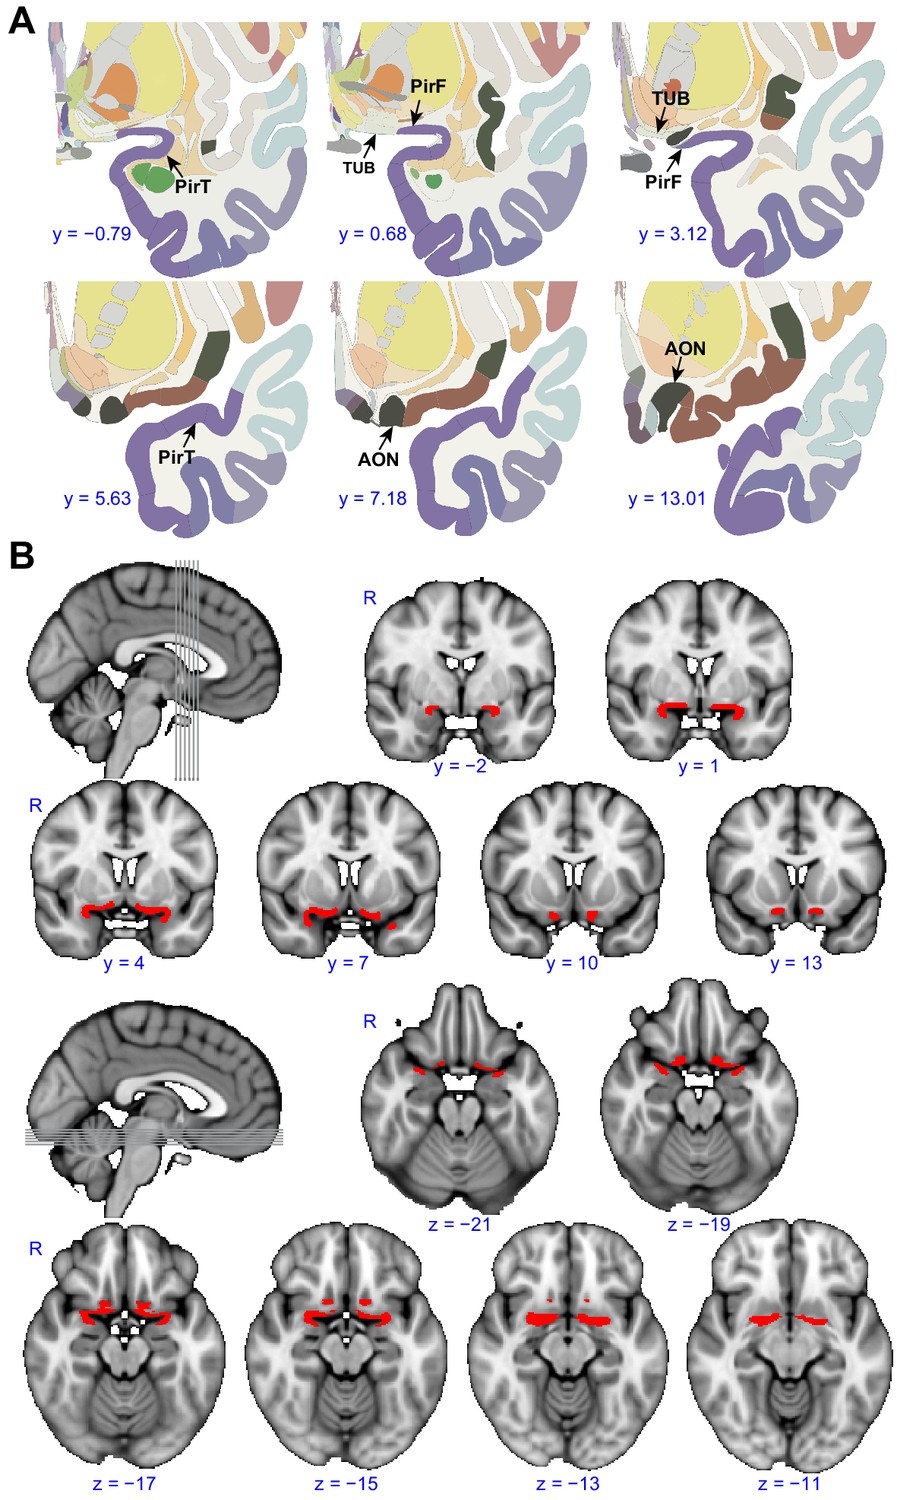
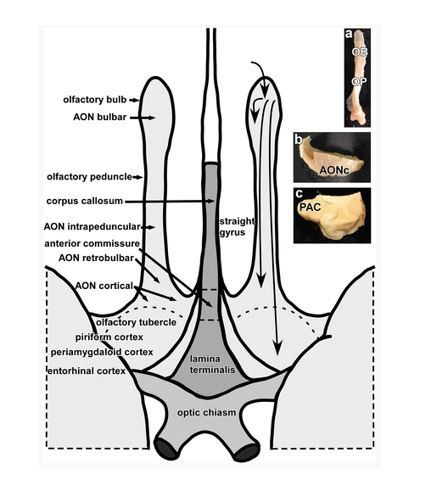
Region of interest.
(A) Panels show examples from the human brain atlas used to define the region of interest used in the parcellation analysis. Relevant areas include the anterior olfactory nucleus (AON), olfactory tubercle (TUB), and frontal (PirF) and temporal (PirT) piriform cortex (Mai et al., 2015). (B) The region of interest shown overlaid on the FSL’s MNI152_T1_1mm_brain. The coronal and axial slices correspond to the vertical and horizontal lines on the sagittal slice respectively. R, right hemisphere.
-
Figure 1—source data 1
Relates to Figure 1.
Atlas and region-of-interest of the human primary olfactory cortex.
- https://doi.org/10.7554/eLife.47177.003
Figure 2 with 2 supplements
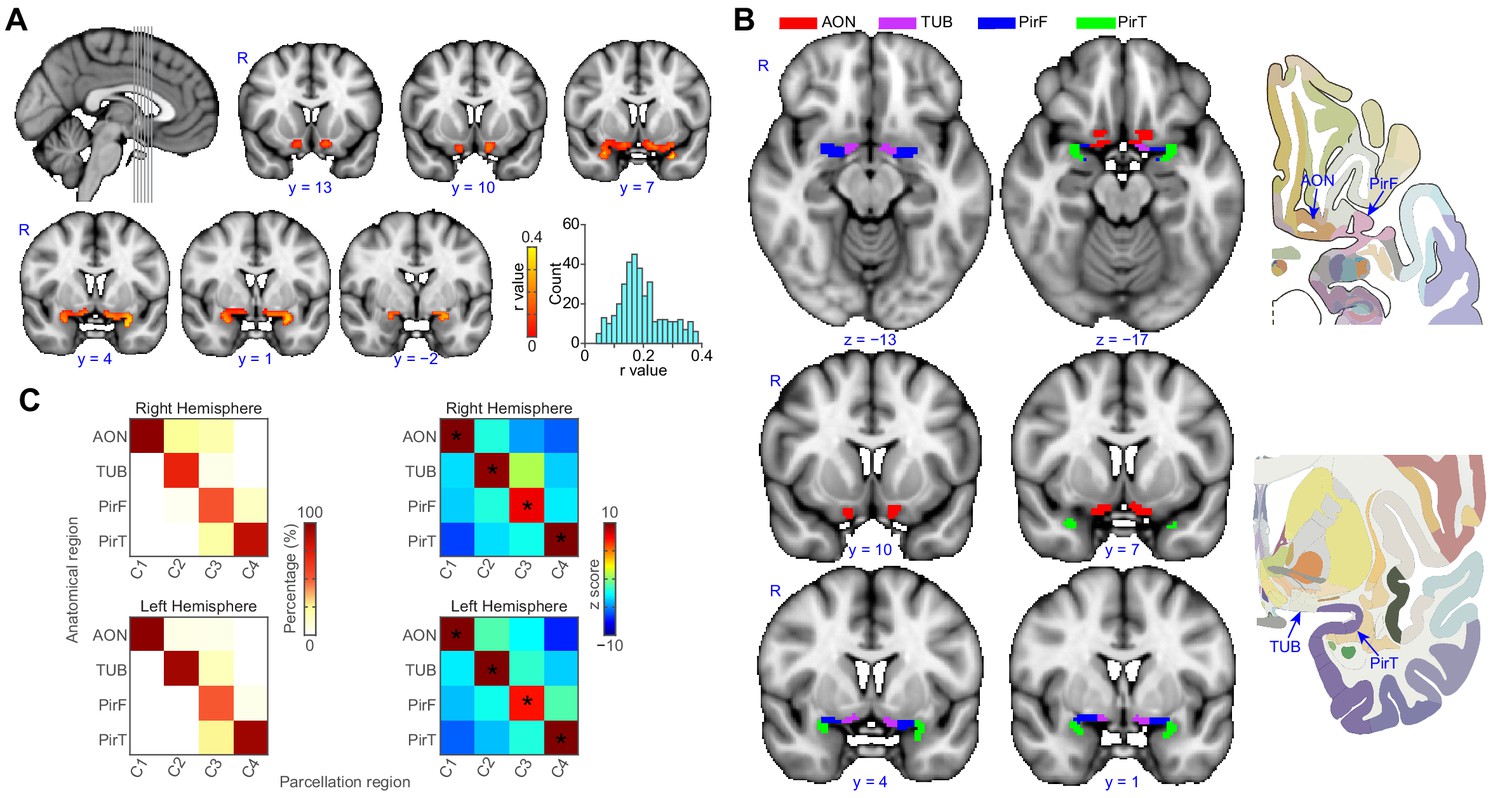
Parcellation of human left and right primary olfactory cortex.
(A) Inter-subject stability of functional connectivity patterns. The correlation of the functional connectivity patterns between each subject and all other subjects was calculated for each voxel using a leave-one-out method. The coronal slices, corresponding to the vertical lines on the sagittal slice, show the average stability map. The bar plot shows the histogram of the correlation values. (B) k-means (k = 4) clustering results shown on the FSL’s MNI152_T1_1mm_brain. The right column shows one axial and one coronal slice of the Atlas (Mai et al., 2015). (C) Parcellation accuracy of each subregion. Left column: proportion of voxels from each parcellation subdivision located within each anatomical subregion. Right column: z score of the proportion maps. * indicates p<0.001 (false discovery rate corrected). R, right hemisphere; AON, anterior olfactory tubercle; TUB, olfactory tubercle; PirF, frontal piriform cortex; PirT, temporal piriform cortex.
-
Figure 2—source data 1
Relates to Figure 2, panel (A).
Correlation between individual and group-level (leave-one-out) connectivity profiles.
- https://doi.org/10.7554/eLife.47177.008
-
Figure 2—source data 2
Relates to Figure 2, panel (B) and (C).
Manual segmentation and parcellation of the human primary olfactory cortex.
- https://doi.org/10.7554/eLife.47177.009
Figure 2—figure supplement 1
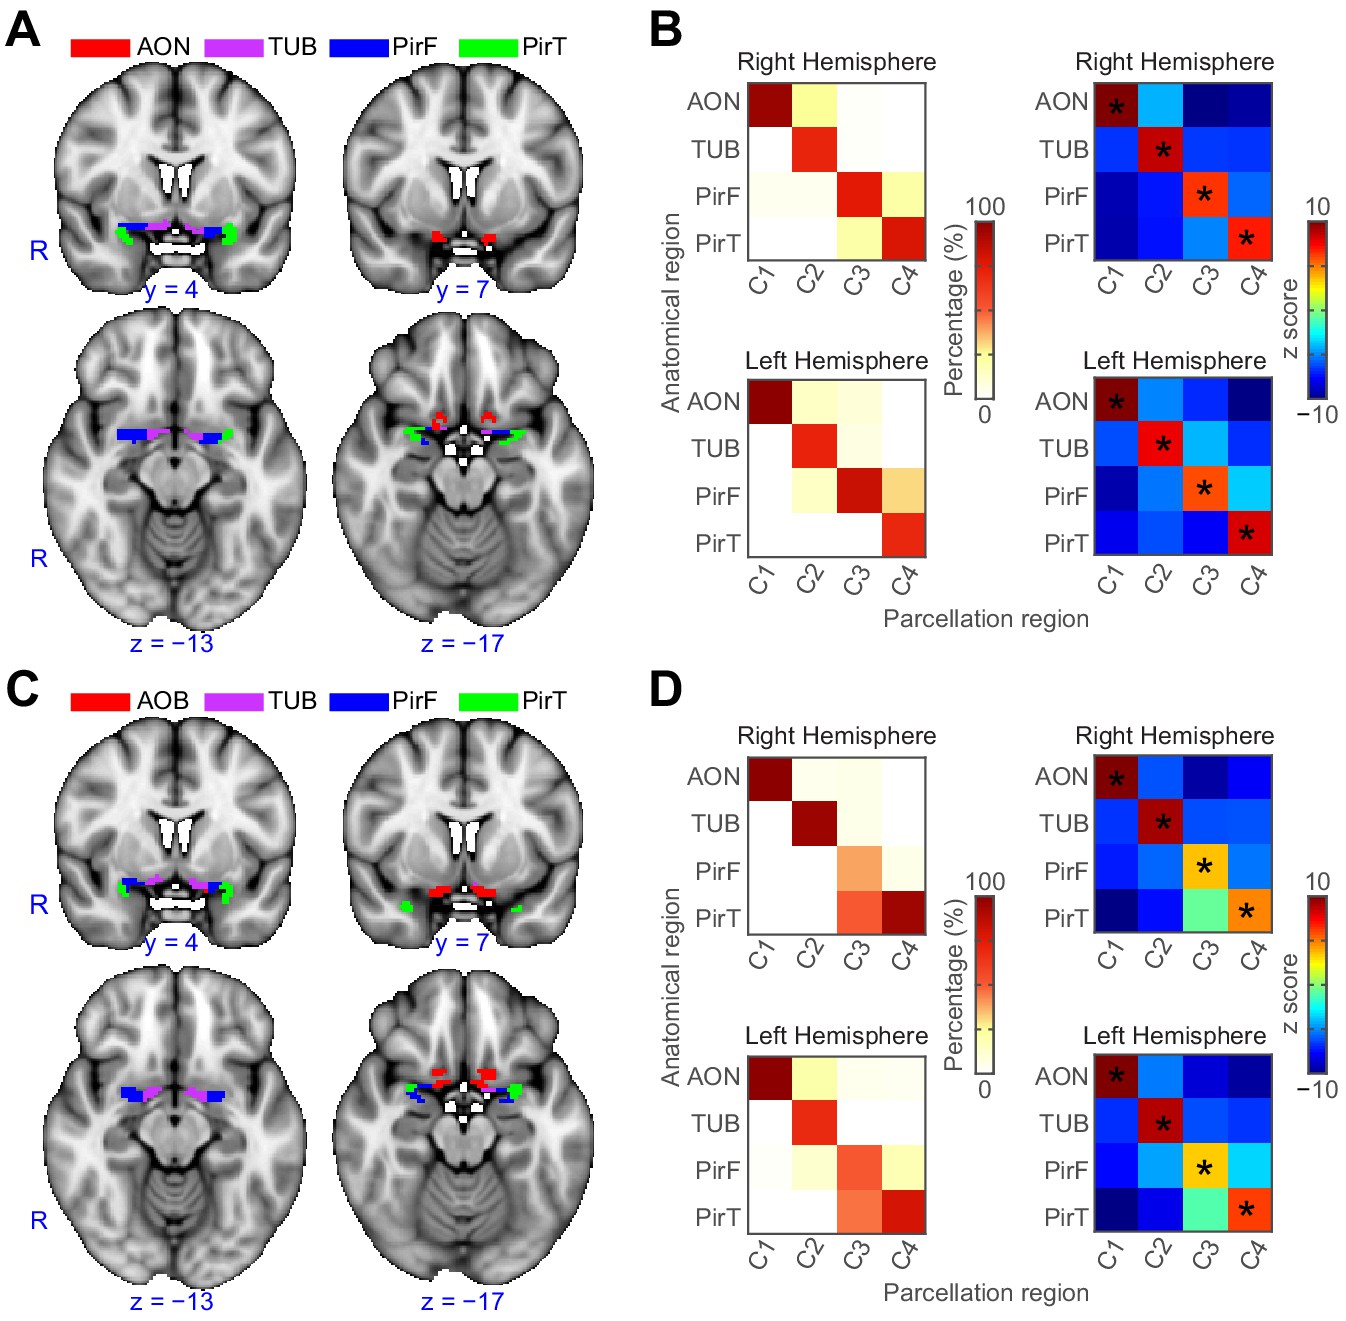
Replication analyses.
(A–B) k-means (k = 4) clustering results from the region-of-interest that was outlined independently by one of the co-authors. The parcellation accuracy of each subregion is shown in panel B. (C–D) k-means (k = 4) clustering results from an independent dataset collected for a previous study. The parcellation accuracy is shown in panel D. In panels A and C, the background is the FSL’s MNI152_T1_1mm_brain. In panels B and D, left column: proportion of voxels from each parcellation subdivision located within each anatomical subregion; right column: z score of the proportion maps. * indicates p<0.001 (false discovery rate corrected). R, right hemisphere; AON, anterior olfactory tubercle; TUB, olfactory tubercle; PirF, frontal piriform cortex; PirT, temporal piriform cortex.
-
Figure 2—figure supplement 1—source data 1
Relates to Figure 2—figure supplement 1.
Replication of parcellation results.
- https://doi.org/10.7554/eLife.47177.006
Figure 2—figure supplement 2
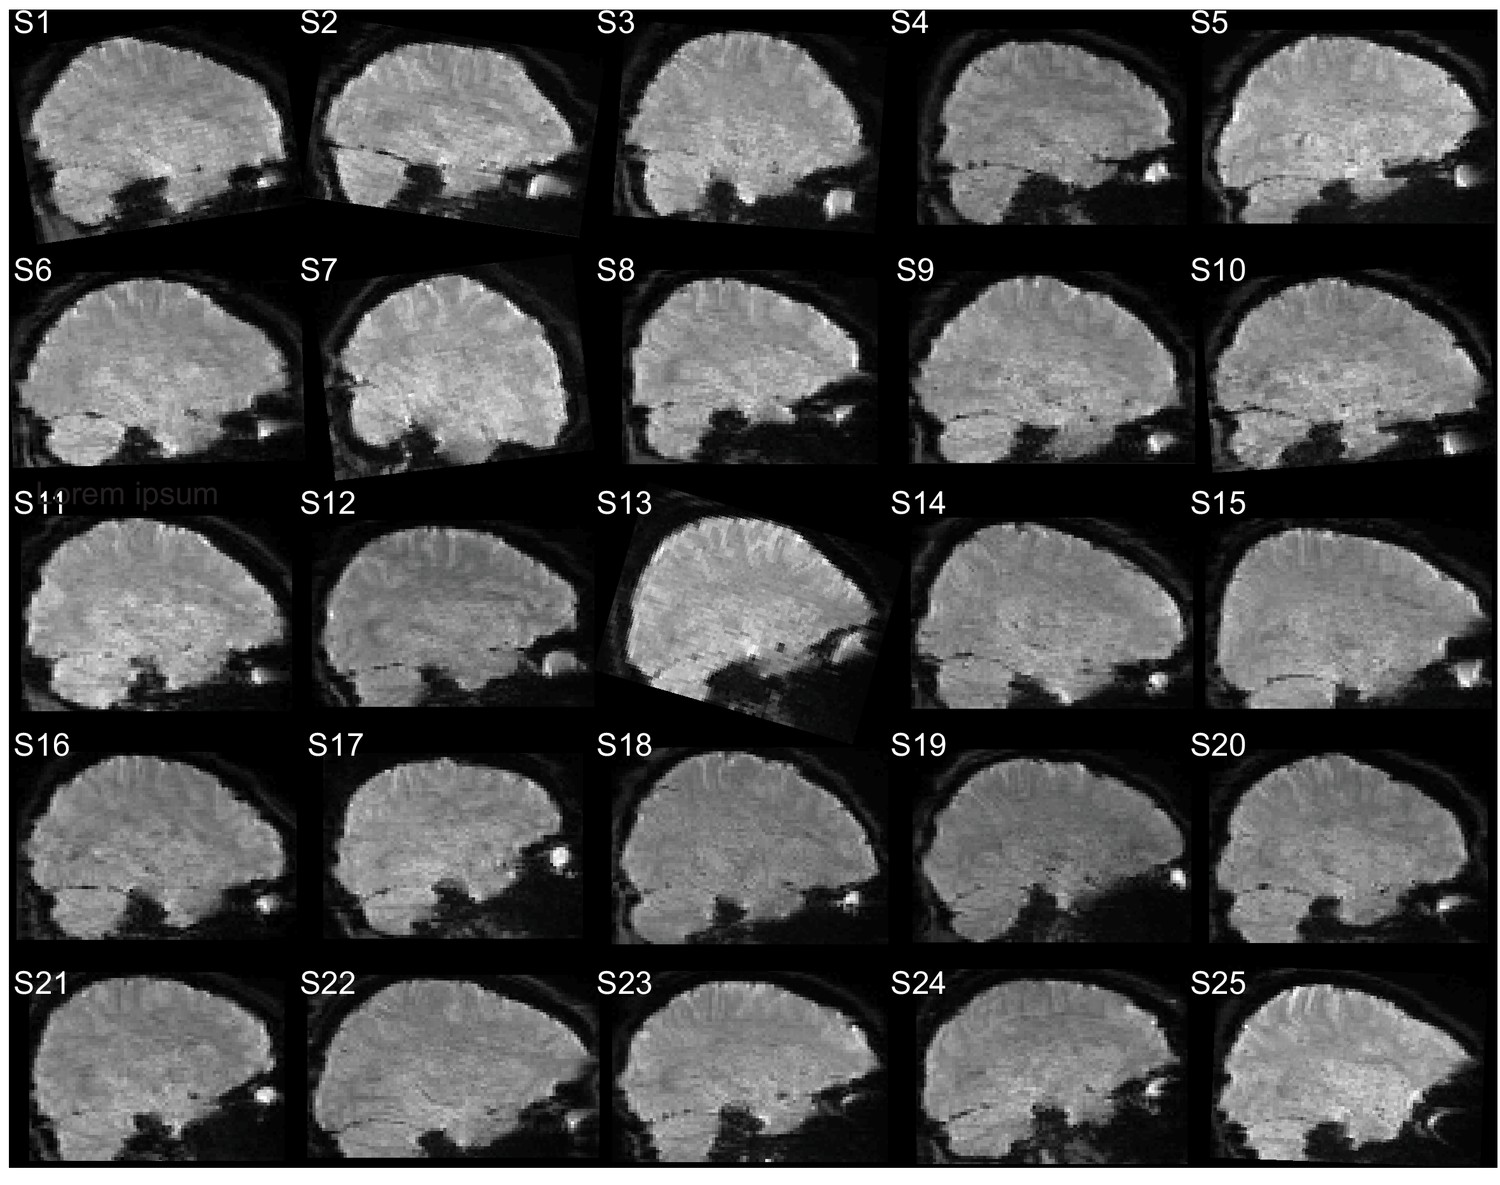
Example sagittal slice from one fMRI volume for each subject (S1–S25).
https://doi.org/10.7554/eLife.47177.007
Figure 3
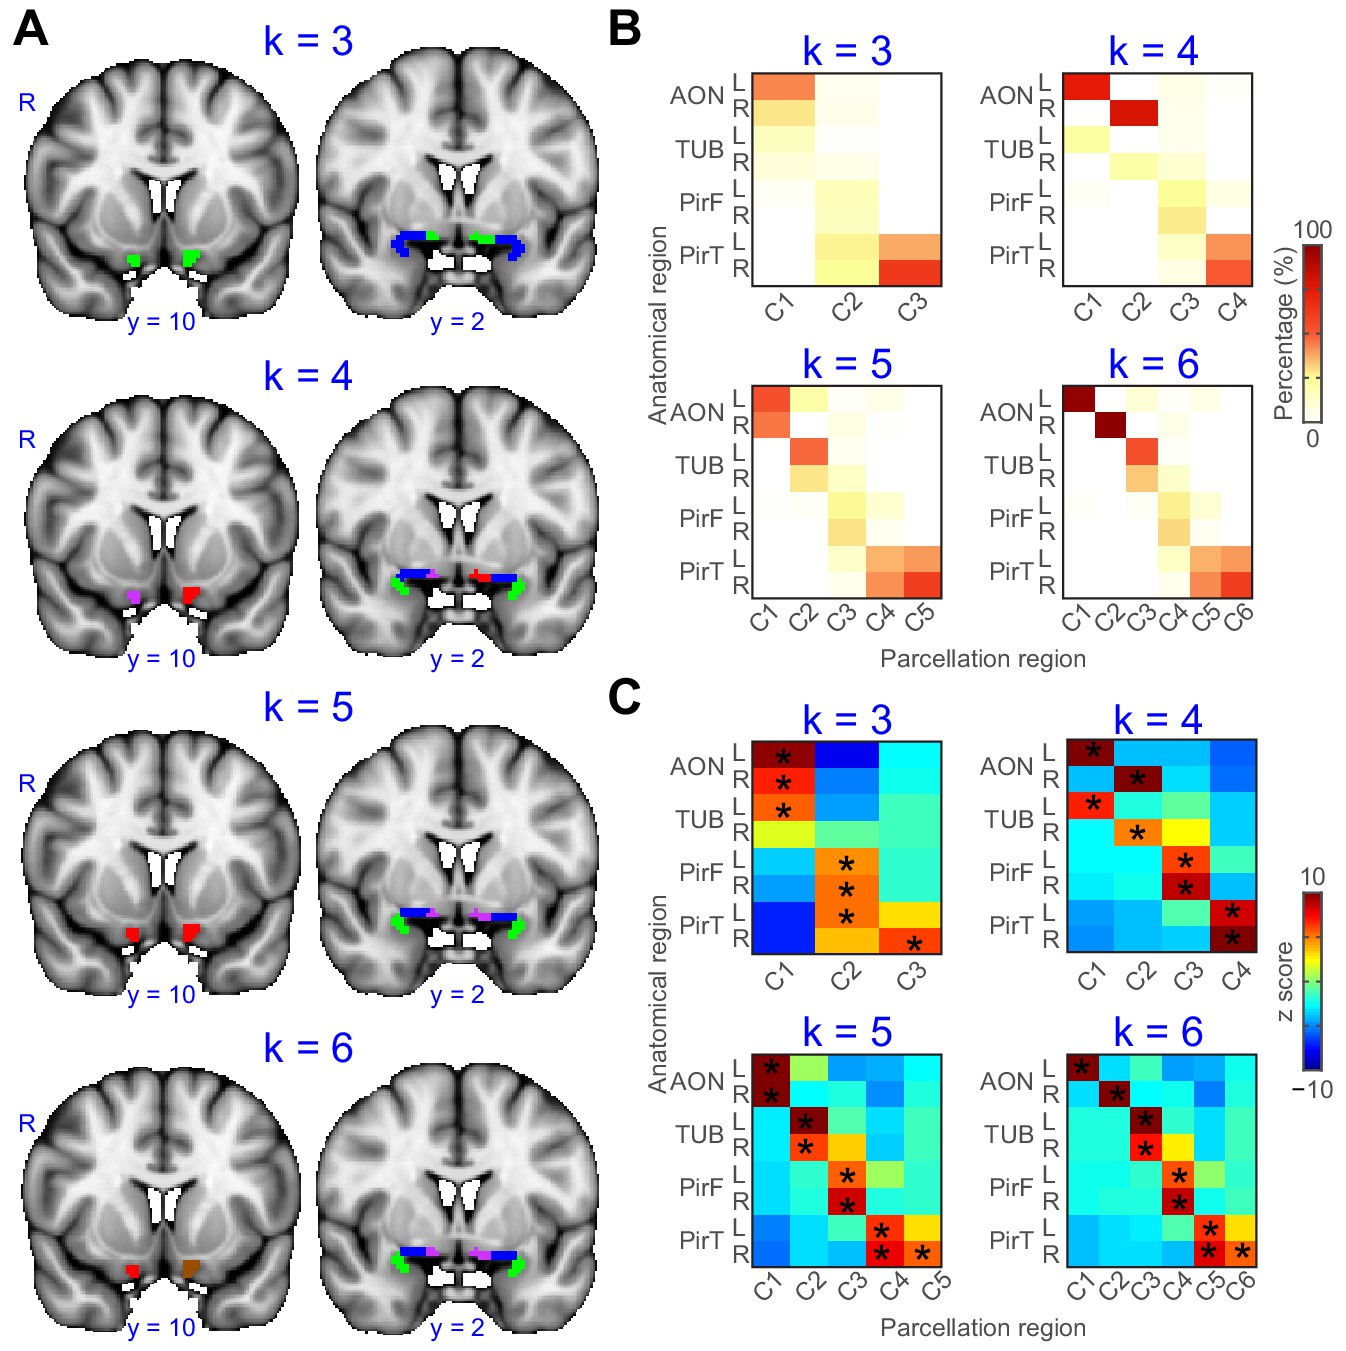
Parcellation of primary olfactory cortex combined across left and right hemispheres.
(A) k-means clustering results shown on the FSL’s MNI152_T1_1mm_brain for k = 3 to 6. Each color represents one cluster. (B) Proportion of voxels of each parcellation subdivision within each anatomical subregion. (C) z score of the proportion maps in panel B. * indicates p<0.001 (false discovery rate corrected). L, left hemisphere; R, right hemisphere; AON, anterior olfactory tubercle; TUB, olfactory tubercle; PirF, frontal piriform cortex; PirT, temporal piriform cortex.
-
Figure 3—source data 1
Relates to Figure 3.
Parcellation result (k = 3 to 6) of left and right hemispheres combined ROI.
- https://doi.org/10.7554/eLife.47177.011
Figure 4 with 1 supplement
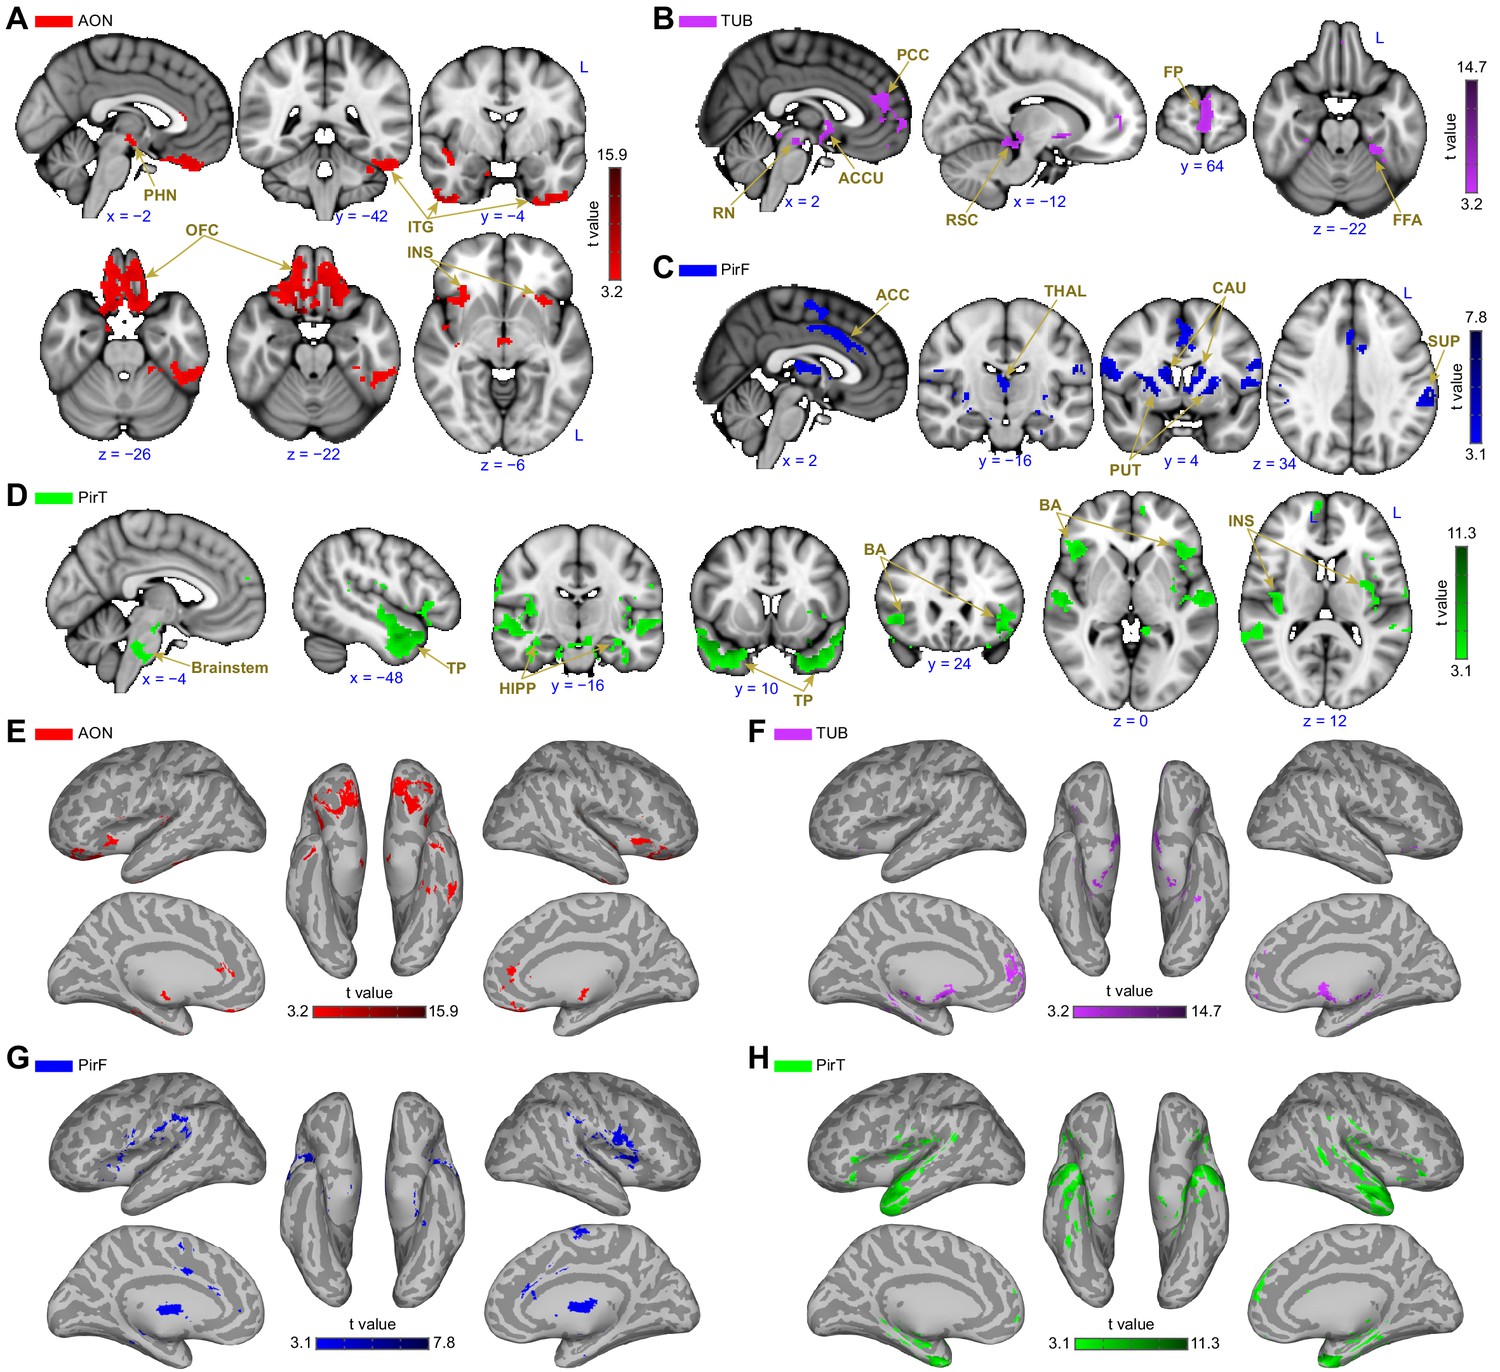
Subregion-specific functional connectivity patterns.
(A–D) Brain regions that are uniquely positively connected to each of the primary olfactory subregions including the (A) anterior olfactory nucleus (AON, red), (B) olfactory tubercle (TUB, purple), (C) frontal piriform cortex (PirF, blue) and (D) temporal piriform cortex (PirT, green). The results are shown on the FSL’s MNI152_T1_1mm_brain. (E–H) Functional connectivity maps shown on Freesurfer's cvs_avg35_inMNI152 brain surface for AON, TUB, PirF and PirT. All functional connectivity maps were thresholded at threshold-free cluster enhancement corrected p<0.001. L, left hemisphere; PHN, posterior hypothalamic nucleus; ITG, inferior temporal gyrus; OFC, orbitofrontal cortex; INS, insula; PCC, paracingulate cortex; RN, retromammillary nucleus; ACCU, accumbens; RSC, retrosplenial area; FP, frontal pole; FFA, fusiform face areas; ACC, anterior cingulate cortex; THAL, thalamus; CAU, caudate; PUT, putamen; SUP, supramarginal gyrus; TP, temporal pole; HIPP, hippocampus; BA, Broca’s area.
-
Figure 4—source data 1
Relates to Figure 4.
Statistical images of the functional connectivity of human primary olfactory cortex subregions.
- https://doi.org/10.7554/eLife.47177.017
Figure 4—figure supplement 1
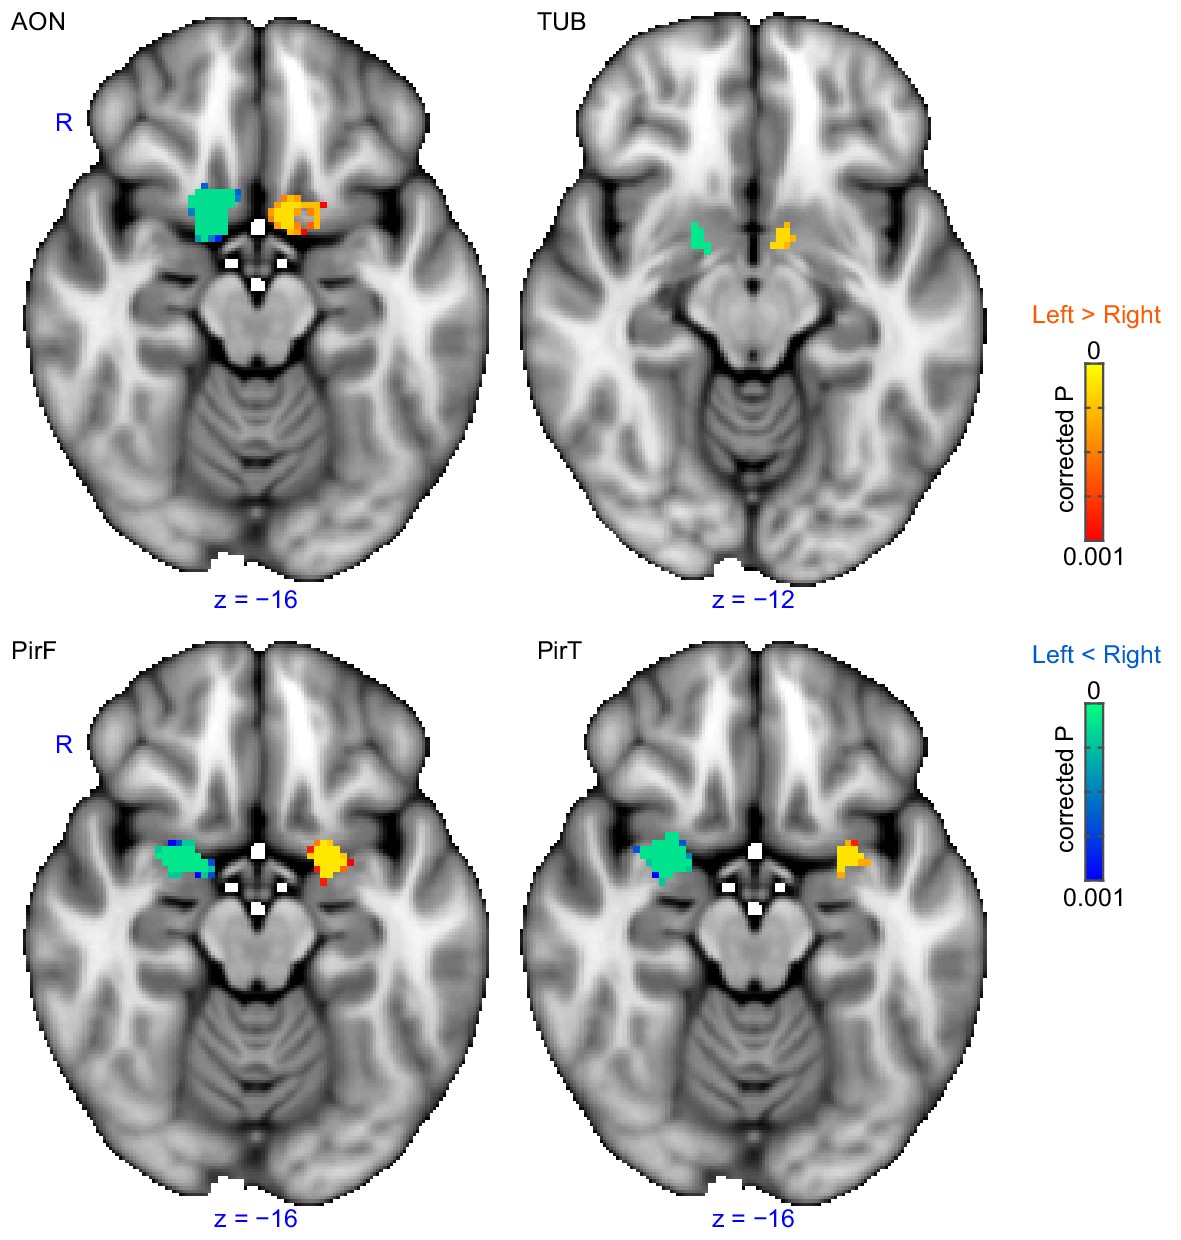
Lateralization of functional connectivity.
Left subregions show stronger within-region functional connectivity than right subregions and vice versa, and no differences across the rest of the brain. The left subregions' whole-brain functional connectivity patterns were not statistically different from those of the right subregions. The results were thresholded at threshold-free cluster enhancement corrected p<0.001 and overlaid on the FSL’s MNI152_T1_1mm_brain. R, right hemisphere; AON, anterior olfactory tubercle; TUB, olfactory tubercle; PirF, frontal piriform cortex; PirT, temporal piriform cortex.
-
Figure 4—figure supplement 1—source data 1
Relates to Figure 4—figure supplement 1.
Statistical images of lateralization-index analysis.
- https://doi.org/10.7554/eLife.47177.016
Figure 5
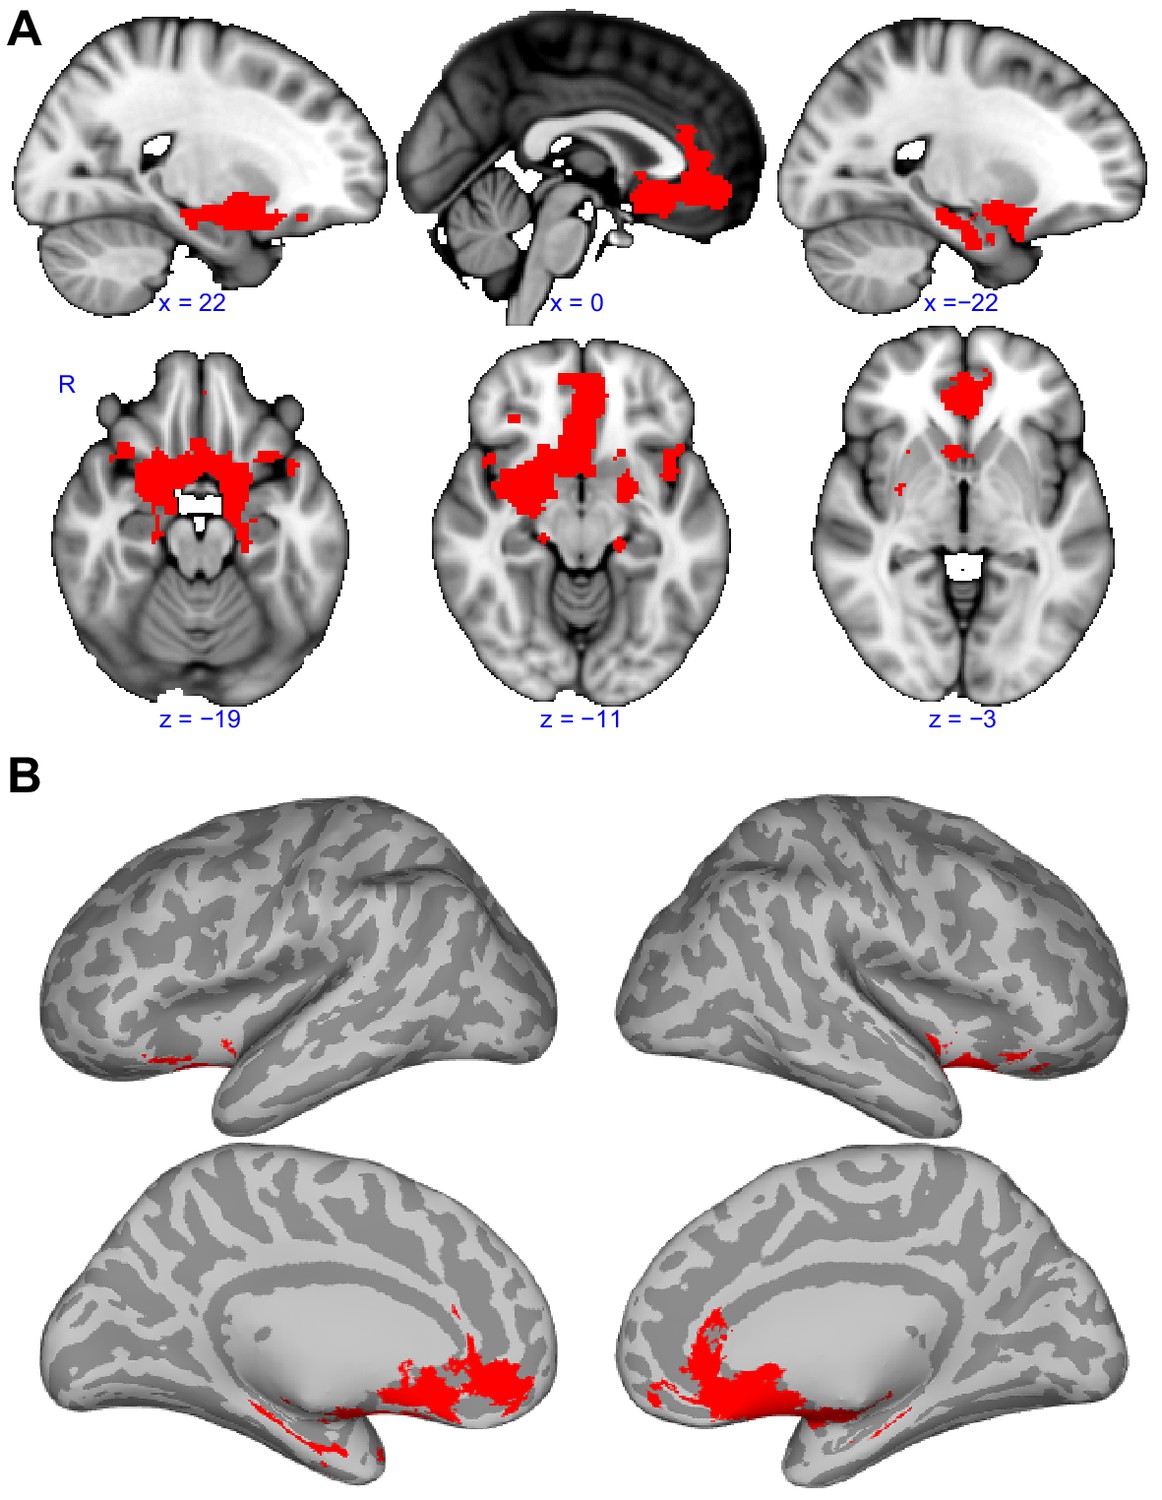
Functional connectivity common to all subregions.
(A) Brain regions that showed statistically significant positive functional connectivity with each of the primary olfactory subregions. Results are overlaid on the FSL’s sagittal and axial MNI152_T1_1mm_brain. (B) Same brain regions as in (A) shown on medial (top row) and lateral (bottom row) Freesurfer's cvs_avg35_inMNI152 brain surfaces. Red indicates the functional connectivity maps that were thresholded at threshold-free cluster enhancement corrected p<0.001. R, right hemisphere.
-
Figure 5—source data 1
Relates to Figure 5.
Functional connectivity patterns common to all human primary olfactory cortex subregions.
- https://doi.org/10.7554/eLife.47177.019
Figure 6
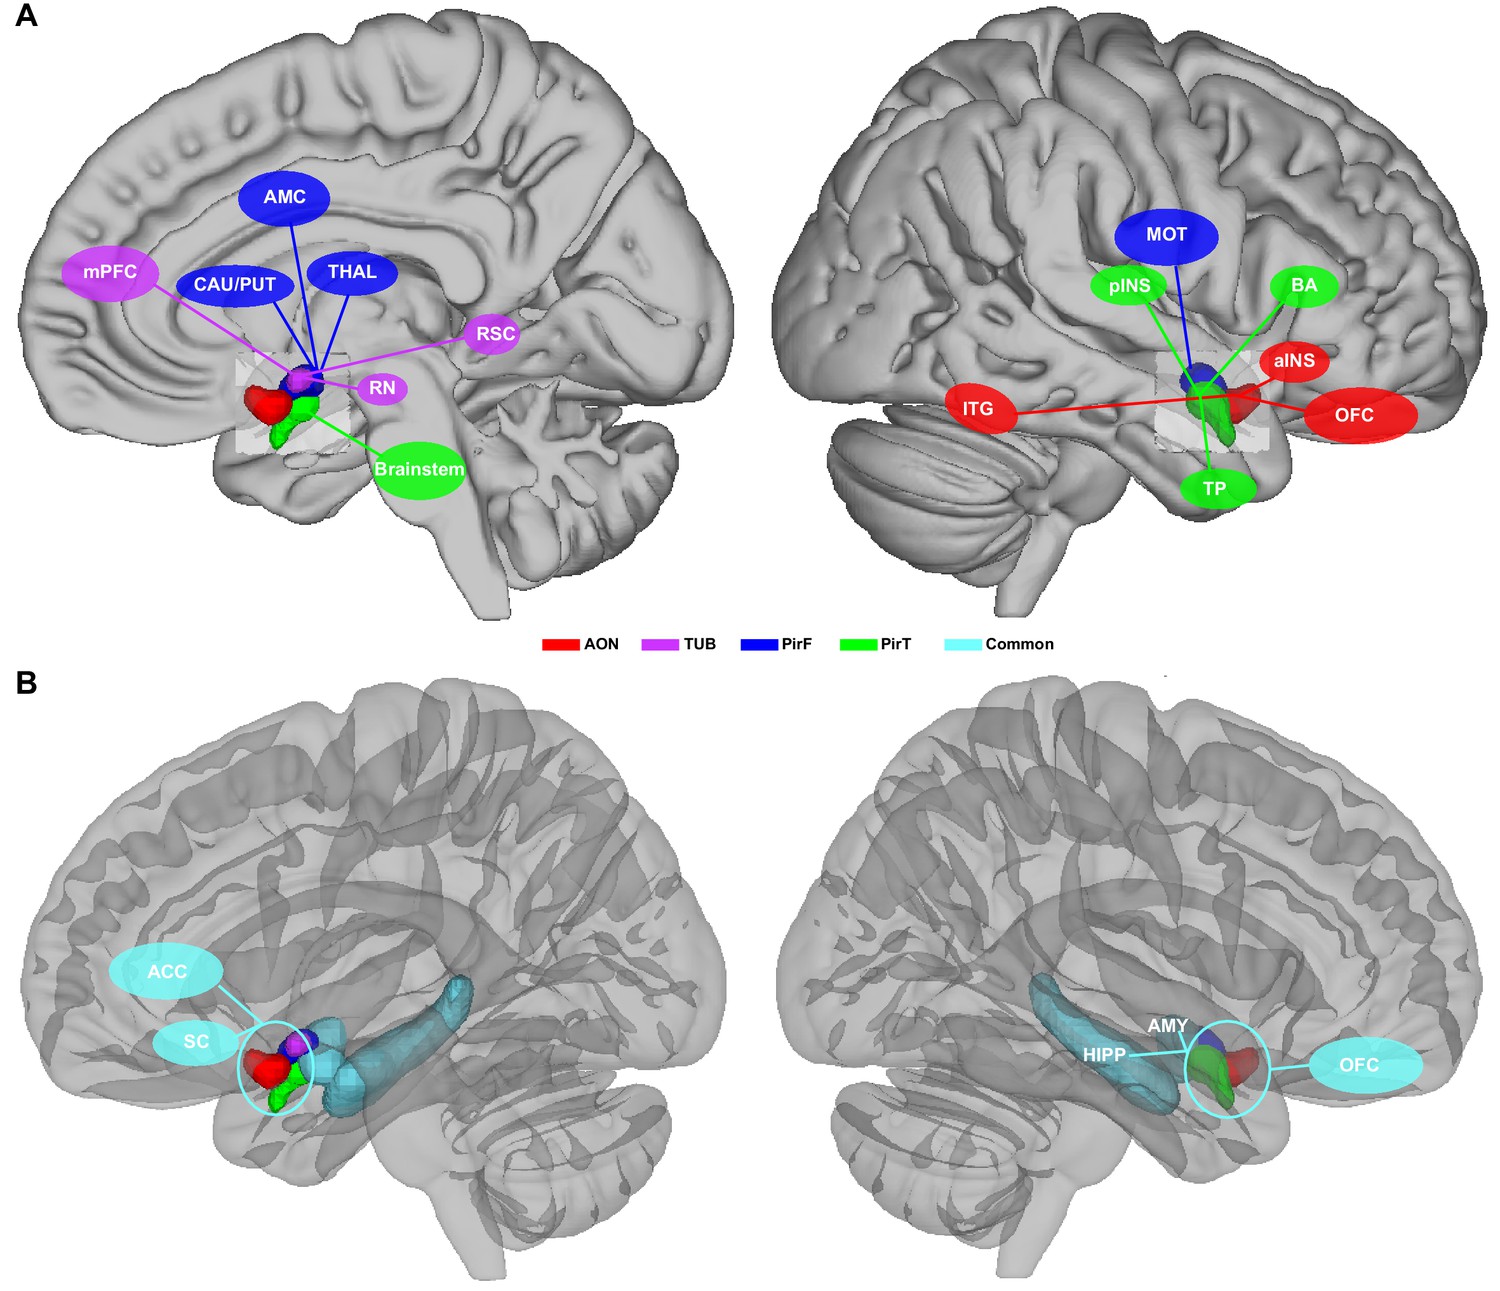
Schematic illustrative summary of the functional organization of human primary olfactory cortex.
(A) Summary of brain regions that are uniquely connected to each subregion, including the anterior olfactory nucleus (AON), olfactory tubercle (TUB), frontal piriform cortex (PirF), and temporal piriform cortex (PirT). (B) Summary of brain regions that are commonly connected to all subregions. mPFC, medial prefrontal cortex; CAU, caudate; PUT, putamen; AMC, anterior mid-cingulate cortex; THAL, thalamus; RN, red nucleus; RSC, retrosplenial cortex; ITG, inferior temporal gyrus; pINS, posterior insular cortex; MOT, motor area; TP, temporal pole; BA, Broca's area; aINS, anterior insular cortex; OFC, orbitofrontal cortex; ACC, anterior cingulate cortex; SC, subcallosal cortex; HIPP, hippocampus; AMY, amygdala.
-
Figure 6—source data 1
Relates to Figure 6.
Source files for constructing the schematic illustrative model.
- https://doi.org/10.7554/eLife.47177.021
Author response image 1
Tables
Table 1
Summary of functional connectivity results.
https://doi.org/10.7554/eLife.47177.012| Volume (mm3) | |||||
|---|---|---|---|---|---|
| Label | Overlap | AON | TUB | PirF | PirT |
| Frontal Orbital Cortex | 2592 | 3000 | 144 | - | 1048 |
| Frontal Medial Cortex | 992 | 1120 | - | - | - |
| Cingulate Gyrus | 2760 | 200 | 80 | 2304 | - |
| Insular Cortex | 384 | 496 | - | 224 | 832 |
| Subcallosal Cortex | 3632 | 616 | - | - | - |
| Caudate | 136 | 120 | - | 2024 | - |
| Paracingulate Gyrus | 1336 | - | 2600 | - | - |
| Parahippocampal Gyrus | 296 | - | 464 | - | 2584 |
| Temporal Pole | 328 | - | - | - | 9184 |
| Putamen | 1368 | - | - | 3376 | 96 |
| Hippocampus | 1176 | - | - | 136 | 1448 |
| Amygdala | 2120 | - | - | - | - |
| Accumbens | 336 | - | - | - | - |
| Planum Polare | - | 248 | - | - | 480 |
| Frontal Pole | - | 2792 | 1504 | - | 736 |
| Temporal Fusiform Cortex | - | 688 | 352 | - | 1240 |
| Inferior Frontal Gyrus | - | 208 | - | - | - |
| Inferior Temporal Gyrus | - | 1224 | - | - | 248 |
| Heschl's Gyrus (includes H1 and H2) | - | 80 | - | - | 208 |
| Planum Temporale | - | 104 | - | - | 96 |
| Brainstem | - | - | 592 | - | 6056 |
| Thalamus | - | - | 120 | 1384 | - |
| Pallidum | - | - | - | 504 | - |
| Precentral Gyrus | - | - | - | 1616 | - |
| Postcentral Gyrus | - | - | - | 216 | 296 |
| Frontal Operculum Cortex | - | - | - | 128 | 336 |
| Central Opercular Cortex | - | - | - | 224 | 376 |
| Supramarginal Gyrus | - | - | - | 808 | - |
| Juxtapositional Lobule Cortex | - | - | - | 1104 | - |
| Superior Frontal Gyrus | - | - | - | - | 128 |
| Temporal Occipital Fusiform Cortex | - | - | - | - | 344 |
| Superior Temporal Gyrus | - | - | - | - | 1464 |
| Middle Temporal Gyrus | - | - | - | - | 1368 |
| Angular Gyrus | - | - | - | - | 256 |
| Parietal Operculum Cortex | - | - | - | - | 640 |
-
The volumes of statistically significant voxels in each brain region are shown for overlapping and subregion-specific clusters. The Overlap column does not include subregion-specific regions. - indicates volume less than 80 mm3 (10 voxels). Atlas query was conducted with FSL's HarvardOxford-cort-maxprob-thr50-2mm and HarvardOxford-sub-maxprob-thr50-2mm atlases. AON, anterior olfactory nucleus; TUB, olfactory tubercle; PirF, frontal piriform cortex; PirT, temporal piriform cortex.
-
Table 1—source data 1
Functional connectivity profile of each subregion.
- https://doi.org/10.7554/eLife.47177.013
Additional files
-
Transparent reporting form
- https://doi.org/10.7554/eLife.47177.022
Download links
A two-part list of links to download the article, or parts of the article, in various formats.
Downloads (link to download the article as PDF)
Open citations (links to open the citations from this article in various online reference manager services)
Cite this article (links to download the citations from this article in formats compatible with various reference manager tools)
Characterizing functional pathways of the human olfactory system
eLife 8:e47177.
https://doi.org/10.7554/eLife.47177


