GPIHBP1 expression in gliomas promotes utilization of lipoprotein-derived nutrients
- University of California, Los Angeles, United States
- VIB-KU Leuven Center for Cancer Biology (CCB), Belgium
- Uppsala University, Sweden
- Karolinska Institutet, Sweden
- Max Delbrück Center for Molecular Medicine, Germany
- University of Western Australia, Australia
Figures
Figure 1 with 1 supplement

GPIHBP1 expression in the endothelial cells of several human gliomas.
Immunohistochemical studies on surgically resected gliomas (Gliomas 1, 5, 9; Table 1) and non-diseased human frontal lobe (n = 3), revealing GPIHBP1 expression in capillaries of gliomas but not in frontal lobe specimens. GPIHBP1 (detected with a combination of the mAbs RE3 and RF4, 10 μg/ml each [red]) colocalized with von Willebrand factor (vWF, a marker for endothelial cells [green]), but not with glial fibrillary acidic protein (GFAP, a marker for astroglial cells [magenta]). DNA was stained with DAPI (blue). Three sections of each tumor and normal brain were evaluated and representative images are shown. Scale bar, 50 μm.
Figure 1—figure supplement 1
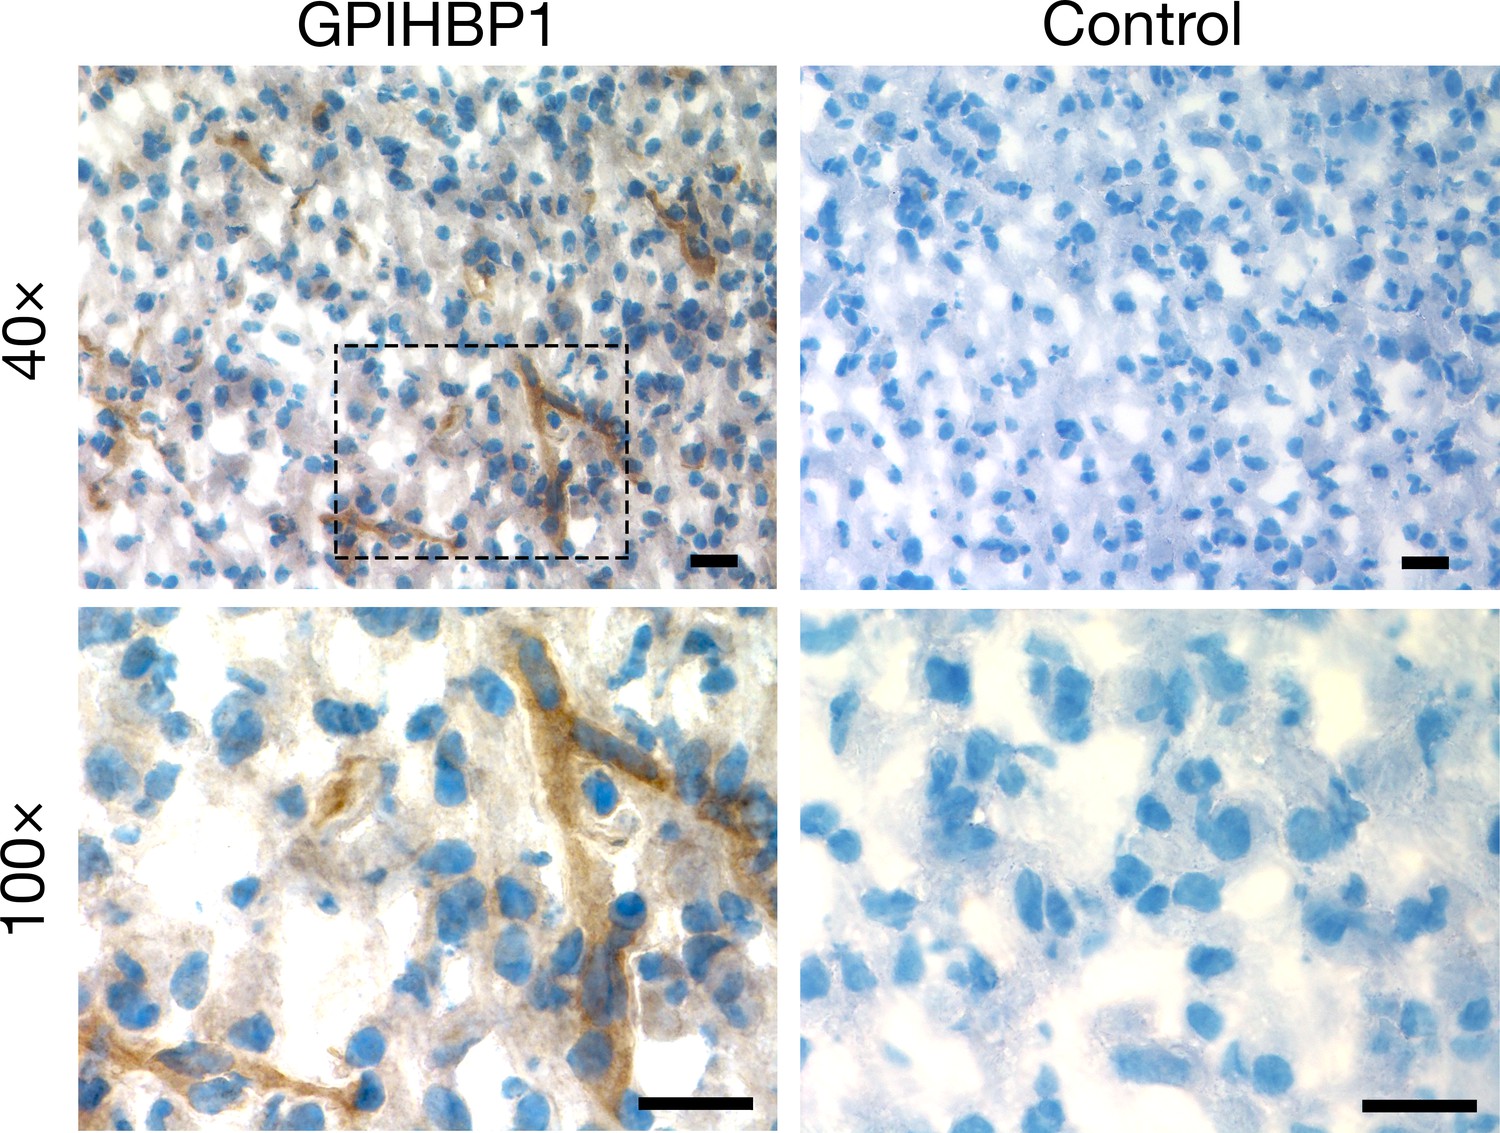
Detecting GPIHBP1 in glioma capillaries with immunoperoxidase staining.
Immunohistochemical studies on glioma sample 5 revealed GPIHBP1 in capillaries (detected by mAb RF4; left). In the control panel (right), the section was handled in the same fashion, except that the incubation with the primary antibody was omitted. Images were recorded with 40× and 100× objectives. The boxed region in the 40× image (upper left) is shown at higher magnification in the 100× image (lower left). Three sections of tumor were evaluated and representative images are shown. Scale bar, 20 μm.
Figure 2
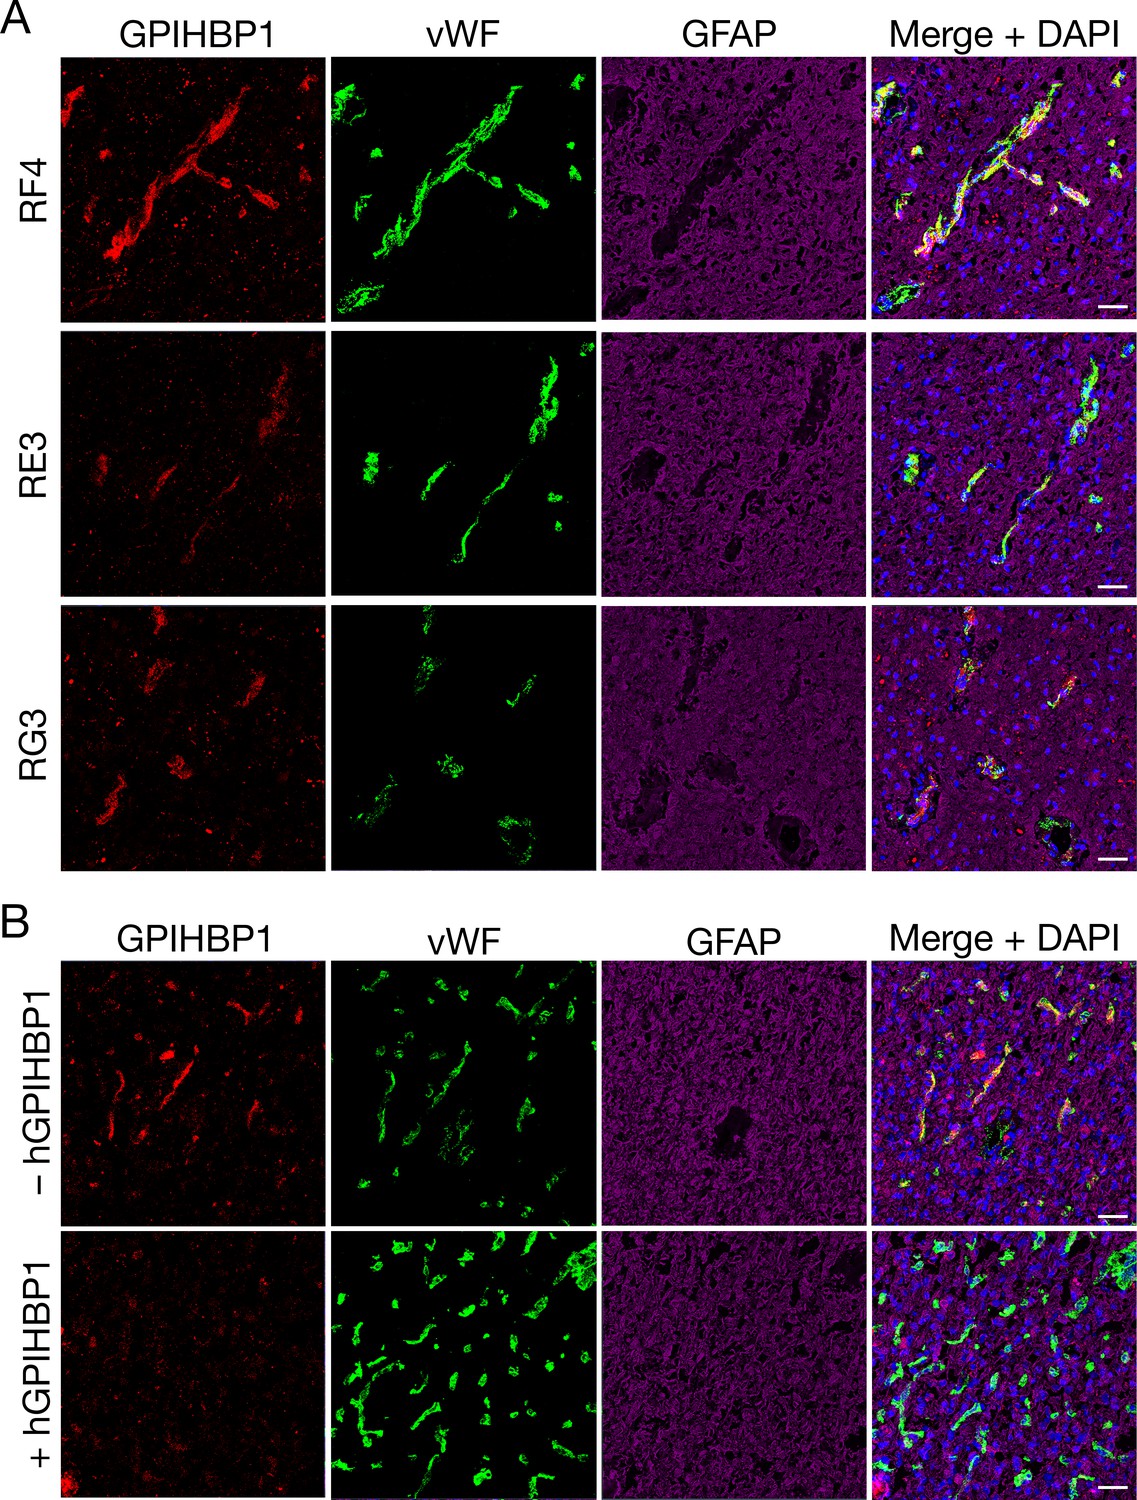
Detecting GPIHBP1 in capillaries of human glioma specimens with three different monoclonal antibodies (mAbs) against GPIHBP1.
(A) Confocal fluorescence microscopy studies on sections from glioma sample 1 (Table 1), demonstrating the detection of GPIHBP1 with three different human GPIHBP1–specific monoclonal antibodies (mAbs). Tissue sections were fixed with 3% PFA and then stained with mAbs against human GPIHBP1 (RF4, RE3, or RG3, 10 μg/ml [red]), an antibody against von Willebrand factor (vWF[green]), and an antibody against glial fibrillary acidic protein (GFAP [magenta]). All three GPIHBP1-specific mAbs detected GPIHBP1 in capillaries, colocalizing with von Willebrand factor. DNA was stained with DAPI (blue). Scale bar, 50 μm. (B) Immunofluorescence confocal microscopy studies on human glioma sample 5, performed with mAbs RF4 and RE3 (10 μg/ml) in the presence or absence of 50 μg of recombinant soluble human GPIHBP1 (hGPIHBP1). Adding recombinant hGPIHBP1 to the antibody incubation abolished binding of the GPIHBP1-specific mAbs to GPIHBP1 on glioma capillaries. Images show GPIHBP1 (red), vWF (green), GFAP (magenta), and DAPI (blue). Three sections of tumors were evaluated; representative images are shown. Scale bar, 50 μm.
Figure 3 with 3 supplements
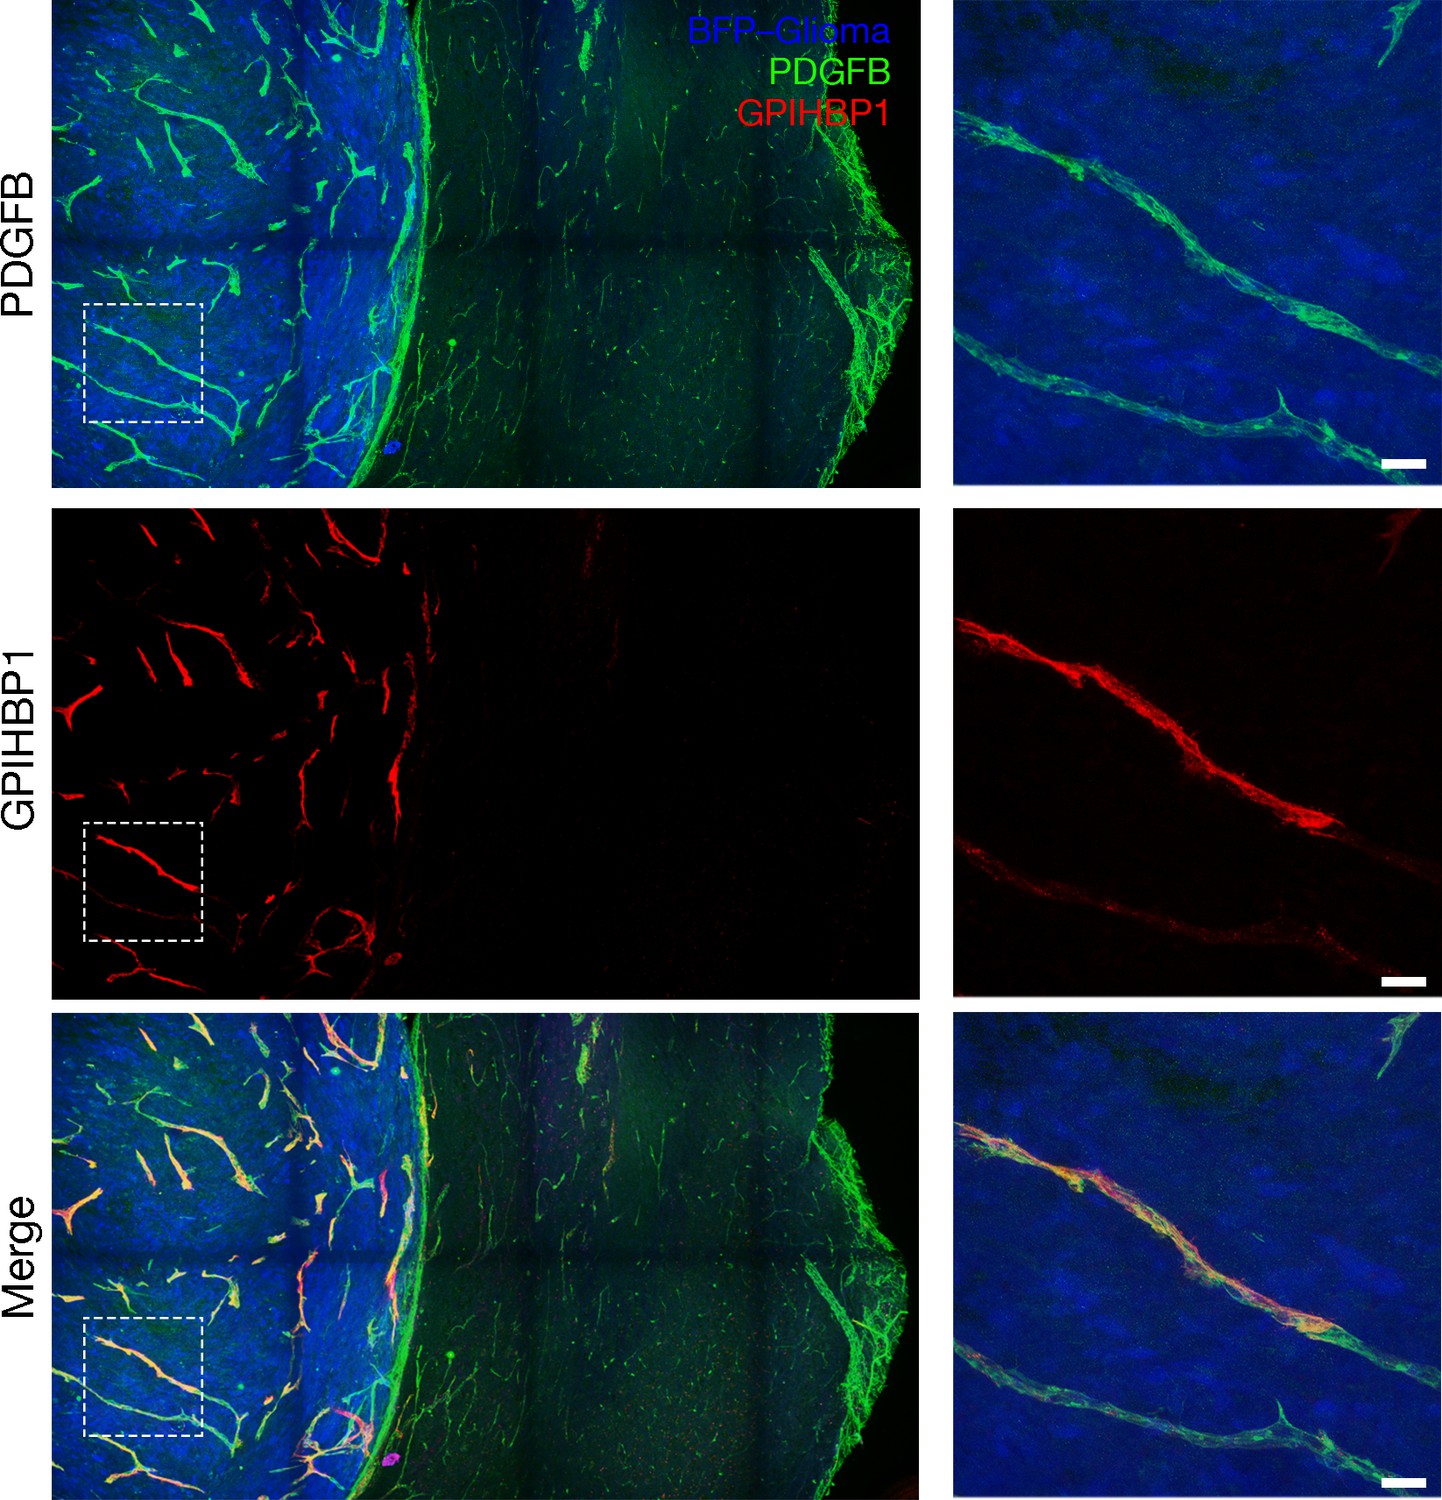
GPIHBP1 is expressed by capillary endothelial cells in mouse gliomas.
Confocal microscopy images of a BFP-tagged CT-2A glioma implanted in a ROSAmT/mG::Pdgfb-iCreERT2 mouse, revealing the expression of GPIHBP1 in capillary endothelial cells of the glioma but not those of normal brain. Tamoxifen was administered prior to implantation of the glioma spheroid to activate membrane-targeted EGFP in endothelial cells (green). After three weeks of glioma growth, mice were anesthetized and injected via the tail vein with an Alexa Fluor 647–labeled antibody against mouse GPIHBP1 (11A12; red). The mice were then perfused with PBS and perfusion-fixed with 2% PFA in PBS. Glioma and adjacent normal brain were harvested, and 200-μm-thick sections were imaged by confocal microscopy. GPIHBP1 was present on endothelial cells of the glioma (blue) but was absent from normal brain. High-magnification images of the boxed area are shown on the right. Three mice were evaluated; representative images are shown. Scale bar, 50 μm.
Figure 3—figure supplement 1
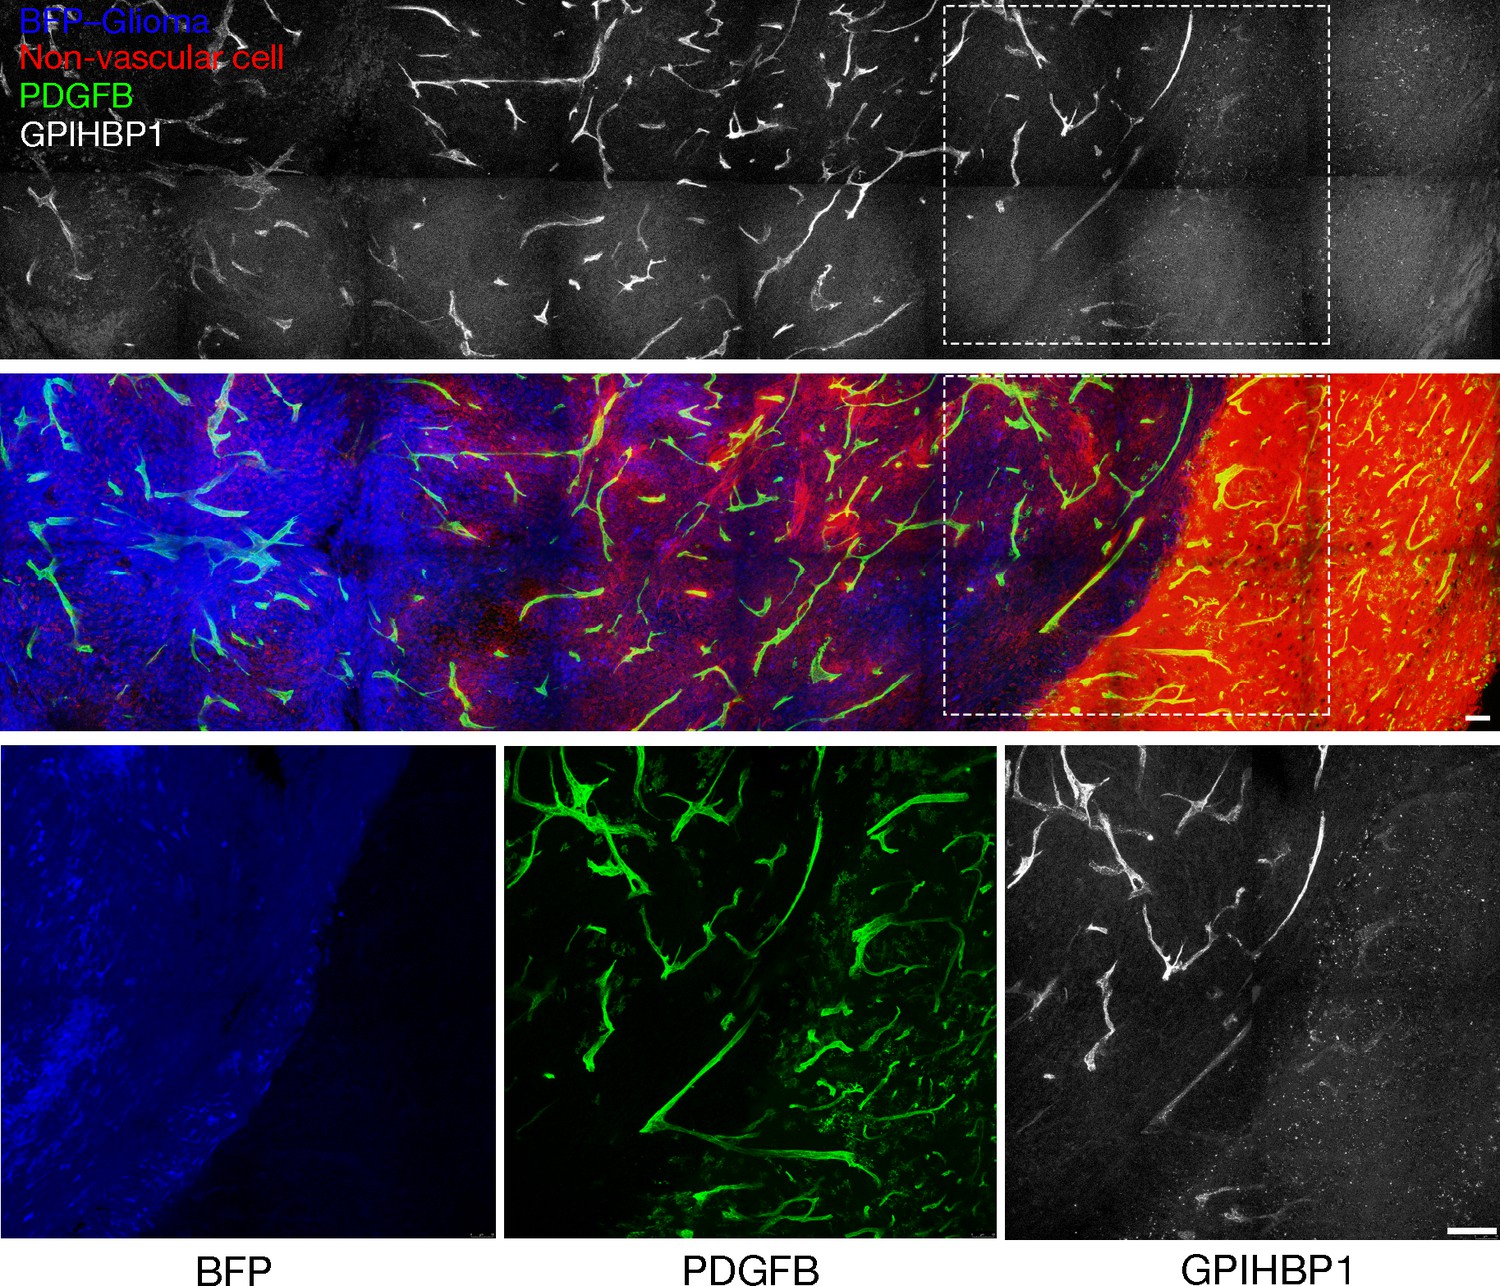
GPIHBP1 is expressed in the capillaries of mouse glioma but not normal brain.
Confocal immunofluorescence imaging of a BFP-tagged CT-2A glioma and adjacent normal brain in a ROSAmT/mG::Pdgfb-iCreERT2 mouse, revealing GPIHBP1 in the capillary endothelial cells of the glioma but not those of normal brain. Before implantation of glioma spheroids, mice were treated with tamoxifen to activate membrane-targeted EGFP expression in endothelial cells (green). Non-tumor cells expressed membrane-targeted tdTomato (red). Mice were injected intravenously (via the tail vein) with an Alexa Fluor 647–labeled antibody against mouse GPIHBP1 (11A12; white), then perfused with PBS and perfusion-fixed with 2% PFA. Glioma and normal brain were harvested, sectioned (200-μm-thick), and imaged by confocal microscopy. GPIHBP1 (white) colocalized with endothelial cells (green) in glioma (blue) but not in normal brain (red). High-magnification images of the boxed areas are shown below. Three mice were evaluated; representative images are shown. Scale bar, 200 μm.
Figure 3—figure supplement 2
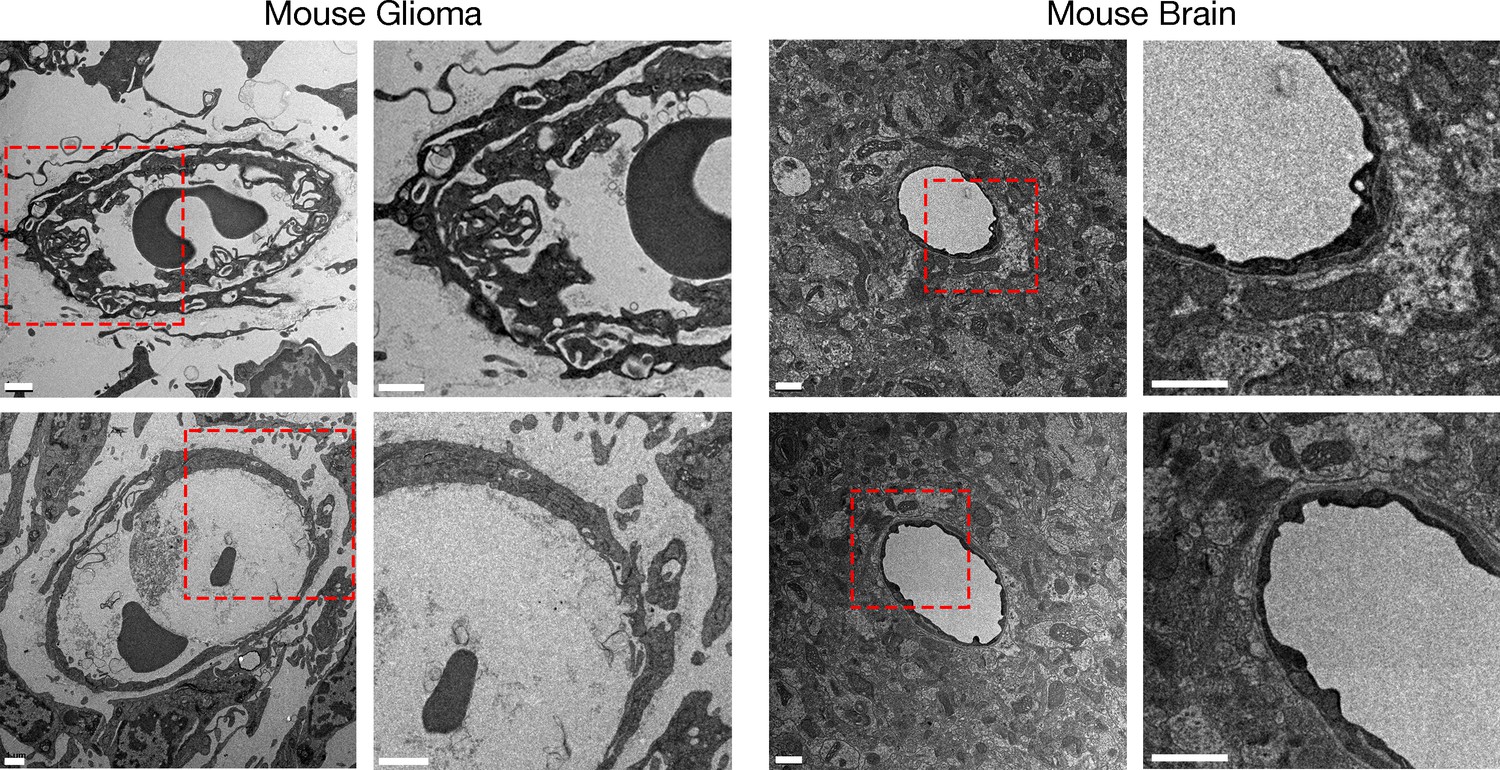
The morphology of glioma capillaries differs from that of capillaries in normal brain, as revealed by transmission electron microscopy (TEM).
A four-month-old C57BL/6 mouse harboring a CT-2A glioma was euthanized and perfusion-fixed with carbodiimide/glutaraldehyde before sections of glioma and brain were processed for TEM. Electron micrographs of the glioma revealed irregularly shaped and large capillaries with villus-like structures on the luminal surface of capillary endothelial cells. Higher magnification images of the boxed areas are shown to the right. Scale bar, 1 μm.
Figure 3—figure supplement 3
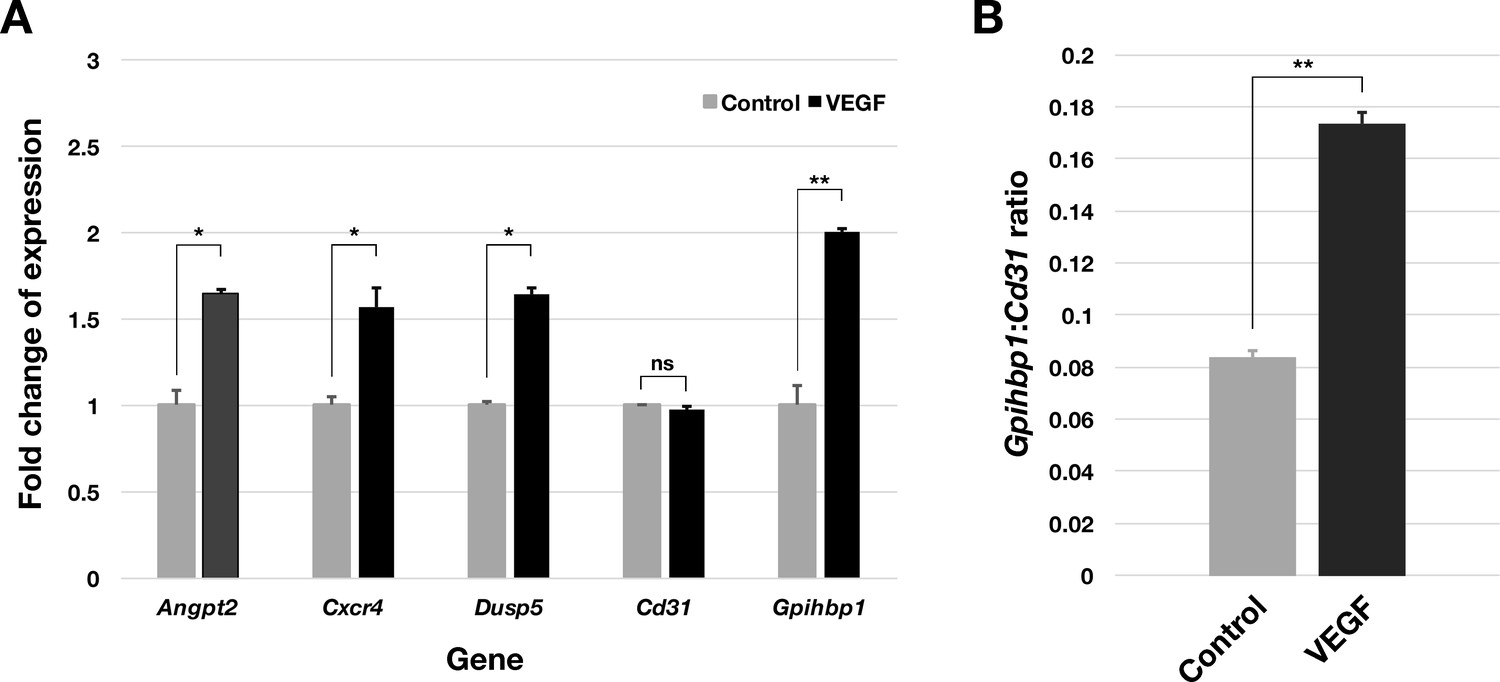
Vascular endothelial growth factor (VEGF) increases Gpihbp1 transcript levels in the mouse brain microvascular endothelial cell line bEnd.3.
The endothelial cells were cultured in medium in the presence or absence of mouse VEGF (100 ng/ml) for 24 hr. (A) Transcript levels for Gpihbp1, Cd31 (an endothelial cell gene), and three genes known to be upregulated by VEGF (Angpt2, Cxcr4, and Dusp5) were measured by qRT-PCR (n = 3 replicates). VEGF increased transcript levels for Angpt2, Cxcr4, Dups5, and Gpihbp1. (B) Gpihbp1:Cd31 transcript ratio in the absence of VEGF (Control) and in the presence of VEGF. Differences were assessed with a Student’s t-test. *p<0.01; **p<0.001. ns, not significant.
Figure 4 with 4 supplements

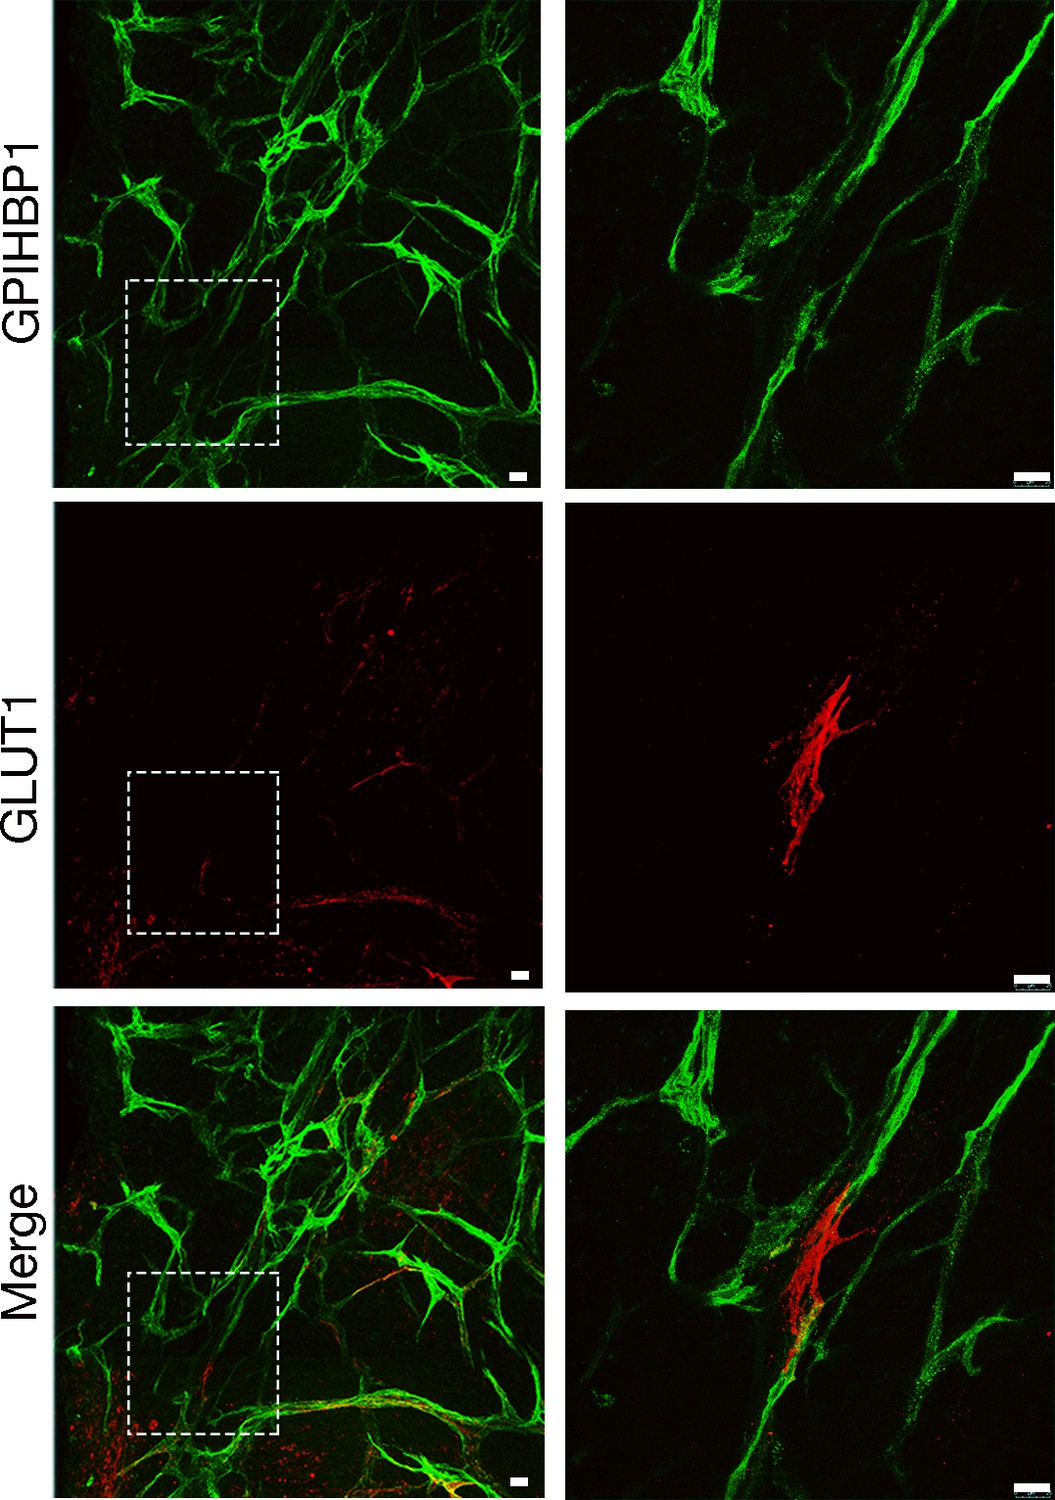
Expression of GPIHBP1 and GLUT1 in the endothelial cells of mouse gliomas.
Immunohistochemical studies of a BFP-expressing CT-2A glioma (after three weeks of growth). Mice were injected via the tail vein with an Alexa Fluor 647–labeled antibody against mouse GPIHBP1 (11A12; green), then perfused with PBS and perfusion-fixed with 2% PFA. Glioma and adjacent normal brain tissue were harvested, then 200-μm thick sections cut, fixed with 4% PFA, and stained with an antibody against GLUT1 (red). GPIHBP1 was present in the capillaries of mouse gliomas (blue) but absent from the capillaries of the normal brain. High-magnification images in the boxed region are shown below. Three mice were evaluated; representative images are shown. Scale bar, 50 μm.
Figure 4—figure supplement 1
GPIHBP1 and GLUT1 expression in glioma capillaries.
Immunohistochemical studies on a CT-2A glioma collected from a mouse that had been given an intravenous injection of a GPIHBP1-specific antibody. Tissue sections (200-μm-thick) were fixed with 2% PFA in PBS and then stained with antibodies against GLUT1. GPIHBP1 (green) is expressed in glioma capillaries; GLUT1 (red) expression was also detectable in glioma capillaries. Higher magnification images of the boxed regions are shown on the right. Three mice were evaluated; representative images are shown. Scale bar, 20 μm.
Figure 4—figure supplement 2
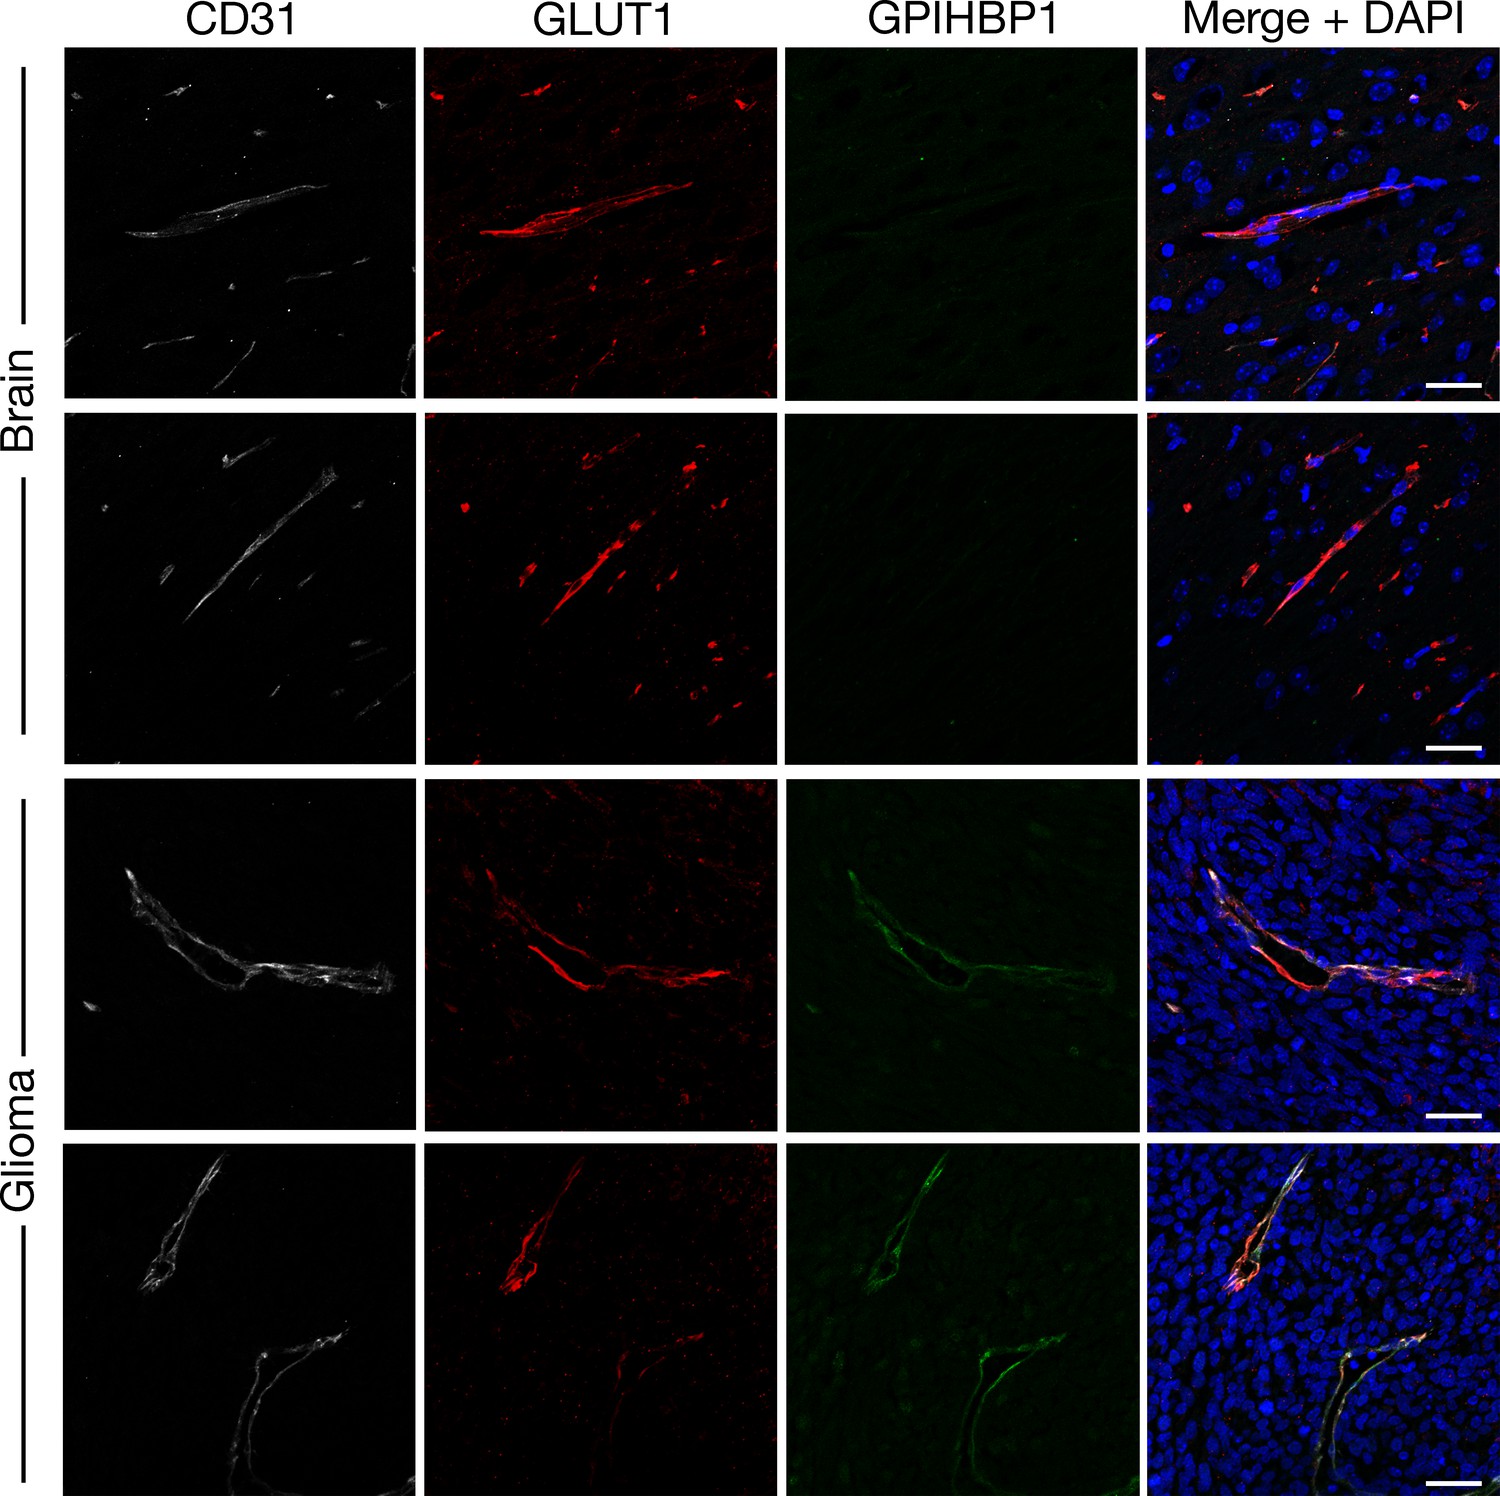
GPIHBP1 and GLUT1 in glioma capillaries.
Immunohistochemical studies on mouse glioma and normal brain, revealing GPIHBP1 in gliomas but not normal brain. Tissue sections (10-μm-thick) were fixed with 3% PFA in PBS and stained with antibodies against CD31 (white), GLUT1 (red), and GPIHBP1 (green). GPIHBP1 was absent from the capillaries of normal brain but colocalized with CD31 and GLUT1 in the capillaries of gliomas. DNA was stained with DAPI (blue). Glioma and brain from three mice were used for this study; representative images are shown. Scale bar, 20 μm.
Figure 4—figure supplement 3
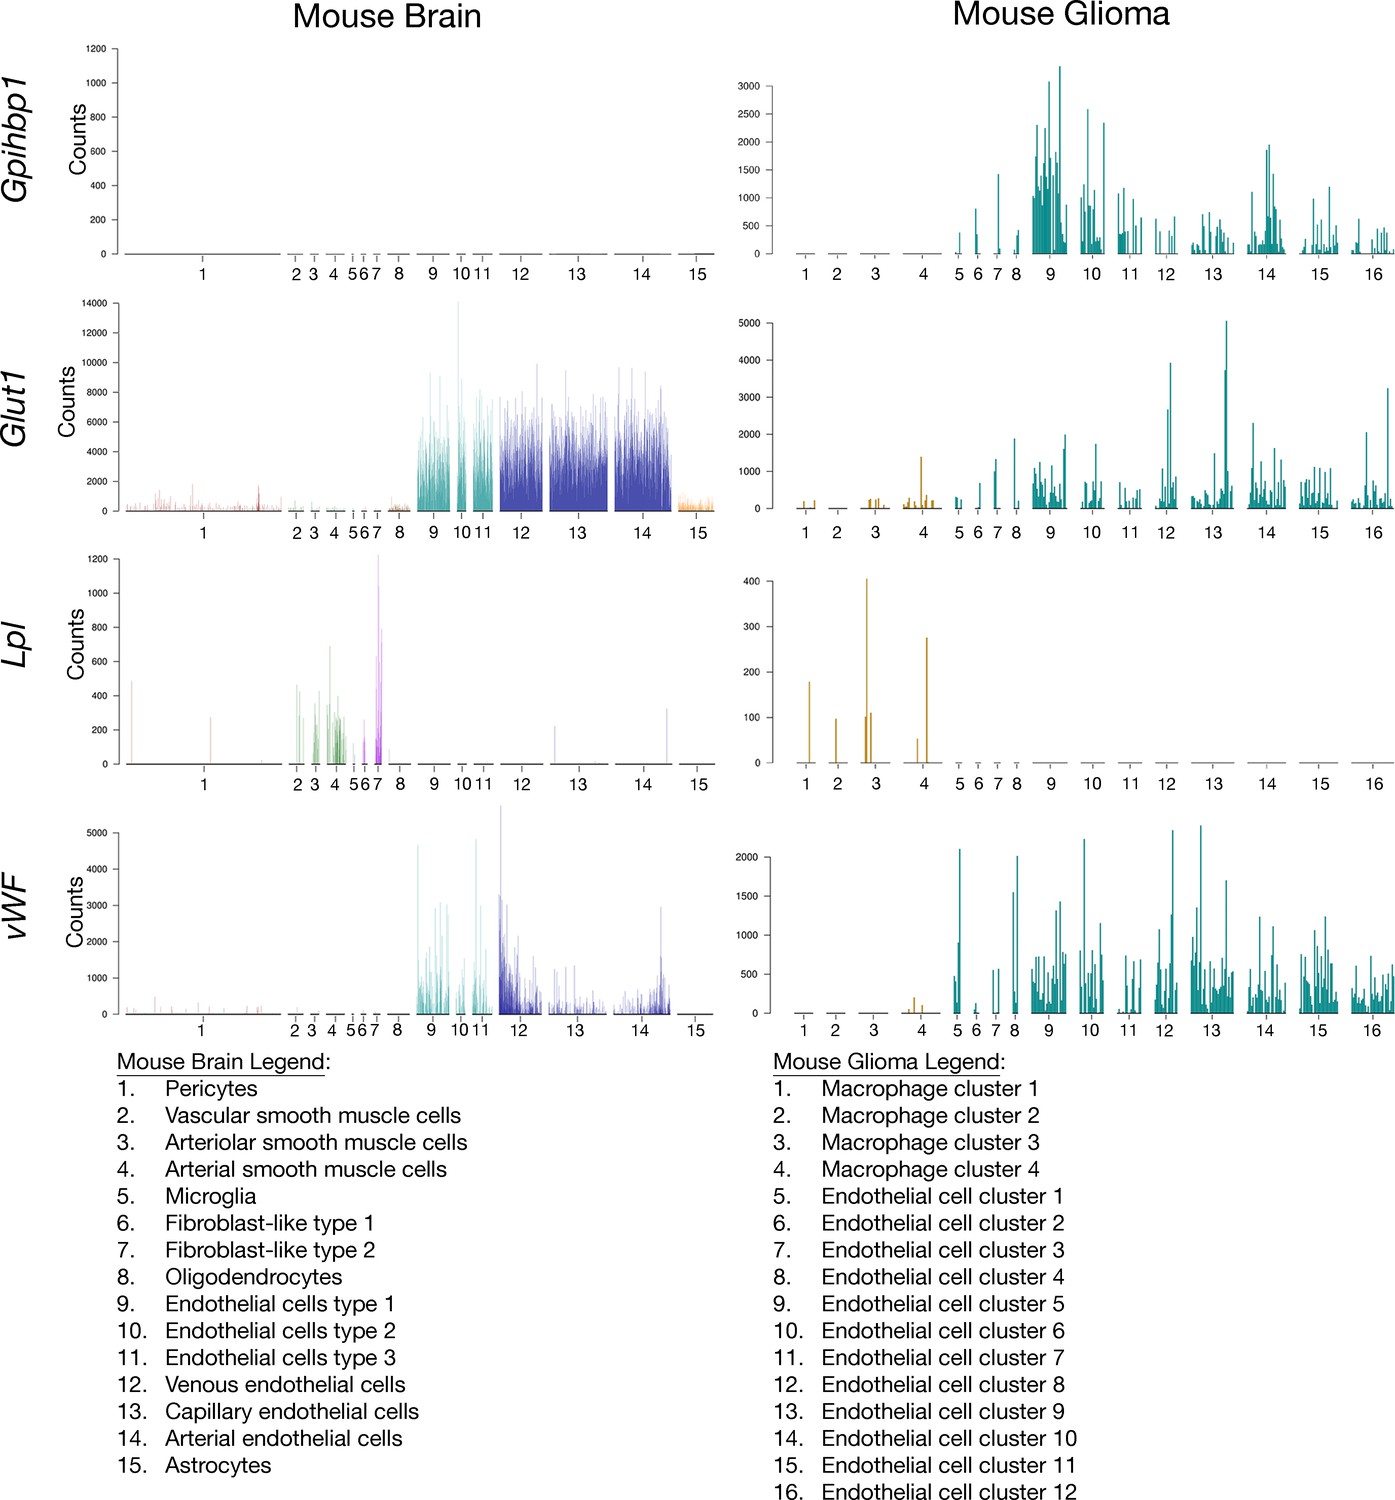
Single-cell RNA-seq observations on normal mouse brain and mouse gliomas.
RNA expression data for normal mouse brain vascular cells and mouse glioma vascular cells reveal high levels of Gpihbp1 expression in the endothelial cells of gliomas but not those of normal brain. Glut1 was expressed in normal brain endothelial cells and in endothelial cells of gliomas. Lpl was not detected in the endothelial cells of normal brain or gliomas but was expressed in fibroblasts, microglia, and smooth muscle cells of normal brain and in macrophages of gliomas. RNA expression data for normal mouse brain vascular cells were obtained from an online database established by the Betsholtz laboratory (Vanlandewijck et al., 2018; He et al., 2018d) (http://betsholtzlab.org/VascularSingleCells/database.html). The glioma single-cell RNA-seq data were analyzed in a similar fashion, showing gene-expression levels in individual cells within each cluster.
Figure 4—figure supplement 4
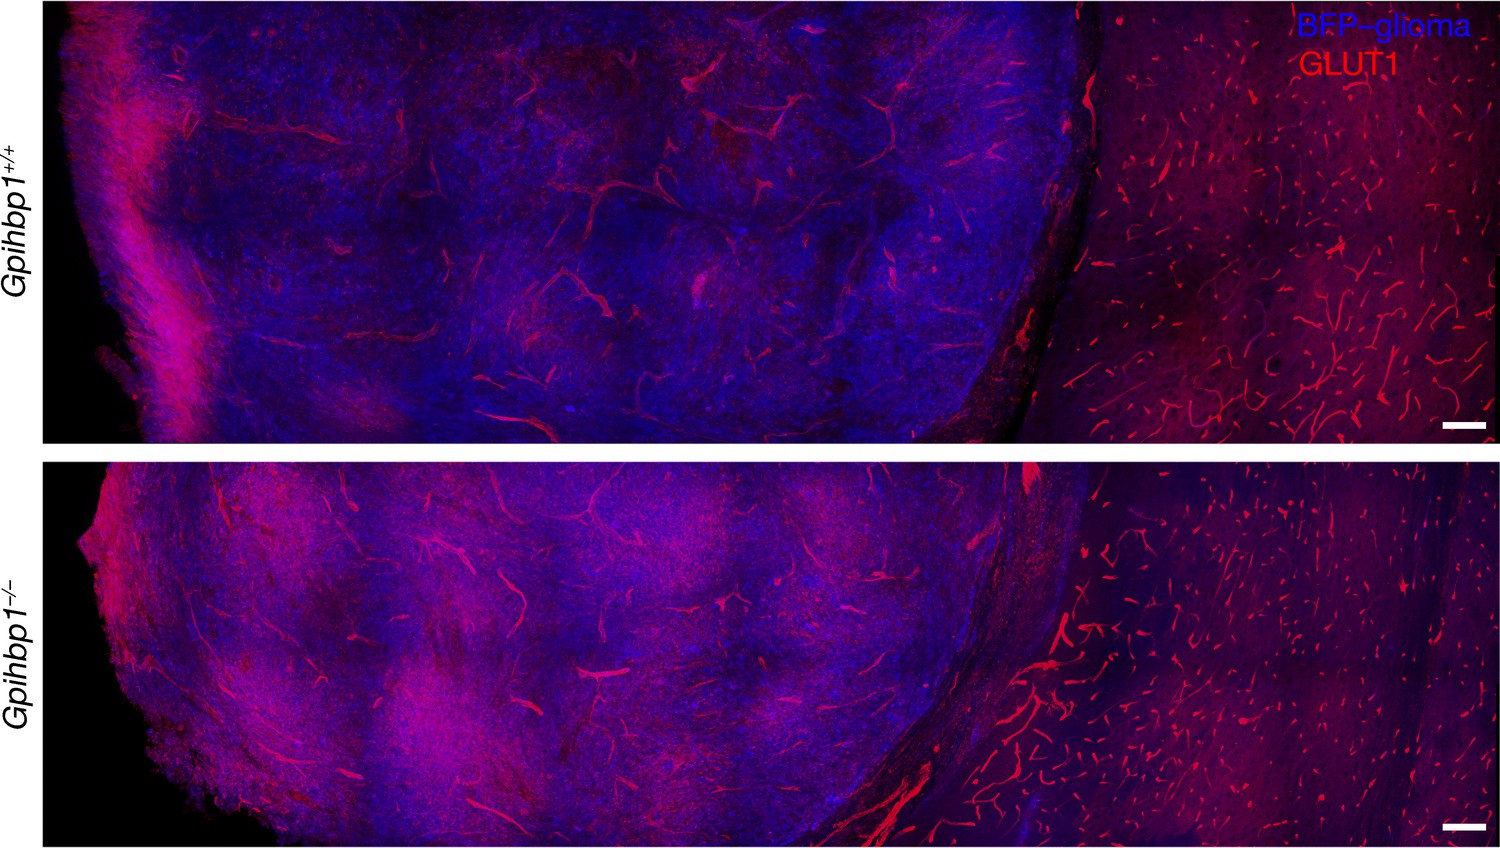
GLUT1 is detectable in the endothelial cells of gliomas and normal brain in wild-type (Gpihbp1+/+) and Gpihbp1–/– mice.
Immunohistochemical studies of BFP-expressing CT-2A gliomas (after three weeks of growth) in Gpihbp1+/+ and Gpihbp1–/– mice. Mice were perfused with PBS and perfusion-fixed with 2% PFA. Glioma and adjacent normal brain tissue were harvested, then 200-μm thick sections were cut, fixed with 4% PFA, and stained with an antibody against GLUT1 (red). GLUT1 was detectable in endothelial cells in glioma and normal brain in both wild-type and Gpihbp1–/– mice. Two mice per genotype were evaluated; representative images are shown. Scale bar, 100 μm.
Figure 5 with 8 supplements
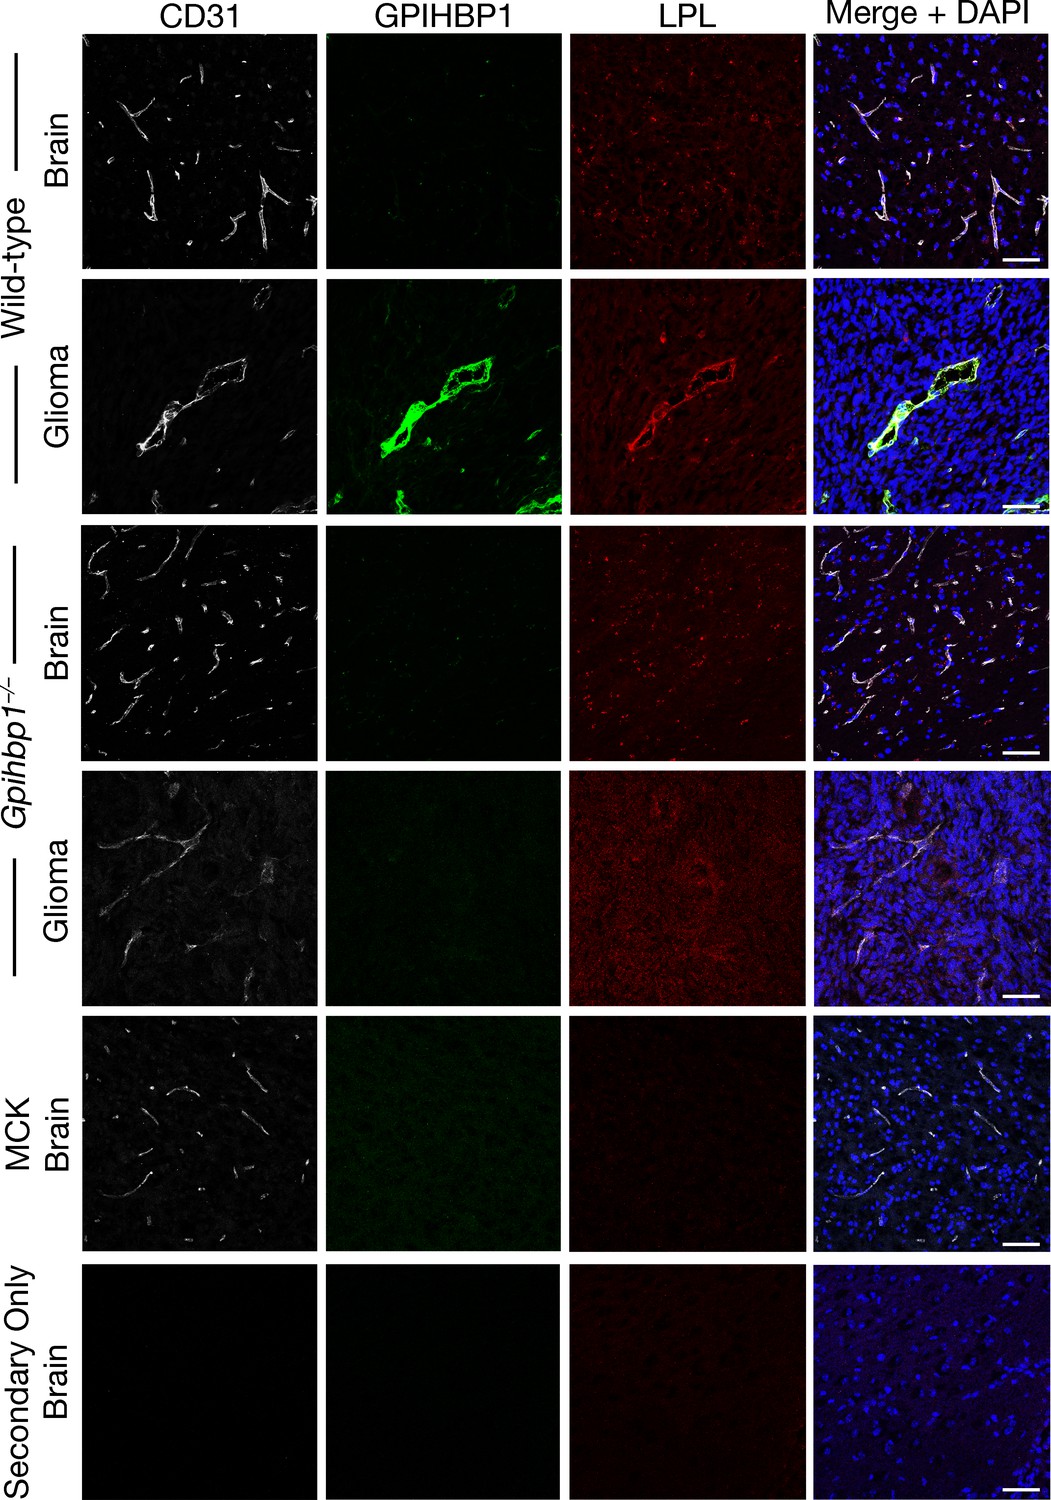
Lipoprotein lipase (LPL) colocalizes with GPIHBP1 in glioma capillaries.
Confocal immunofluorescence microscopy studies on glioma and normal brain from wild-type and Gpihbp1–/– mice, along with the brain from an Lpl–/– mouse carrying a skeletal muscle–specific human LPL transgene (MCK). Glioma and brain sections (10-μm-thick) were fixed with 3% PFA and then stained with a mAb against mouse GPIHBP1 (11A12; green), a goat antibody against mouse LPL (red), and a rabbit antibody against CD31 (white). LPL colocalizes with GPIHBP1 and CD31 in the capillaries of gliomas; GPIHBP1 and LPL were absent from normal brain capillaries and from glioma capillaries in Gpihbp1–/– mice. DNA was stained with DAPI (blue). No LPL was detected in the capillaries of Lpl-deficient mice (MCK) or when the incubation with primary antibodies was omitted (Secondary Only). Staining of all tissue sections was performed simultaneously, and all images were recorded with identical microscopy settings. Three mice per genotype were evaluated; representative images are shown. Scale bar, 50 μm.
Figure 5—figure supplement 1
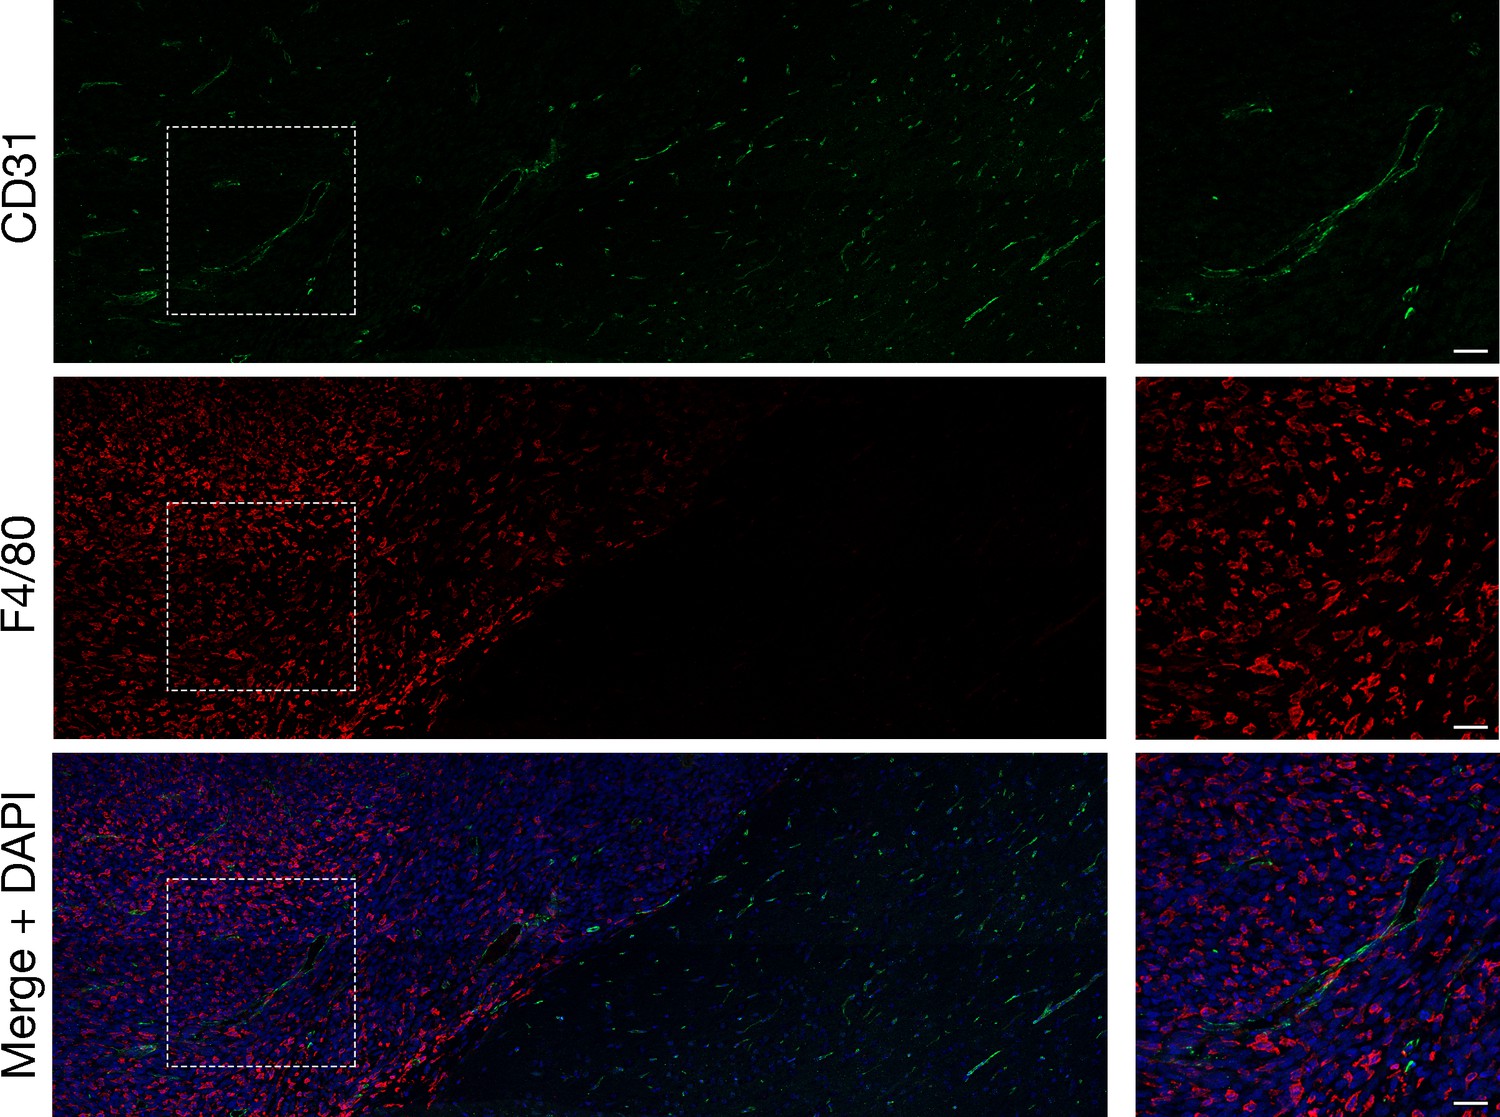
Large numbers of macrophages in mouse gliomas.
Confocal immunofluorescence microscopy studies on a mouse glioma (10-μm section), revealing large numbers of macrophages (detected with an antibody against F4/80 [red]) in the glioma. Endothelial cells were stained with an antibody against CD31 (green), and DNA was stained with DAPI (blue). High-magnification images of boxed regions are shown on the right. Four tumors were evaluated; representative images are shown. Scale bar, 50 μm.
Figure 5—figure supplement 2
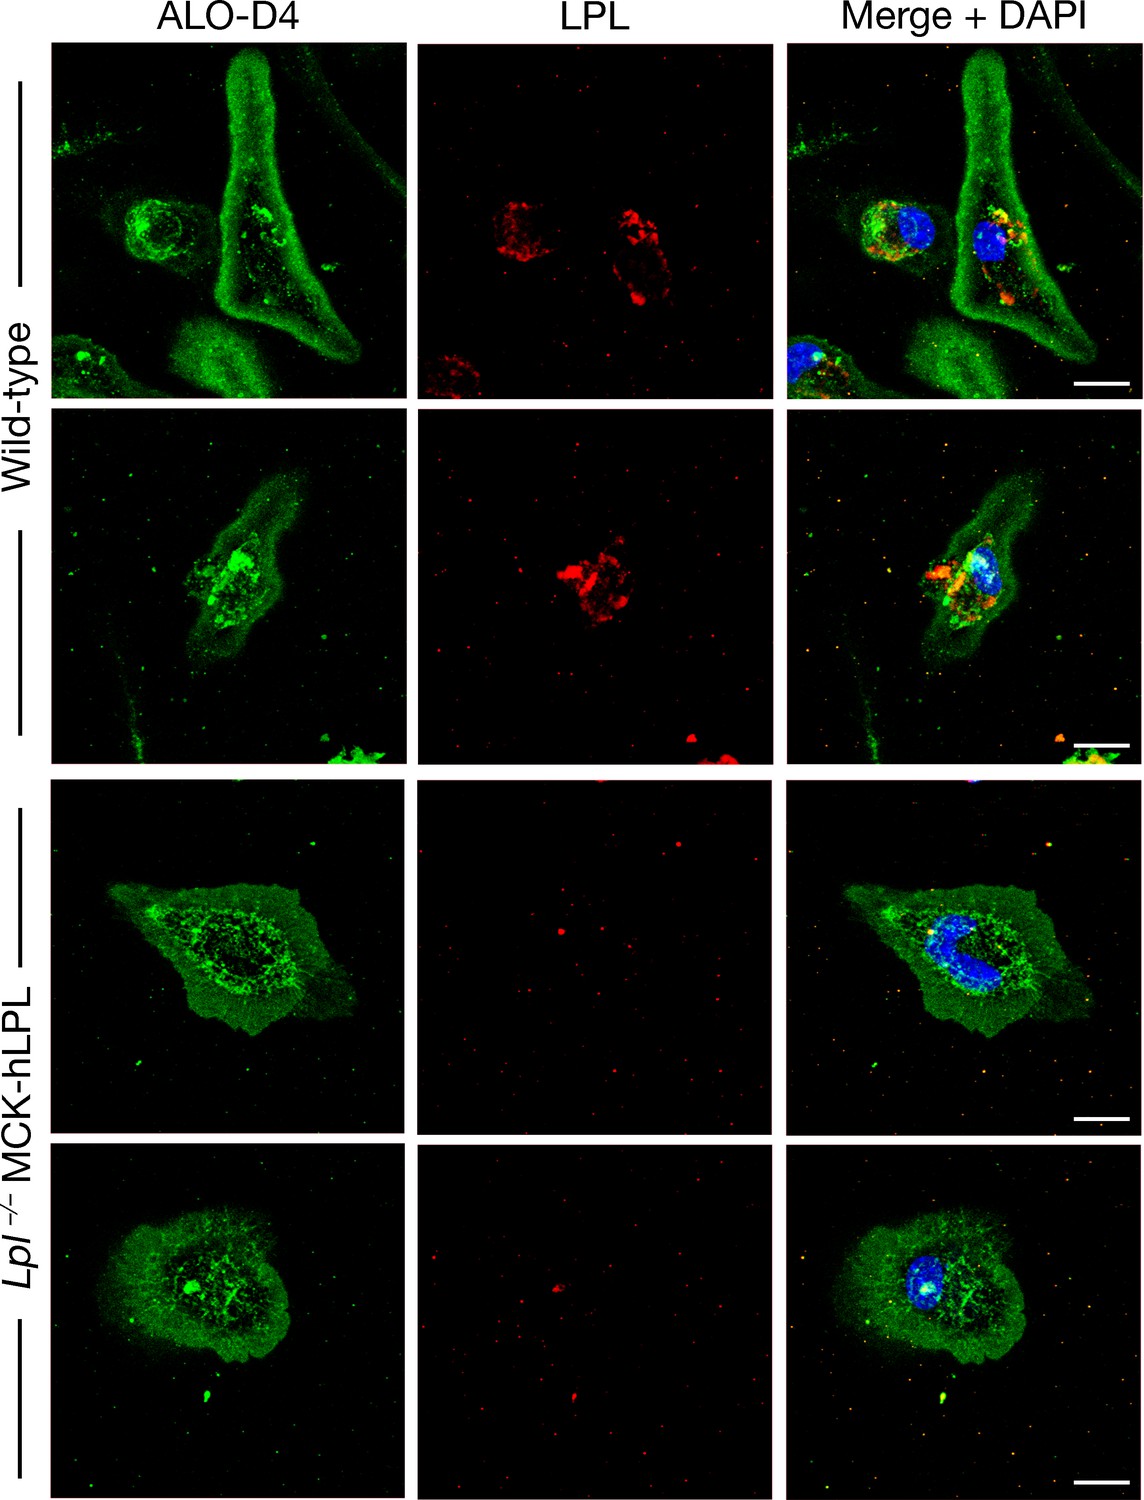
LPL is expressed in peritoneal macrophages from wild-type mice but not in macrophages from Lpl–/–MCK-hLPL mice, as revealed by confocal immunofluorescence microscopy.
Peritoneal macrophages were harvested and plated on poly-D-lysine–coated glass coverslips and then fixed with 3% PFA. Using a goat antibody against mouse LPL, LPL (red) was detected in macrophages from wild-type mice but not in macrophages from Lpl–/–MCK-hLPL mice. ALO-D4 (a modified cytolysin that binds ‘accessible cholesterol’ [Das et al., 2014; Das et al., 2013; Gay et al., 2015]) (green) was used to visualize the macrophage plasma membrane. DNA was stained with DAPI (blue). Two mice per genotype were evaluated; representative images are shown. Scale bar, 10 μm.
Figure 5—figure supplement 3
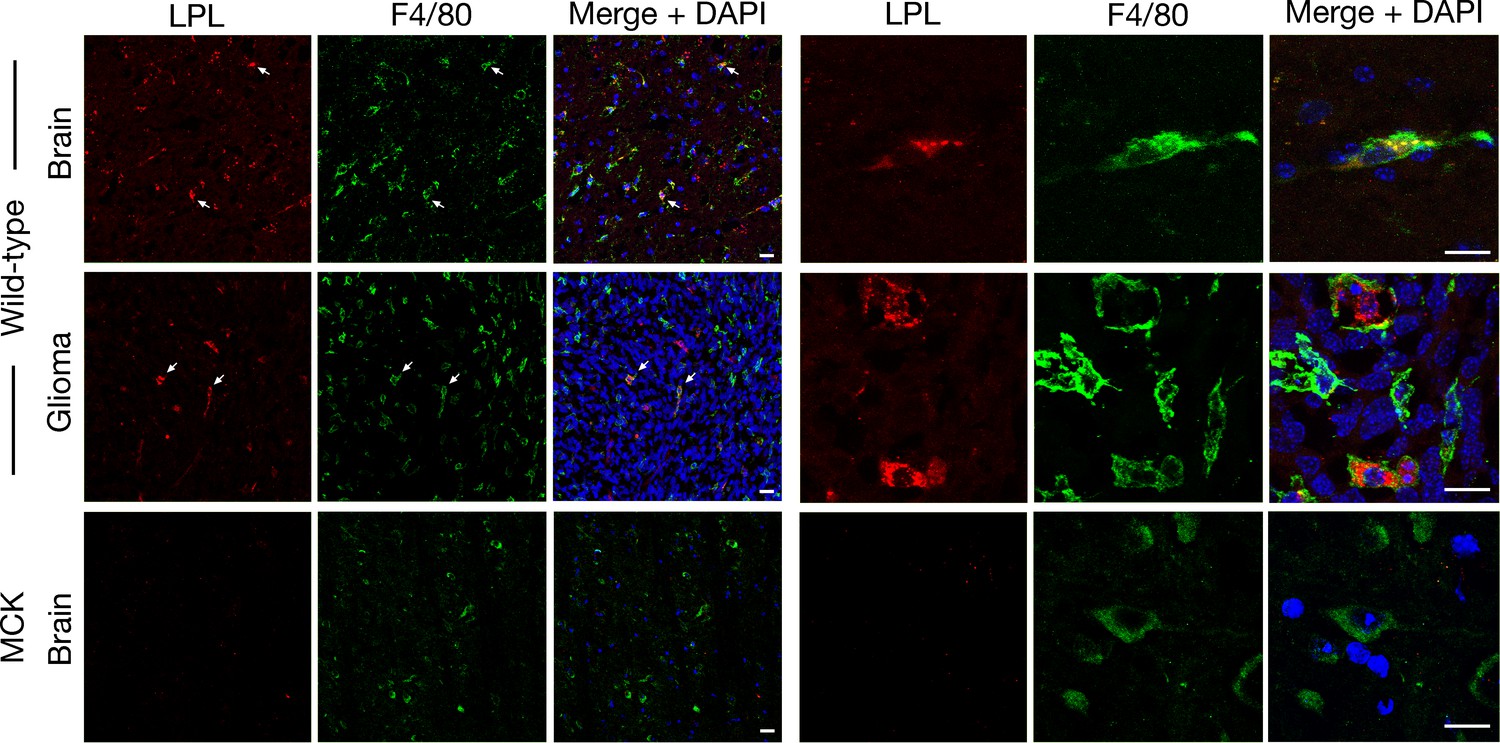
LPL is present in the macrophages of brain and gliomas, as revealed by confocal immunofluorescence microscopy.
Brain and glioma from wild-type mice and brain from Lpl–/–MCK-hLPL (MCK) mice were harvested, sectioned (10-μm), and fixed with 3% PFA. LPL (detected with a goat antibody against mouse LPL [red]) was present in macrophages (identified with an antibody against F4/80[green]) in brain and glioma of wild-type mice, but was absent from the brain of MCK mice. White arrows point to areas of LPL and F4/80 colocalization. Images were recorded with 20× (left) and 100× objectives (right). DNA was stained with DAPI (blue). Two mice per genotype were evaluated; representative images are shown. Scale bar, 20 μm.
Figure 5—figure supplement 4
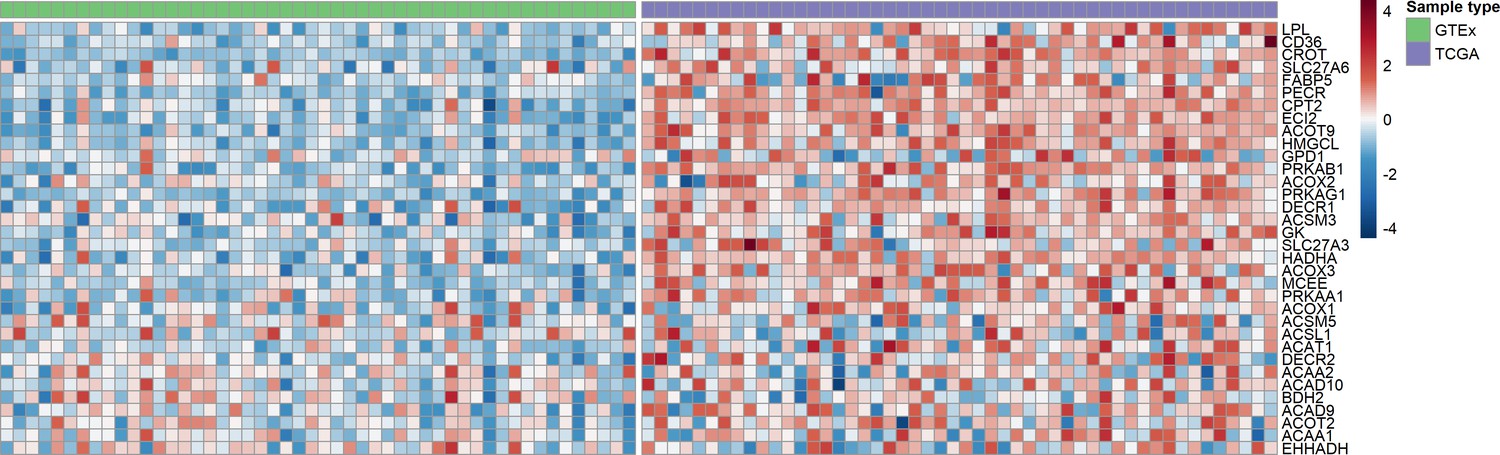
Heat map showing genes related to fatty acid metabolism that are upregulated in human gliomas, compared to normal brain.
Rows in the heat map correspond to individual genes; columns correspond to individual specimens, normal brain specimens on the left (GTEx; green) and tumors on the right (TCGA; purple). LPL was the most upregulated gene (related to fatty acid metabolism) in gliomas.
Figure 5—figure supplement 5
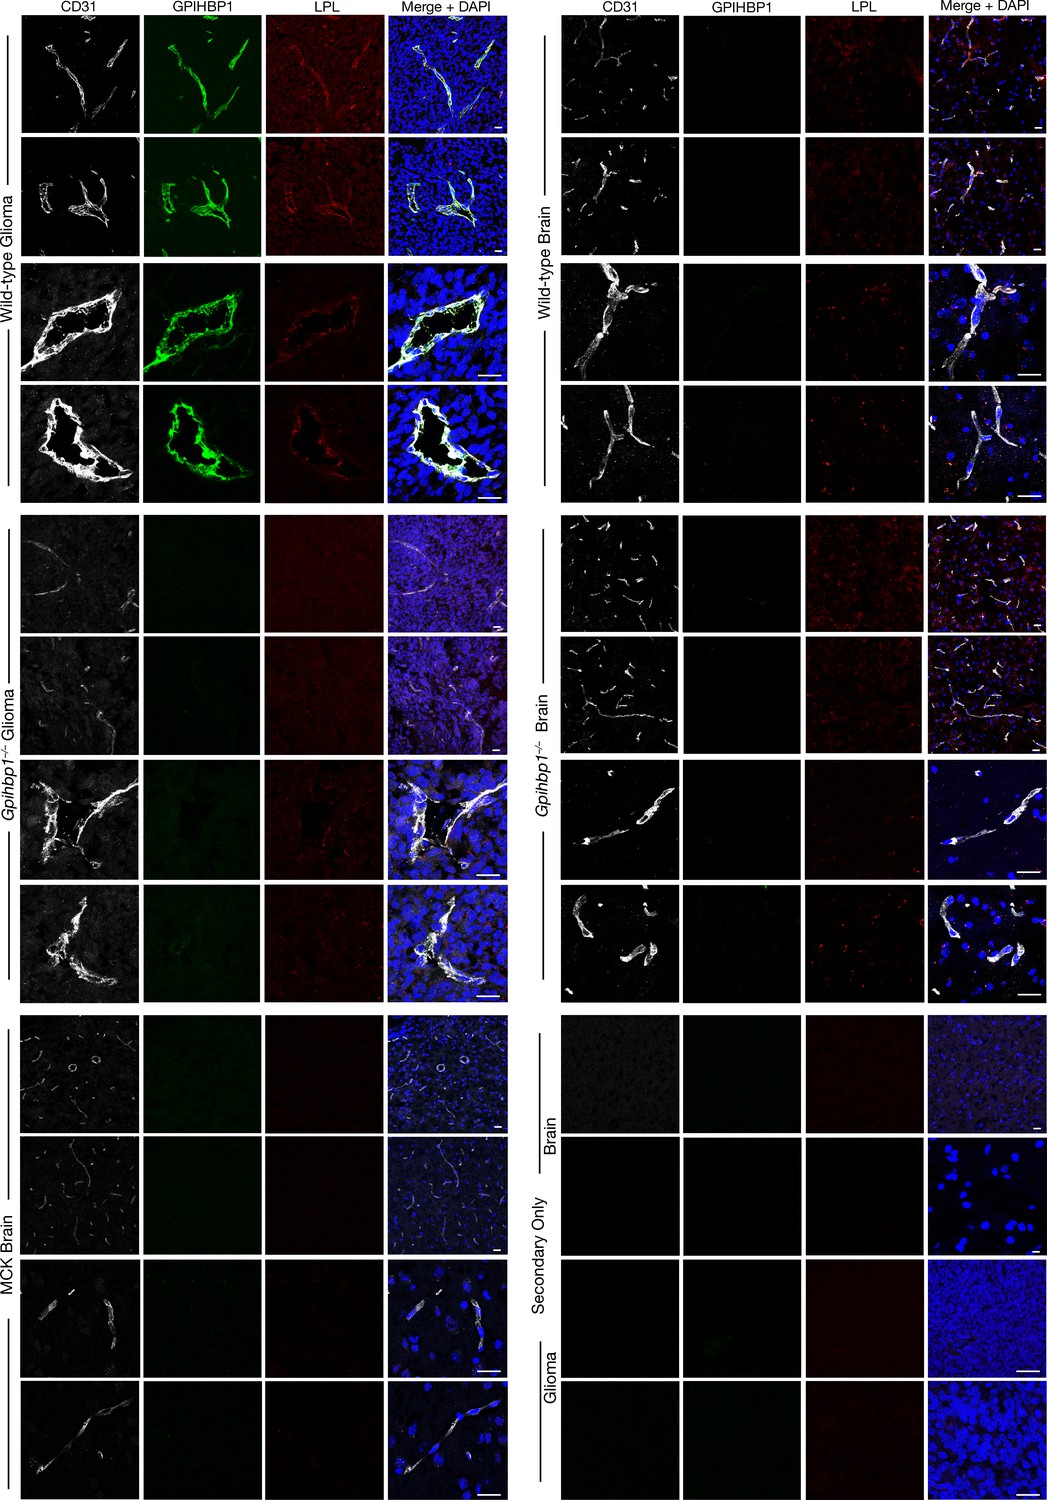
LPL colocalizes with GPIHBP1 in glioma capillaries, as revealed by confocal immunofluorescence microscopy.
Sections (10-μm) of brain and glioma tissue from wild-type and Gpihbp1–/– mice and brain tissue from Lpl–/–MCK-hLPL mice (MCK) were fixed with 3% PFA and stained with a goat antibody against mouse LPL, a mAb against GPIHBP1 (11A12), and an antibody against CD31. LPL (red) colocalized with GPIHBP1 (green) and CD31 (white) in the glioma capillaries of wild-type mice but not in the glioma capillaries in Gpihbp1–/– mice or in the capillaries of normal brain in wild-type, Gpihbp1–/–, or MCK mice. There was no LPL signal when the primary antibody was omitted (Secondary Only). DNA was stained with DAPI (blue). Staining of all tissue sections was performed simultaneously, and images at the same magnification were recorded using the same microscope settings. Three mice per genotype were evaluated; representative images are shown. Scale bar, 20 μm.
Figure 5—figure supplement 6
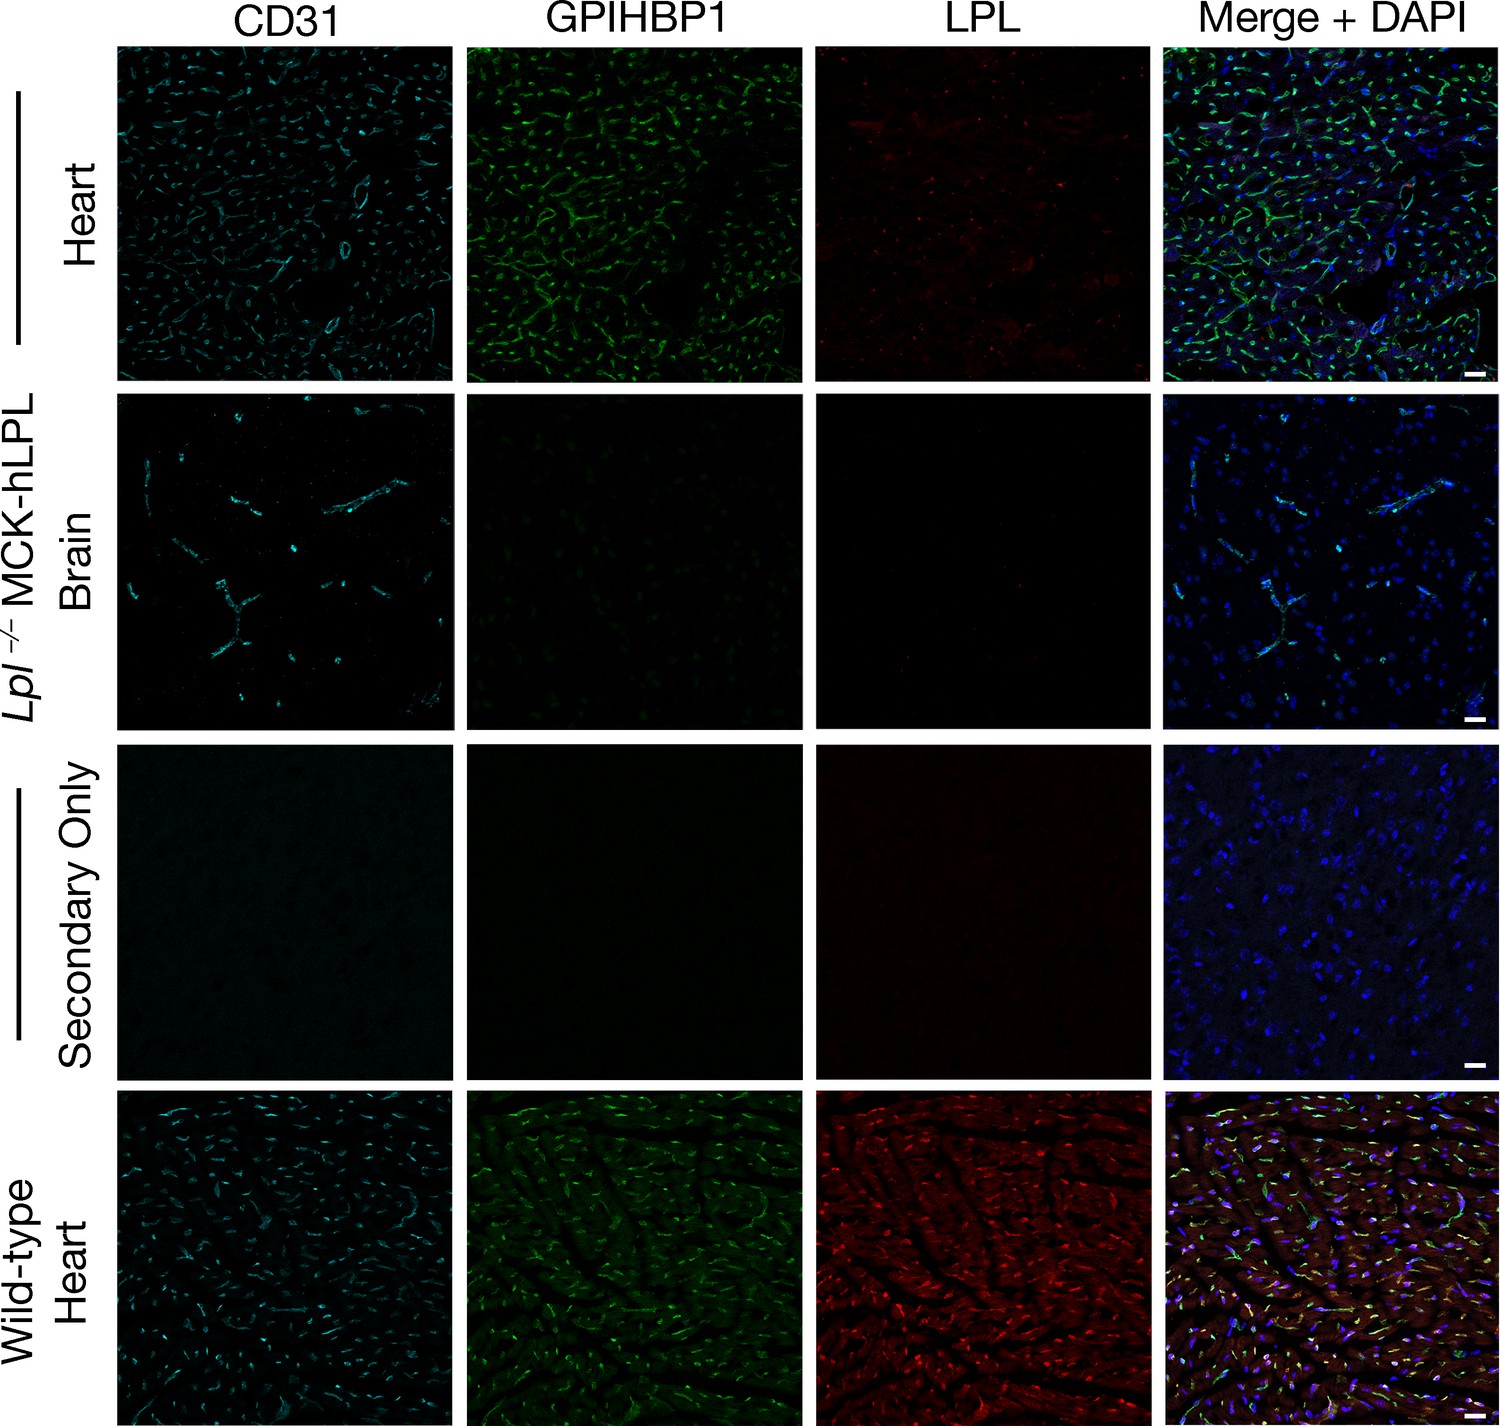
Mouse LPL is absent from tissues of an Lpl–/–MCK-hLPL mouse, as revealed by confocal immunofluorescence microscopy.
Sections (10-μm) of heart and brain from Lpl–/–MCK-hLPL mice and of heart tissue from wild-type mice were fixed with 3% PFA and stained with a goat antibody against mouse LPL, a mAb against GPIHBP1 (11A12), and an antibody against CD31. LPL (red) colocalized with GPIHBP1 (green) and CD31 (cyan) in the heart of wild-type mice, but LPL was absent in the heart and brain of Lpl–/–MCK-hLPL mice. No LPL was detected when primary antibodies were omitted (Secondary Only). DNA was stained with DAPI (blue). Staining of all tissue sections was performed simultaneously, and images at the same magnification were recorded with the same laser settings. Two mice per genotype were evaluated; representative images are shown. Scale bar, 20 μm.
Figure 5—figure supplement 7

LPL is present in the hippocampal neurons of wild-type mice, as revealed by confocal immunofluorescence microscopy.
Sections (10-μm) of brain specimens from wild-type and Lpl–/–MCK-hLPL mice were fixed with 3% PFA and stained with antibodies against LPL (red) and CD31 (green). The left panel shows a tiled low-magnification image recorded with a 20× objective; the right panel shows a single image recorded with a 20× objective. DNA was stained with DAPI (blue). LPL was detected in the hippocampus (note the high density of neurons). LPL was absent from the hippocampus of Lpl–/–MCK-hLPL mice. No LPL was detectable when primary antibodies were omitted. Staining of all tissue sections was performed simultaneously, and images at the same magnification were recorded with the same microscope settings. Two mice per genotype were evaluated; representative images are shown. Scale bar, 50 μm.
Figure 5—figure supplement 8
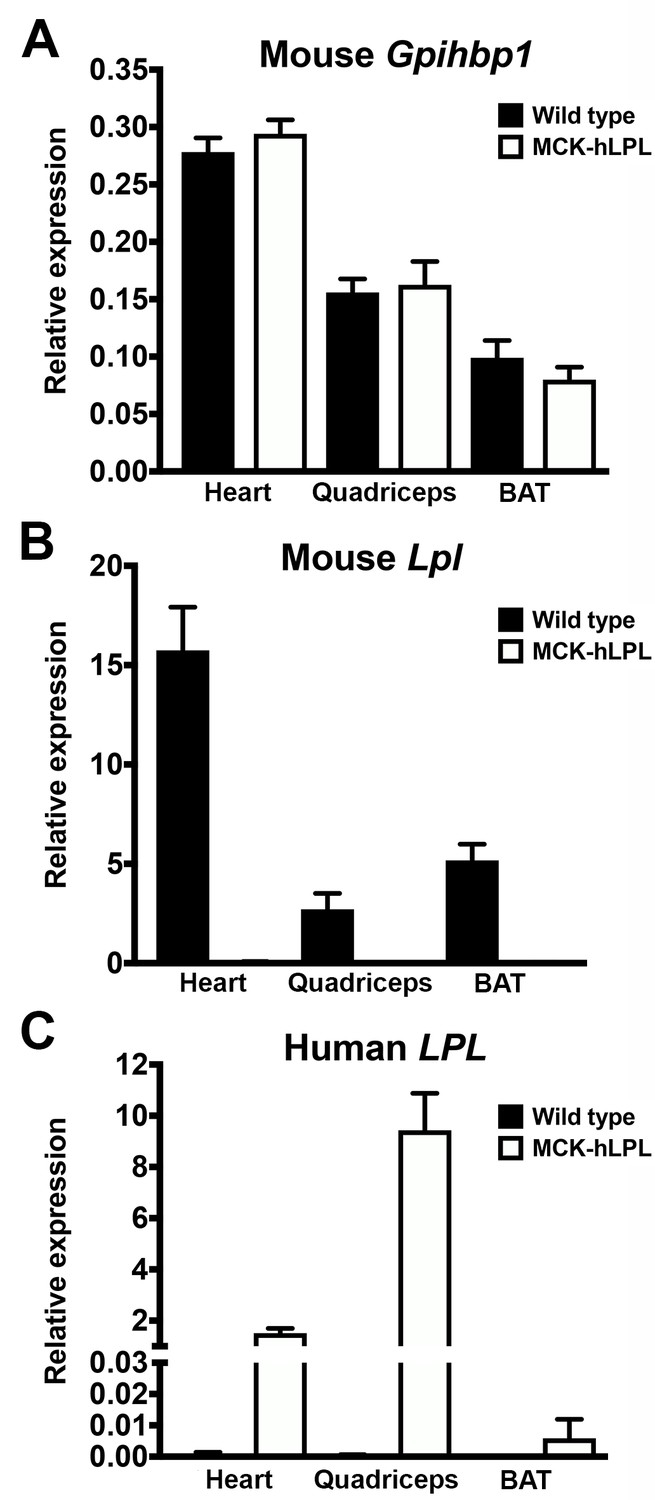
Mouse Gpihbp1, mouse Lpl, and human LPL transcript levels in 25-week-old wild-type and Lpl–/–MCK-hLPL mice (MCK-hLPL).
Mouse Gpihbp1 (A), mouse Lpl (B), and human LPL (C) transcript levels, as measured by qRT-PCR (n = 3/group). Expression levels were normalized to the expression of cyclophilin A. BAT, brown adipose tissue.
Figure 6

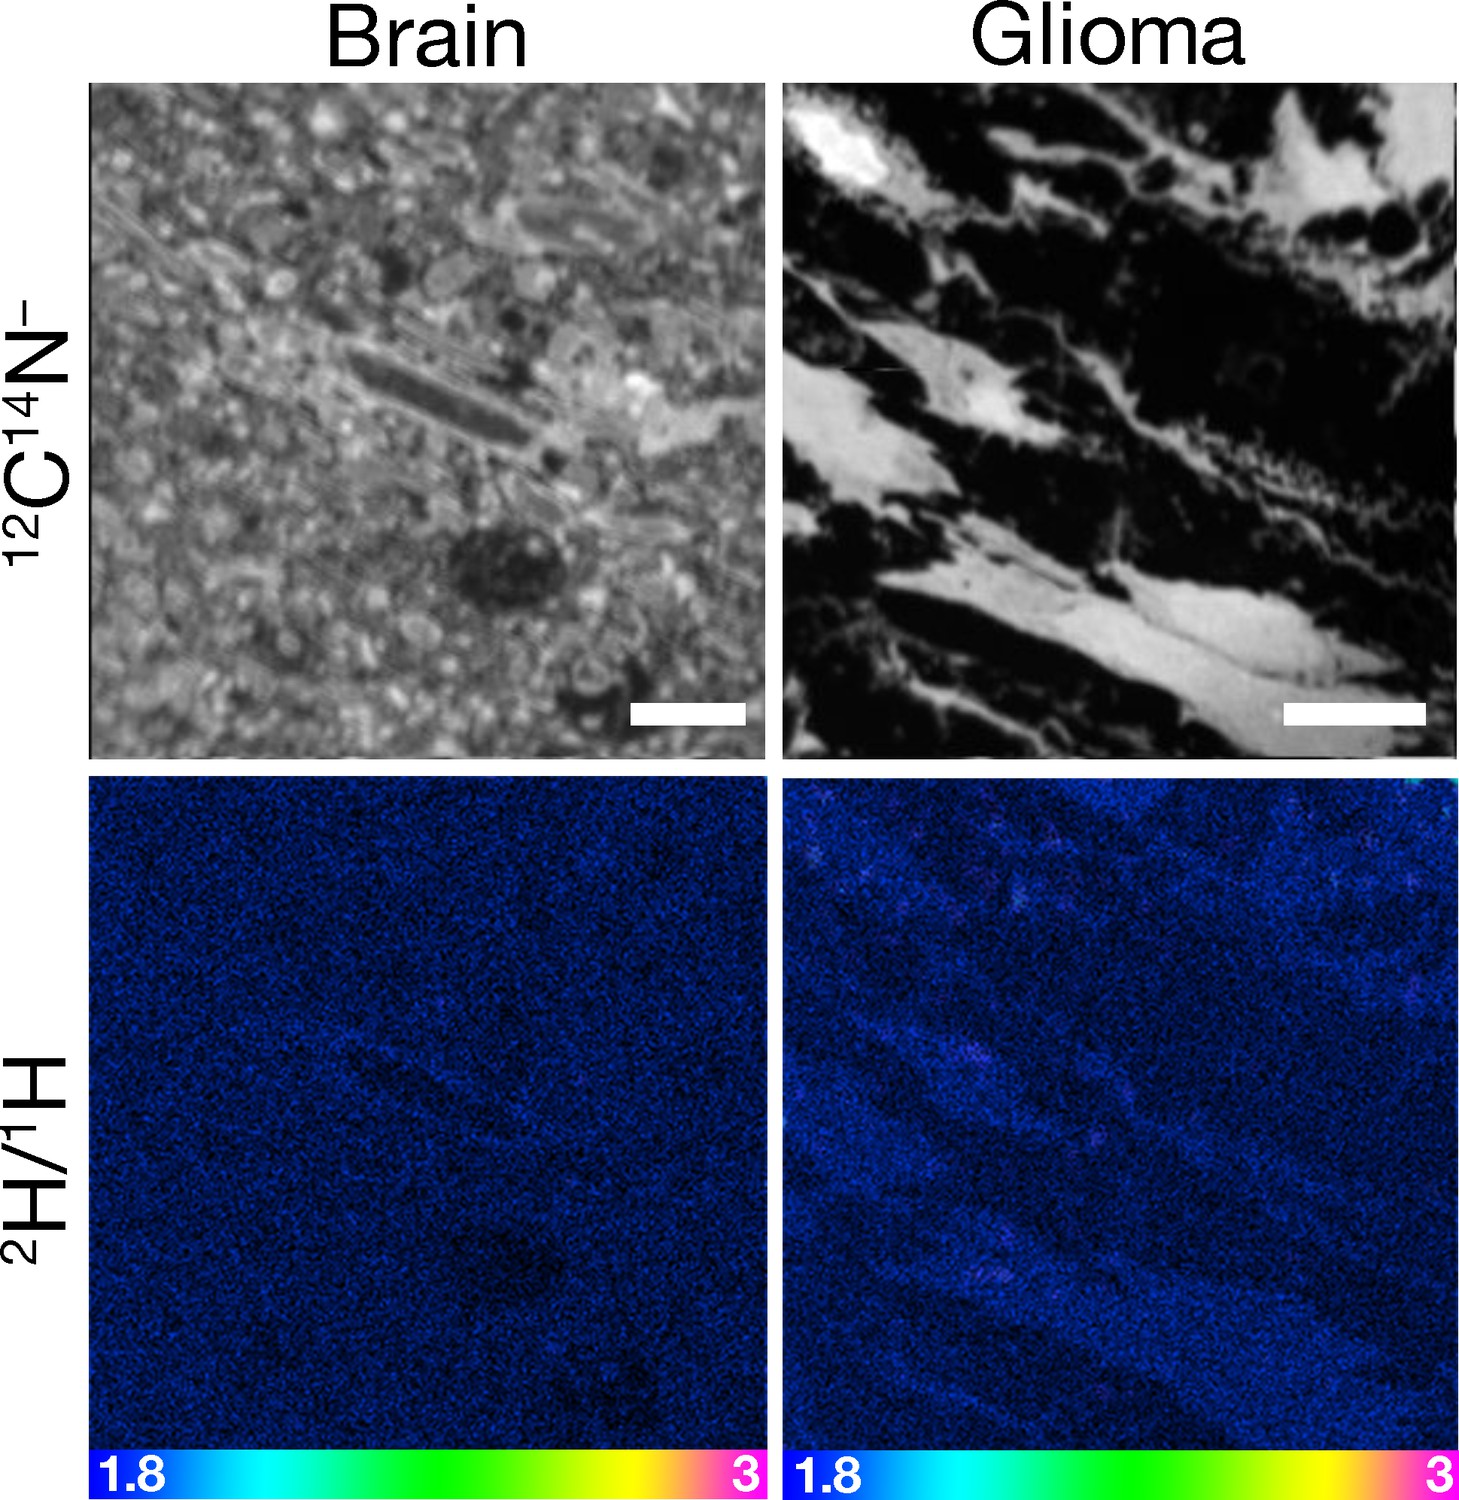
NanoSIMS imaging reveals margination of [2H]TRLs along glioma capillaries and 2H enrichment in adjacent glioma cells.
Four-month-old C57BL/6 mice harboring CT-2A gliomas were fasted for 4 hr and then injected intravenously with 200 μl of [2H]TRLs. After 1 min, mice were euthanized and perfusion-fixed with carbodiimide/glutaraldehyde. Tissue sections were processed for NanoSIMS imaging. (A) NanoSIMS images showing margination of [2H]TRLs in glioma capillaries. 1H– images were created to visualize tissue morphology (upper panels). Composite 2H/1H (red) and 1H– (blue) images reveal [2H]TRLs (white arrows) in glioma and heart capillaries (middle and lower panels). The lower panels are close-up images of the regions outlined in the middle panels. 2H/1H ratio scales were set to show marginated TRLs. Scale bars, 4 μm. (B) NanoSIMS images showing 2H enrichment in glioma tissue. 12C14N– images were generated to visualize tissue morphology. 2H/1H ratio images reveal margination of [2H]TRLs within the capillary lumen and 2H-enriched lipid droplets in gliomas and heart. There was no 2H enrichment in normal brain tissue. Scale bars, 4 μm. The bar graph shows the average fold change ± SD in the 2H/1H ratio above natural abundance. The experiment was performed in two mice with a minimum of seven images analyzed for each sample. Differences were assessed using a Student’s t-test with Welch’s correction.
Figure 7 with 2 supplements

NanoSIMS imaging showing 2H enrichment in gliomas 30 min after an intravenous injection of [2H]TRLs.
Four-month-old C57BL/6 mice harboring CT-2A gliomas were fasted for 4 hr and then injected intravenously with 200 μl of [2H]TRLs. After 30 min, mice were euthanized and perfusion-fixed with carbodiimide/glutaraldehyde. Sections of glioma, brain, and heart were processed for NanoSIMS imaging. 12C14N– images were created to visualize tissue morphology. 2H/1H ratio images reveal margination of [2H]TRLs along the capillary lumen (white arrows) and 2H enrichment in glioma and heart, including in cytosolic lipid droplets. Images of normal brain revealed slight 2H enrichment in capillary endothelial cells. Scale bars, 4 μm. The bar graph shows the average fold change ± SD in the 2H/1H ratio above natural abundance. The experiment was performed in two mice, with a minimum of seven images analyzed for each sample. Differences were assessed with a Student’s t-test with Welch’s correction.
Figure 7—figure supplement 1
Absence of 2H enrichment in glioma and brain of a mouse that had been given an injection of PBS alone.
Four-month-old C57BL/6 mice harboring CT-2A gliomas were fasted for 4 hr and then injected intravenously with 200 μl of PBS. After 1 min, the mouse was euthanized and perfusion-fixed with carbodiimide/glutaraldehyde, and glioma and brain were processed for NanoSIMS imaging. 12C14N– images were generated to visualize tissue morphology. The 2H/1H ratio images revealed the absence of 2H enrichment in glioma and brain. One mouse was evaluated. Scale bars, 7 μm.
Figure 7—figure supplement 2
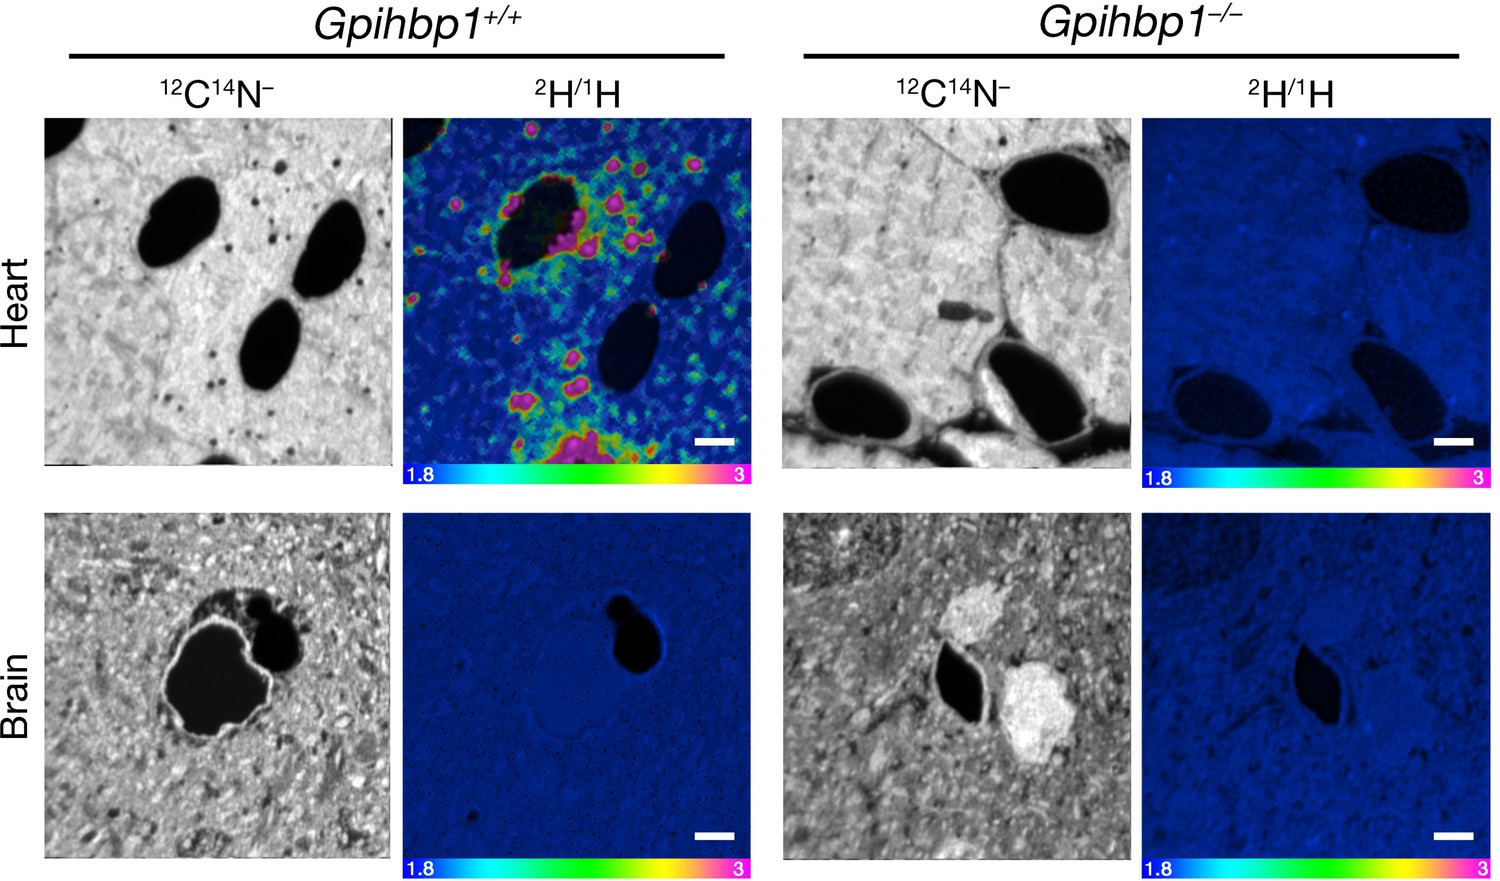
Uptake of [2H]TRLs in heart and brain of Gpihbp1–/– mice.
A C57BL/6 wild-type mouse (Gpihbp1+/+) and a Gpihbp1-deficient mouse (Gpihbp1–/–) were injected intravenously with 80 μl of [2H]TRLs. After 15 min, the mouse was euthanized; perfusion-fixed with glutaraldehyde; and sections of heart and brain were prepared for NanoSIMS imaging. 12C14N– images were generated to visualize tissue morphology. The 2H/1H ratio images revealed 2H enrichment in the heart of the wild-type mouse but minimal 2H enrichment in the heart of the Gpihbp1–/– mouse (2H enrichment in the cytosolic lipid droplets of the heart of the Gpihbp1–/– mouse was very low, ~10% greater than 2H natural abundance; p<0.005). 2H enrichment was not detected in the brains of the wild-type mouse or the Gpihbp1–/– mouse. One mouse per genotype was evaluated. Scale bars, 4 μm.
Figure 8 with 4 supplements

Tissue uptake of fatty acid and glucose-derived nutrients by mice harboring CT-2A gliomas.
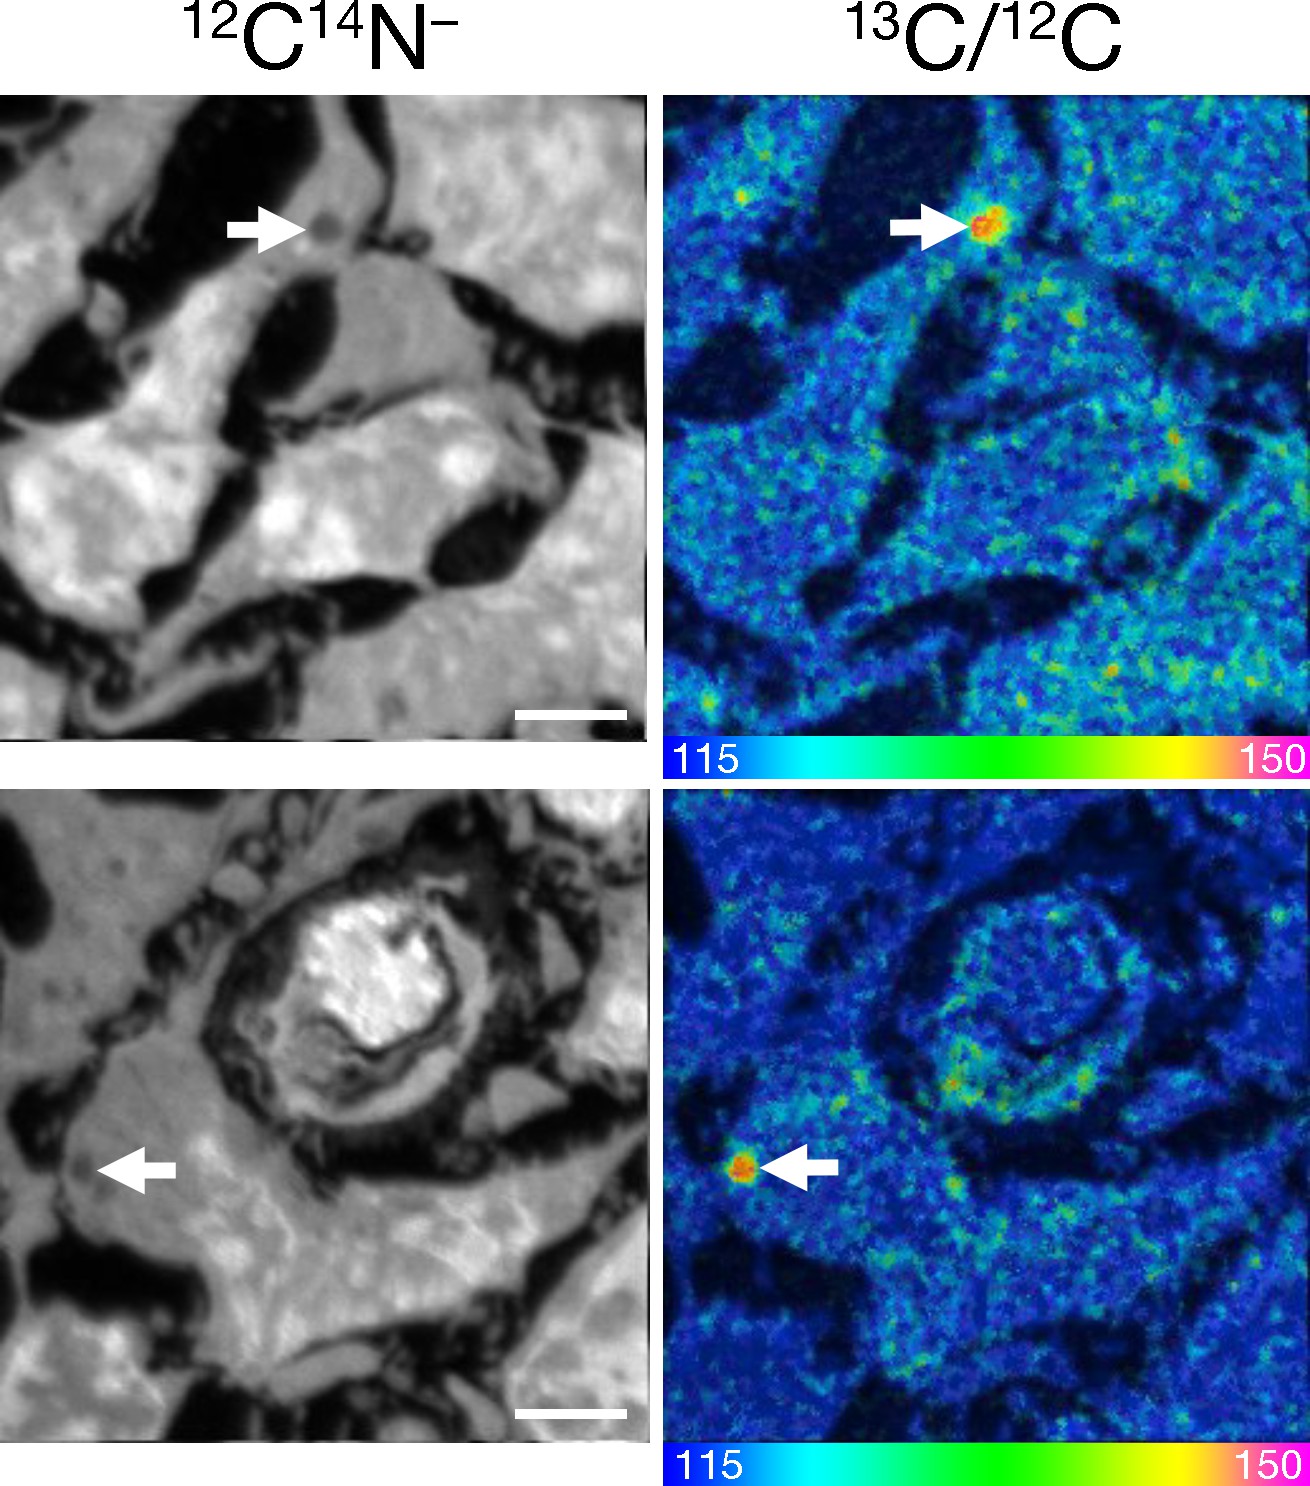
(A) NanoSIMS images showing 13C enrichment in mouse tissues (brain, glioma, and heart) after oral administration of 13C-labeled mixed fatty acids to mice (three 80-mg doses administered 12 h apart). 12C14N– images were generated to visualize tissue morphology; 13C/12C ratio images were used to visualize 13C enrichment in tissues. Scale bars, 4 μm. (B) NanoSIMS images revealing 13C enrichment in tissues following oral administration of 13C-labeled glucose to mice (three 75-mg doses given 12-h apart). 12C14N– images were generated to visualize tissue morphology; 13C/12C ratio images were generated to assess 13C enrichment in tissues. Scale bars, 4 μm. The bar graphs show the average 13C/12C ratio ± SD multiplied by 10,000 for fatty acids (left) and glucose (right). Each experiment was performed in two mice, with a minimum of seven images analyzed for each sample. Differences were assessed using a Student’s t-test with Welch’s correction.
Figure 8—figure supplement 1
13C-enriched lipid droplets in mouse glioma cells.
13C-labeled mixed fatty acids were administered by gastric gavage to C57BL/6 mice harboring CT-2A gliomas (three doses of 80 mg administered 12 hr apart). Four hours after the last dose, the mice were euthanized; perfusion-fixed with carbodiimide/glutaraldehyde; and sections of glioma were prepared for NanoSIMS imaging. 12C14N– images were generated to visualize tissue morphology. The 13C/12C ratio images depict 13C enrichment in glioma cells; white arrows point to cytosolic lipid droplets in glioma cells. Two mice were evaluated and representative images are shown. Scale bars, 3 μm.
Figure 8—figure supplement 2
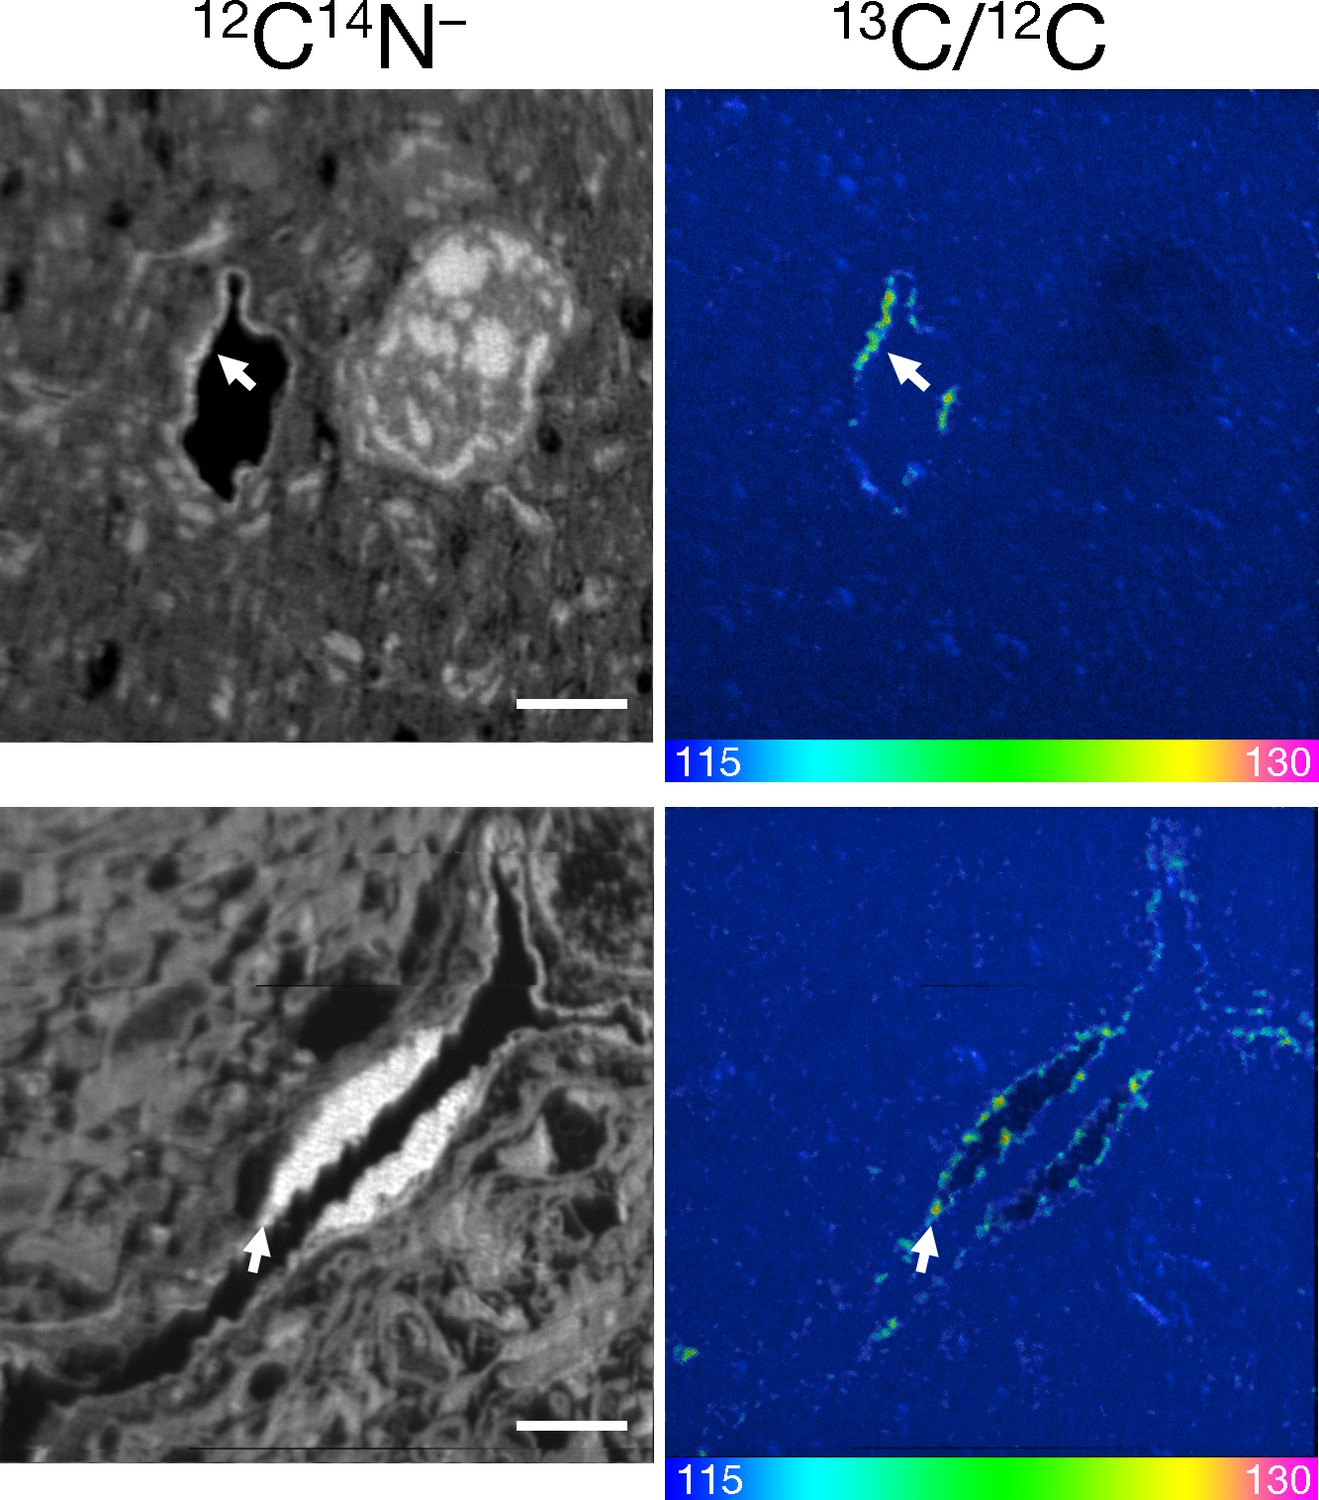
NanoSIMS imaging showing 13C enrichment in capillary endothelial cells of normal brain after administering 13C-labeled mixed fatty acids by oral gavage (three doses of 80 mg administered 12 hr apart).
Four hours after the last dose, mice were euthanized; perfusion-fixed with carbodiimide/glutaraldehyde; and sections of normal brain were prepared for NanoSIMS imaging. 12C14N– images were generated to visualize tissue morphology; 13C/12C ratio images show 13C enrichment (white arrows) in brain capillary endothelial cells. Two mice were evaluated and representative images are shown. Scale bar, 4 μm.
Figure 8—figure supplement 3
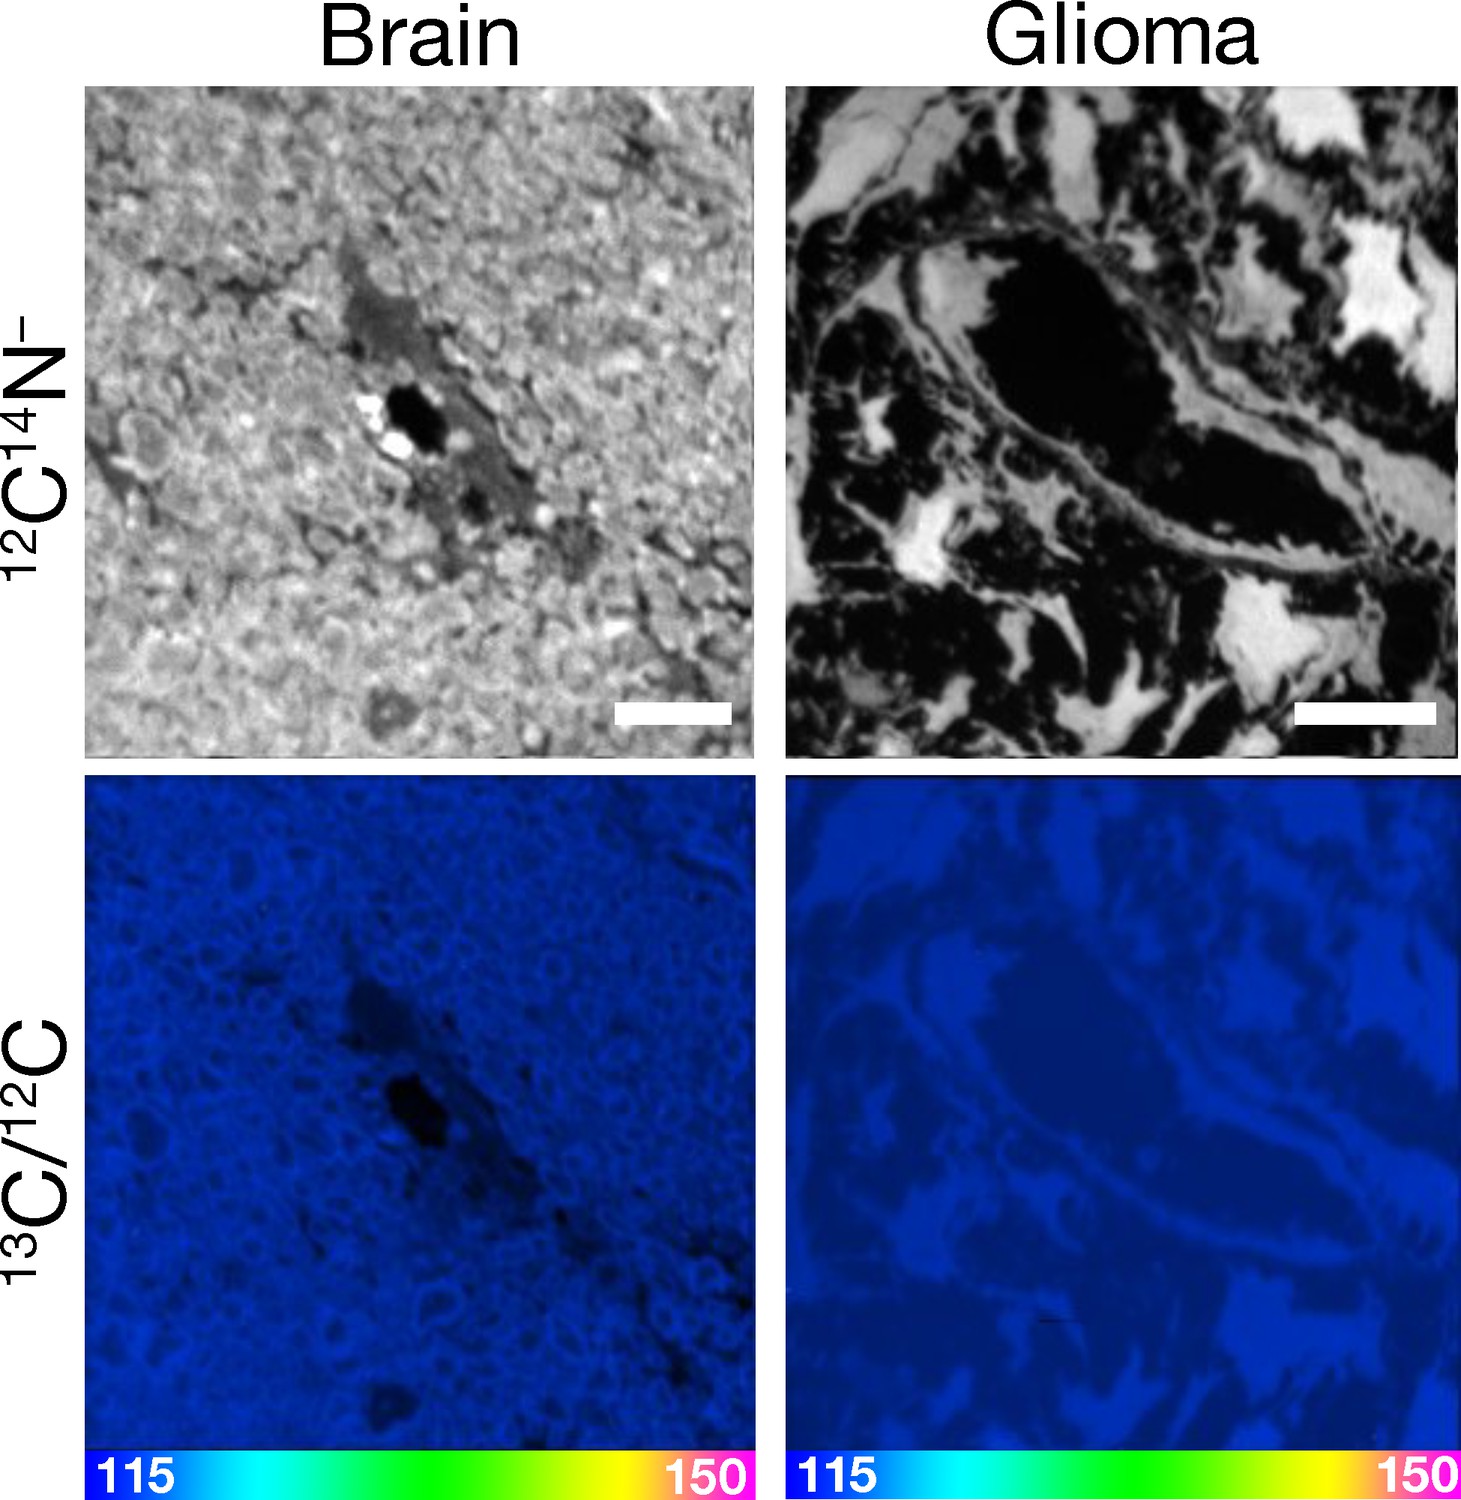
Absence of 13C enrichment in the glioma and brain of a mouse that had been given an injection of PBS alone.
Four-month-old C57BL/6 mice harboring CT-2A gliomas were fasted for 4 hr and then injected intravenously with 200 μl of PBS. After 1 min, the mouse was euthanized; perfusion-fixed with carbodiimide/glutaraldehyde; and sections of glioma and brain were prepared for NanoSIMS imaging. 12C14N– images were generated to visualize tissue morphology. The 13C/12C ratio images show an absence of 13C enrichment in glioma and brain. One mouse was evaluated. Scale bars, 7 μm.
Figure 8—figure supplement 4
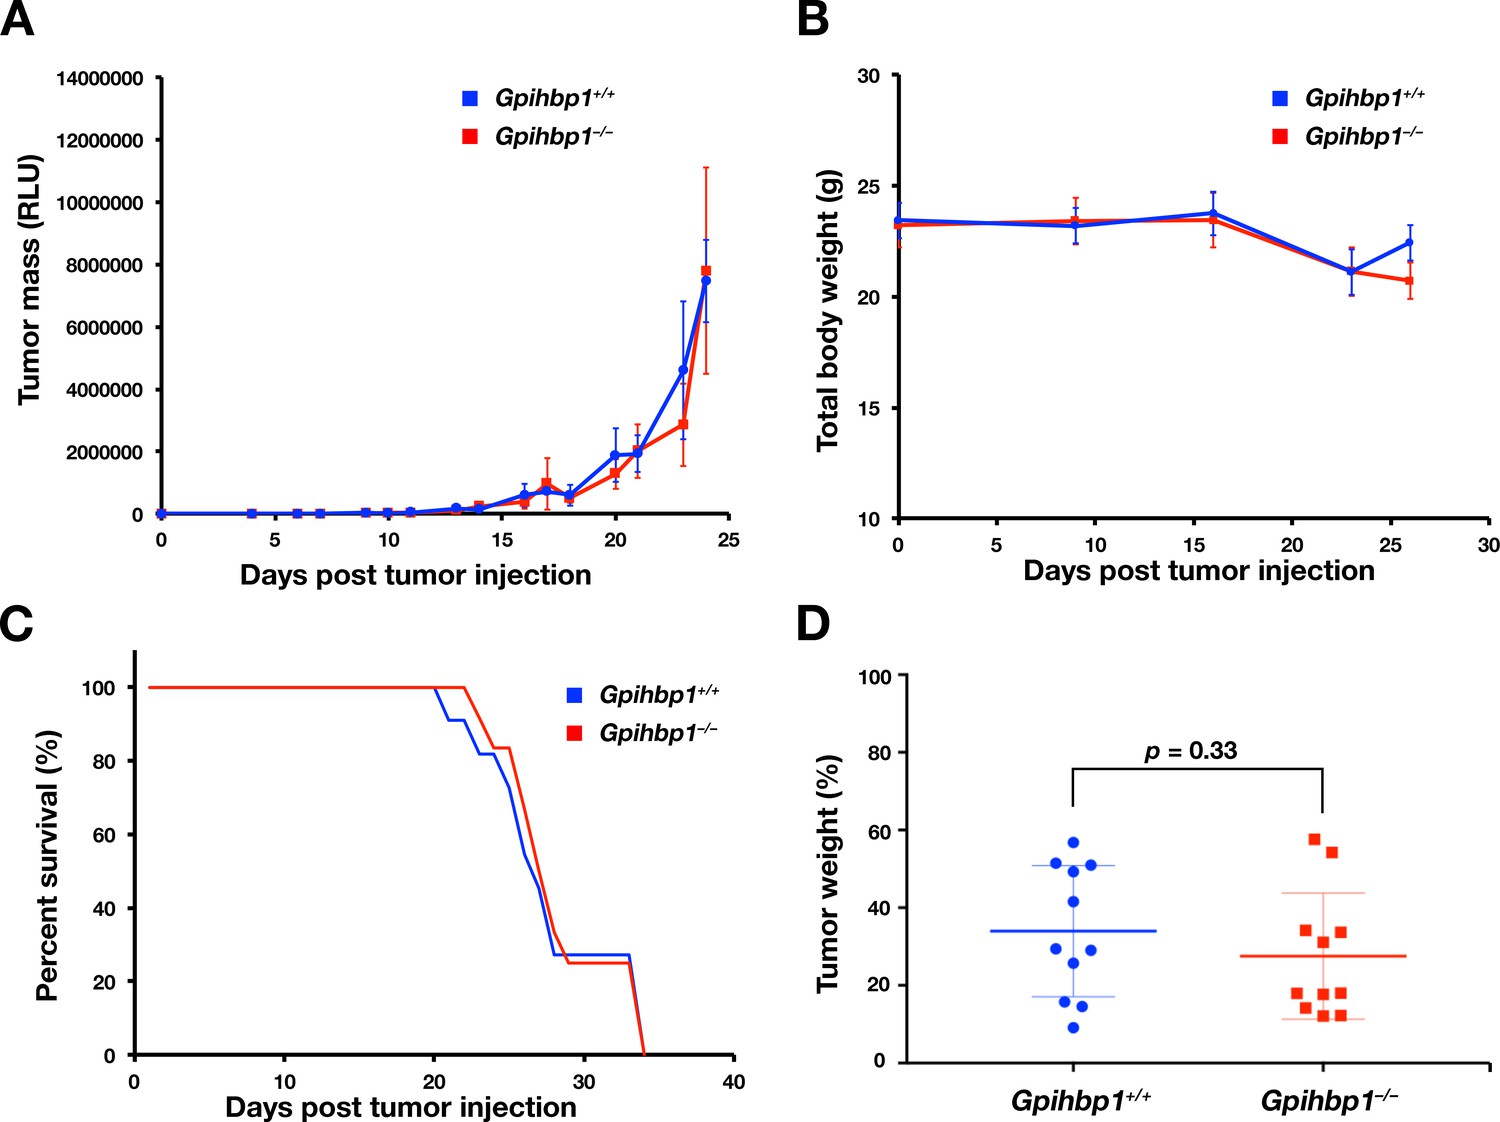
Glioma studies in Gpihbp1+/+ and Gpihbp1–/– mice.
CT-2A glioma cells that were stably transfected with a Gaussia luciferase reporter were injected intracranially into Gpihbp1+/+ (blue) and Gpihbp1–/– (red) mice (n = 11/group). Tumor growth in live animals was assessed by measuring luciferase activity in the blood. (A) Luciferase activity in the blood. No significant differences were observed. (B) Body weights at weekly intervals; no significant differences were observed. (C) Survival curves of mice (mice were euthanized when they lost > 20% of their body weight). No significant differences were observed. (D) Tumor weight as a percentage of total brain weight at the time that the mice were euthanized. A Student’s t-test was performed, assuming both equal variance and unequal variance. Both tests yielded a p-value of 0.33. Means ± SDs are shown.
Figure 9

Intravascular lipolysis as a source of lipid nutrients for gliomas.
In normal brain (left panel), LPL is produced by astrocytes, neurons, oligodendrocytes, and fibroblasts. Because GPIHBP1 is not expressed in the capillaries of the brain parenchyma, we have proposed that LPL remains within the interstitial spaces of the brain (i.e., that it has an extravascular function) (Adeyo et al., 2012; Young et al., 2011). In gliomas (right panel), GPIHBP1 is expressed in capillary endothelial cells, allowing GPIHBP1 to capture locally produced LPL and to shuttle it to the capillary lumen. Intravascular processing of triglyceride-rich lipoproteins in gliomas provides a source of lipid nutrients for glioma cells. HSPGs, heparan sulfate proteoglycans.
Tables
Table 1
Human glioma tumor specimens.
Expression of GPIHBP1 was assessed by immunohistochemistry with mAbs against human GPIHBP1 (RF4, RE3, RG3). Those conducting the studies were blinded to diagnoses. This table details the tumor diagnosis, location, 1p/19q co-deletion, and IDH1 mutation status, as well as the presence of GPIHBP1.
| Sample ID | Tissue diagnosis | Location | 1p/19q co-deletion | IDH1 mutation | GPIHBP1 |
|---|---|---|---|---|---|
| 1 | Glioblastoma (GBM) | Right frontal, parietal | No | Negative | Yes |
| 2 | GBM | Left temporal | No | Negative | Yes |
| 3 | GBM | Right occipital | No | Negative | Yes |
| 4 | GBM | Left frontal | No | Negative | Yes |
| 5 | Oligodendroglioma Grade II | Left anterior temporal, left posterior temporal | Yes | Negative | Yes |
| 6 | Oligoastrocytoma Grade III | Right temporal | No | Negative | Yes |
| 7 | GBM + oligodendroglial component | Left frontal | Yes | Negative | Yes |
| 8 | GBM + extensive oligodendroglial component | Right frontal | No | Negative | Yes |
| 9 | Oligodendroglioma Grade III | Left frontal | Yes | +R132H | Yes |
| 10 | Oligodendroglioma Grade III | Left frontal | Yes | +R132H | Yes |
| 11 | Oligoastrocytoma | Right parietal | No | Negative | Yes |
| 12 | Oligodendroglioma Grade III | Right parietal | Yes | +R132H | Yes |
| 13 | Oligodendroglioma Grade III | Right parietal | Yes | Negative | Yes |
| 14 | Oligoastrocytoma Grade III | Left temporal | No | +R132H | Yes |
| 15 | Oligoastrocytoma Grade III | Right temporal | No | +R132G | No |
| 16 | Oligoastrocytoma Grade III | Right frontal | No | +R132H | No |
| 17 | Oligodendroglioma Grade III | Left frontal | Yes | Negative | No |
| 18 | Oligodendroglioma Grade III | Left frontal | Yes | +R132H | No |
| 19 | Oligodendroglioma Grade III | Left temporal | Yes | Negative | No |
| 20 | Oligodendroglioma Grade III | Right temporal | Yes | +R132H | No |
Key resources table
| Reagent type (species) or resource | Designation | Source or reference | Identifiers | Additional information |
|---|---|---|---|---|
| Genetic reagent (M. musculus) | Gpihbp1–/– | Beigneux et al., 2007 | RRID: MGI:3771172 | Dr. Stephen G Young (UCLA) |
| Genetic reagent (M. musculus) | Lpl–/–MCK-hLPL | Levak-Frank et al., 1995 | RRID: MGI:3624988 | Dr. Rudolph Zechner (Graz University) |
| Genetic reagent (M. musculus) | ROSAmT/mGPdgfb-iCreT2 | Mathivet et al., 2017 | Dr. Holger Gerhardt (VIB KU-Leuven) | |
| Cell line (M. musculus) | CT-2A | Seyfried et al., 1992 | Dr. Thomas Seyfried (Boston College) | |
| Cell line (M. musculus) | CT-2A–BFP | PMID: 24658686 | Dr. Holger Gerhardt (VIB KU-Leuven) | |
| Cell line (M. musculus) | bEnd.3 | ATCC | Catalog No. CRL-2299 RRID: CVCL_0170 | |
| Transfected construct (lentiviral plasmid) | plenti-GLuc-IRES-EGFP | Targeting Systems | Catalog No. GL-GFP | |
| Antibody | Rat monoclonal anti-mouse GPIHBP1 (11A12) | Beigneux et al., 2009 | Dr. Stephen G Young (UCLA); IHC (10 μg/ml) | |
| Antibody | Mouse monoclonal anti-human GPIHBP1 (RE3) | Hu et al., 2017 | Dr. Stephen G Young (UCLA); IHC (10 μg/ml) | |
| Antibody | Mouse monoclonal anti-human GPIHBP1 (RF4) | Hu et al., 2017 | Dr. Stephen G Young (UCLA); IHC (10 μg/ml) | |
| Antibody | Mouse monoclonal anti-human GPIHBP1 (RG3) | Hu et al., 2017 | Dr. Stephen G Young (UCLA); IHC (10 μg/ml) | |
| Antibody | Rabbit polyclonal anti-vWF | Dako | Catalog No. A0082 RRID: AB_2315602 | IHC (1:200) |
| Antibody | Goat polyclonal anti-GFAP | Abcam | Catalog No. ab53554 RRID: AB_880202 | IHC (1:200) |
| Antibody | Rabbit polyclonal anti-GLUT1 | Millipore-Sigma | Catalog No. 07–1401 RRID: AB_1587074 | IHC (1:200) |
| Antibody | Rabbit polyclonal anti-CD31 | Abcam | Catalog No. ab28364 RRID: AB_726362 | IHC (1:50) |
| Antibody | Rat monoclonal anti-F4/80 | Abcam | Catalog No. ab6640 RRID: AB_1140040 | IHC (10 μg/ml) |
| Antibody | Goat polyclonal anti-mouse LPL | Page et al., 2006 | Dr. André Bensadoun (Cornell); IHC (12 μg/ml) | |
| Antibody | Alexa Fluor 488, 568, 647 secondaries | ThermoFisher Scientific | IHC (1:500) | |
| Commercial assay or kit | ImmPRESS Excel Staining Kit | Vector Laboratory | Catalog No. MP-7602 | |
| Sequence-based reagent | Mouse Gpihbp1 primers | 5′-AGCAGGGACAGAGCACCTCT-3′ and 5′-AGACGAGCGTGATGCAGAAG-3′ | ||
| Sequence-based reagent | Mouse Cd31 primers | 5′-AACCGTATCTCCAAAGCCAGT-3′ and 5′-CCAGACGACTGGAGGAGAACT-3′ | ||
| Sequence-based reagent | Mouse Angpt2 primers | 5′-AACTCGCTCCTTCAGAAGCAGC-3′ and 5′-TTCCGCACAGTCTCTGAAGGTG-3′ | ||
| Sequence-based reagent | Mouse Dusp5 primers | 5′-TCGCCTACAGACCAGCCTATGA-3′ and 5′-TGATGTGCAGGTTGGCGAGGAA-3′ | ||
| Sequence-based reagent | Mouse Cxcr4 primers | 5′-GACTGGCATAGTCGGCAATGGA-3′ and 5′-CAAAGAGGAGGTCAGCCACTGA-3′ | ||
| Sequence-based reagent | Mouse Lpl primers | 5′-AGGTGGACATCGGAGAACTG-3′ and 5′-TCCCTAGCACAGAAGATGACC-3′ | ||
| Sequence-based reagent | Human LPL primers | 5′-TAGCTGGTCAGACTGGTGGA-3′ and 5′-TTCACAAATACCGCAGGTG-3′ | ||
| Recombinant DNA reagent | ALO-D4 plasmid | Gay et al., 2015 | Dr. Arun Radhakrishnan (UT Southwestern) | |
| Chemical compound, drug | N-(3-Dimethylaminopropyl)-N′-ethylcarbodiimide hydrochloride (carbodiimide) | Millipore-Sigma | Catalog No. 03449 | |
| Chemical compound, drug | Glutaraldehyde25% solution | Electron Microscopy Sciences | Catalog No. 16220 | |
| Chemical compound, drug | Osmium tetroxide 4% solution | Electron Microscopy Sciences | Catalog No. 18459 | |
| Chemical compound, drug | Paraformaldehyde 16% solution | Electron Microscopy Sciences | Catalog No. 15170 | |
| Chemical compound, drug | EMbed 812 | Electron Microscopy Sciences | Catalog No. 14120 | |
| Chemical compound, drug | Sodium cacodylate trihydrate | Electron Microscopy Sciences | Catalog No. 12300 | |
| Chemical compound, drug | Uranyl acetate | SPI-Chem | Catalog No. 02624AB | |
| Chemical compound, drug | DAPI | ThermoFisher Scientific | Catalog No. 1306 | IHC (3 μg/ml) |
| Chemical compound, drug | Mouse VEGF | Millipore-Sigma | Catalog No. V4512 | |
| Software, algorithm | LIMMA | Ritchie et al., 2015 | RRID: SCR_010943 | |
| Other | D-GLUCOSE (U-13C6, 99%) | Cambridge Isotope Laboratories | Catalog No. CLM-1396-PK | |
| Other | Mixed fatty acids (U-D, 96–98%) | Cambridge Isotope Laboratories | Catalog No. DLM-8572-PK | |
| Other | Mixed fatty acids (13C, 98%+) | Cambridge Isotope Laboratories | Catalog No. CLM-8455-PK |
Additional files
-
Transparent reporting form
- https://doi.org/10.7554/eLife.47178.034
Download links
A two-part list of links to download the article, or parts of the article, in various formats.
Downloads (link to download the article as PDF)
Open citations (links to open the citations from this article in various online reference manager services)
Cite this article (links to download the citations from this article in formats compatible with various reference manager tools)
GPIHBP1 expression in gliomas promotes utilization of lipoprotein-derived nutrients
eLife 8:e47178.
https://doi.org/10.7554/eLife.47178


