Defective AMH signaling disrupts GnRH neuron development and function and contributes to hypogonadotropic hypogonadism
- Jean-Pierre Aubert Research Center (JPArc), Laboratory of Development and Plasticity of the Neuroendocrine Brain, Inserm, UMR-S 1172, France
- University of Lille, FHU 1, 000 Days for Health, France
- University Hospital, Switzerland
- University of Newcastle-upon-Tyne, United Kingdom
- University of Basel Children’s Hospital, Switzerland
- CHU Lille, Laboratoire de Biochimie et Hormonologie, Centre de Biologie Pathologie, France
- Universitat Autònoma de Barcelona, Spain
Figures
Figure 1
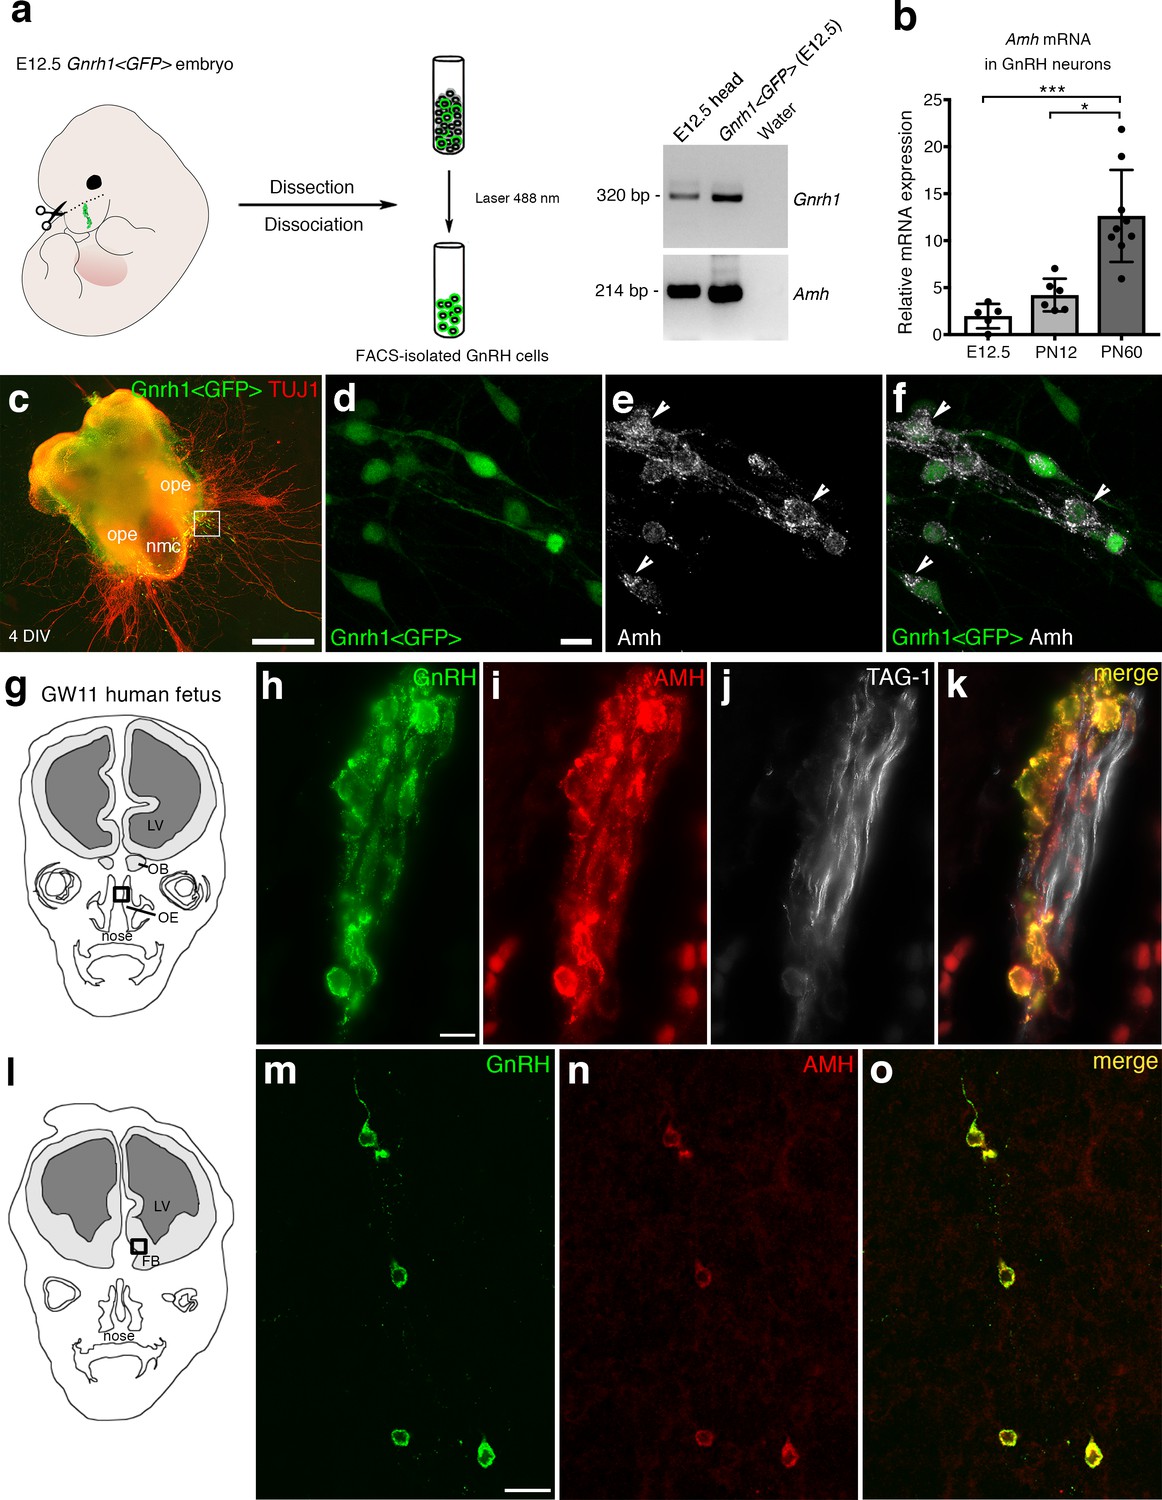
AMH is expressed in migratory GnRH neurons in mouse and human fetuses.
(a) Schematic illustrates isolation of Gnrh1 <GFP> expressing cells in the nasal region of embryonic day 12.5 animals (E12.5) through fluorescent activated cell sorting (FACS). Gel on the right-hand side is a representative qualitative PCR depicting GnRH and Amh expression in migratory GnRH cells and in the head of E12.5 Gnrh1 <GFP> embryos. (b) Quantitative analysis of Amh mRNA expression in FACS-isolated GnRH neurons at E12.5 (n = 5), postnatal day 12 (PN12, n = 6) and postnatal day 60 (PN60, n = 9). Data are represented as median values with the 25th-75th percentile range. Comparisons between groups were performed using a Kruskal-Wallis test followed by Dunn’s post hoc analysis. *p = 0.0398, ***p = 0.0006. (c) Representative image of a nasal explant (out of n = 3) generated from a Gnrh1 <GFP> embryo and cultured for 4 days (DIV: days in vitro) before immunostaining for tubulin βIII (TUJ1, red). (d–f) Higher magnification picture of inset in d) showing migratory GFP-positive GnRH neurons (green) expressing Amh (white). (g) Schematic representation of a GW11 human fetus head (coronal view) illustrating the nasal area (box) used for immunofluorescence. (h–k) GnRH (green), AMH (red) and TAG-1 (white) expression in a coronal section of a GW11 fetus (out of n = 2 GW11 fetuses, females). AMH is expressed in GnRH neurons but not on vomeronasal/terminal fibers. (l) Schematic representation of a GW11 human fetus head (coronal view) illustrating the forebrain area (box) used for immunofluorescence. (m–o) AMH is expressed in GnRH neurons that are migrating in the forebrain. NMC: nasal midline cartilage; OPE: olfactory placode epithelium; VNO: vomeronasal organ; OE: olfactory epithelium; OB: olfactory bulb; FB: forebrain; LV: lateral ventricle. Scale bars: (c) 500 μm; (d–f) 10 μm; (h–k) 10 μm; (m–o) 20 μm.
-
Figure 1—source data 1
This spreadsheet contains the normalized values used to generate the bar plots shown in Figure 1b.
- https://doi.org/10.7554/eLife.47198.003
Figure 2
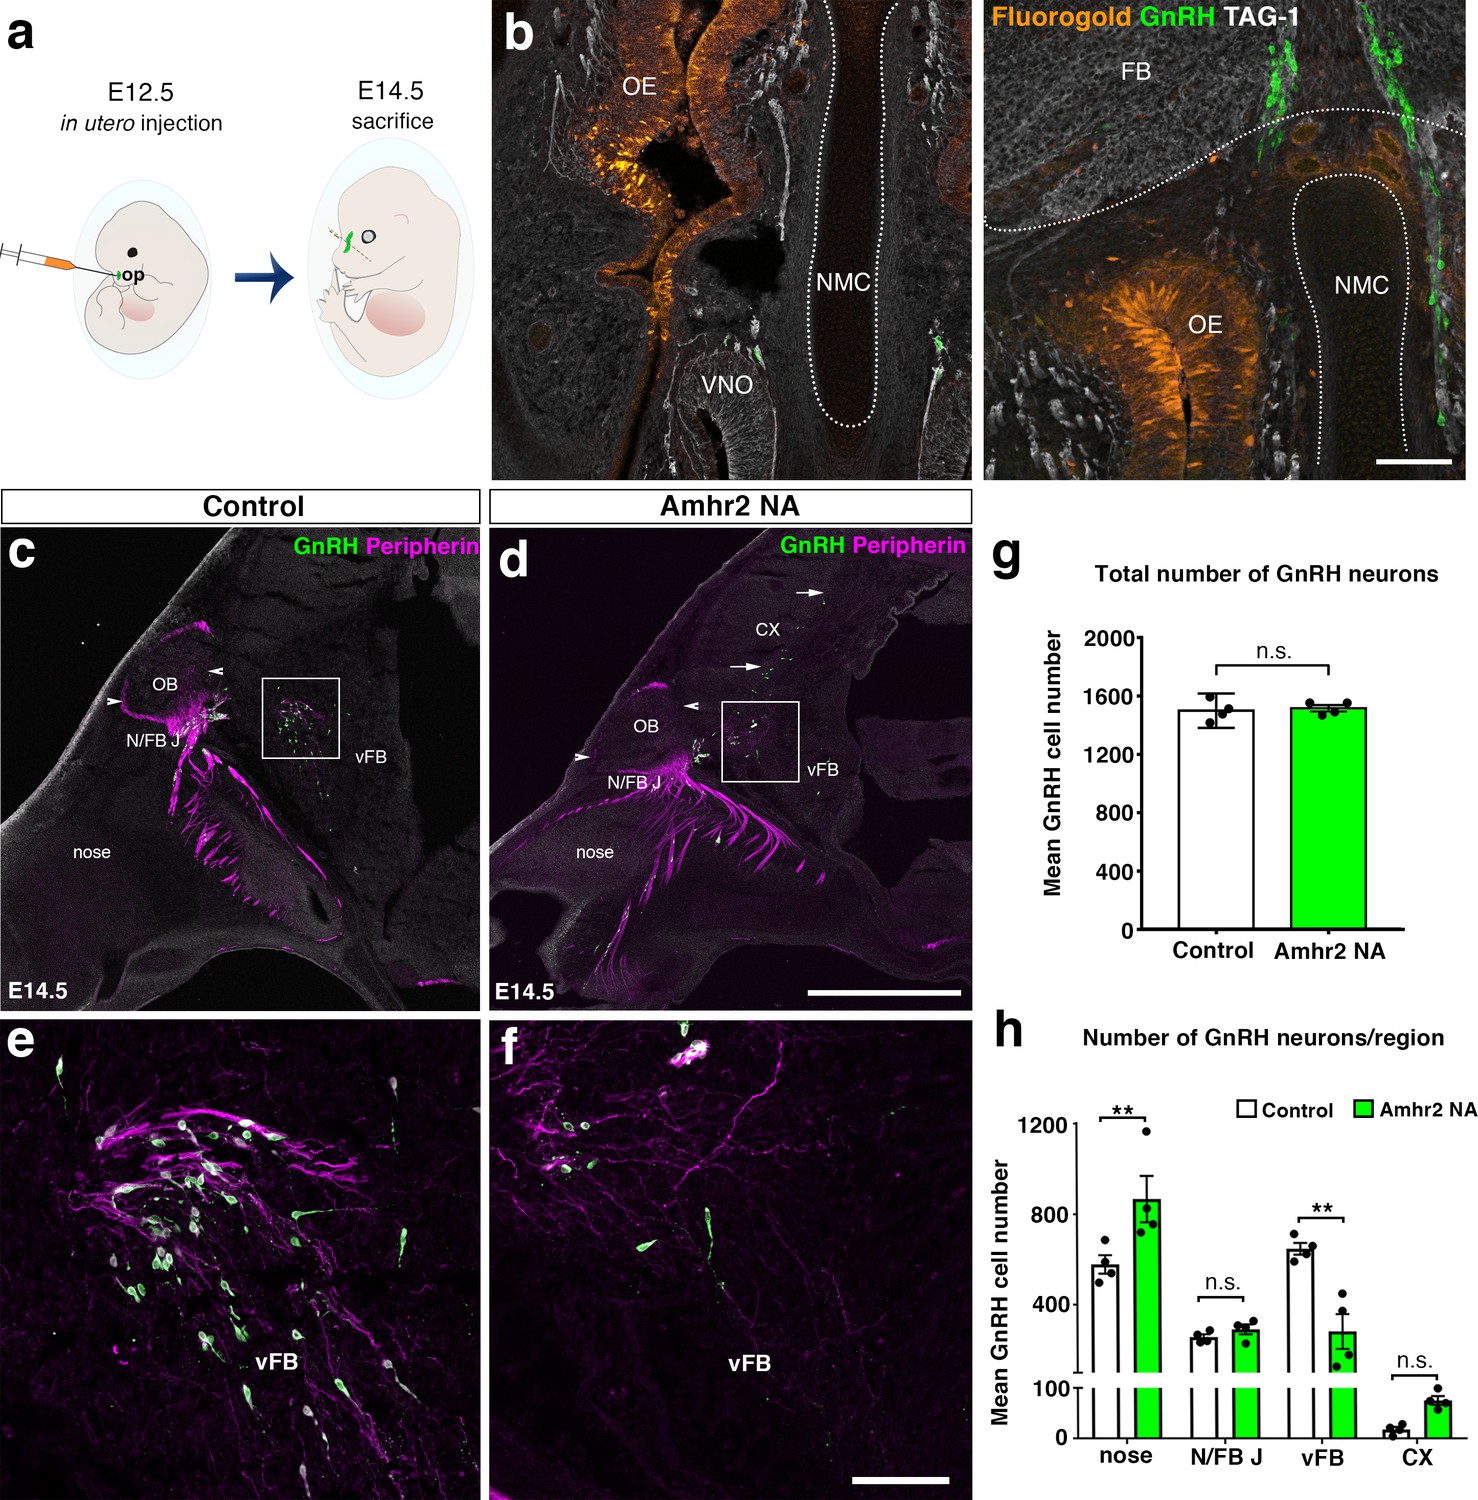
In utero pharmacological invalidation of Amhr2 disrupts GnRH neuronal migration and the olfactory/terminal nerve targeting.
(a) Schematic of in utero injections targeting the olfactory pits. Injections were performed at E12.5 and embryos harvested 48 hr later. (b) Representative coronal section of an embryo head at E14.5 showing that olfactory pit Fluorogold delivery at E12.5 was successful. GnRH immunoreactive neurons are shown in green. (c–f) Representative photomicrographs of sagittal sections of mouse embryos injected at E12.5 with either saline or a neutralizing antibody for Amhr2 (Amhr2-NA) and immunostained for GnRH (green) and Peripherin (magenta) at E14.5. (e, f) Higher magnification confocal photomicrograph of boxed areas in c and d. (g) Quantification of the total number of GnRH immunoreactive neurons in saline-injected (control) and Amhr2-NA injected embryos (n = 4 for both groups, harvested from two independent dams). Data are represented as mean ± s.e.m (n = 4, unpaired two-tailed Student’s t test: mean cell number, t6 = 0.3796, p = 0.7173). (h) Quantitative analysis of GnRH neuronal distribution throughout the migratory pathway in the two experimental groups. Data are represented as mean ± s.e.m (n = 4, two-way ANOVA, F3,24 = 15.09, p<0.0001; followed by Holm-Šídák multiple comparison post hoc test, **p<0.005; n.s., not significant; N/FB J Amhr2+/+ vs. N/FB J Amhr2-/-p = 0.99, CX Amhr2+/+ vs. CX Amhr2-/-p = 0.88). Cx: cortex; FB: forebrain; N/FBJ: nasal/forebrain junction; oe: olfactory epithelium; NMC: nasal mesenchyme. Scale bars: (b) 100 μm; (d) 2.5 mm; (f) 50 μm.
-
Figure 2—source data 1
This spreadsheet contains the values used to generate the bar plots shown in Figure 2g and h.
- https://doi.org/10.7554/eLife.47198.005
Figure 3 with 1 supplement

GnRH migration and olfactory innervation are perturbed in Amhr2-/- mice.
(a) Schematic representation depicting whole-body iDISCO experiments in E13.5 Amhr2+/+ and Amhr2-/- embryos. E13.5 embryos (n = 2 per genotype) were immunolabelled for Peripherin and GnRH, rendered optically transparent using iDISCO and imaged with a light-sheet microscope (LSM). (b, c) Frontal projection of the embryo heads, arrowheads indicate noticeable differences in Peripherin-positive fibers innervating the olfactory bulb (OB). Lateral projection views (d, e) showing defective GnRH migration and terminal nerve projections to the ventral forebrain (vFB, arrows). (f, g) Higher magnification photomicrographs depicting olfactory axon innervations of the right OB shown in b and c. Dotted circles define the anatomical border of the OB. (h, i) 3D rendering of figures in f and g. Arrowheads indicate observed differences in olfactory axon innervation between Amhr2+/+ and Amhr2-/- embryos. (j, k) 3D rendering of peripherin and GnRH staining observed from a lateral projection in a representative Amhr2+/+ and Amhr2-/- embryo. Cx: cortex; VNO: vomeronasal organ. Scale bars: (b) 400 μm; (d) 300 μm; (f) 130 μm.
Figure 3—video 1
Light-sheet fluorescence microscopy video of solvent-cleared E13.5 Amhr2+/+ and Amhr2-/- embryos immunostained in toto for GnRH (green) and peripherin (red).
https://doi.org/10.7554/eLife.47198.007
Figure 4 with 1 supplement
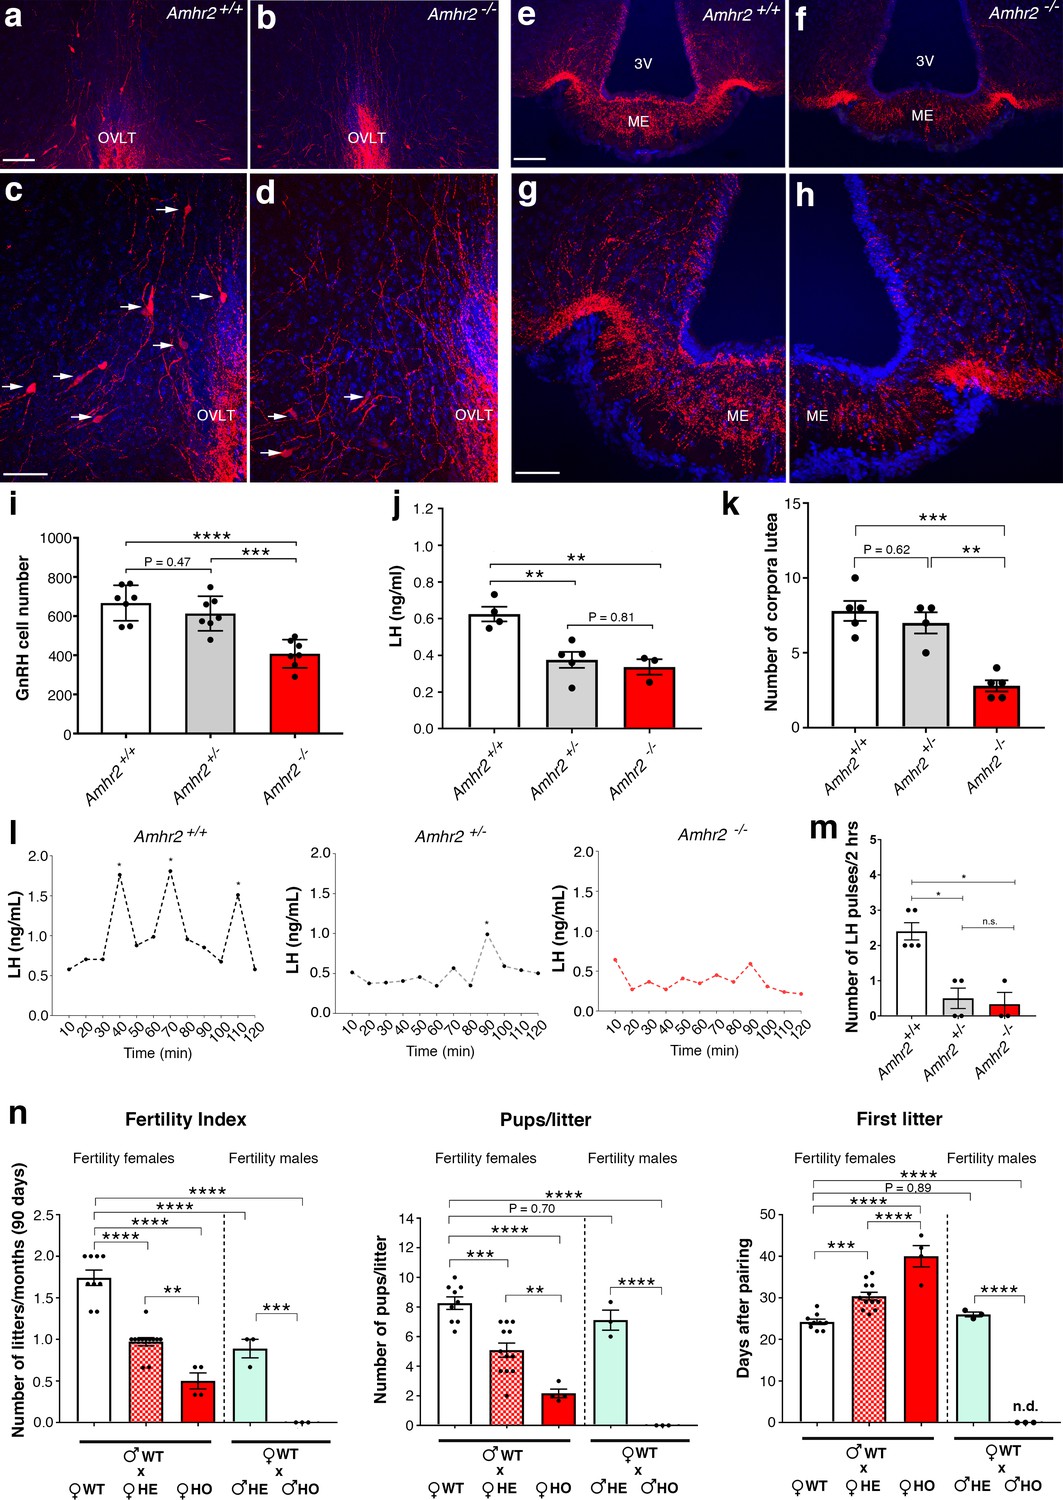
Amhr2 mutant mice show reduced GnRH cell number and impaired LH secretion and fertility.
(a–h) Immunolabelling of GnRH (red staining) in adult wild type and Amhr2-/- adult female mice (P90–P120). The majority of GnRH cell bodies are located at the level of the organum vasculosum laminae terminalis (OVLT) in both Amhr2 +/+ and Amhr2 -/- mice, (arrows (c, d). (e–h) GnRH fiber projections at the level of the median eminence. (i) Total mean GnRH population in Amhr2+/+, Amhr2+/- and Amhr2-/- adult female mice brains (3–4 months old). Comparisons between groups were performed using one-way ANOVA followed by Tukey’s post hoc test (n = 7 for all groups, F2,18 <0.0001; Amhr2+/+ vs Amhr2+/- P = 0.4716; WT vs. Amhr2-/-p<0.0001, Amhr2+/- vs Amhr2-/-p = 0.0007). (j) Plasma LH levels in adult mature (4–6 months old) diestrous females (Amhr2+/+, n = 4; Amhr2+/-, n = 5; Amhr2-/- n = 3). Statistical analysis was performed by one-way ANOVA (F2,9 = 12.64, p = 0.0024) followed by Tukey’s multiple comparison post hoc test (Amhr2+/+ vs. Amhr2+/- P = 0.005; Amhr2+/+ vs. Amhr2-/-p = 0.046, Amhr2+/- vs. Amhr2-/-p = 0.8164). (k) Quantitative analyses of the mean number of corpora lutea (CL) in Amhr2+/+ (n = 5), Amhr2+/- (n = 4) and Amhr2-/- (n = 5) adult ovaries (4–6 months old). Statistical significance between groups was assessed using one-way ANOVA (F2,11 = 22.11, p = 0.0001) followed by Tukey’s multiple comparison post hoc test (Amhr2+/+ vs. Amhr2+/- P = 0.6259; Amhr2+/+ vs. Amhr2-/-p = 0.0002 and Amhr2+/- vs. Amhr2-/-p = 0.0012). (l) Representative graphs for LH pulsatility in female dioestrous adult mice of the corresponding genotype. Asterisks indicate the number of LH pulses per 2 hr interval. (m) Number of LH pulses in adult (P60) diestrous females (Amhr2+/+, n = 5; Amhr2+/-, n = 4; Amhr2-/- n = 3). Statistical analysis was performed by non-parametric Kruskal-Wallis test p = 0.0028 (Amhr2+/+ vs. Amhr2+/- P = 0.041; Amhr2+/+ vs. Amhr2-/-p = 0.038 and Amhr2+/- vs. Amhr2-/-p>0.999). (n) Bar graphs illustrating the results of the constant mating protocol performed over 90 days on the following groups: (♀Amhr2+/+ x ♂Amhr2+/+, n = 9; ♀Amhr2+/- x ♂Amhr2+/+, n = 12; ♀Amhr2-/- x ♂Amhr2+/+, n = 4; ♀Amhr2+/+ x ♂Amhr2+/-, n = 3; ♀Amhr2+/+ x ♂Amhr2+/-, n = 3. Female and male mice were 4–6 months-old). Comparisons between groups were performed using one-way ANOVA (fertility index, F4,26 = 51.47, p<0.0001; first litter, F4,26 = 88.82, p<0.0001; pups per litter, F4,26 = 29.67 P<0.0001) followed by Tukey’s multiple comparison post hoc test, *p<0.05; **p<0.005; ***p<0.0005; ****p<0.0001. Each cluster of data points represents a different mouse. Data were combined from three independent experiments. Throughout the figure, data are displayed as mean ± s.e.m. *p<0.05; **p<0.005; ***p<0.0005; ****p<0.0001. Scale bars: (a, b, e, f) 100 μm; (c, d, g, h) 50 μm.
-
Figure 4—source data 1
This spreadsheet contains the values used to generate the bar plots shown in Figure 4i j, k, m, n.
- https://doi.org/10.7554/eLife.47198.011
Figure 4—figure supplement 1

GnRH cell number in Amhr2 wild-type and knock-out animals as a function of sex.
Total mean GnRH population in Amhr2+/+ and Amhr2-/- adult male and female mice brains (3–4 months old). Comparisons between groups were performed using one-way ANOVA followed by Tukey’s post hoc test (n = 3 for male groups, n = 7 for female groups, F3,16 <0.0001; males Amhr2+/+ vs males Amhr2-/-p = 0.0004; males Amhr2+/+ vs females Amhr2+/+ P = 0.156; males Amhr2+/+ vs females Amhr2-/-p<0.0001; males Amhr2-/- vs females Amhr2+/+ P = 0.0056; males Amhr2-/- vs females Amhr2-/-p = 0.743; females Amhr2+/+ vs females Amhr2-/-p<0.0001). Throughout the figure, data were combined from three independent experiments and displayed as mean ± s.e.m. **p<0.005; ***p<0.0005; ****p<0.0001; n.s. not significant.
-
Figure 4—figure supplement 1—source data 1
This spreadsheet contains the values used to generate the bar plots shown in Figure 4—figure supplement 1.
- https://doi.org/10.7554/eLife.47198.010
Figure 5
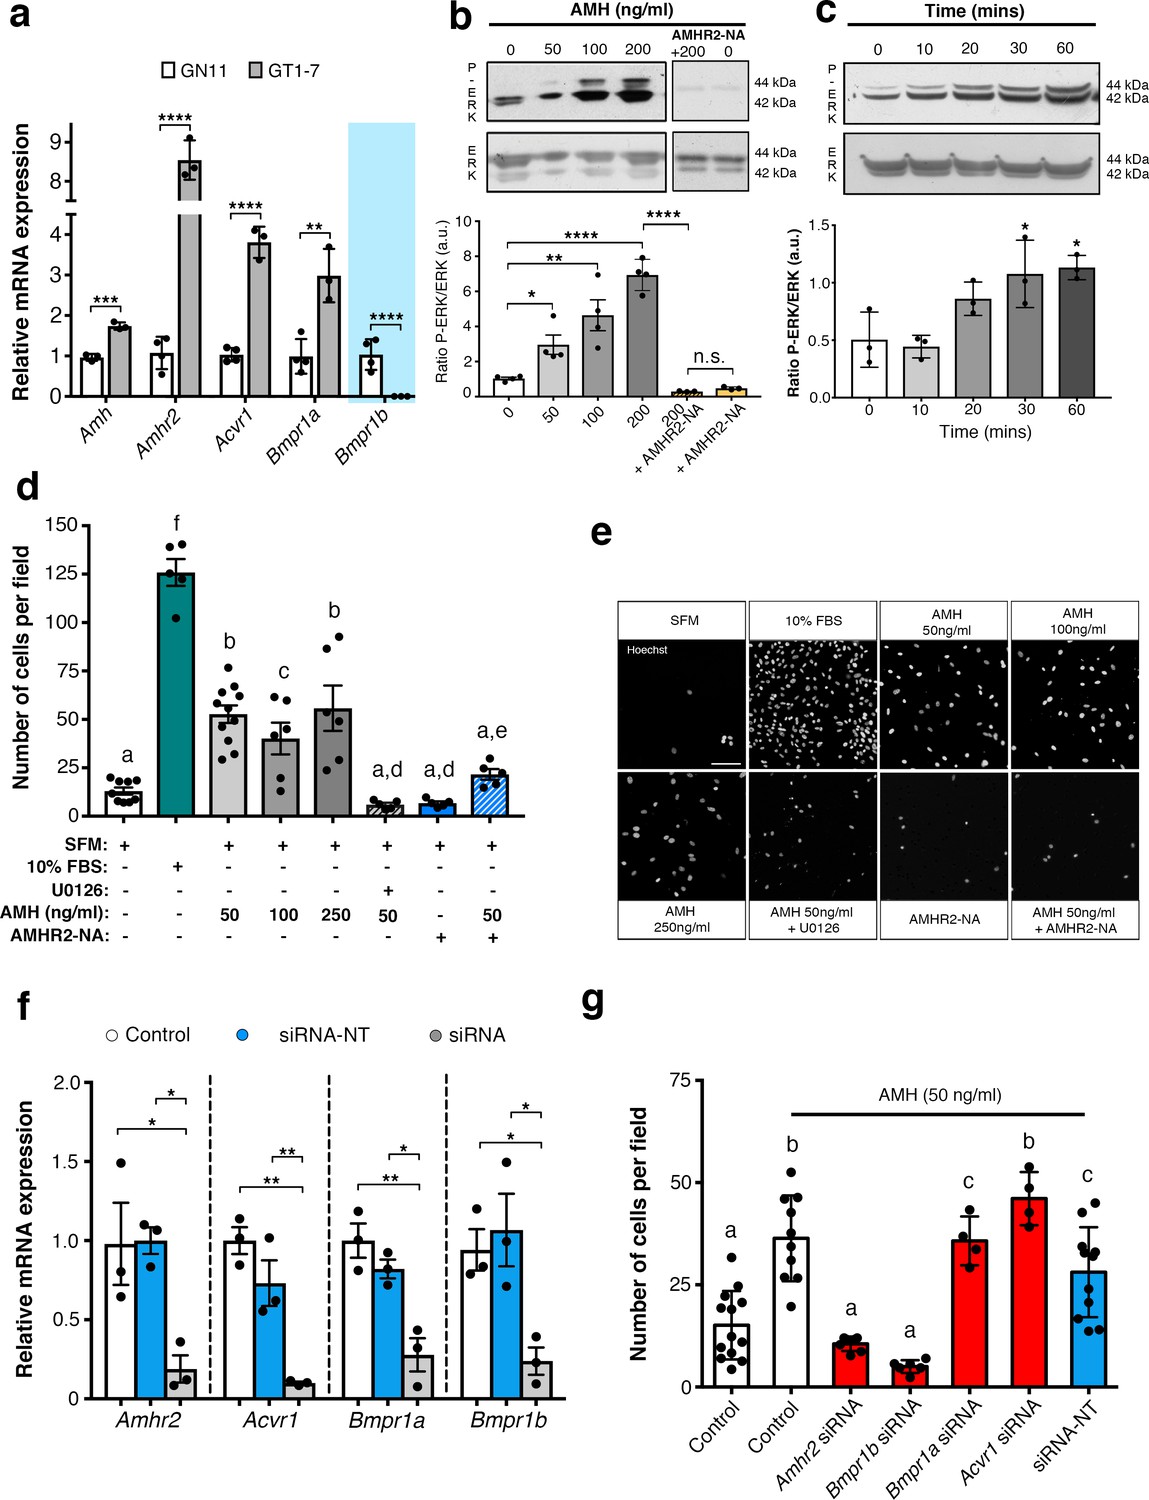
AMH promotes GnRH cell motility via Amhr2 and Bmpr1b signaling.
(a) Quantitative RT-PCR analysis for Amh, Amhr2, Acvr1 (Activin Receptor1; ALK2), Bmpr1a (Bone Morphogenetic Protein Receptor1a; ALK3) and Bmpr1b (Bone Morphogenetic Protein Receptor1b; ALK6) mRNA in GN11 (n = 4) and GT1-7 (n = 3) cells. Comparisons between treatment groups were performed using unpaired two-tailed Student’s t test (Amh t5 = 1.139, p = 0.0004; Amhr2 t5 = 1.6, p<0.0001; Acvr1 t5 = 5.044, p<0.0001); Bmpr1a t5 = 2.374, p<0.0044. (b) Representative western blot showing P-ERK1/2 and total ERK1/2 in cell lysates of GN11 cells stimulated with indicated doses of AMH (n = 4). Right boxed figure is a representative blot showing P-ERK1/2 and total ERK1/2 in cell lysates of GN11 cells stimulated with anti-Amhr2 neutralizing antibody with or without 200 ng/ml of AMH (Amhr2-NA, n = 3 per condition). Bar graph illustrates the mean ratio P-ERK1/2 over total ERK1/2 (n = 4 for all except AMHR2-NA and AMHR2-NA + AMH 200 ng/ml, n = 3). Comparisons between treatment groups were performed using a two-way ANOVA (F6,19 = 29.11, p<0.0001; followed by Holm-Šídák’s multiple comparison post hoc test. Adjusted p values: 0 vs. 50 = 0.0461, 0 vs 100 = 0.0003, 0 vs 200 =< 0.0001, 200 vs AMHR2-NA + 200 =< 0.0001, 0 vs AMHR2-NA => 0.9999). (c) Representative western blot showing P-ERK1/2 and total ERK1/2 in cell lysates of GN11 cells stimulated with 50 ng/ml of AMH for the indicated times (minutes: min). Bar graph illustrates the mean ratio P-ERK1/2 over total ERK1/2 (n = 3 for all). Comparisons between treatment groups were performed using a one-way ANOVA (F 4,10 = 8.171, followed by Tukey’s multiple comparison post hoc test. Adjusted p values: 0 vs. 10 = 0.9945, 0 vs. 20 = 0.2333, 0 vs. 30 = 0.0292, 0 vs. 60 = 0.0170). (d) Schematic representation on top of the graph bar illustrates the transwell assay used to assess cell motility in d, e, g, whereby AMH was placed on the top and lower chamber. Bar graph illustrates the mean number of migrated GN11 cells stimulated with serum free medium (SFM, basal conditions, n = 9), with 10% fetal bovine serum (FBS, strong inducer of cell motility, n = 5), or with the indicated doses of AMH with or without the MAPK Kinase inhibitor, U0126 (AMH 50 ng/ml n = 11, AMH 100 ng/ml n = 6, AMH 250 ng/ml n = 6, AMH 50 ng/ml + U0126 n=5), or with Amhr2-NA with or without AMH 50 ng/ml (n = 5). One-way ANOVA, F 7,44 = 38.48, followed by Tukey’s multiple comparison post hoc test. (a): not significantly different from a groups (p>0.05); b: significantly different from a) groups (p<0.0001); c: SFM vs AMH 100 ng/ml, p<0.05; d: significantly different from b groups (p<0.001); e: AMH 50 ng/ml vs AMH 50 ng/ml + AMHR2 NA, p<0.05; f: significantly different from every other group (p<0.0001). (e) Representative photomicrographs showing Hoechst nuclear staining of the migrated GN11 cells after the different treatments, scale bar = 100 µm. (f) Real-time PCR analysis for Amhr2, Acvr1, Bmpr1a and Bmpr1b mRNA expression in untrasfected GN11 cells (Control) or in GN11 cells transfected with siRNAs targeting Amh receptors or with a non-targeting siRNA (siRNA-NT) (n = 3). Bar graph illustrates the mean ± s.e.m; one-way ANOVA followed by Tukey’s post hoc comparison test (Amhr2 F 2,6 = 7.861, Control vs siRNA p = 0.0339, Control vs siRNA-NT p = 0.9958, siRNA vs siRNA-NT p = 0.0305; Acvr1 F 2,6 = 22.73, Control vs siRNA p = 0.0015, Control vs siRNA-NT p = 0.2016, siRNA vs siRNA-NT p = 0.0088; Bmpr1a F 2,6 = 16.16, Control vs siRNA p = 0.0038, Control vs siRNA-NT p = 0.4206, siRNA vs siRNA-NT p = 0.0149; Bmpr1b F 2,6 P = 7.777, Control vs siRNA p = 0.0478, Control vs siRNA-NT p = 0.8489, siRNA vs siRNA-NT p = 0.0247). (g) Transwell assay was performed on GN11 cells transfected or not with indicated siRNAs and stimulated with or without AMH (50 ng/ml). Bar graph illustrates the mean number of migrated GN11 cells (Control, SFM n = 13, Control +AMH 50 ng/ml n = 10, Amhr2 siRNA +AMH 50 ng/ml n = 7, Acvr1 siRNA +AMH 50 ng/ml n = 4, Bmpr1a siRNA +AMH 50 ng/ml n = 4, Bmpr1b siRNA +AMH 50 ng/ml n = 6, siRNA-NT +AMH 50 ng/ml n = 11). Comparisons between treatment groups were performed using a one-way ANOVA followed by Tukey’s post hoc comparison test (F 6,48 = 20.99, a not significantly different from other groups denoted a, p>0.05; b significantly different from groups denoted a, p<0.0001; c significantly different from groups denoted a), p<0.05. Throughout the figure, data were combined from three independent experiments and displayed as mean ± s.e.m. *p<0.05; **p<0.005; ***p<0.0005; ****p<0.0001.
-
Figure 5—source data 1
This spreadsheet contains the values used to generate the bar plots shown in Figure 5a, b, c, d, f and g.
- https://doi.org/10.7554/eLife.47198.013
Figure 6
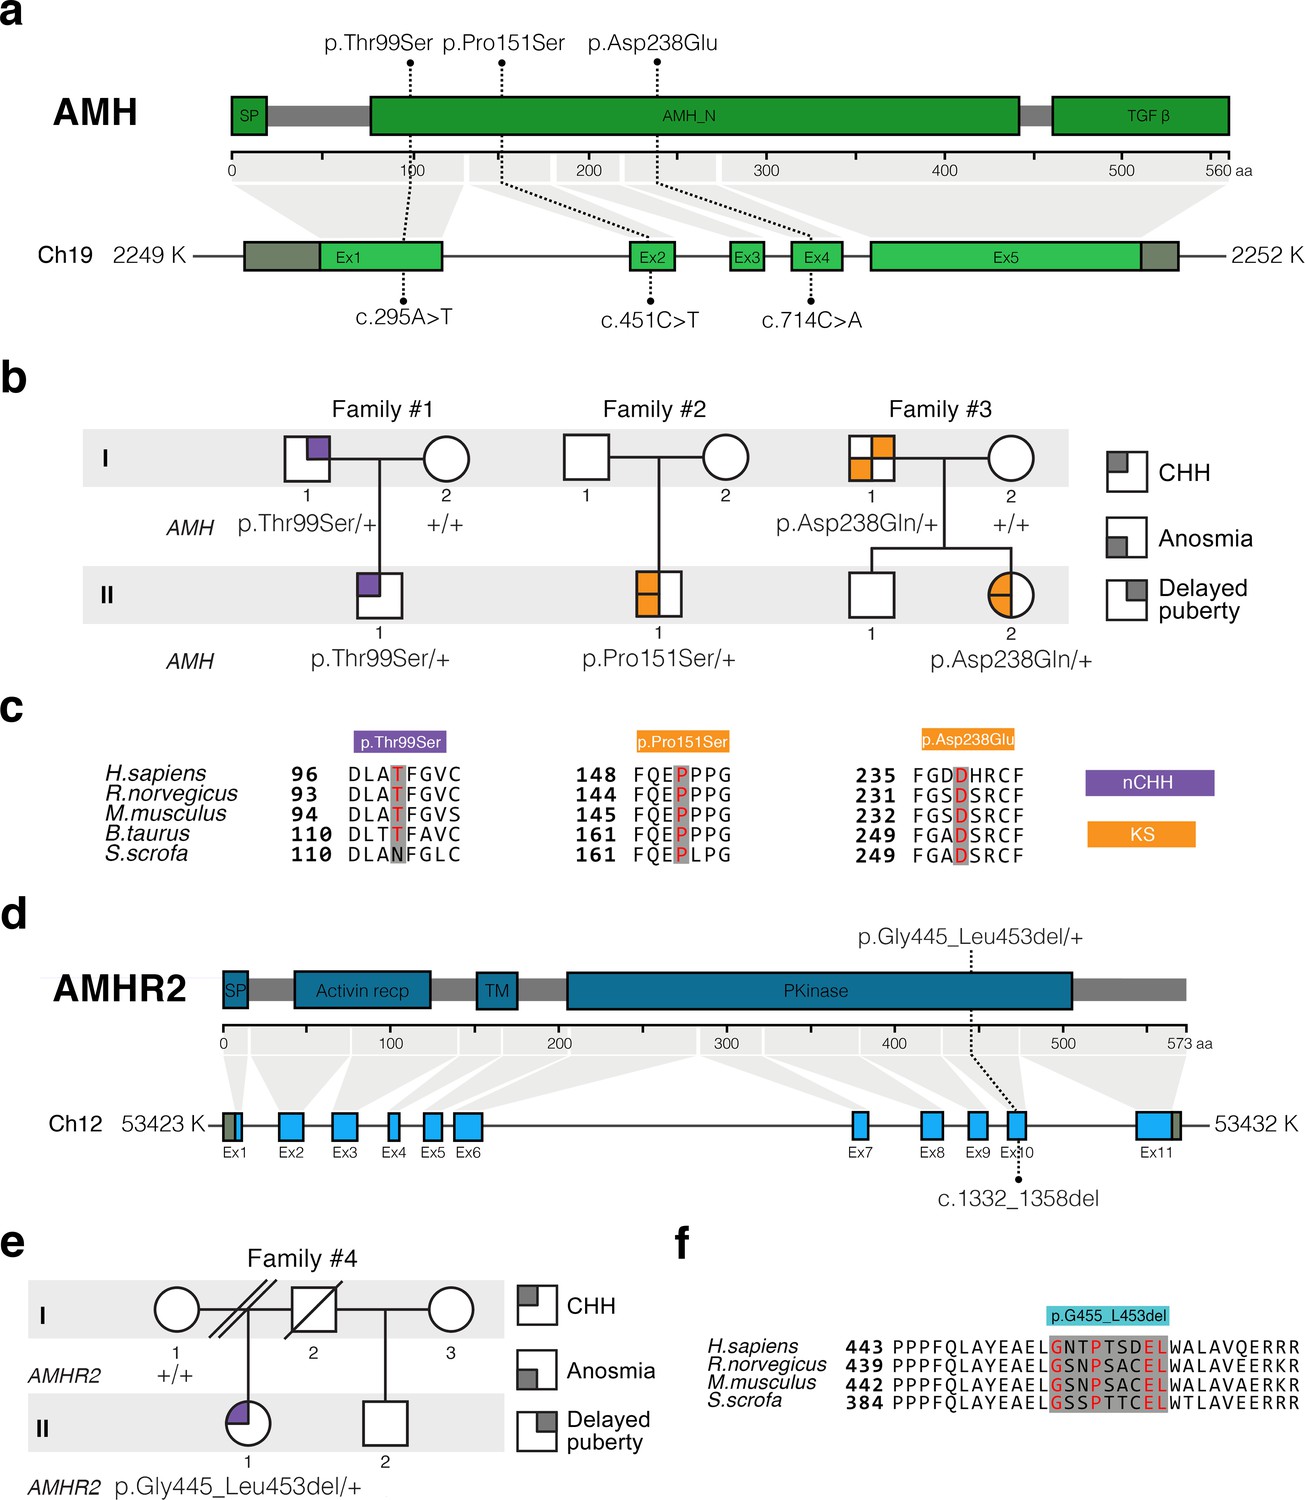
AMH and AMHR2 heterozygous mutations in CHH probands.
(a) Schematic illustration of AMH mutations in nCHH and KS probands. (b) Pedigrees of patients harboring AMH mutations. Circles denote females, squares denote males. The phenotype interpretation is explained in the square legend on the top of the figure. (c) The AMH mutations affect evolutionarily conserved amino acid residues. Alignment of partial protein sequences of AMH orthologs showing in red text the amino acid residues evolutionarily conserved. Purple highlights correspond to variants identified in nCHH probands and orange highlights correspond to variants identified in the KS cohort. (d) Schematic of the AMHR2 signal peptide (SP), activin receptor, transmembrane and kinase functional domains along with the p.Gly445_Leu453del variant identified in the cohort. This deletion lies within the catalytic intracellular serine/threonine kinase domain (PKinase) of the receptor. (e) Pedigree of the patient harboring the deletion in AMHR2. Circles denote females, squares denote males, double diagonal lines indicate divorce, single diagonal line indicates death. The phenotype interpretation is explained in the square legend on the top of the figure. (f) Alignment of partial protein sequences of mammalian AMHR2 orthologs flanking the deletion site.
Figure 7 with 2 supplements
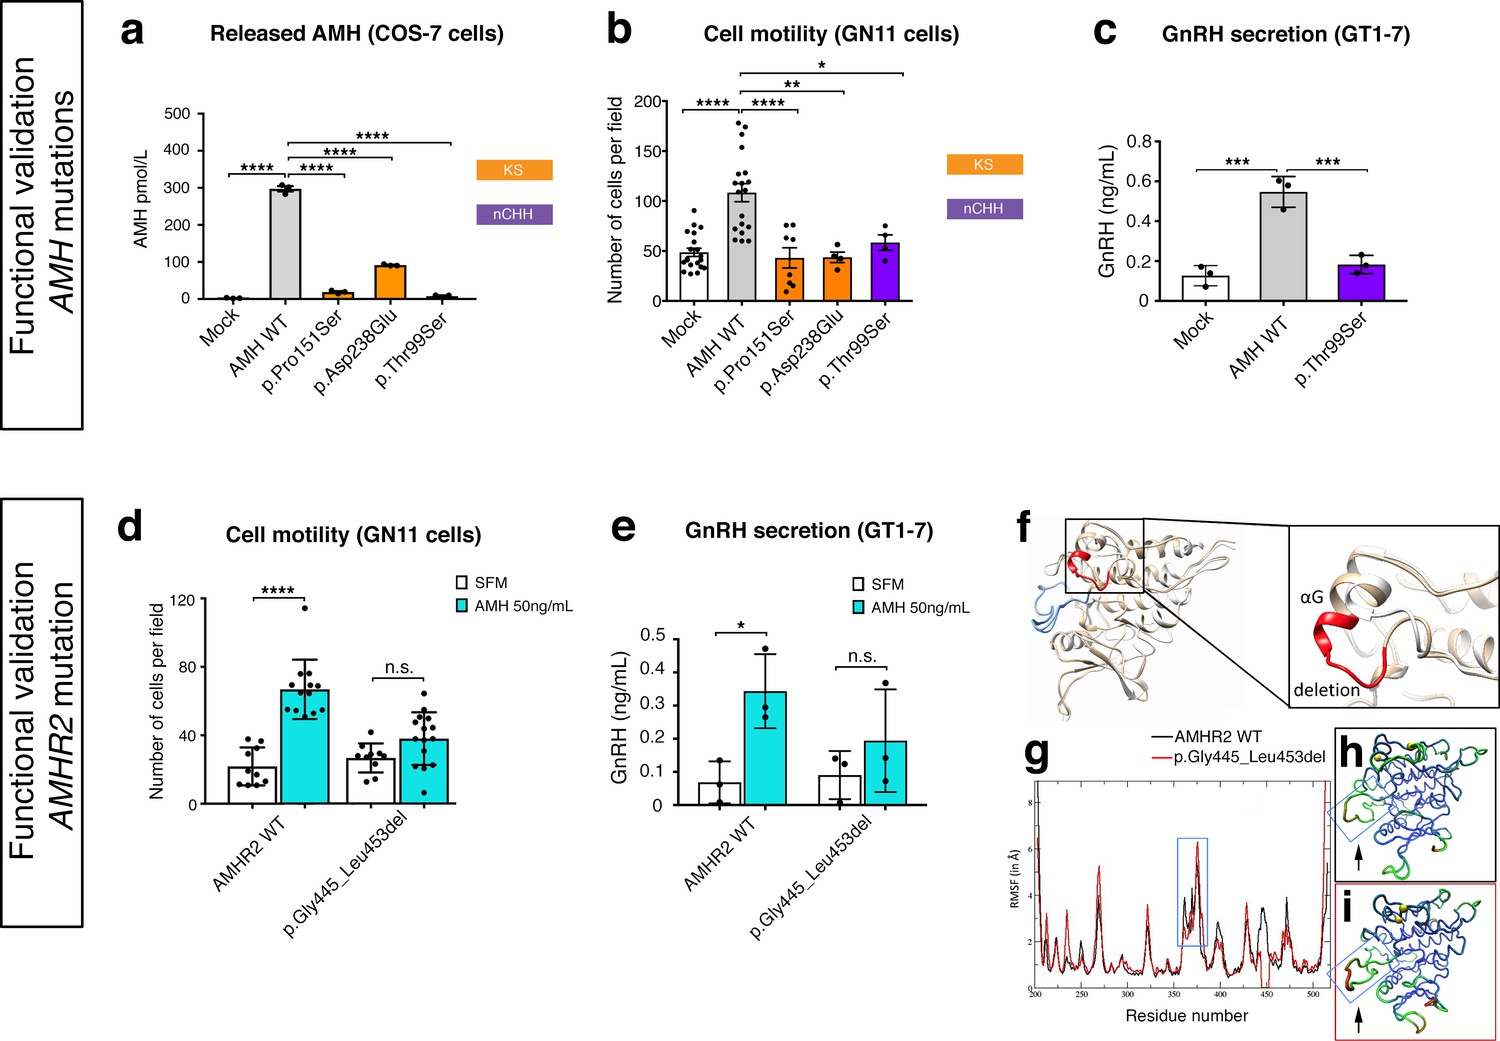
Functional validation of AMH variants.
(a) AMH released in the medium of COS-7 cells transiently transfected either with lipofectamine alone (mock), or with a WT AMH or a variant AMH identified in CHH and KS probands. Bar graph illustrates the mean amount of AMH secreted in the conditioned medium of transfected COS-7 cells (n = 3 independent experiments per condition). Comparisons between treatment groups were performed using a one-way ANOVA followed by Tukey’s post hoc comparison test (F4,10 = 1193, Mock vs AMH WT p<0.0001, AMH WT vs p.Pro151Ser p<0.0001, AMH WT vs p.Asp238Glu p<0.0001, AMH WT vs p.Thr99Ser p<0.0001). No significant motility difference was detected between Mock, p.Thr99Ser and p.Pro151Ser mutated forms of AMH treatment, p>0.9 for all. (b) Transwell assay was performed on GN11 cells transiently transfected either with lipofectamine alone (mock), or with a WT AMH or a variant AMH identified in CHH and KS probands. Comparisons between treatment groups were performed using a one-way ANOVA followed by Tukey’s post hoc comparison test (F4,50 = 13.94, Mock vs AMH WT p<0.0001, AMH WT vs p.Pro151Ser p<0.0001, AMH WT vs p.Asp238Glu p<0.0014, AMH WT vs p.Thr99Ser p = 0.0218. No significant motility difference was detected between Mock and mutated forms of AMH treatment, p>0.9 for all. (c) Quantification of GnRH secretion from GT1-7 cells transfected with lipofectamine alone (mock), or with a WT AMH or the p.Pro151Ser AMH variant identified in a nCHH proband. GnRH mean concentration measured in the medium (n = 3, one-way ANOVA: F 2,6 = 43.84, p = 0.0003; followed by Tukey’s multiple comparison post hoc test, mock vs. AMH WT p = 0.0003, mock vs p.Thr99Ser p = 0.5220, AMH WT vs p.Thr99Ser p = 0.0007. (d) Transwell assay was performed on GN11 cells transiently transfected with the AMHR2 plasmid or with the AMHR2 variant and stimulated with either serum-free medium (SFM) or with recombinant AMH (50 ng/ml). Bar graph illustrates the mean number of migrated GN11 cells under different treatment conditions (SFM n = 10 for both WT and mutant AMHR2, AMH 50 ng/ml n = 12 for both WT and mutant AMHR2). Comparisons between treatment groups were performed using two-way ANOVA (F1,43 = 16.5 P = 0.0002; followed by Sidak’s multiple comparison post hoc test, AMHR2 WT SFM vs AMHR2 WT + AMH 50 ng/ml p<0.0001, p.Gly445_Leu453del SFM vs p.Gly445_Leu453del + AMH 50 ng/ml P = 0.1036). (e) Quantification of GnRH secretion from GT1-7 cells transfected with the same plasmids as in d (n = 3 independent experiments per condition). Experiments were replicated three times with comparable results. Two-way ANOVA, F1,8 = 1.927, p<0.02025; followed by Holm-Šídák multiple comparison post hoc test, AMHR2 WT SFM vs AMHR2 WT + AMH 50 ng/ml P = 0.0269, p.Gly445_Leu453del SFM vs p.Gly445_Leu453del + AMH 50 ng/ml P = 0.4652. (f) Initial three-dimensional models of WT and p.Gly445_Leu453del catalytic intracellular serine/threonine domains of AMHR2. The backbone of the WT and deleted proteins are shown in tan or white cartoon representations, respectively, with the deleted 445–453 residues colored in red. The activation loop is depicted in blue. (g–i) Root-mean-square fluctuations (RMSF) of the Cα atoms along the simulations for the AMHR2 WT and the p.Gly445_Leu453del models. (g) RMSF (in Å) for the WT (black line) and the p.Gly445_Leu453del models (red line, being the average over the three 100 ns simulations) are given for each residue of the protein. For a better comparison, residue numbers were kept the same for both models. Molecular representation of the WT (h) and p.Gly445_Leu453del (i) models colored by RMSF: the blue-green-red scale corresponds to low-medium-high RMSF values. The yellow spheres indicate the first residues after the p.Gly445_Leu453del deletion. The activation loop region is highlighted inside a blue frame (arrows).
-
Figure 7—source data 1
This spreadsheet contains the values used to generate the bar plots shown in Figure 7a–e.
- https://doi.org/10.7554/eLife.47198.019
Figure 7—figure supplement 1
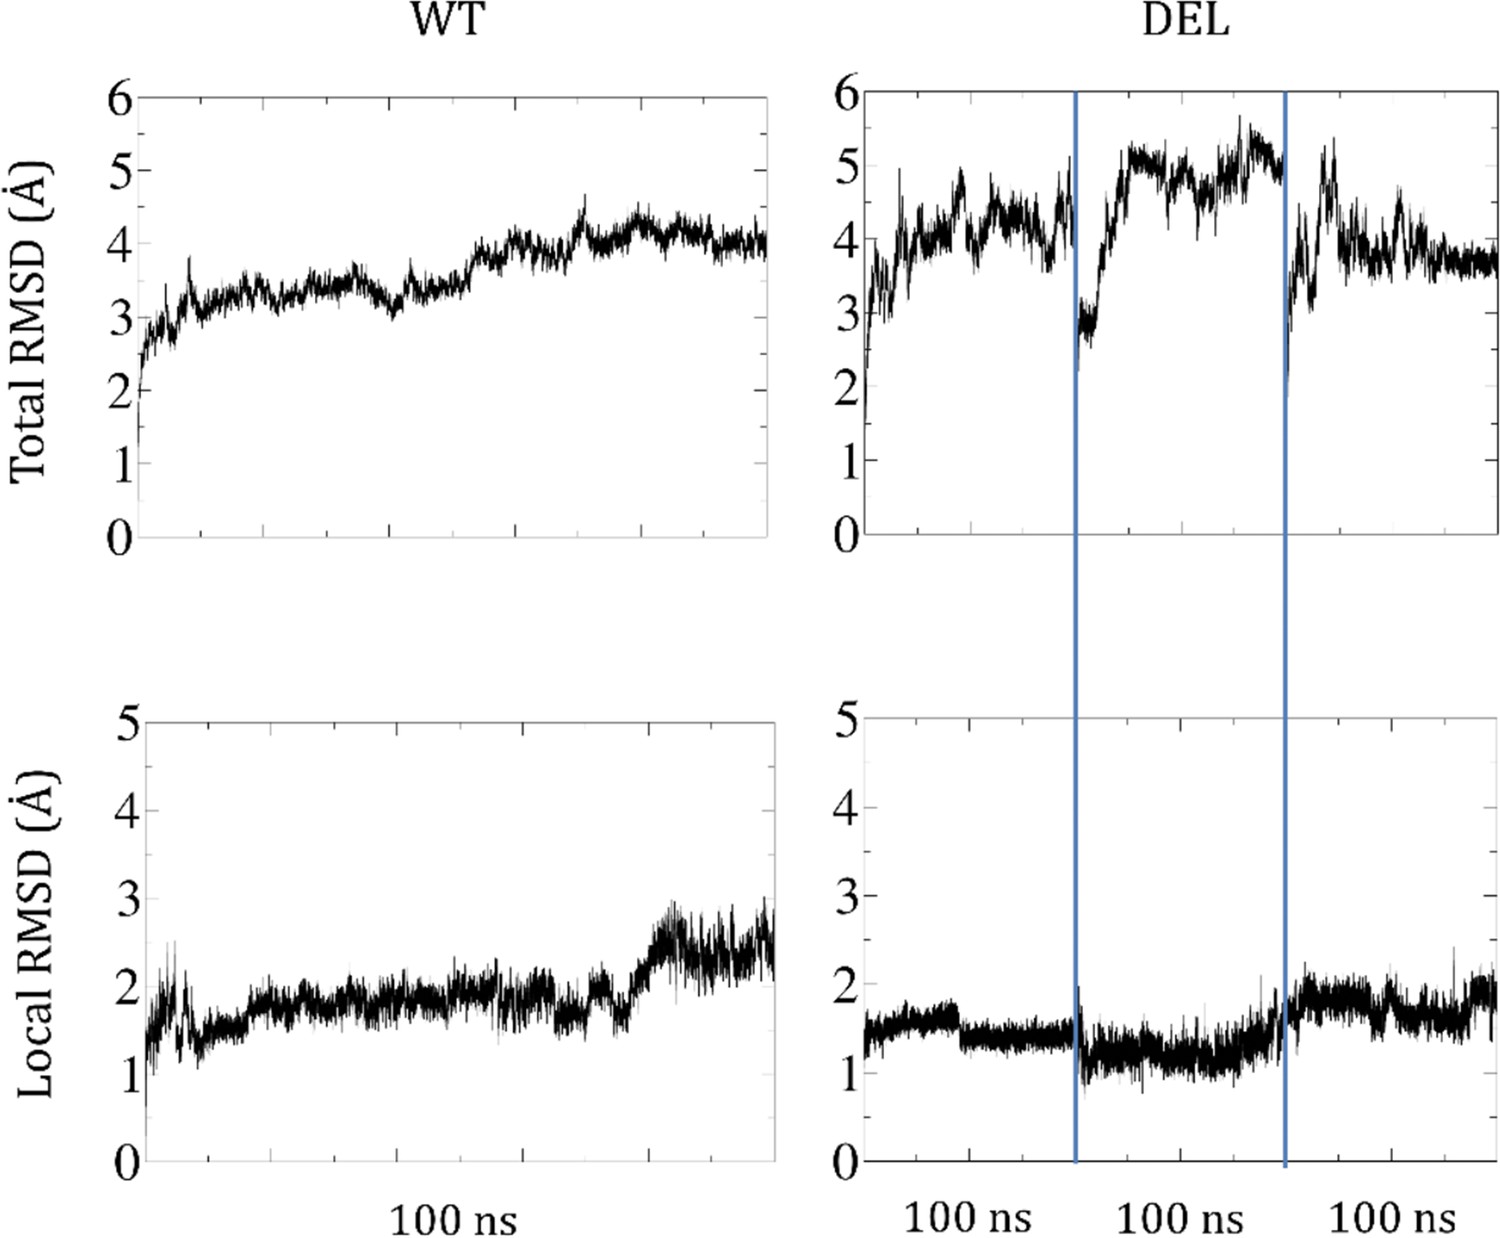
Root-mean-square deviations (RMSD) of the AMHR2 protein backbone along the simulations.
On top, the RMSD for the whole protein. At the bottom, the RMSD for the residues comprising the deletion and surroundings. Both the WT (left panels) and the three DEL simulations (right panels) reach stable values of the RMSD (in Å).
Figure 7—figure supplement 2
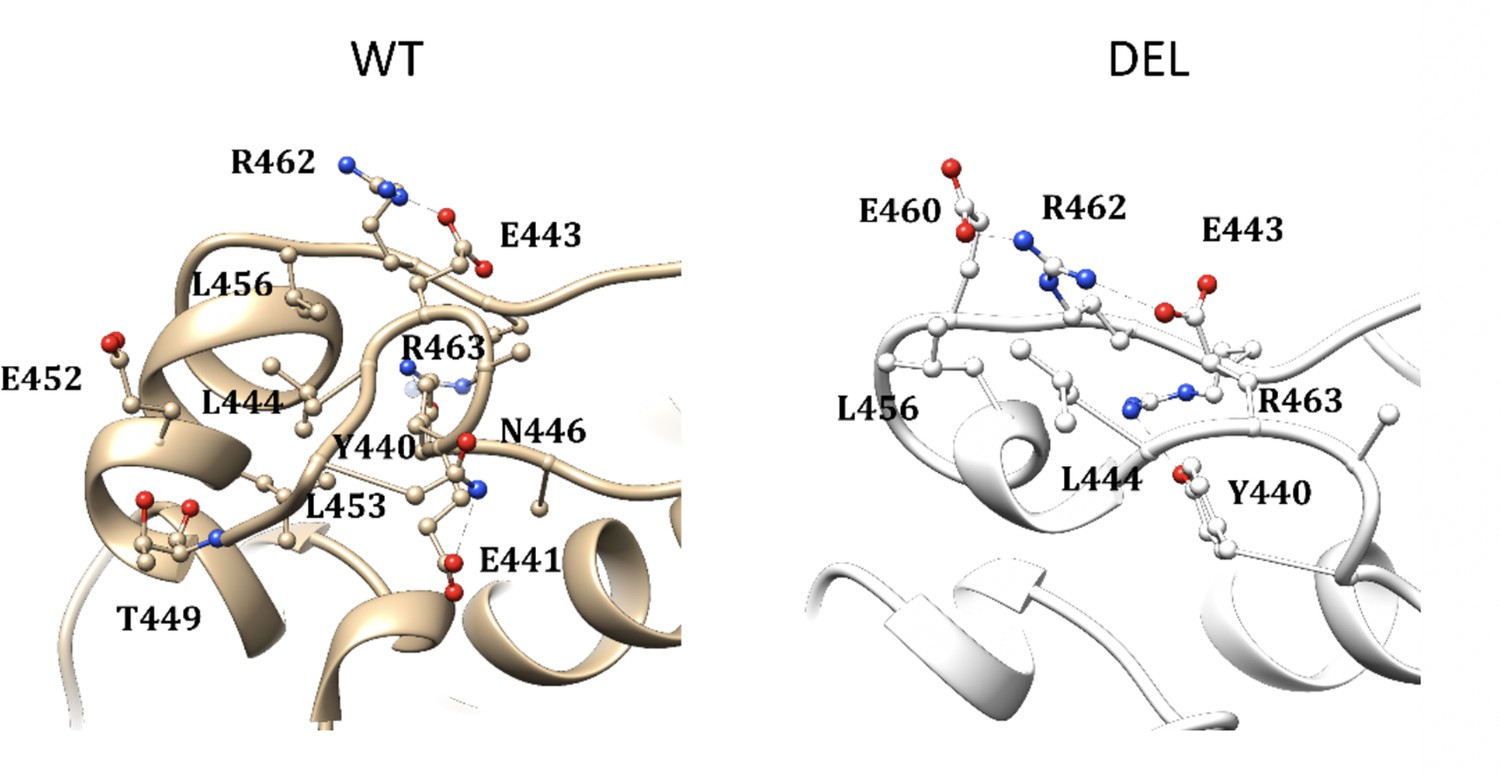
Molecular representation of main interactions stabilizing the zone around the AMHR2 deletion.
For better comparison, the residue numbering is kept the same in both models.
Tables
Table 1
Summary of heterozygous AMH or AMHR2 mutations identified in patients with congenital hypogonadotropic hypogonadism.
cDNA and protein changes are based on reference cDNA sequence NM_000479.4 (AMH) and NM_020547.3 (AMHR2). Functional validation of the mutants has been performed in vitro evaluating AMH secretion in COS-7 cells, cell motility in GN11 cells, and measuring GnRH secretion in GT1-7 cells for nCHH-associated mutants. CHH, congenital hypogonadotropic hypogonadism; nCHH, normosmic CHH; KS, Kallmann syndrome; Sex: F: female; M: male; Inheritance: F: familial, S: sporadic; Puberty: A: absent puberty, P: partial puberty. MAF, minor allele frequency; ↓, decreased; NS, not significant; NA, not applicable.
| Gene | Family | Subject | Diagnosis | Sex | Inheritance | Puberty | Associated phenotypes | dbSNP number | Nucleotide change | Amino acid change | MAF (%) gnomAD MaxPop | In vitro studies | ||
|---|---|---|---|---|---|---|---|---|---|---|---|---|---|---|
| Released AMH (COS-7 cells) | Cell motility (GN11 cells) | GnRH secretion (GT1-7 cells) | ||||||||||||
| AMH | 1 | II-1 | nCHH | M | F | P | High-arched palate Deviated nasal septumHyperlaxity | rs200226465 | c.295A > T | p.Thr99Ser | 0.044 | ↓↓ | ↓↓ | ↓↓ |
| 2 | II-1 | KS | M | S | A | Cryptochidism | rs370532523 | c.451C > T | p.Pro151Ser | 0.011 | ↓↓ | ↓↓ | ||
| 3 | II-2 | KS | F | F | P | Osteoporosis Scoliosis | rs752574731 | c.714C > A | p.Asp238Glu | 0.006 | ↓↓ | ↓↓ | ||
| AMHR2 | 4 | II-1 | nCHH | F | S | A | Osteoporosis | rs764761319 | c.1330_1356del | p.Gly445_Leu453del | 0.093 | ↓↓ | ↓↓ | |
Key resources table
| Reagent type (species) or resource | Designation | Source or reference | Identifiers | Additional information |
|---|---|---|---|---|
| Strain, strain background (Mus musculus) | C57BL/6J | Charles River | ||
| Strain, strain background (M. musculus) | Amhr2-Cre Knock-in | Jamin et al., 2002 | DOI: 10.1038/ng1003 | |
| Strain, strain background (M. musculus) | Gnrh1 < GFP> | Spergel et al., 1999 | DOI:10.1523/JNEUROSCI.19-06-02037.1999 | |
| Recombinant DNA reagent | AMH-His | GeneCust | Seq ref: NM_000479.3 | |
| Recombinant DNA reagent | AMHR2-His | GeneCust | Seq Ref: NM_000479.3 | |
| Recombinant DNA reagent | AMH-p.Thr99Ser-His | This Paper | ||
| Recombinant DNA reagent | AMH-p.Pro151Ser-His | This Paper | ||
| Recombinant DNA reagent | AMH-p.Asp238Glu-His | This Paper | ||
| Recombinant DNA reagent | AMHR2-p.Gly445_Leu453del-His | This Paper | ||
| Cell line | GN11 | Radovick et al., 1991 | Lab Stock | https://doi.org/10.1073/pnas.88.8.3402 GN11 cells were isolated from a male mouse |
| Cell line | GT1-7 | Mellon et al., 1990 | Lab Stock; RRID:CVCL_0281 | https://doi.org/10.1016/0896-6273(90)90028-E GT1-7 cells were isolated from a mouse, unknown sex |
| Cell line | COS-7 | Lab Stock; RRID:CVCL_0224 | COS-7 cells were isolated from a monkey | |
| Transfected construct | Amhr2 SMARTpool siRNA | Dharmacon | #M-053605-00-0005 | |
| Transfected construct | Acvr1 SMARTpool siRNA | Dharmacon | #M-042047-01-0005 | |
| Transfected construct | Bmpr1a SMARTpool siRNA | Dharmacon | # M-040598-01-0005 | |
| Transfected construct | Bmpr1b SMARTpool siRNA | Dharmacon | # M-051071-00-0005 | |
| Transfected construct | Non-targeting siRNA control pool | Dharmacon | # D-001206-13-05 | |
| Antibody | Phospho-ERK1/2 (Thr202/Tyr204) (rabbit) | Cell Signaling | #9101L; RRID:AB_331646 | 1:1000 |
| Antibody | ERK1/2 (Thr202/Tyr204) (rabbit) | Cell Signaling | #9102L; RRID:AB_330744 | 1:1000 |
| Antibody | AMH (mouse) | Abcam | #Ab24542 ; RRID:AB_2801539 | 1:500 |
| Antibody | AMH (rabbit) | Abcam | #Ab103233; RRID:AB_10711946 | 1:500 |
| Antibody | AMHR2 (rabbit) | CASLO | Custom made #56G | 1:2000 |
| Antibody | GnRH (guinea pig) | Dr. Erik Hrabovszky, Institute of Experimental Medicine of the Hungarian Academy of Sciences, Budapest, Hungary | Lab Stock | 1:3000; https://doi.org/10.3389/fendo.2011.00080 |
| Antibody | Peripherin (Contactin1) (rabbit) | Millipore | #AB1530; RRID:AB_90725 | 1:1000 |
| Antibody | β-III tubulin (TUJ-1) (mouse) | Sigma Aldrich | #T8660; RRID:AB_477590 | 1:800 |
| Antibody | AMHR2 Neutralizing Antibody | R&D systems | #AF1618 ; RRID: AB_2226485 | 1:200 |
| Antibody | TAG-1 (goat) | R&D systems | AF2215 | |
| Antibody | Actin (mouse) | Sigma Aldrich | #A5316; RRID:AB_476743 | 1:1000 |
| Antibody | Donkey anti-rabbit IgG AlexaFluor 488 (H + L) | Molecular Probes | #A-21026; RRID:AB_141708 | 1:500 |
| Antibody | Donkey anti-rabbit IgG AlexaFluor 555 (H + L) | Molecular Probes | #A-31572; RRID:AB_162543 | 1:500 |
| Antibody | Donkey anti-mouse IgG AlexaFluor 488 (H + L) | Molecular Probes | #A-21202; RRID:AB_141607 | 1:500 |
| Antibody | Donkey anti-mouse IgG AlexaFluor 555 (H + L) | Molecular Probes | #A-31570; RRID:AB_2536180 | 1:500 |
| Antibody | Donkey anti-goat IgG AlexaFluor 488 (H + L) | Molecular Probes | #A-11055; RRID:AB_142672 | 1:500 |
| Antibody | Donkey anti-goat IgG AlexaFluor 555 (H + L) | Molecular Probes | #A-21432; RRID:AB_141788 | 1:500 |
| Antibody | Donkey anti-goat IgG AlexaFluor 647 (H + L) | Molecular Probes | #A-21447; RRID:AB_141844 | 1:500 |
| Antibody | Donkey anti-guinea pig IgG AlexaFluor 488 (H + L) | Jackson ImmunoResearch | #706-545-148; RRID:AB_2340472 | 1:500 |
| Antibody | Horse anti-mouse IgG peroxidase labelled | Vector | #PI-2000; RRID:AB_2336177 | 1:5000 |
| Sequence-based reagent | Amh Taqman gene expression assay | Thermofisher Scientific | Mm00431795_g1 | |
| Sequence-based reagent | GnRH Taqman gene expression assay | Thermofisher Scientific | Mm01315605 | |
| Sequence-based reagent | Amhr2 Taqman gene expression assay | Thermofisher Scientific | Mm00513847_m1 | |
| Sequence-based reagent | Acvr1 Taqman gene expression assay | Thermofisher Scientific | Mm01331069_m1 | |
| Sequence-based reagent | Bmpr1a Taqman gene expression assay | Thermofisher Scientific | Mm00477650_m1 | |
| Sequence-based reagent | Bmpr1b Taqman gene expression assay | Thermofisher Scientific | Mm03023971_m1 | |
| Sequence-based reagent | Rn18s Taqman gene expression assay | Thermofisher Scientific | Hs99999901-s1 | |
| Sequence-based reagent | Actb Taqman gene expression assay | Thermofisher Scientific | Mm00607939 | |
| Peptide, recombinant protein | Recombinant Human AMH-C Fragment (goat) | R&D systems | #1737 MS; RRID:AB_2273957 | |
| Commercial assay or kit | Papain Dissociation System | Worthington | #LK003150 | |
| Commercial assay or kit | Lipofectamine 2000 | ThermoFisher Scientific | #11668019 | |
| Commercial assay or kit | AMH Access Dxi chemiluminescent immunoassay | Beckman Coulter | #B13127 | |
| Commercial assay or kit | GnRH EIA kit | Phoenix Pharmaceuticals Inc | #EK-040-02CE | |
| Commercial assay or kit | Annexin V Apoptosis Detection Kit | Thermofisher Scientific | #88-8007-74 | |
| Commercial assay or kit | SureSelect All Exon capture V2 | Agilent Technologies | #5190–9493 | |
| Commercial assay or kit | Gentra Puregene Blood Kit | Qiagen | #158389 | |
| Chemical compound, drug | Flurogold Tracer | Sigma Aldrich | #39286 | 1:1500 |
| Chemical compound, drug | MAPK Kinase inhibitor | Calbiochem | #U0126 | 10 μM |
| Software, algorithm | FACSDiva | BD Biosciences | 8.1 | http://www.bdbiosciences.com/sg/instruments/software/downloads/ |
| Software, algorithm | SDS | Applied Biosystems | 2.4.1 | https://www.thermofisher.com/fr/fr/home/technical-resources/software-downloads/applied-biosystems-7900ht-fast-real-timespcr-system.html |
| Software, algorithm | Data Assist | Applied Biosystems | 3.0.1 | https://www.thermofisher.com/fr/fr/home/technical-resources/software-downloads/dataassist-software.html |
| Software, algorithm | ImageJ | NIH | 3.0.1 | https://imagej.net/Welcome |
| Software, algorithm | IMARIS | Bitplane | 9.1 | https://imaris.oxinst.com/ |
| Software, algorithm | Photoshop | Adobe | 4.0 | https://www.adobe.com/la/products/photoshop.html |
| Software, algorithm | Illustrator | Adobe | 4.0 | https://www.adobe.com/products/illustrator.html |
| Software, algorithm | Prism 6 | Graphpad Software | 6.0 | https://www.graphpad.com/scientific-software/prism/ |
| Software, algorithm | Inspector Pro | La Vision Biotec | 4.0 | |
| Software, algorithm | Burrows-Wheeler Alignment Algorithm | http://bio-bwa.sourceforge.net/ | ||
| Software, algorithm | SnpEff | Switch Laboratoty | 4.0 | http://snpeff.sourceforge.net/ |
| Software, algorithm | dbNSFP | Liu et al., 2011 | 2.9 | http://varianttools.sourceforge.net/Annotation/dbNSFP |
| Software, algorithm | Modeller | Webb and Sali, 2016 | 9.2 | https://salilab.org/modeller/ |
Additional files
-
Supplementary file 1
List of primers used for genotyping and for mutagenesis experiments.
- https://doi.org/10.7554/eLife.47198.020
-
Transparent reporting form
- https://doi.org/10.7554/eLife.47198.021
Download links
A two-part list of links to download the article, or parts of the article, in various formats.
Downloads (link to download the article as PDF)
Open citations (links to open the citations from this article in various online reference manager services)
Cite this article (links to download the citations from this article in formats compatible with various reference manager tools)
Defective AMH signaling disrupts GnRH neuron development and function and contributes to hypogonadotropic hypogonadism
eLife 8:e47198.
https://doi.org/10.7554/eLife.47198


