Molecular basis for dyneinopathies reveals insight into dynein regulation and dysfunction
- Colorado State University, United States
- University of Colorado School of Medicine, United States
Figures
Figure 1
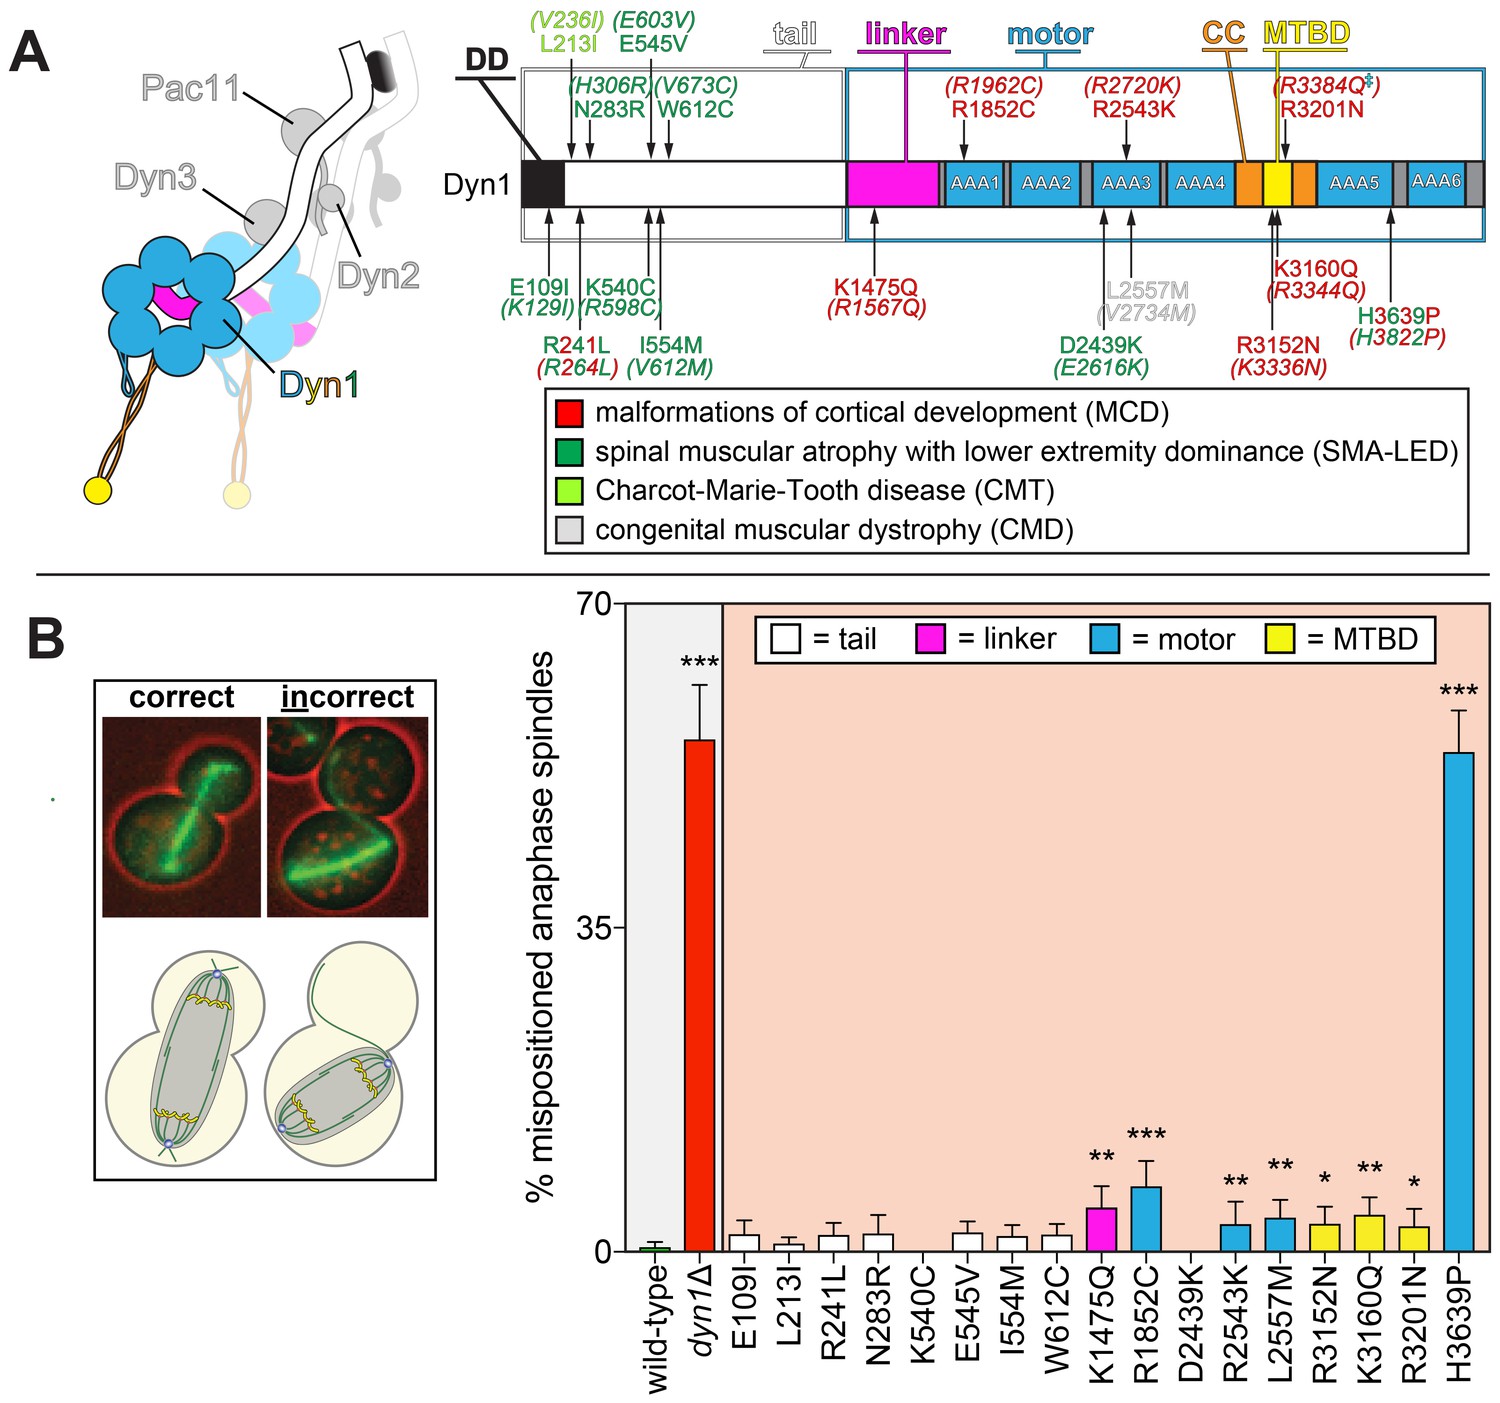
Spindle positioning assay provides coarse assessment of mutant dynein dysfunction.
(A) Color-coded cartoon representation of the full-length dynein complex (left; with associated accessory chains; Dyn2, dynein light chain; Dyn3, dynein light-intermediate chain; Pac11, dynein intermediate chain; Dyn1, dynein heavy chain), and a linear schematic of Dyn1 with indicated disease-correlated mutations (right; DD, dimerization domain; CC, coiled-coil; MTBD, microtubule-binding domain). The equivalent human residues and disease-correlated substitutions are indicated in parentheses for each residue. ‡Note that we mistakenly substituted an asparagine for residue R3201 instead of a glutamine, the latter of which was identified as correlating with MCD (Poirier et al., 2013). R3201N was used throughout this study. (B) Representative fluorescence image (left; green, GFP-Tub1; red, contrast enhanced brightfield image to illustrate cell cortex) and quantitation of spindle positioning phenotypes in the 17 disease-correlated Dyn1 mutants, along with wild-type and dynein knock-out (dyn1∆) cells. Each data point represents the fraction of mispositioned anaphase spindles along with standard error (weighted mean ± weighted standard error of proportion; n ≥ 99 anaphase spindles from three independent experiments for each strain). Statistical significance was determined by calculating Z scores, as described in the Materials and methods (*, p≤0.1; **, p≤0.05; ***, p≤0.001). Also see Figure 1—source data 1.
-
Figure 1—source data 1
Spreadsheet with spindle positioning assay values.
- https://doi.org/10.7554/eLife.47246.004
Figure 2 with 4 supplements

Quantitative assessment of dynein-dynactin-mediated spindle dynamics reveals refined insight into mutant dysfunction.
(A) Cartoon and representative time-lapse inverse fluorescence images of a hydroxyurea (HU)-arrested kar9∆ cell exhibiting typical dynein-mediated spindle movements, analysis of which is presented in panels (B – F). Maximum intensity (X-Y projection; top) and Y-Z projections (bottom) are shown for each time point (NT, neck transit; note, line spans time frames over which the NT occurs). (B – F) Plots of indicated parameters for spindle dynamics in haploid wild-type and mutant strains. Briefly, the mitotic spindles were tracked in 3-dimensions using a custom written Matlab code. Dynein-mediated spindle movements were manually selected from the tracking data, from which velocity (B), displacement (C, per event; or, E, per minute), and the number of dynein-mediated spindle movements per minute (F) were obtained. The fraction of successful neck transits (successful attempts divided by total attempts) were manually scored (i.o., insufficient observations; for H3639P, only one unsuccessful neck transit attempt was observed). Each bar represents the weighted mean ± weighted standard error (or standard error of proportion for D; n = 42 to 60 HU-arrested cells from three independent experiments were analyzed for each strain; diamonds represent mean values obtained from each independent replicate experiment). Statistical significance was determined using an unpaired Welch’s t test (B and E), a Mann-Whitney test (C), or by calculating Z scores (D and F; *, p≤0.1; **, p≤0.05; ***, p≤0.005). Also see Figure 2—figure supplements 1, 2, 3 and 4, and Figure 2—source data 1.
-
Figure 2—source data 1
Spreadsheet with spindle dynamics assay values for haploid cells.
- https://doi.org/10.7554/eLife.47246.010
Figure 2—figure supplement 1

H3639P mutant exhibits synthetic genetic interactions with KAR9.
Cells expressing dyn1H3639P exhibit synthetic growth defects with kar9∆ that are as severe as dyn1∆ kar9∆. Tetrads were dissected on YPAD media, and subsequently genotyped by growth on selective media. One representative tetrad each from a mating of a kar9∆ strain with either dyn1H3639P or dyn1∆ is shown. Double mutants are indicated with red boxes. Note that none of the other dynein mutants exhibited apparent synthetic growth defects with kar9∆ (not shown).
Figure 2—figure supplement 2
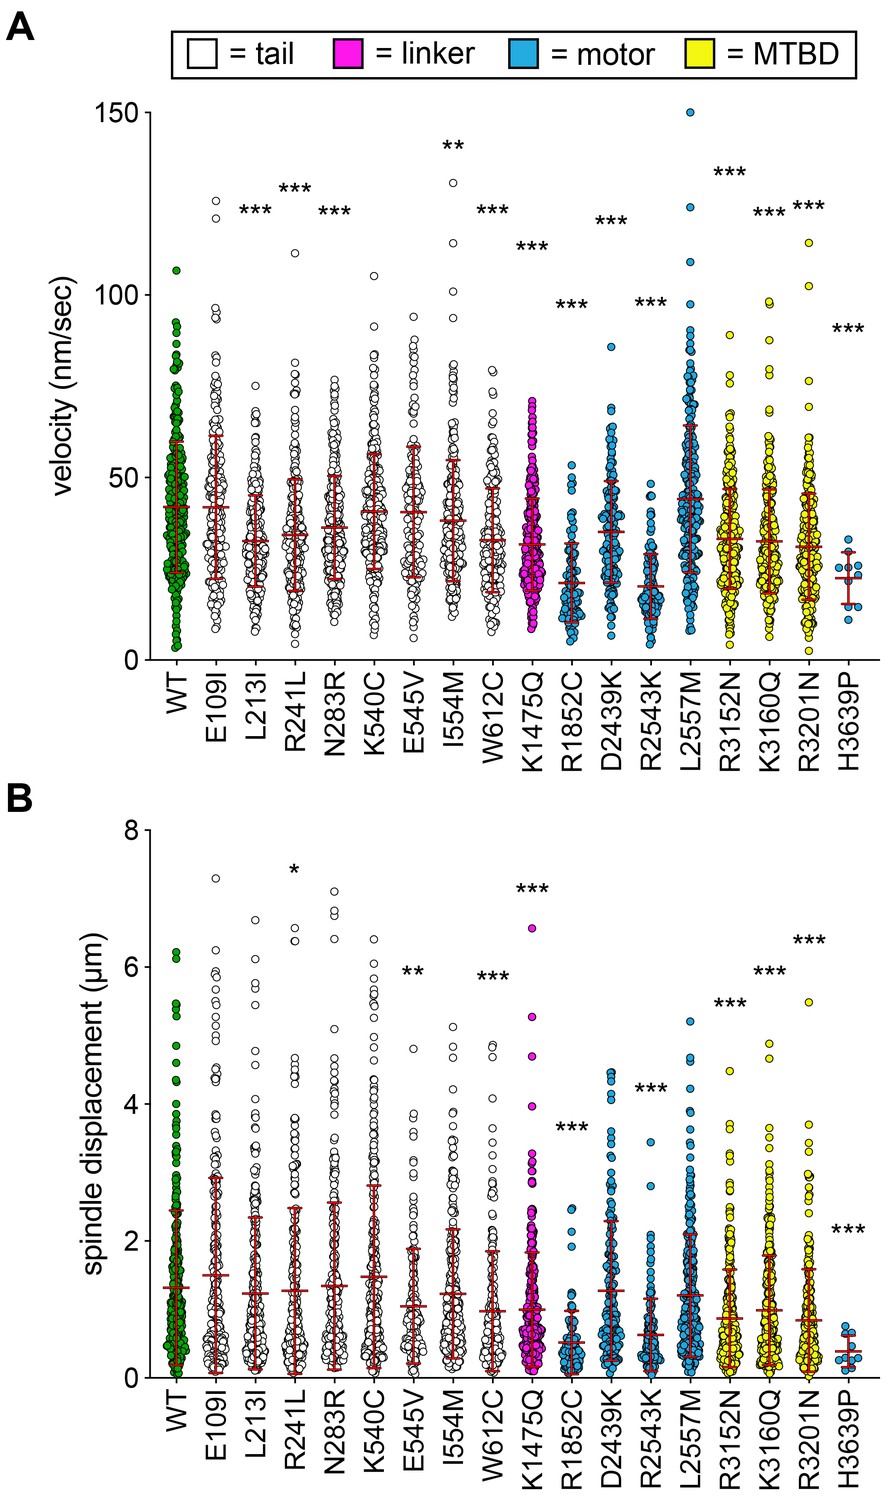
Additional plots of spindle dynamics data from haploid cells.
(A and B) Scatter plots depicting (A) velocity per spindle displacement event, and (B) displacement per spindle displacement event (from Figure 2). Mean values and standard deviations are also depicted with red lines.
Figure 2—figure supplement 3
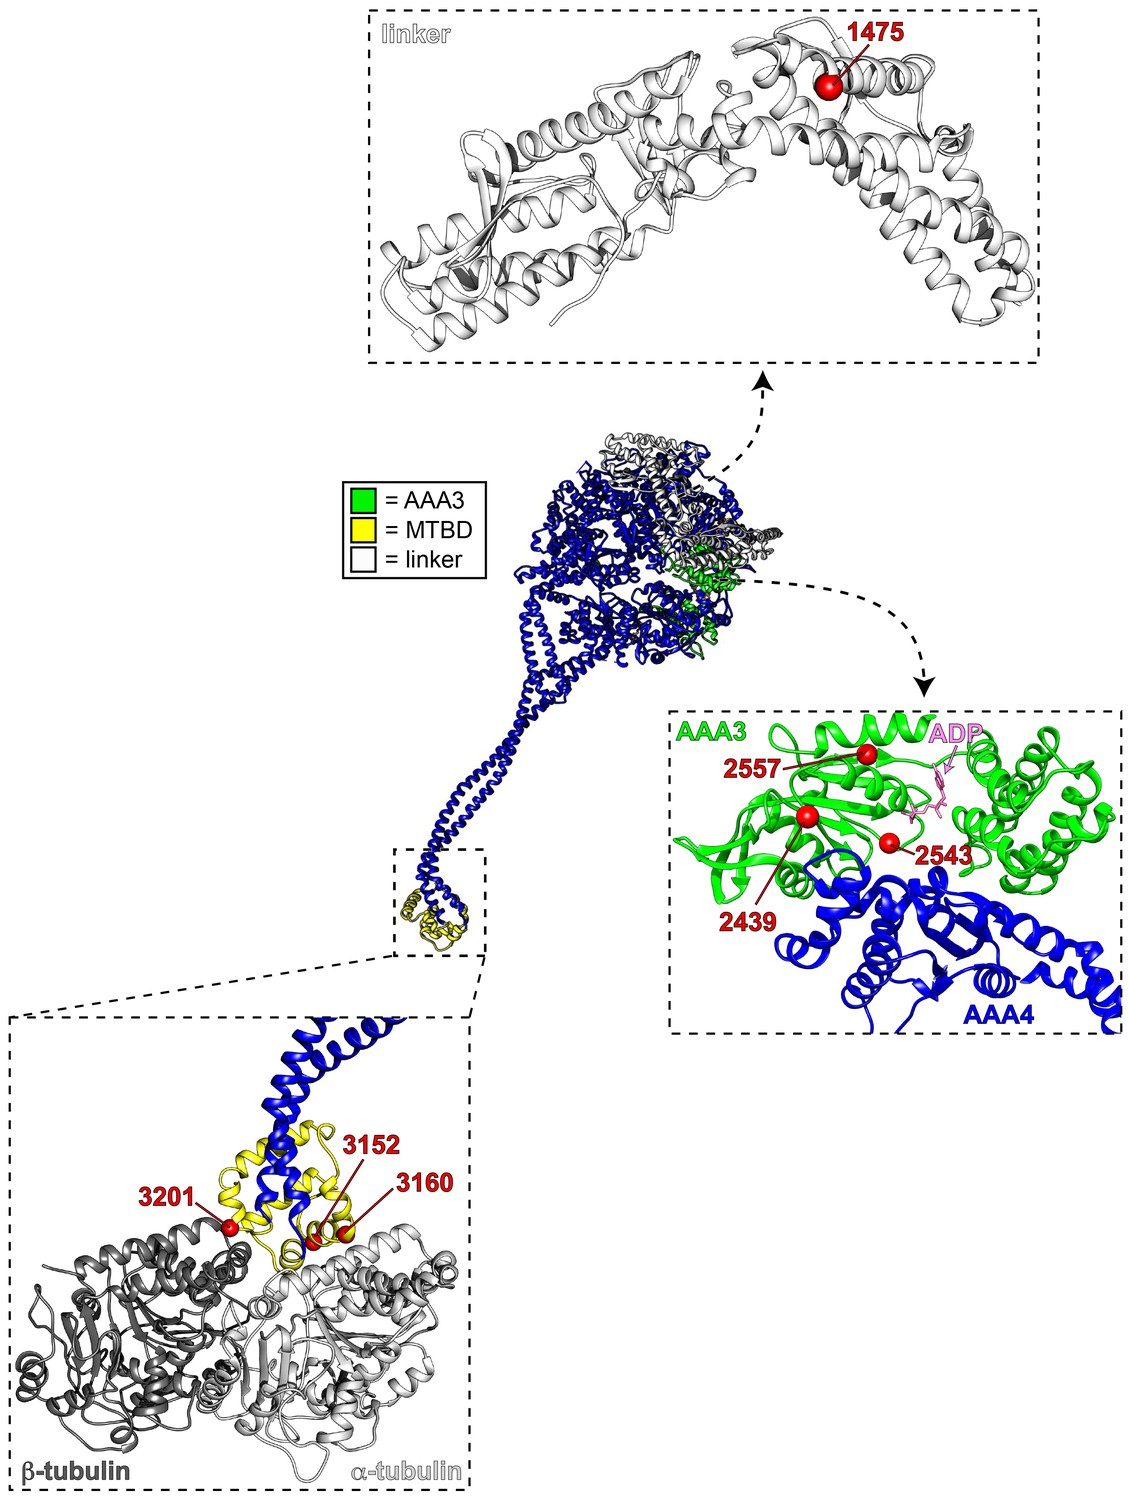
Mutations map to various structural elements within the motor domain.
Structural model of the dynein motor domain (from PDB 4RH7; Schmidt et al., 2015) with zoomed in regions depicting the linker domain, the AAA3/AAA4 interface, and the MTBD bound to microtubules (R4H7 docked into 3J1T; Redwine et al., 2012). Red spheres denote mutations.
Figure 2—figure supplement 4
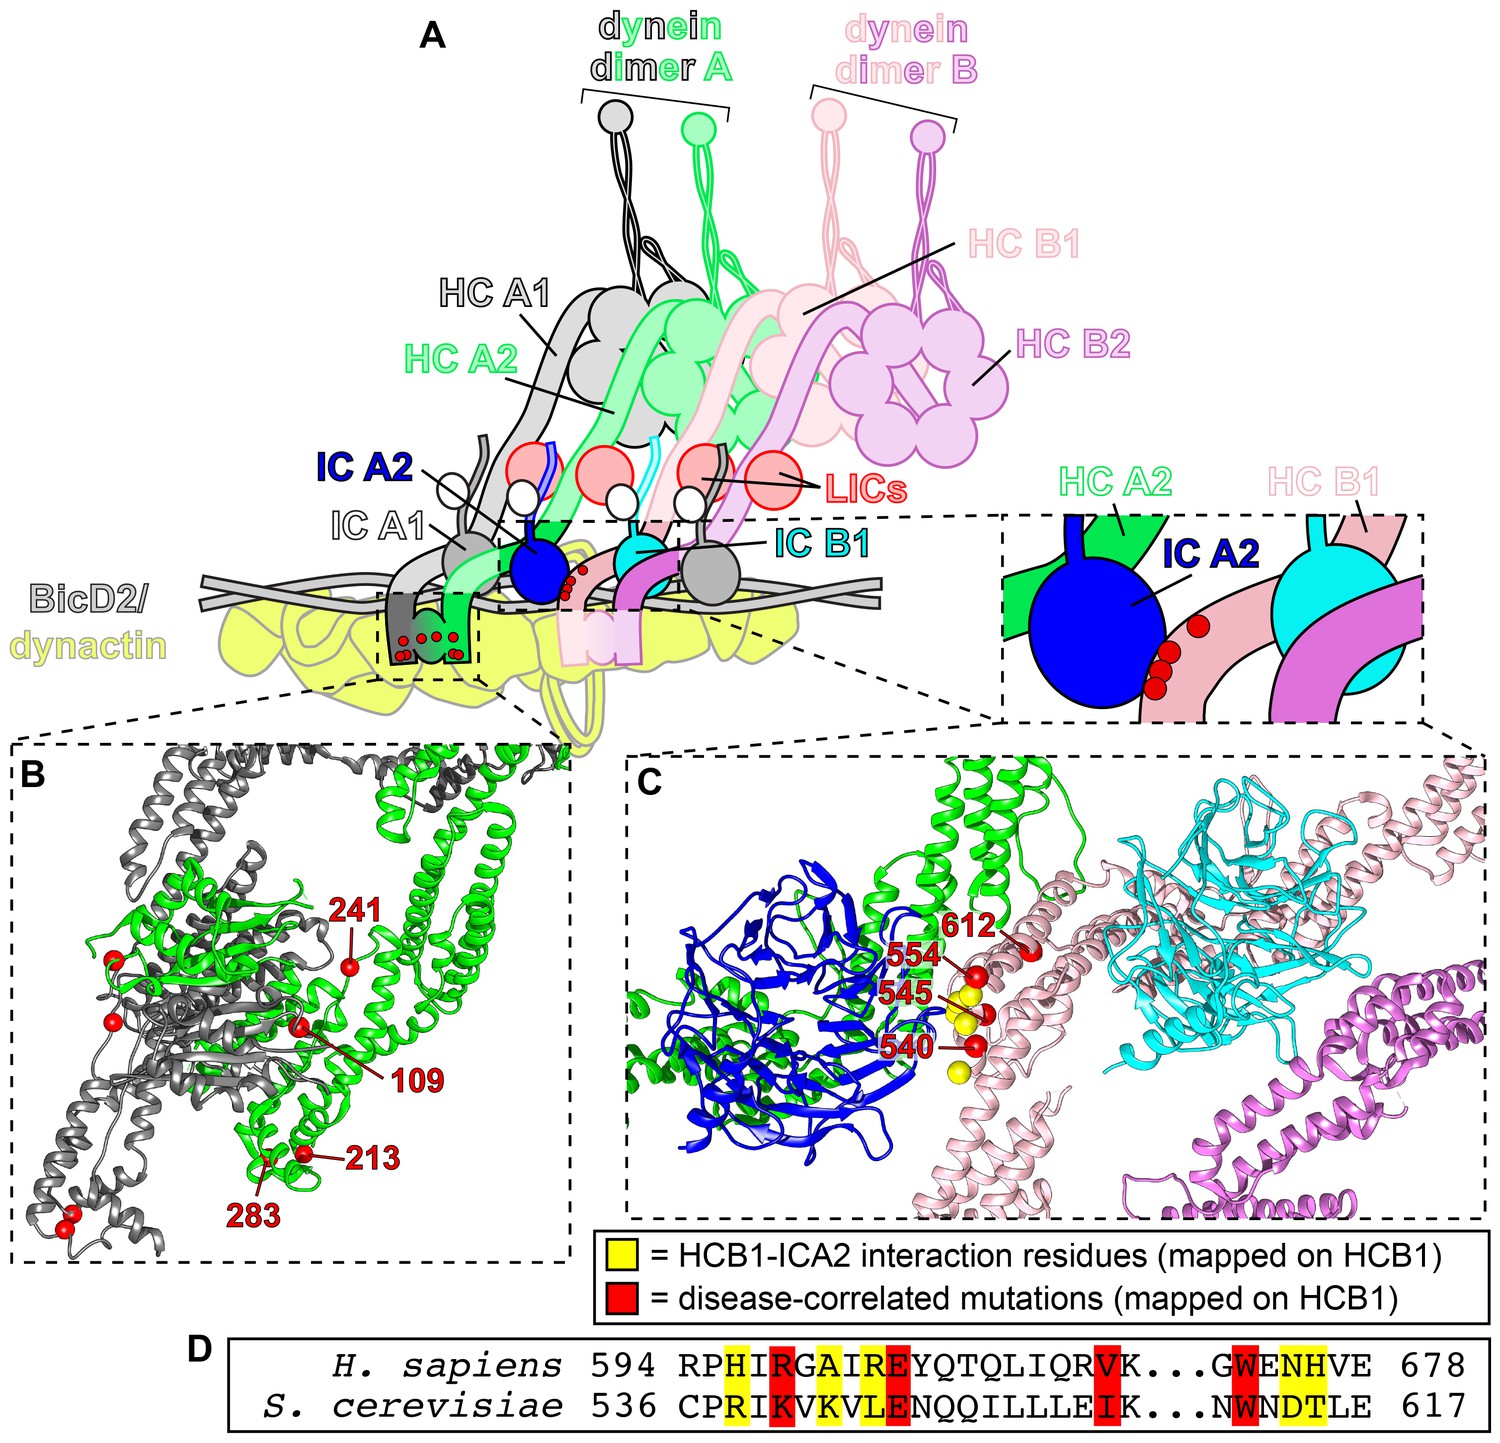
Tail domain mutations cluster to two distinct regions.
(A) Cartoon model depicting two dynein dimers (dimer A, composed of chains HCA1 and HCA2; and, dimer B, composed of chains HCB1 and HCB2) bound to a single dynactin complex with adapter BicDR1 (Urnavicius et al., 2018). (B) Zoom-in view of the N-terminal dimerization domain of dynein (PDB 6F1T; Urnavicius et al., 2018) with red spheres denoting mutated residues (labeled on dynein heavy chain A2). (C) Zoom-in view of the contact point between dynein heavy chain HCB1 and the intermediate chain bound (ICA2) to heavy chain HCA2. Note that 3 of the 4 mutated residues cluster to the HCB1-ICA2 contact surface (K540, E545, I554), while one of them (W612) is somewhat distal from this region (red spheres, mutated residues; yellow spheres, contact points between HCB1 and ICA2). (D) Sequence alignment of the region shown in panel C.
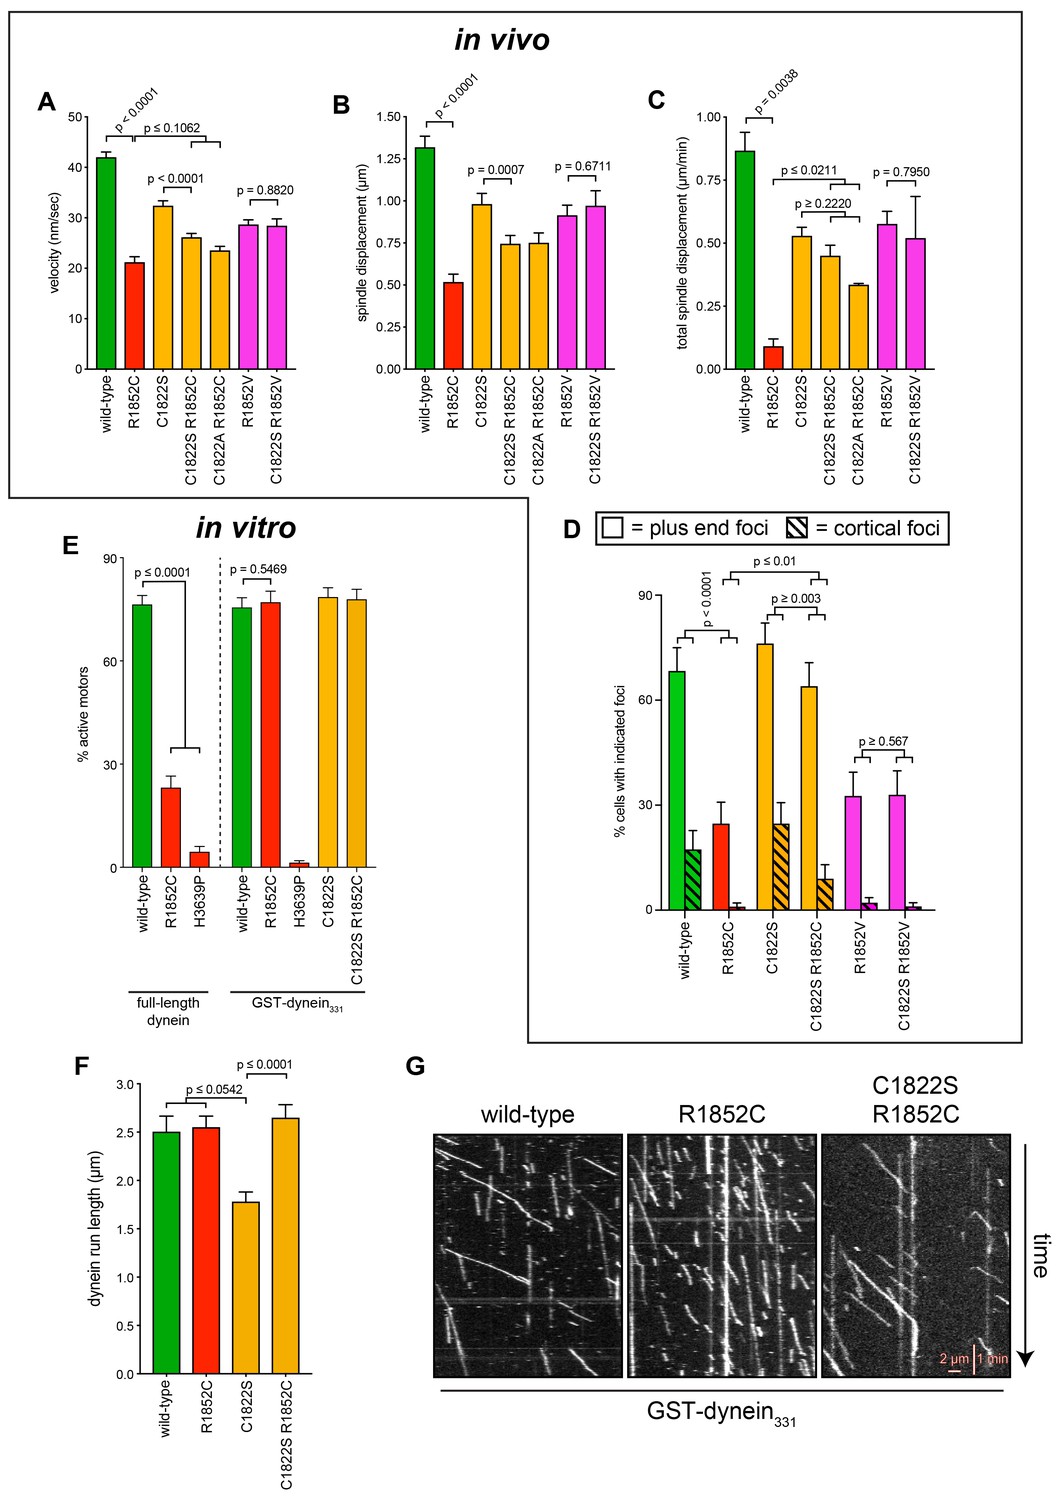
Figure 3 with 1 supplement

Quantitative assessment of spindle dynamics in heterozygous diploid cells reveals dominant nature of mutations.
(A) Schematic depicting experimental approach to determine whether distinct proteins from two different dynein alleles homo- or heterodimerize. (B and C) Representative kymograph (B) depicting large proportion of red (HALO-tagged) dynein molecules walking along microtubules (only one of which colocalized with a GFP-tagged dynein; arrow), along with associated quantitation (C). (D – E) Schematic depicting experimental approach to assess dynein-dynactin activity in heterozygous diploid cells (D), and representative inverse fluorescence images of a diploid hydroxyurea (HU)-arrested kar9∆/kar9∆ cell exhibiting typical dynein-mediated spindle movements. Maximum intensity (X-Y projection; top) and Y-Z projections (bottom) are shown for each time point. (F – I) Plots of indicated parameters for spindle dynamics in indicated diploid yeast strains. Each bar represents the weighted mean ±weighted standard error (or standard error of proportion for I; n ≥ 29 HU-arrested cells from two independent experiments were analyzed for each strain; diamonds represent mean values obtained from each independent replicate experiment). Statistical significance was determined using an unpaired Welch’s t test (F and H), a Mann-Whitney test (G), or by calculating Z scores (I). Also see Figure 3—figure supplement 1, and Figure 3—source data 1.
-
Figure 3—source data 1
Spreadsheet with spindle dynamics assay values for diploid cells.
- https://doi.org/10.7554/eLife.47246.013
Figure 3—figure supplement 1
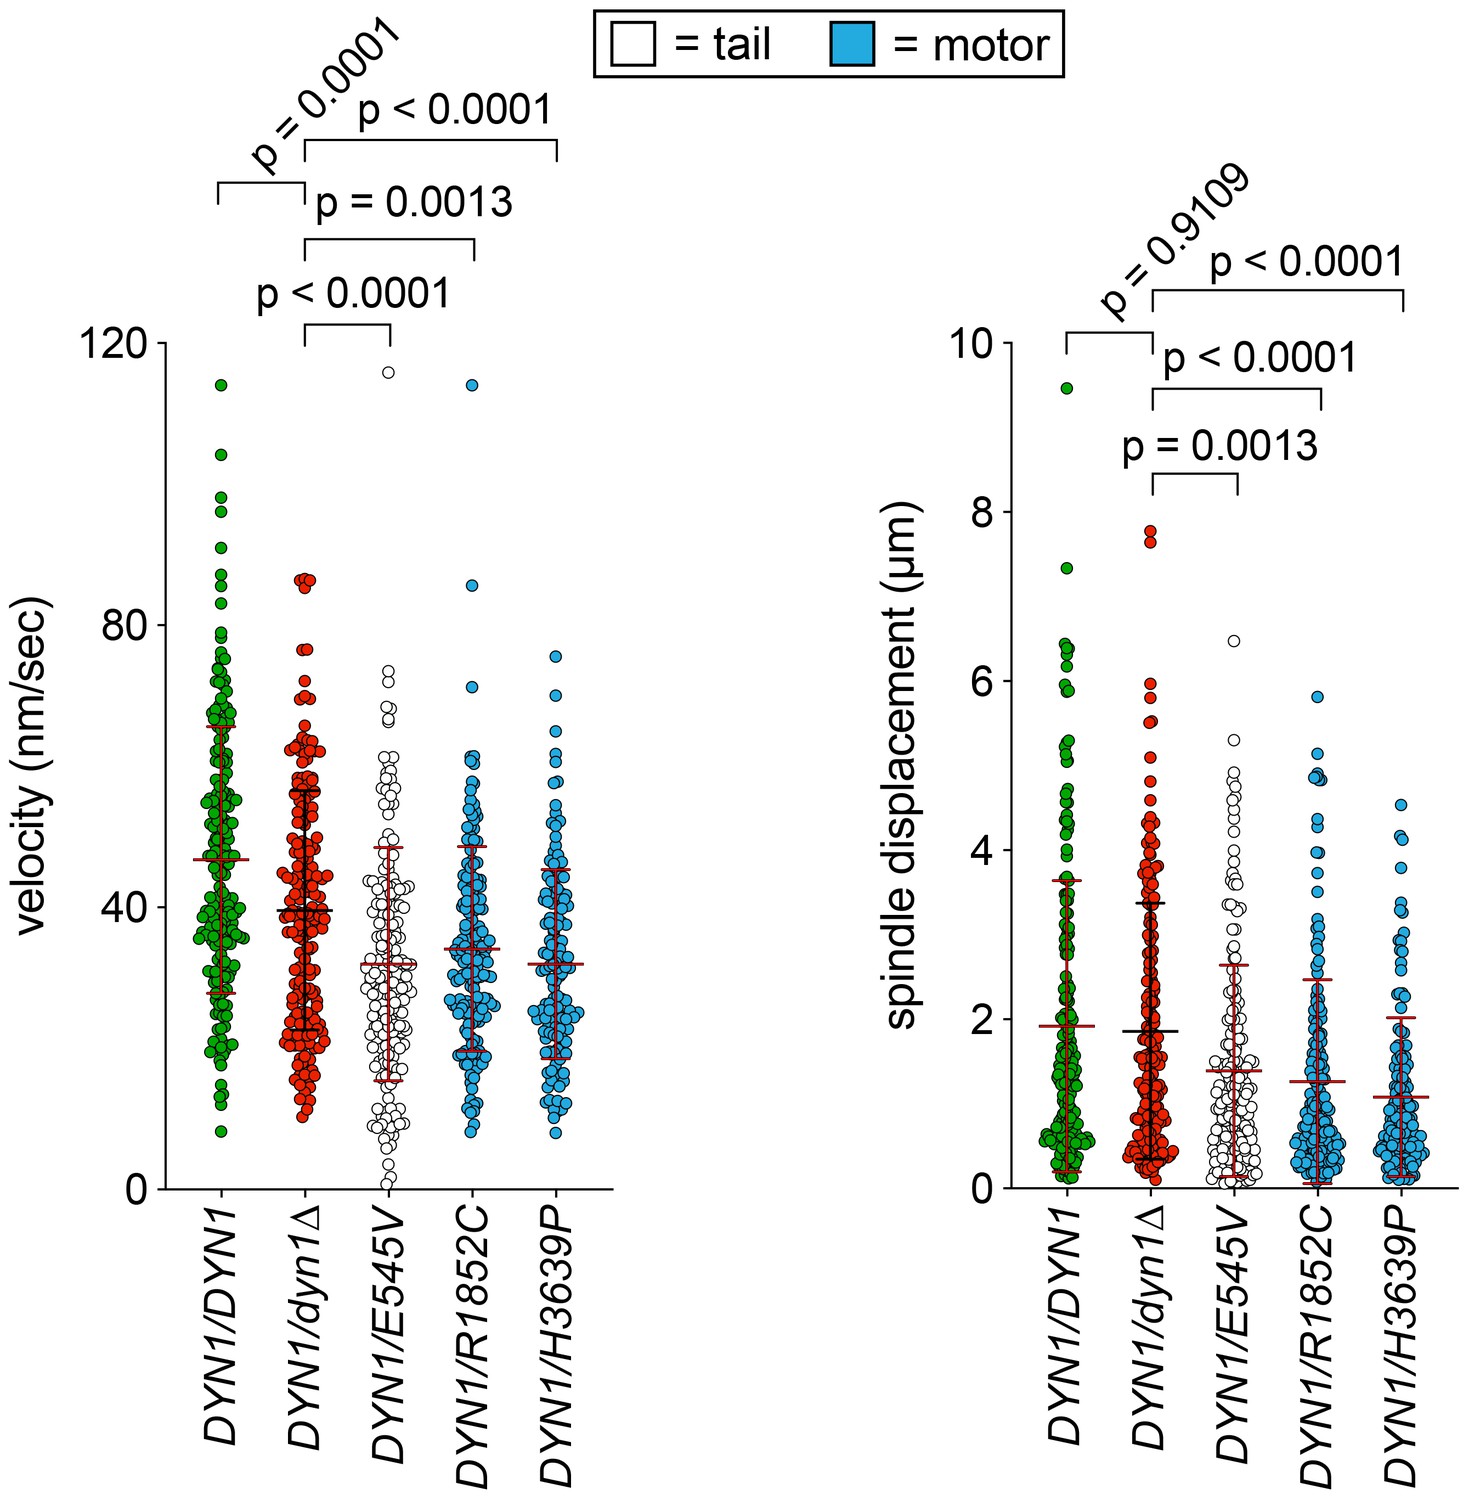
Additional plots of spindle dynamics data from diploid cells.
(A and B) Scatter plots depicting (A) velocity per spindle displacement event, and (B) displacement per spindle displacement event (from Figure 3). Mean values and standard deviations are also depicted with red and black lines.
Figure 4 with 2 supplements
Single molecule analysis reveals insight into dynein-intrinsic dysfunction.
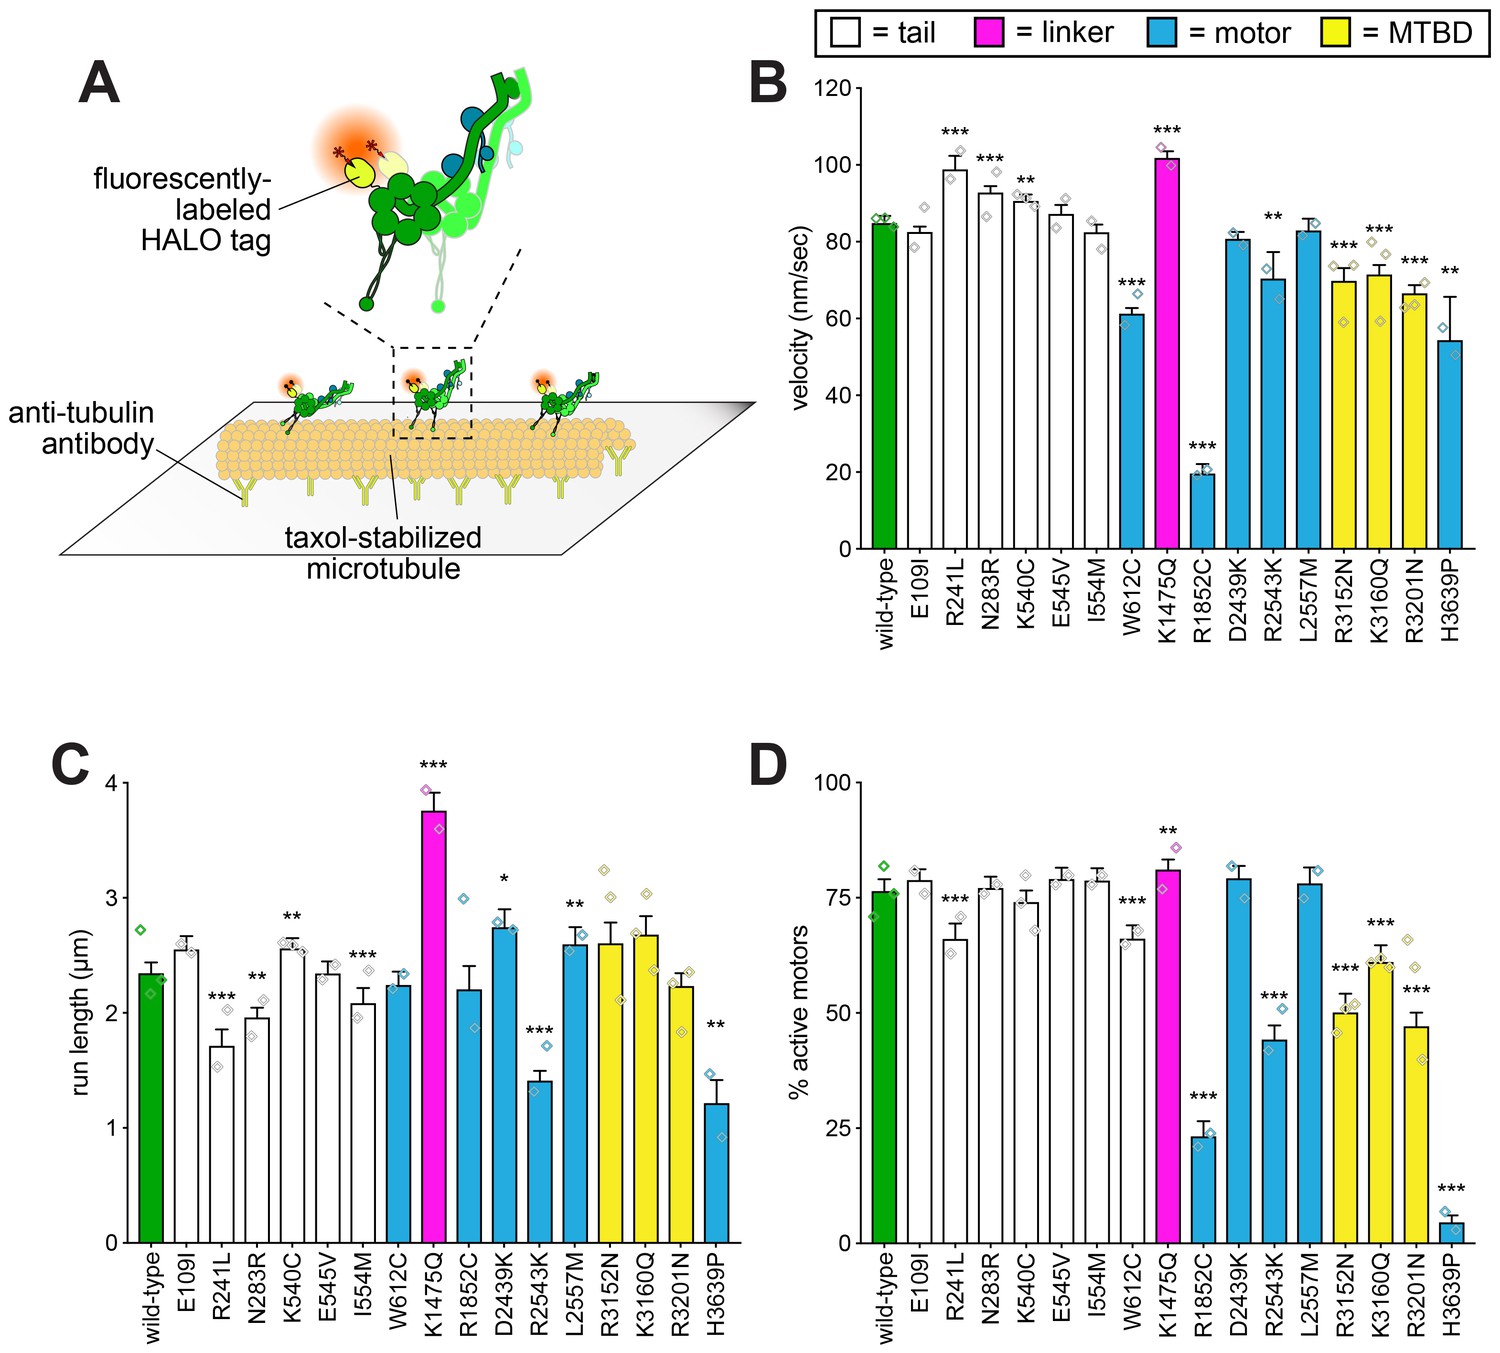
(A) Cartoon representation of experimental approach. (B – D) Quantitation of indicated parameters of single molecule motility. Each bar represents the weighted mean ± weighted standard error (or standard error of proportion for D; n ≥ 284 single molecules from at least two experiments from independent protein preparations; diamonds represent mean values obtained from each independent protein preparation). Technical difficulties precluded us from generating the L213I mutant in the yeast strain used for protein purification. Statistical significance was determined using an unpaired Welch’s t test (B), a Mann-Whitney test (C) or by calculating Z scores (D; *, p≤0.1; **, p≤0.05; ***, p≤0.005). Also see Figure 4—figure supplements 1 and 2, and Figure 4—source data 1.
-
Figure 4—source data 1
Spreadsheet with all full-length and minimal GST-dimerized dynein single molecule motility values.
- https://doi.org/10.7554/eLife.47246.017
Figure 4—figure supplement 1
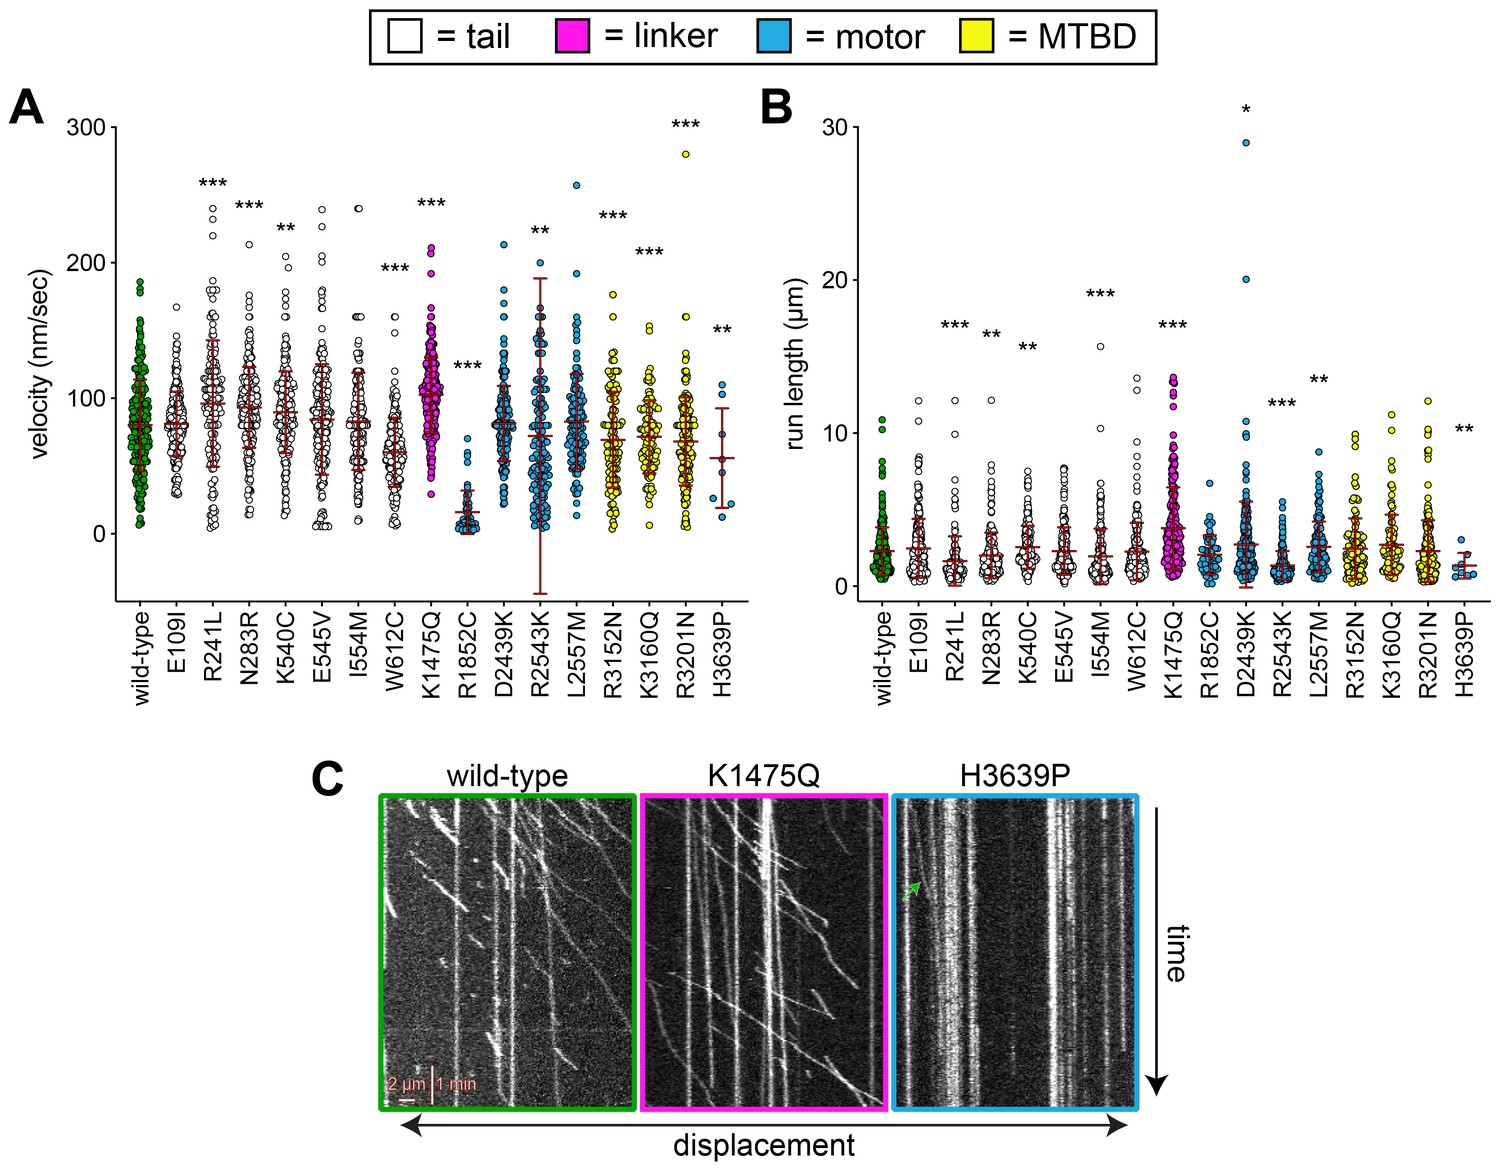
Additional plots of single molecule data and some representative kymographs.
(A and B) Scatter plots depicting (A) velocity, and (B) displacement values for single molecule motility assays (from Figure 4). Mean values and standard deviations are depicted with red lines. (C) Representative kymographs depicting single molecules of full-length dynein (wild-type or mutants, as indicated) walking along microtubules in vitro. Green arrow within H3639P panel depicts the only moving complex within the kymograph.
Figure 4—figure supplement 2
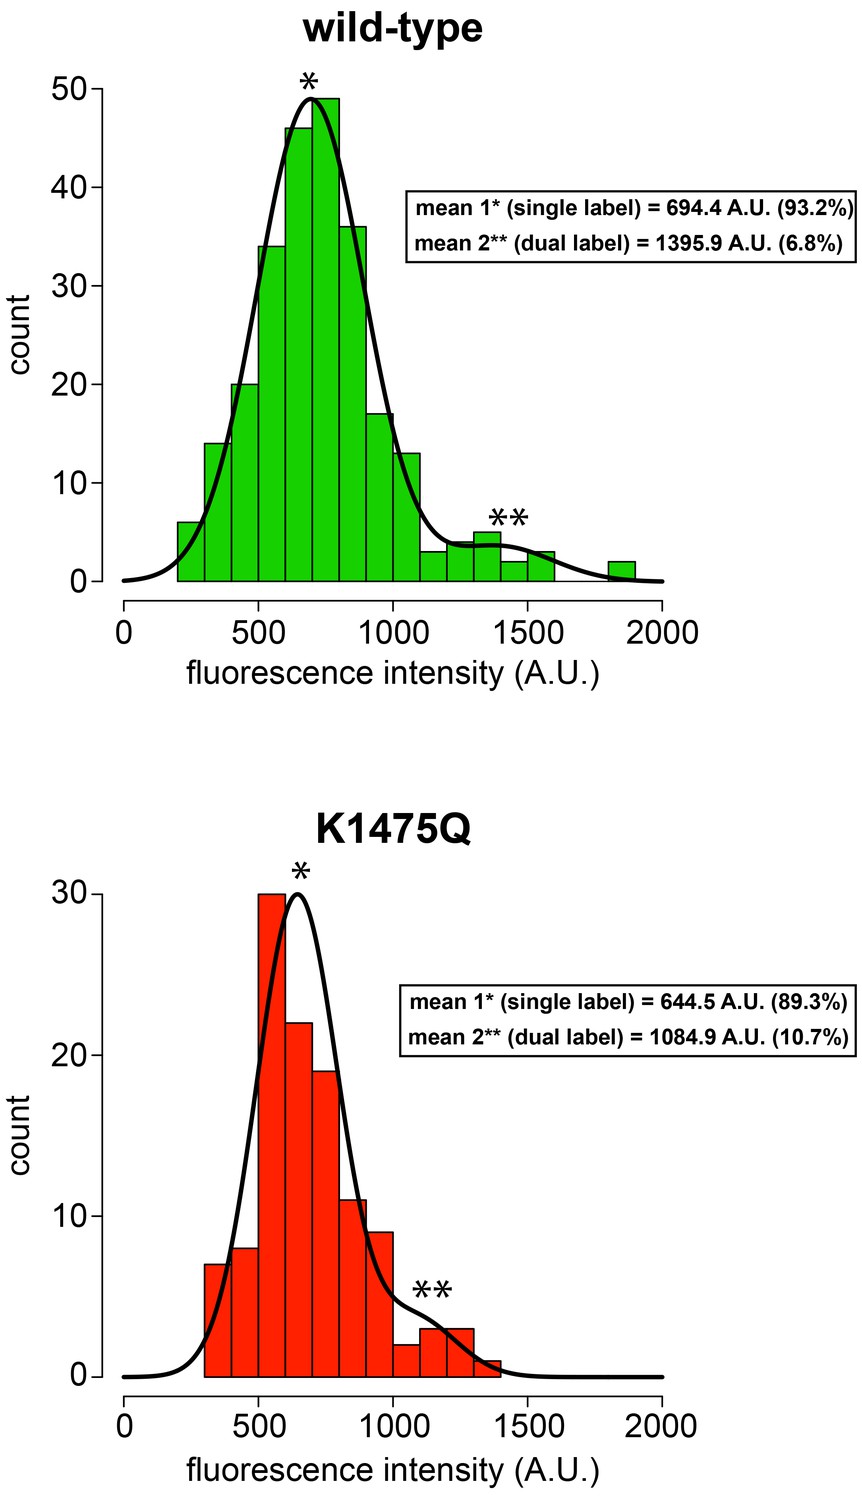
K1475Q mutant does not form aggregates in single molecule assay.
Histogram of fluorescence intensity values for single molecules of motile wild-type (top; n = 254 molecules) and K1475Q (bottom; n = 115 molecules) dynein, along with accompanying Gaussian fits and modeled parameters (determined using the model-based clustering algorithm Mclust; Fraley and Raftery, 2007). The percentages reflect the relative proportion of molecules that fall within each component (i.e., for mean 1, and mean 2). The two mean values for each (indicated with asterisks) likely represent single-labeled (mean 1, *) and dual-labeled (mean 2, **) dynein dimers, respectively. Importantly, the values for K1475Q are not higher than wild-type, indicating the increased processivity for this mutant is not a consequence of increased motor number.
Figure 5 with 2 supplements
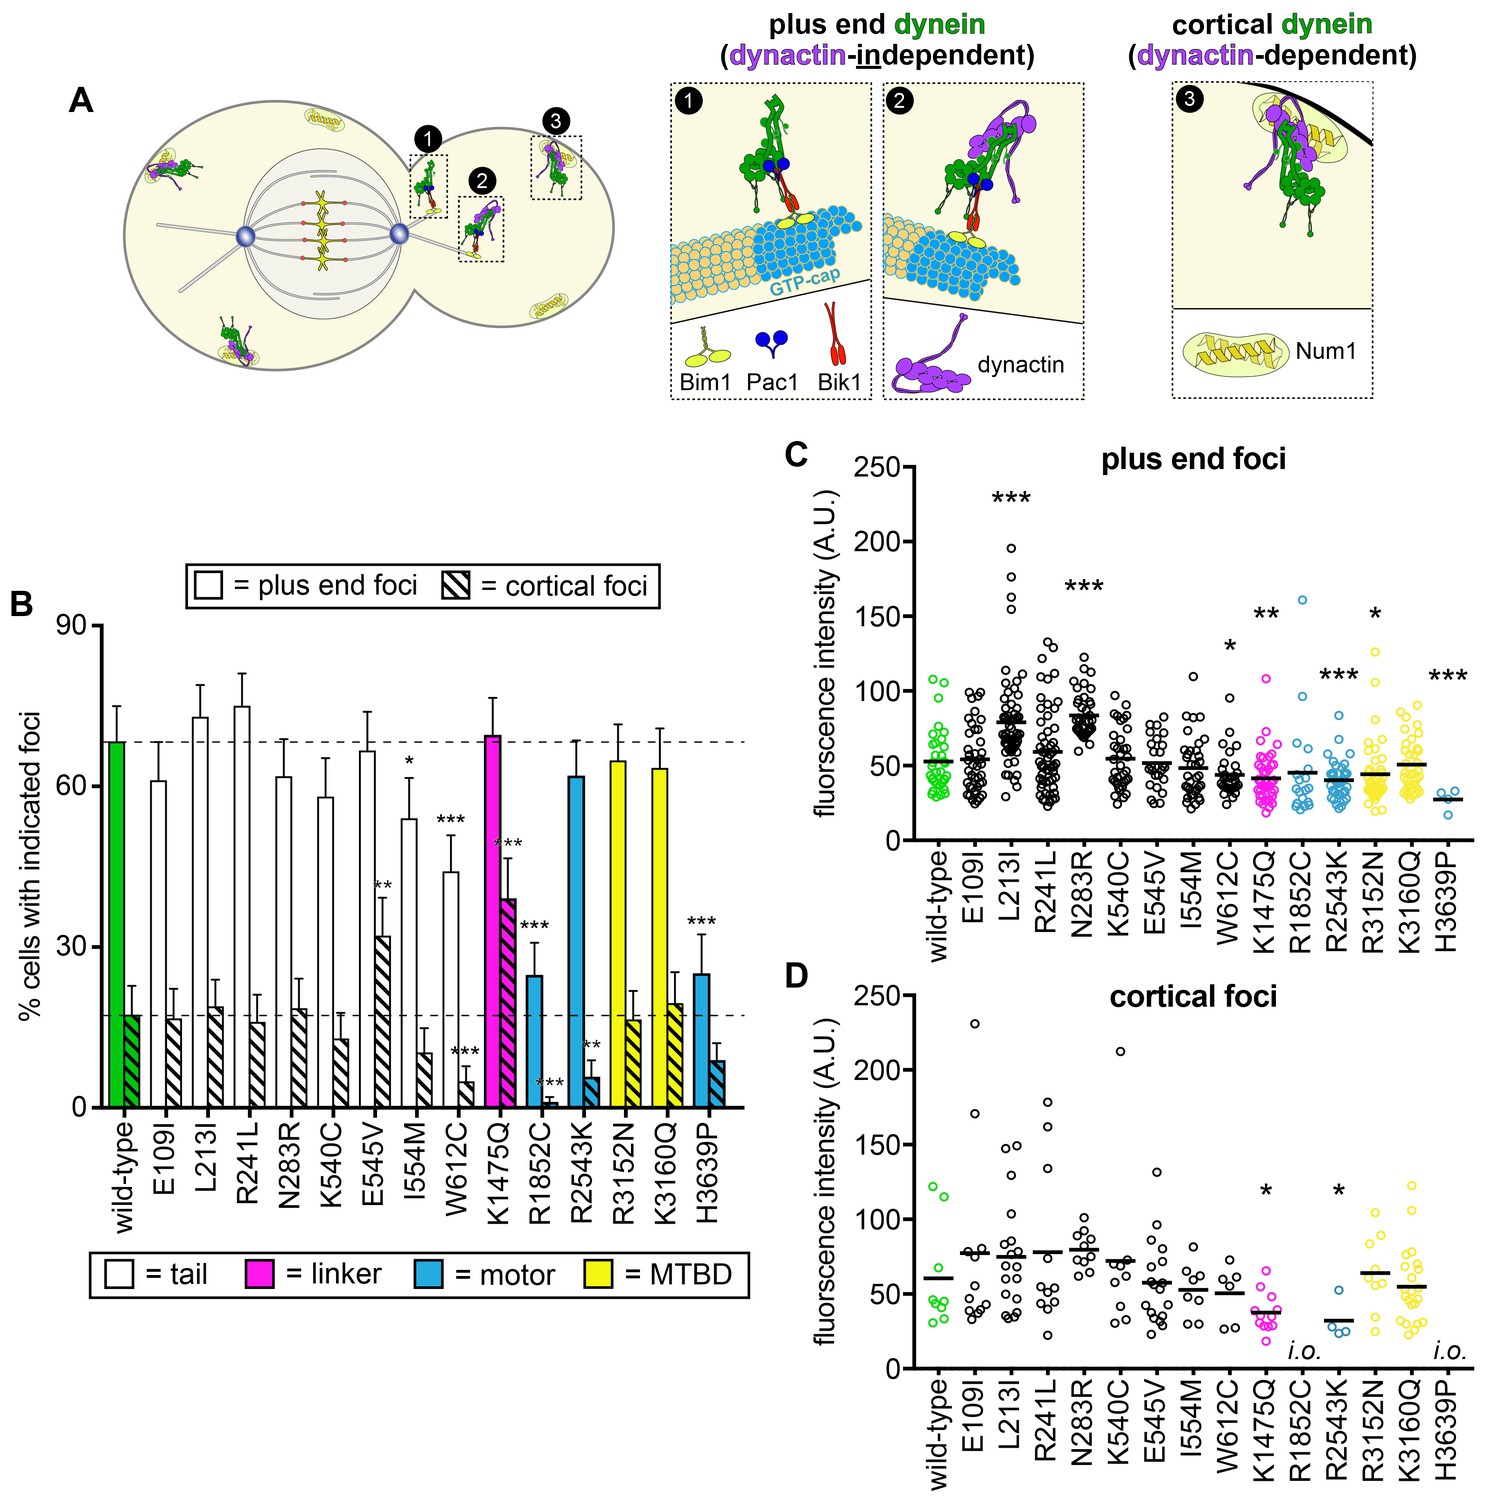
Quantitative assessment of dynein localization reveals potential basis for mutant dysfunction.
(A) Cartoon representation depicting the two main sites of dynein localization, and the molecular basis for each. Dynein plus end localization (1) requires Bik1, Pac1, and possibly Bim1, but does not require dynactin. Rather, dynactin plus end localization (2) relies on dynein. Association of dynein with the cortex (3) requires dynactin and the cortical receptor, Num1. (B) The frequency of dynein localization to either microtubule plus ends or the cell cortex is plotted for indicated strains. To enrich for mitotic cells, overnight cultures were diluted into fresh media for 1.5 hr prior to imaging. To further reduce variability due to cell cycle-dependent changes (Markus et al., 2009), localization frequency was scored for mitotic cells only. Each data point represents the weighted mean ± weighted standard error (68 to 111 mitotic cells from at least two independent experiments were analyzed for each strain). (C and D) Fluorescence intensity values for either plus end (C) or cortical (D) dynein foci observed in mitotic cells described in B (4 to 59 plus end foci, and 4 to 22 cortical foci from two independent experiments were analyzed; i.o., insufficient observations; only one cortical focus was observed for both R1852C and H3639P). Statistical significance was determined by calculating Z scores (B), or by applying an unpaired Welch’s t test (C and D; *, p≤0.1; **, p≤0.05; ***, p≤0.005). Also see Figure 5—figure supplements 1 and 2, and Figure 5—source data 1.
-
Figure 5—source data 1
Spreadsheet with localization frequency and intensity values for wild-type and mutant Dyn1-3GFP.
- https://doi.org/10.7554/eLife.47246.021
Figure 5—figure supplement 1
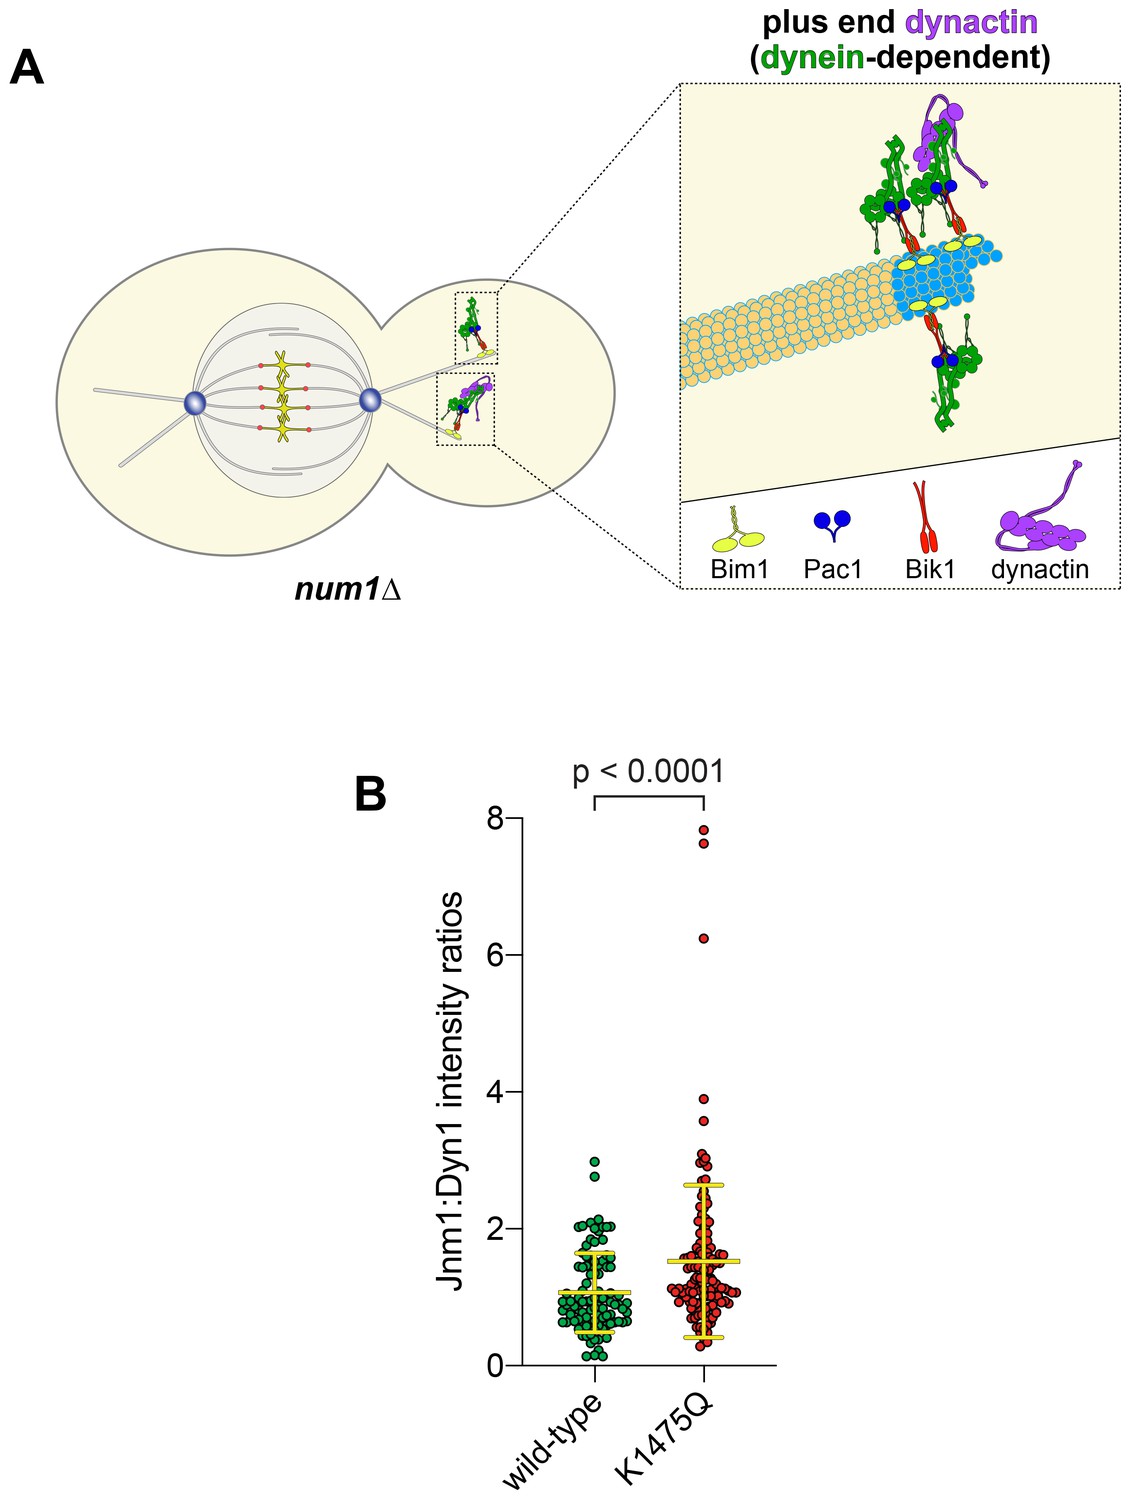
K1475Q mutant recruits more dynactin to microtubule plus ends than wild-type dynein.
(A) Cartoon representation depicting the dynein-dependent localization of dynactin to plus ends (Moore et al., 2008). Note that the limiting amount of dynactin at plus ends with respect to dynein (~3 dynein:1 dynactin), as depicted, is based on previous quantitative ratiometric imaging (Markus et al., 2011). (B) Scatter plot (shown with bars depicting mean and standard deviation values) of the ratios of fluorescence intensity values for Jnm1-3mCherry:Dyn1-3GFP at microtubule plus ends and SPBs (n = 97–131 foci from two independent experiments). Background corrected intensity values of colocalizing Jnm1-3mCherry and Dyn1-3GFP foci were divided to obtain individual ratio values. Statistical significance was determined by applying an unpaired Welch’s t test.
Figure 5—figure supplement 2
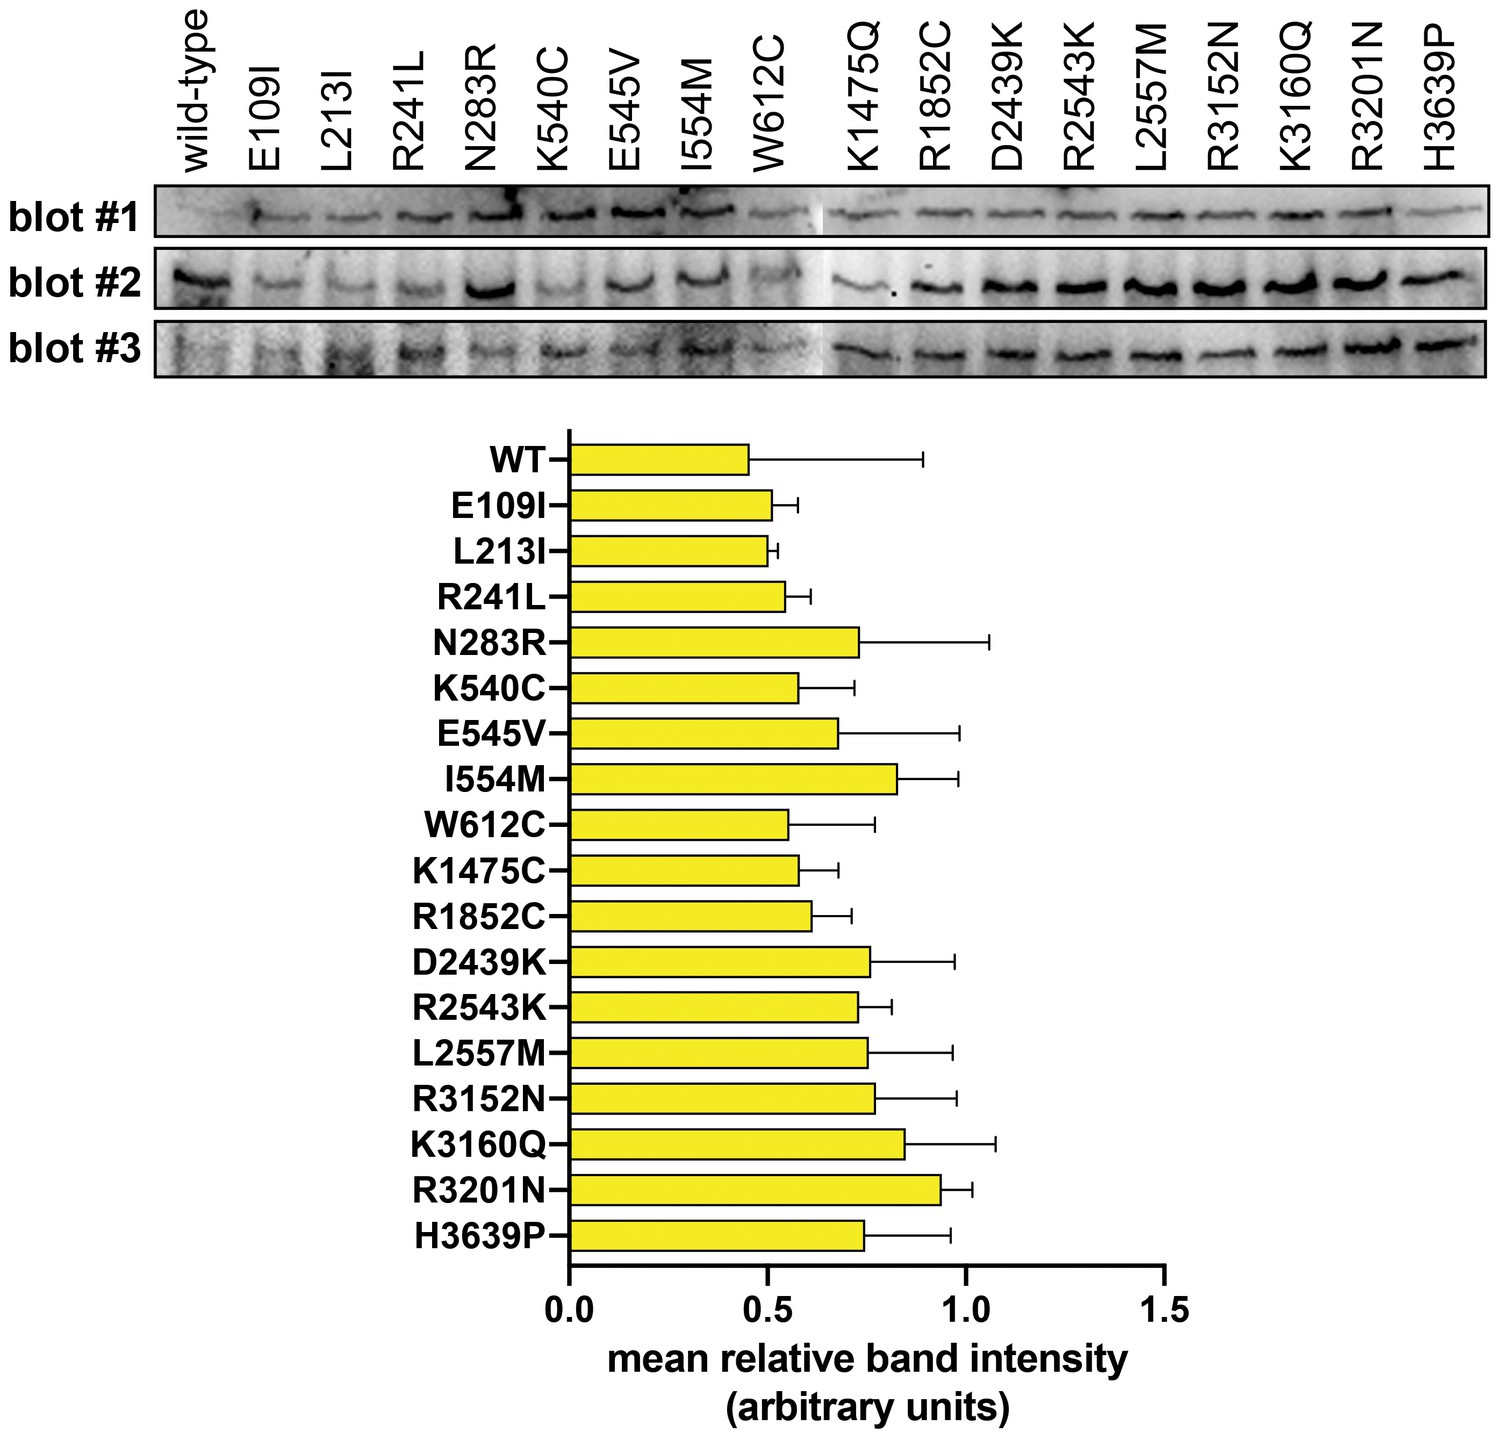
Immunoblotting reveals no major differences in steady-state expression levels of dynein mutants.
Immunoblots from three independent experiments (i.e., blot #1, #2 and #3) along with plot depicting mean relative band intensity ± standard deviation for each. Equal amounts of total cell lysate were loaded into each lane, transferred to PVDF and probed with a monoclonal anti-GFP antibody (also see Materials and methods). Note the high degree of variability between each independent immunoblot is likely a consequence of variations in transfer efficiency for the enormous dynein heavy chain protein to the PVDF membrane.
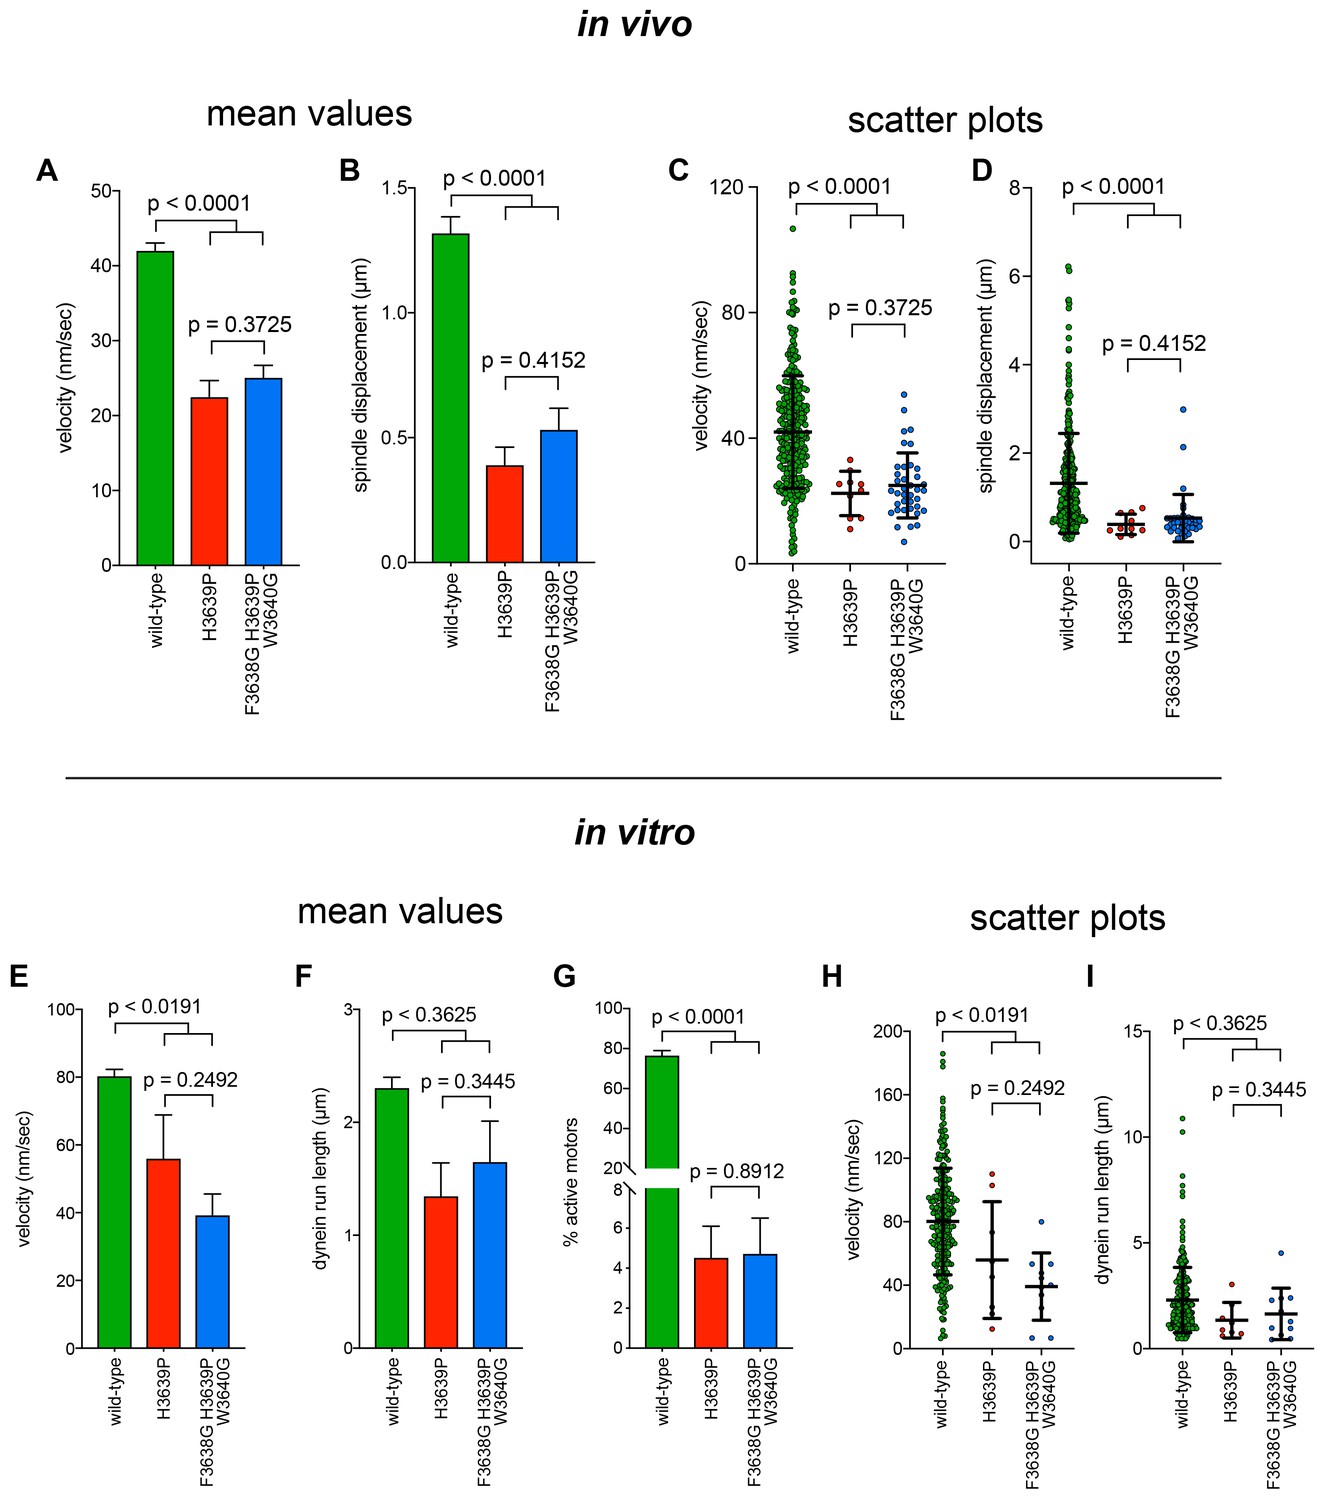
Figure 6 with 1 supplement
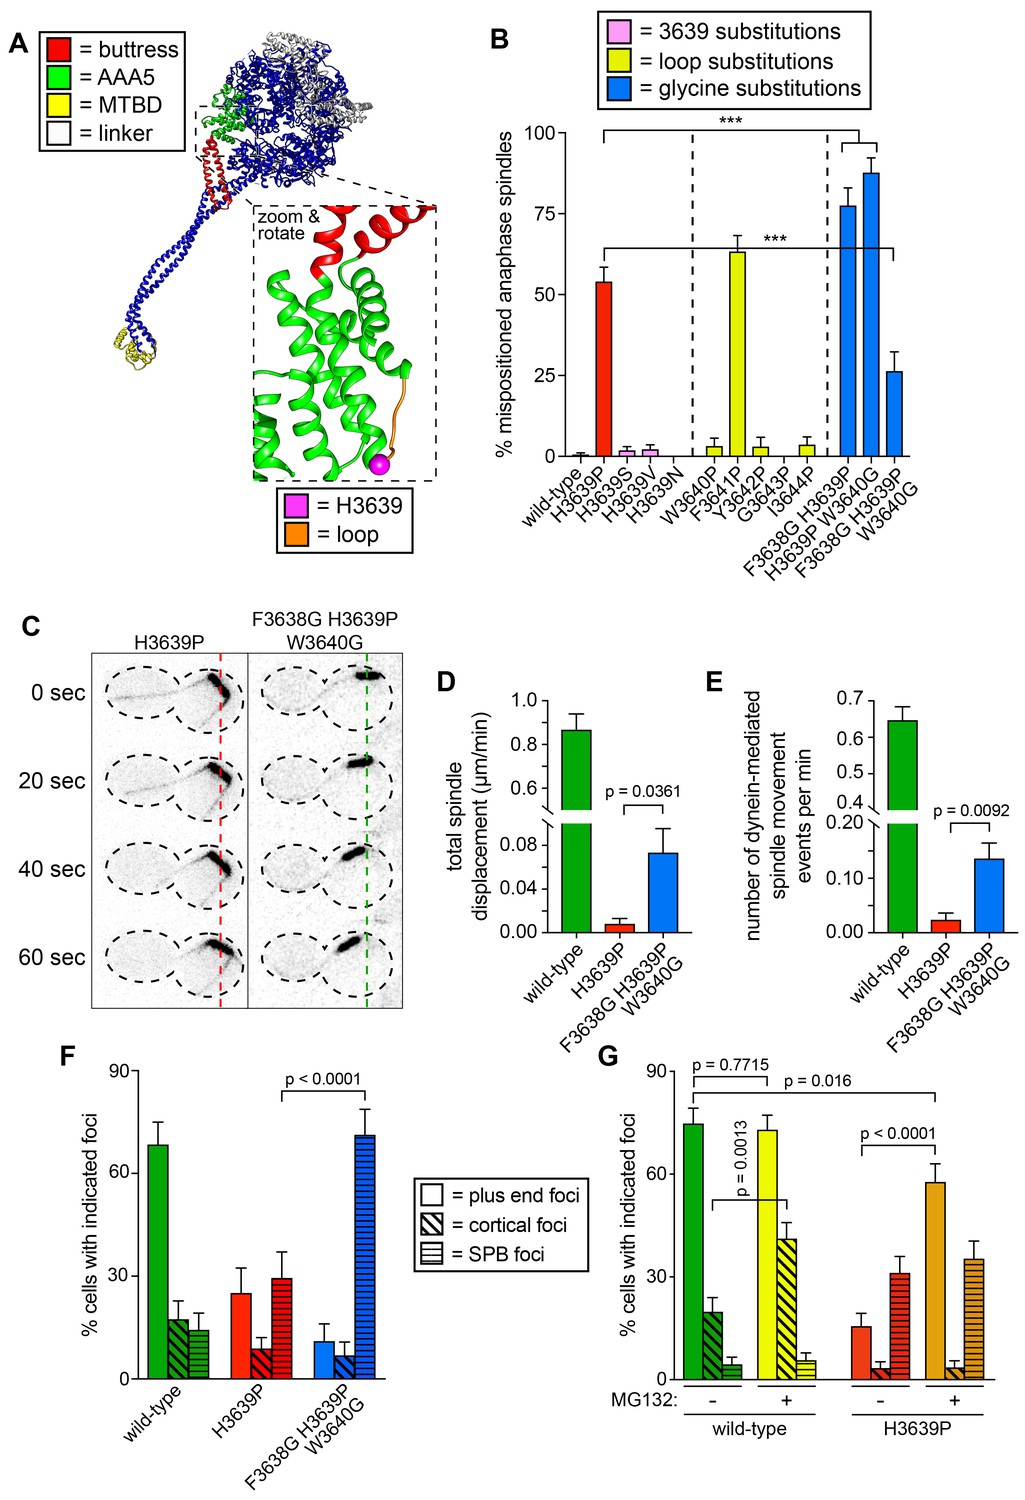
Detailed dissection of the molecular basis for dysfunction in H3639P.
(A) Color-coded structural model of the dynein motor domain (from PDB 4RH7; Schmidt et al., 2015) with zoomed in region depicting H3639 residing within an inter-helical loop within AAA5. (B) Fraction of cells with mispositioned spindles are plotted for yeast strains with indicated dynein mutations. Each data point represents the fraction of mispositioned anaphase spindles along with standard error (weighted mean ± weighted standard error of proportion; n ≥ 67 anaphase spindles from at least two independent experiments for each strain; ***, p≤0.0001). (C) Representative time-lapse inverse fluorescence images of two hydroxyurea (HU)-arrested kar9∆ cells with indicated dynein mutations. Note the lack of spindle translocation in H3639P, but the clear dynein-mediated movement in the F3638G H3639P W3640G mutant (dashed lines provide a point of reference). Maximum intensity projections are shown for each time point. (D – E) Plots of two activity parameters for spindle dynamics in indicated haploid strains (total displacement, D; and, number of events per minute, E). Each data point represents the weighted mean ± weighted standard error (D) or standard error of proportion (E; n ≥ 29 HU-arrested cells from at least two independent experiments were analyzed for each strain). (F and G) The frequency of dynein localization to either microtubule plus ends, the cell cortex, or spindle pole bodies (SPBs) is plotted for indicated strains and drug treatment (for mitotic cells only). In addition to the indicated alleles and drug treatment, the plot in panel G depicts cells that possess the prd1-DBD-CYC8 allele, which represses transcription of pleiotropic drug resistance genes (Stepanov et al., 2008), thus promoting intracellular retention of MG132. These cells were treated with 75 µM MG132 for 1.5 hr prior to imaging (control cells were treated with an equal volume of DMSO). Each data point represents the weighted mean ± weighted standard error (73 to 107 mitotic cells from two independent experiments were analyzed for each strain). Statistical significance was determined by calculating Z scores (B, E, F and G), or by applying an unpaired t-test with Welch’s correction (D). Also see Figure 6—figure supplement 1, Figure 6—source datas 1 and 2, and Figure 4—source data 1.
-
Figure 6—source data 1
Spreadsheet with spindle dynamics assay values for inter-helical loop mutants.
- https://doi.org/10.7554/eLife.47246.024
-
Figure 6—source data 2
Spreadsheet with localization frequency values for wild-type and mutant Dyn1-3GFP in the absence and presence of MG132.
- https://doi.org/10.7554/eLife.47246.025
Figure 6—figure supplement 1
Additional insight into the molecular basis for dysfunction in H3639P.
(A - D) Plots depicting the velocity (A and C) and displacement (B and D; per event) values obtained from the spindle dynamics assay for the indicated haploid strains. For panels A and B, each data point represents the weighted mean ± weighted standard error (at least 29 HU-arrested cells from at least two independent experiments were analyzed for each strain). For panels C and D, mean values and standard deviations are depicted with black lines. (E – I) Quantitation of indicated parameters of single molecule motility. For panels E – G, each data point represents the weighted mean ± weighted standard error (E and F), or ± standard error of proportion (for G; at least 234 single molecules from at least two independent experiments were analyzed for each motor variant). For panels (H and I), mean values and standard deviations are depicted with black lines. Statistical significance was determined using an unpaired Welch’s t test (A, C, E and H), a Mann-Whitney test (B, D, F and I), or by calculating Z scores (G).
Figure 7 with 2 supplements
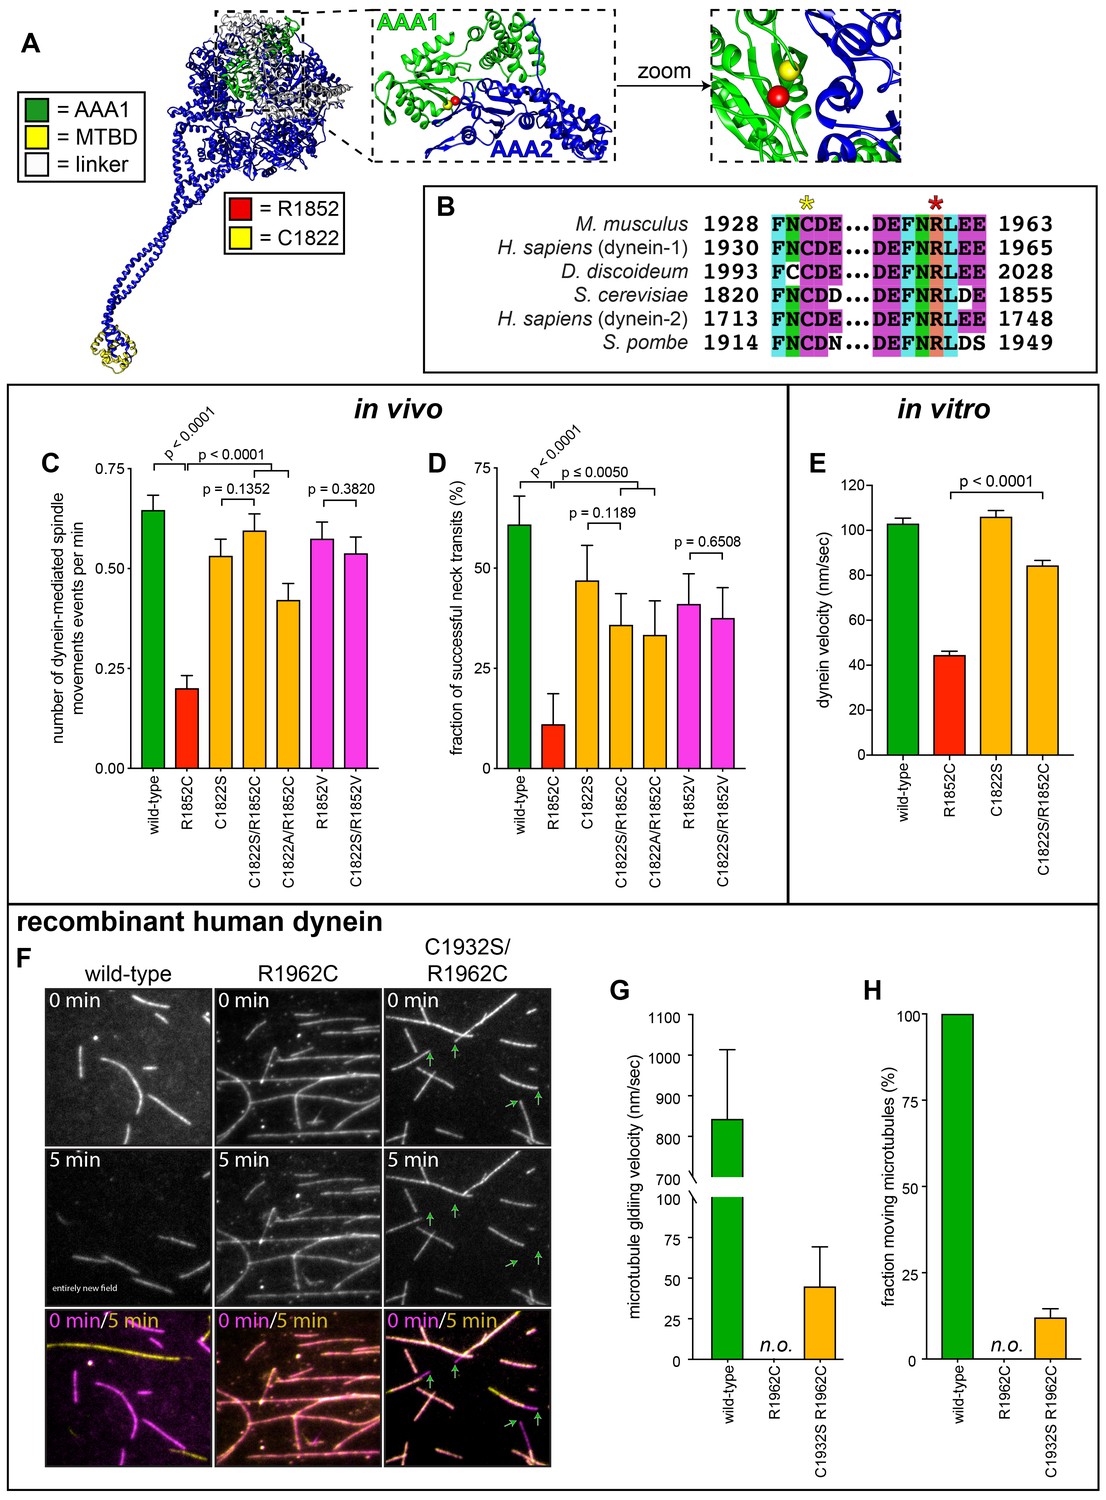
Detailed dissection of the molecular basis for dysfunction in R1852C.
(A) Color-coded structural model of the dynein motor domain (from PDB 4RH7; Schmidt et al., 2015) with zoomed in region depicting R1852 residing within AAA1 near its interface with AAA2. (B) Sequence alignment illustrating the high degree of conservation for C1822 (yellow star) and R1852 (red star) among various dynein heavy chains. (C and D) Plots of two activity parameters for spindle dynamics in indicated haploid strains (total displacement, C; and, fraction of successful neck transits, D). Each data point represents the weighted mean ± weighted standard error (C) or standard error of proportion (D; n ≥ 28 HU-arrested cells from two independent experiments were analyzed for each strain). (E) Plot of velocity values for single molecules of indicated GST-dynein331 variants (n ≥ 158 single molecules from at least two independent experiments were analyzed for each motor variant). (F) Representative fields of microtubules being translocated by surface-adsorbed recombinant human dynein complexes. (G and H) Plots depicting velocity (G) and fraction (H) of microtubules (at least 50 microtubules from two independent experiments were analyzed for each variant; ‘n.o.”, none observed). Statistical significance was determined by calculating Z scores (B and E), or by applying an unpaired Welch’s t test (D). Also see Figure 7—figure supplements 1 and 2, Figure 7—source data 1, and Figure 4—source data 1.
-
Figure 7—source data 1
Spreadsheet with spindle dynamics assay values for R1852C related mutants.
- https://doi.org/10.7554/eLife.47246.029
Figure 7—figure supplement 1
Additional insight into the molecular basis for dysfunction in R1852C.
(A – C) Plots depicting the indicated motility parameter values obtained from the spindle dynamics assay for the indicated haploid strains. Each data point represents the weighted mean ± weighted standard error (at least 28 HU-arrested cells from at least two independent experiments were analyzed for each strain). (D) The frequency of dynein localization to either microtubule plus ends or the cell cortex is plotted for indicated strains (scored as described in Figure 5 legend). Each data point represents the weighted mean ± weighted standard error (94 to 105 mitotic cells from at least two independent experiments were analyzed for each strain). (E) Plot depicting the fraction of active motors for the indicated full-length complexes (left), or the minimal motile fragment (GST-dynein331; see text; right). Note the minimal fragment rescues the reduced fraction of active motors in the R1852C mutant. (F) Plot depicting single molecule run length values for indicated GST-dynein331 variants. (G) Representative kymographs depicting single molecules of GST-dynein331 (wild-type or mutants, as indicated) walking along microtubules in vitro. Statistical significance was determined using an unpaired Welch’s t test (A and C), a Mann-Whitney test (B and F), or by calculating Z scores (D and E).
Figure 7—figure supplement 2
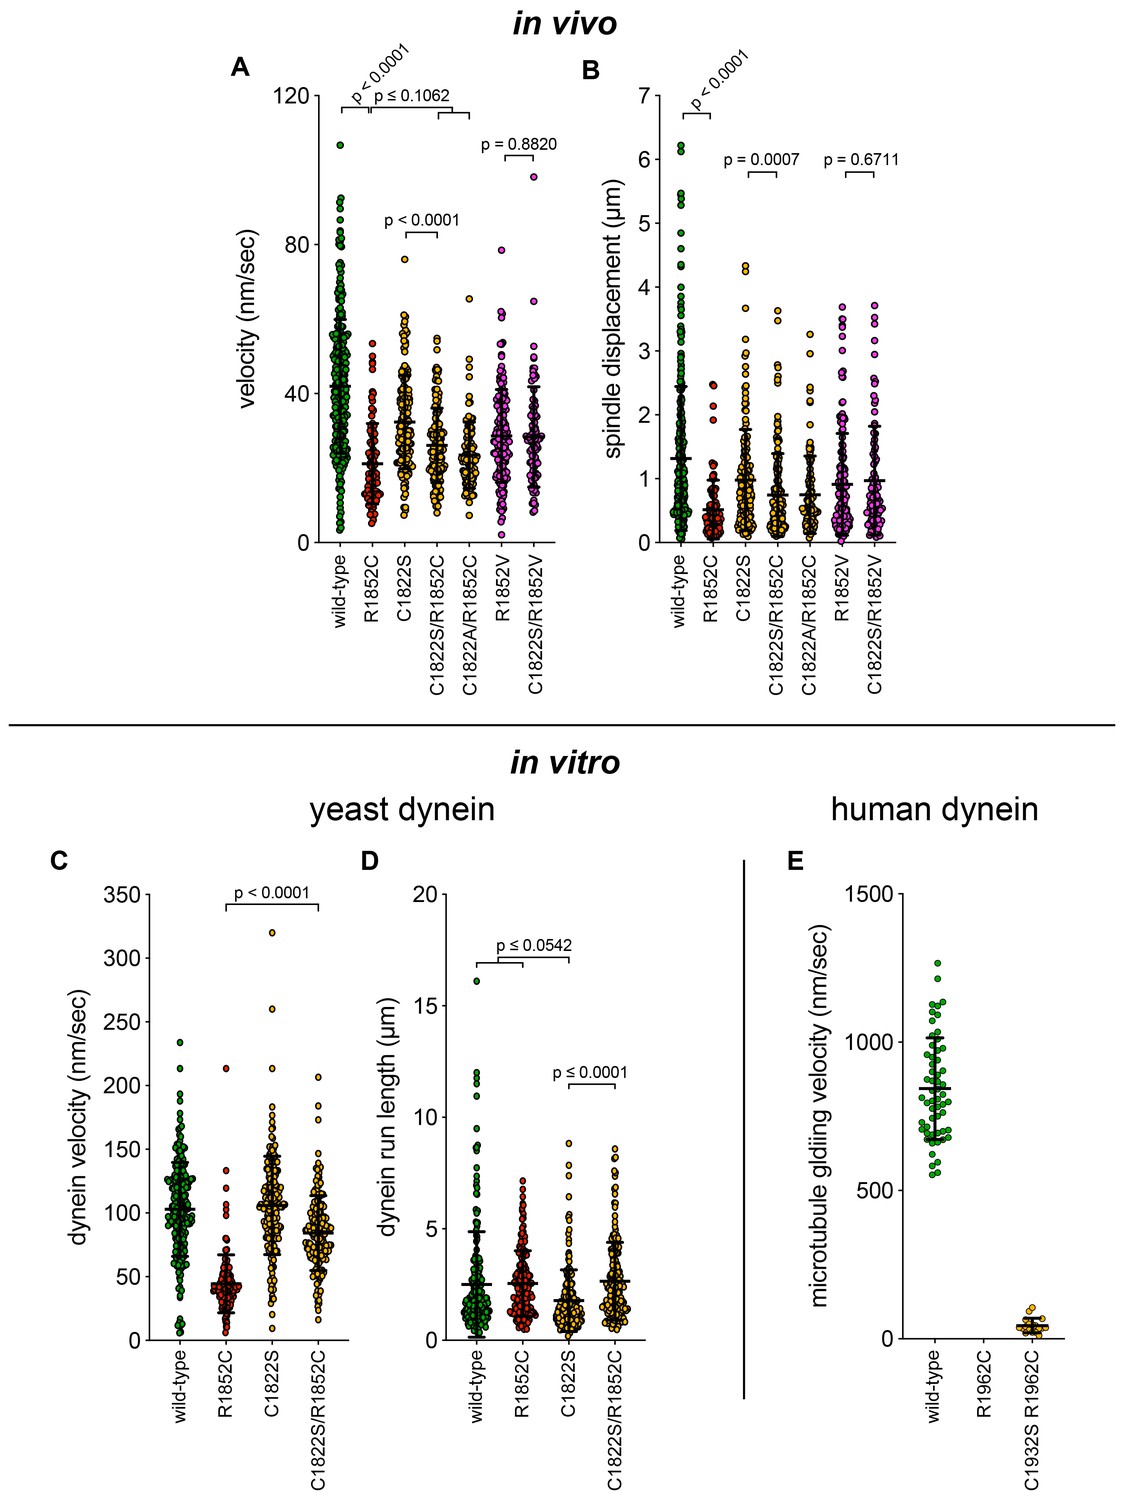
Additional plots of spindle dynamics and single molecule data.
(A and B) Scatter plots depicting the velocity and displacement (per event) obtained from the spindle dynamics assay for the indicated haploid strains (from Figure 7—figure supplement 1). Mean values and standard deviations are depicted with black lines. (C – E) Scatter plots depicting velocity, and displacement values for single molecule motility assays from Figure 7 and Figure 7—figure supplement 1. Mean values and standard deviations are depicted with black lines.
Figure 8 with 1 supplement
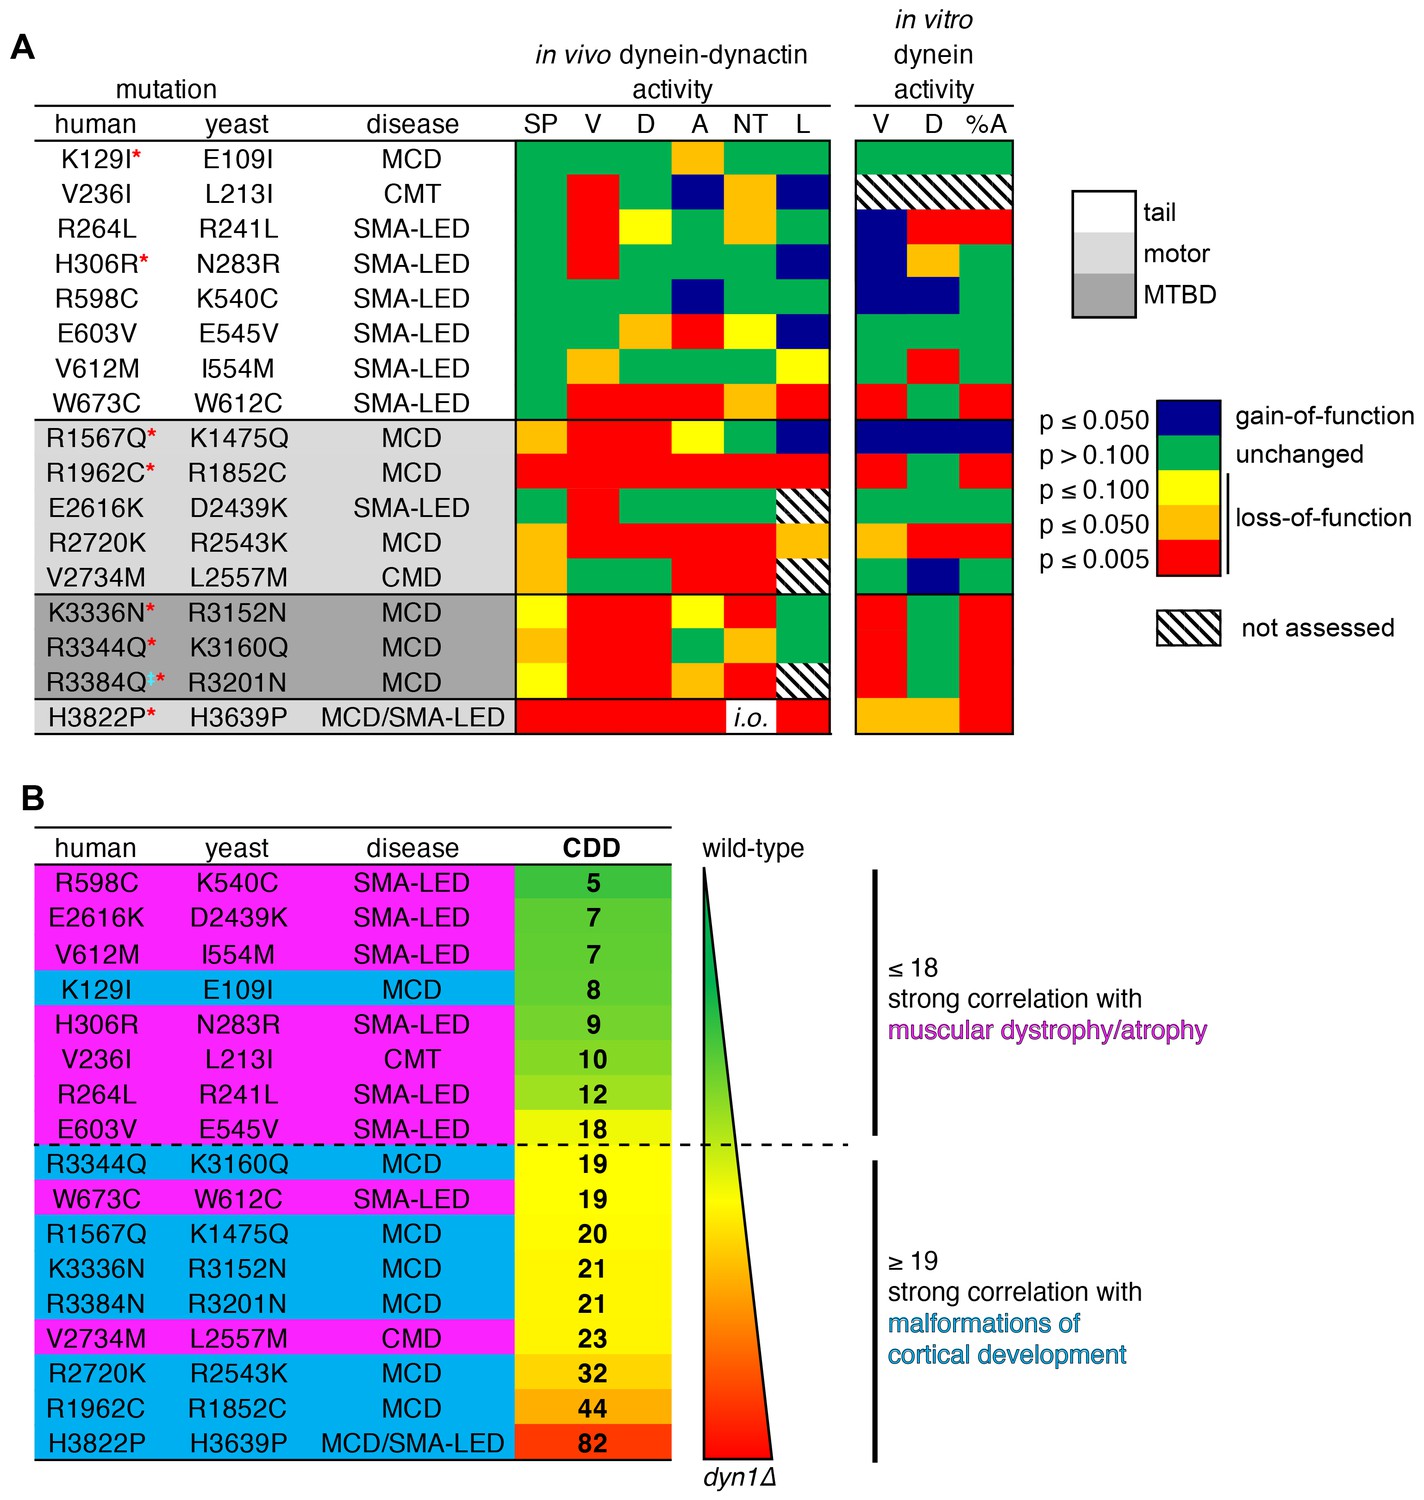
Summary of phenotypic analysis of disease-correlated mutants.
(A) Heat map depicting degree of statistical significance for difference between each mutant and wild-type cells for the indicated assays (SP, spindle positioning; V, velocity; D, displacement per event; A, activity; NT, neck transit; L, localization; %A, percent active motors; MCD, malformations in cortical development; CMT, Charcot-Marie-Tooth disease; SMA-LED, spinal muscular atrophy with lower extremity dominance; CMD, congenital muscular dystrophy). Red asterisks depict mutants that were assessed in a previous study using recombinant human dynein (Hoang et al., 2017). ‡Note that we mistakenly substituted an asparagine for residue R3201 instead of a glutamine, the latter of which was identified as correlating with MCD (Poirier et al., 2013). R3201N was used throughout this study. Deviation from wild-type cells in either the ‘total spindle displacement’ (see Figure 2E), or the ‘number of dynein-mediated spindle movements per minute’ (see Figure 2F) metric was used for the activity column (‘A’). Mutants are listed from N- to C-terminus of Dyn1 (shading indicates in which domain of Dyn1 each mutation resides). Significance was calculated as indicated in previous figure legends. (B) Each mutant ranked by their coefficient of dynein dysfunction score (CDD; see text and Figure 8—figure supplement 1). As shown, above a CDD score of ~ 18, the correlation with malformations in cortical development increases, while that with motor neuron diseases decreases. Also see Figure 8—figure supplement 1.
Figure 8—figure supplement 1
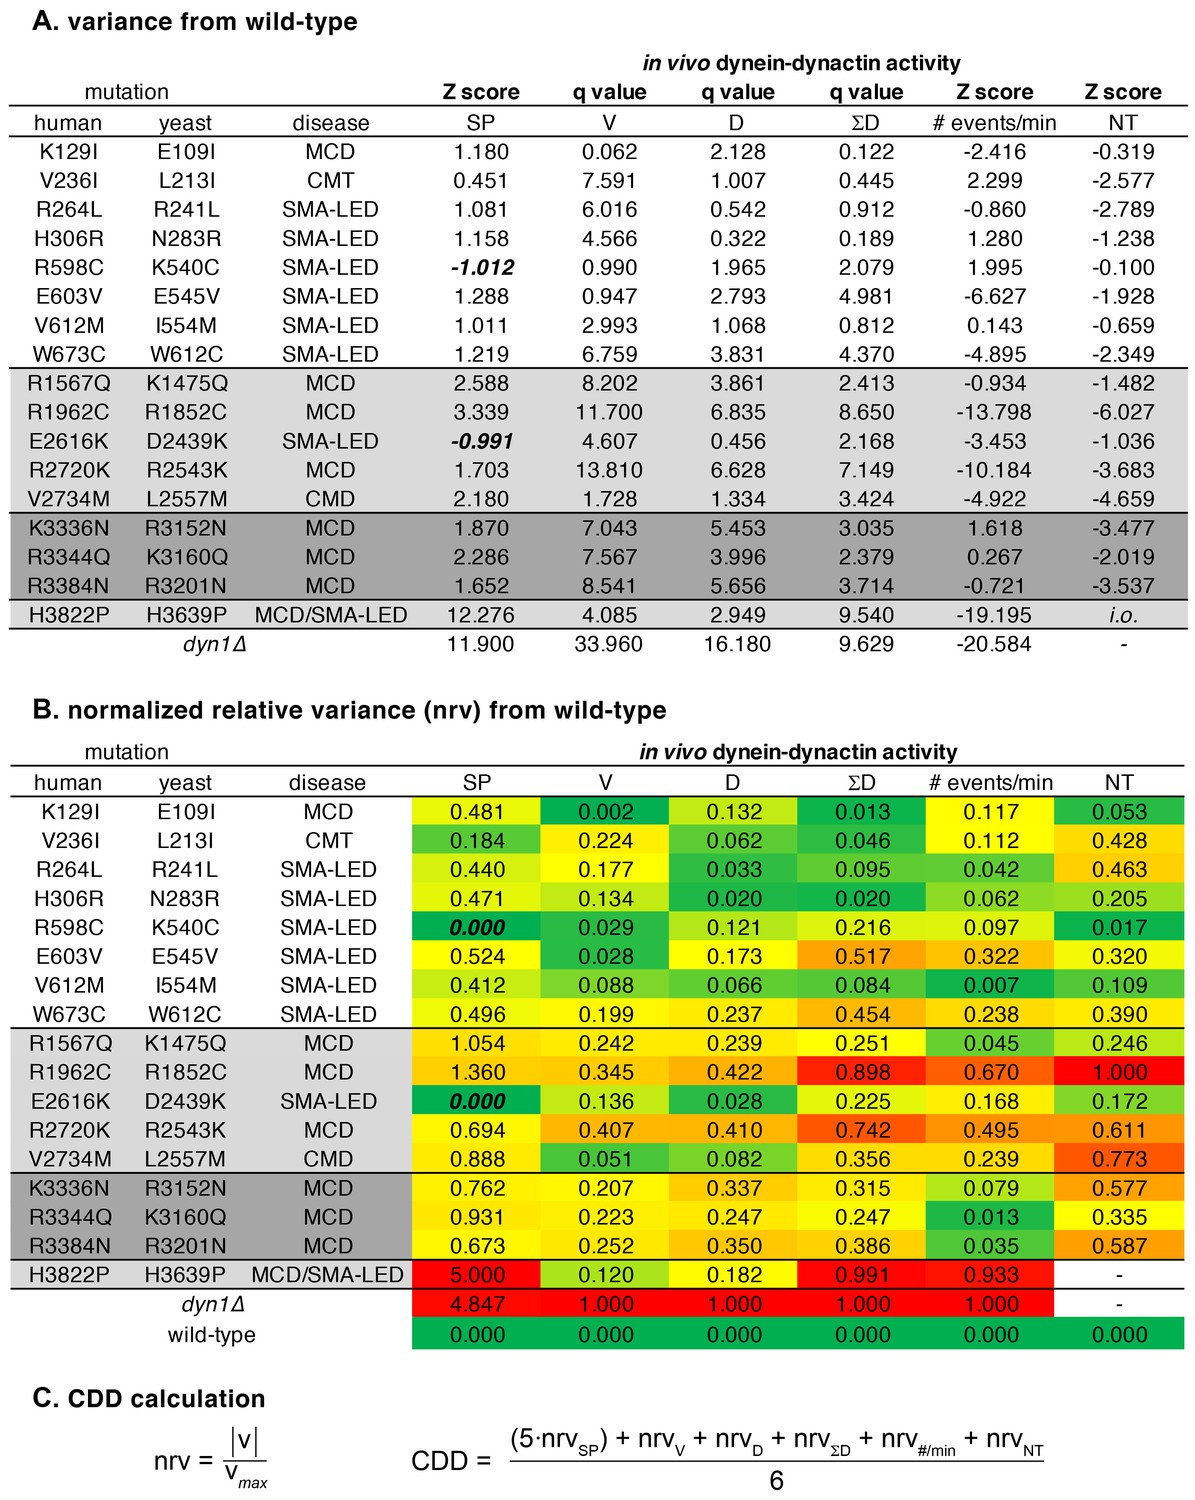
Data used for tabulation of the coefficient of dynein dysfunction (CDD).
(A) Z scores (see Materials and methods) and q values for differences between mutant and wild-type cells for each assay. Graphpad Prism was used to calculate q values (the difference between the two means divided by the standard error of that difference). (B) Relative difference between mean values (Z scores and q values, ‘v’) for mutant and wild-type cells are expressed as normalized relative variance (nrv), where nrv = |v|/vmax for each column. Colors indicate relative degree of difference between mutant and wild-type for each value. (C) Coefficient of dynein dysfunction (CDD) was calculated from the values shown in panel B. In the two cases where a value wasn’t determined (due to insufficient observations), the denominator was reduced from 6 to 5. Note that in two instances, the Z score for spindle positioning was negative (due to a lower number of mispositioned spindles being observed in K540C and D2439K cells than in wild-type cells; see Figure 1B). These two values were corrected to 0 so as to avoid them skewing the nrvSP values. Also see Materials and methods.
Additional files
-
Source code 1
Matlab Code for tracking spindles in three-dimensions.
To be used with Source code 2.
- https://doi.org/10.7554/eLife.47246.032
-
Source code 2
Supplementary Matlab Code for spindle tracking.
To be used with Source code 1 (required for defining threshold of fluorescence images).
- https://doi.org/10.7554/eLife.47246.033
-
Supplementary file 1
Yeast strains used throughout this study.
- https://doi.org/10.7554/eLife.47246.034
-
Transparent reporting form
- https://doi.org/10.7554/eLife.47246.035
Download links
A two-part list of links to download the article, or parts of the article, in various formats.
Downloads (link to download the article as PDF)
Open citations (links to open the citations from this article in various online reference manager services)
Cite this article (links to download the citations from this article in formats compatible with various reference manager tools)
Molecular basis for dyneinopathies reveals insight into dynein regulation and dysfunction
eLife 8:e47246.
https://doi.org/10.7554/eLife.47246


