Systematic identification of cancer cell vulnerabilities to natural killer cell-mediated immune surveillance
- Calico Life Sciences LLC, United States
Figures
Figure 1 with 2 supplements

A genome-scale CRISPR screen identifies modulators of NK effector functions.
(A) Overview of the genome-scale NK CRISPR screening system. (B) K562 population doublings (PDs) during the CRISPR screen, as measured by total number of live cells. Note that early timepoints from the co-culture reflect the presence of both K562 and NK-92 cells. (C) Analysis of the NK CRISPR screen results. Changes in sgRNA abundance were compared between the 2.5:1 E:T co-culture condition and day 15 dropout cells using the MAGeCK algorithm. The top 10 enriched or depleted genes are shown, as rank-ordered by MAGeCK score; other manually selected genes are highlighted with their rank indicated. FDR, false discovery rate. (D) Overview of high-scoring components of the tumor-immune synapse and IFNγ signaling pathway recovered by the screen. sgRNAs against genes enriched after exposure to NK-92 cells are marked in red, while depleted sgRNAs are marked in blue.
Figure 1—figure supplement 1
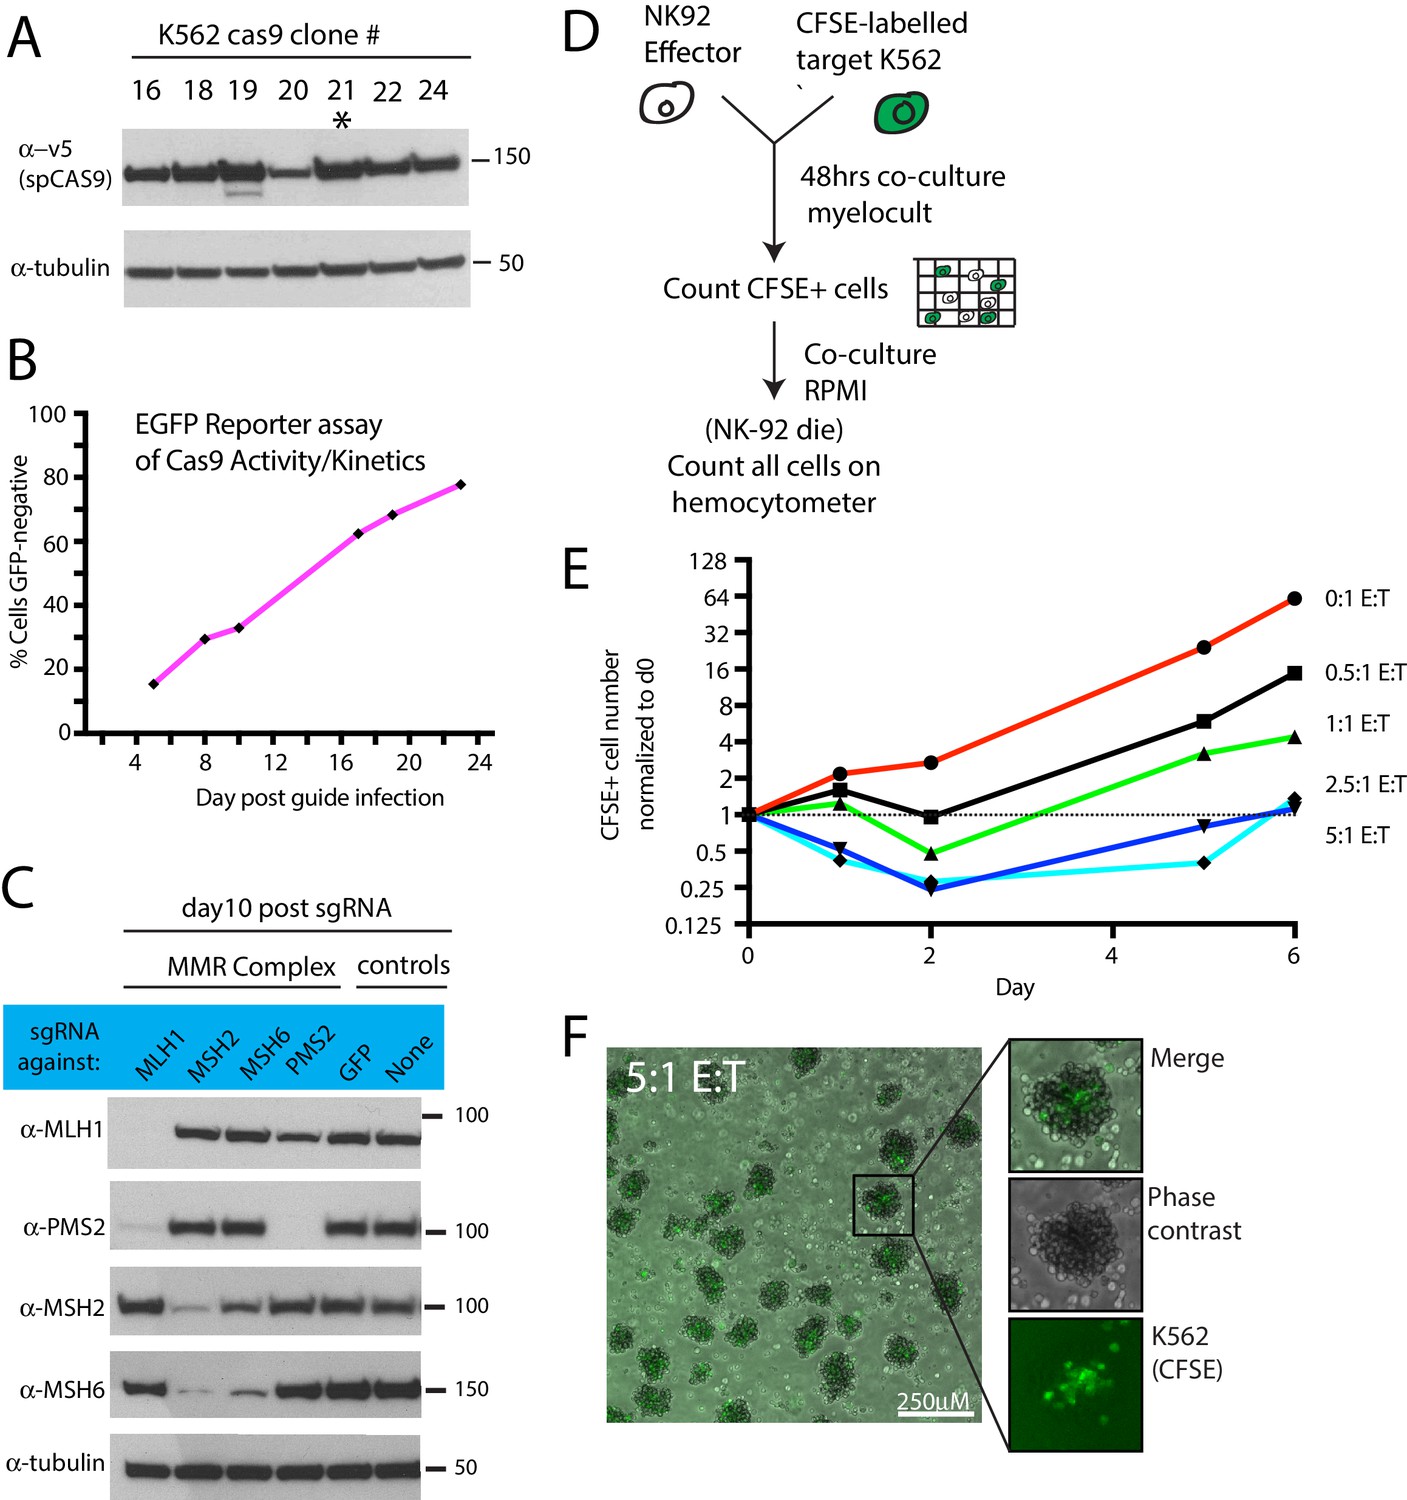
Optimization of NK CRISPR screens.
(A) Western blot showing spCas9 expression in clonal isolates of K562 cells infected with a Cas9-expressing lentivirus. Asterisk highlights the clone used for screening purposes. (B) Measurement of Cas9 activity using an EGFP disruption assay. Cas9-expressing K562 cells were infected at a low MOI with a lentivirus expressing EGFP and a sgRNA targeting EGFP. The percent of cells that lost EGFP expression was measured over time by flow cytometry. (C) Measurement of Cas9 activity using sgRNAs targeting mismatch-repair (MMR) complex members. A Cas9-expressing K562 clonal isolate was infected at a low MOI with a lentivirus expressing sgRNAs against core members of the MMR complex. Protein disruption was measured by western blot 10 days after sgRNA infection. Note that certain MMR complex members depend on other binding partners for stability. (D) Experimental design for determining selective pressure of different E:T cell ratios. K562 cells were labeled with carboxyfluorescein succinimidyl ester (CFSE) prior to co-culture with NK-92 cells. (E) Effect of increasing E:T cell ratio on total number of viable target cells over time. During early timepoints, CFSE fluorescence was used to generate target cell counts. At later timepoints, total cell counts accurately reflected target cell counts due to NK-92 cell death. (F) Representative image of NK-92:K562 co-cultures at 5:1 E:T ratio. NK-92 cells (unlabeled) form aggregate structures enveloping the target cells (green). Scale bar, 250 μM.
Figure 1—figure supplement 2
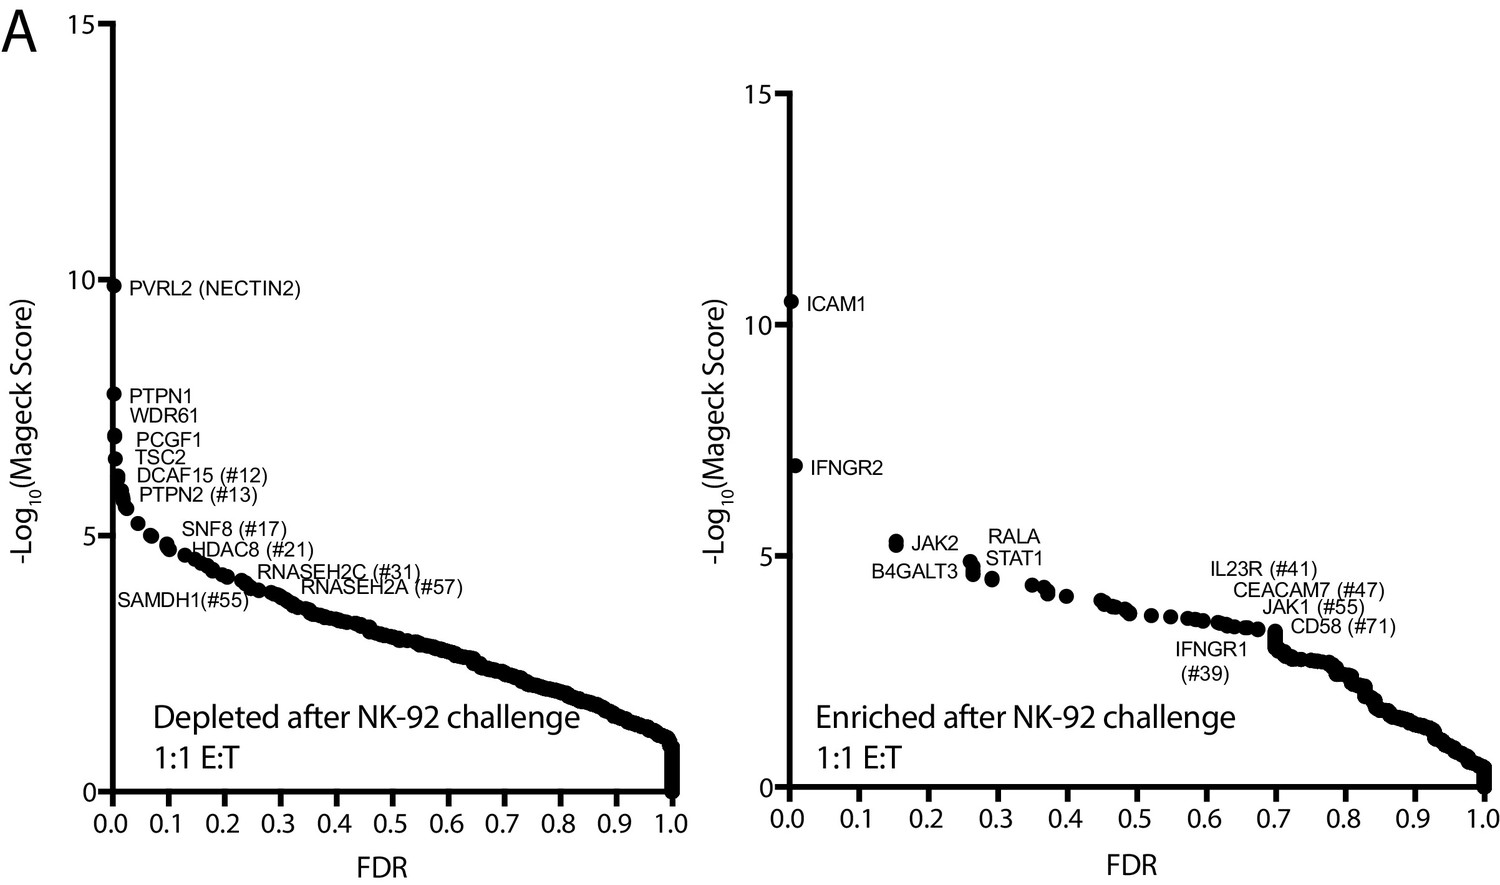
Additional NK CRISPR screen data.
(A) Analysis of the NK CRISPR screen results performed at a lower E:T ratio. sgRNA abundance was compared between the 1:1 E:T ratio co-culture condition and day 15 dropout cells using the MAGeCK algorithm. The computed false discovery rate (FDR) is plotted against the -log10 transformation of the MAGeCK score. The top five enriched or depleted genes are shown, as rank-ordered by MAGeCK score; other manually selected genes are highlighted with their rank indicated in parentheses.
Figure 2 with 1 supplement
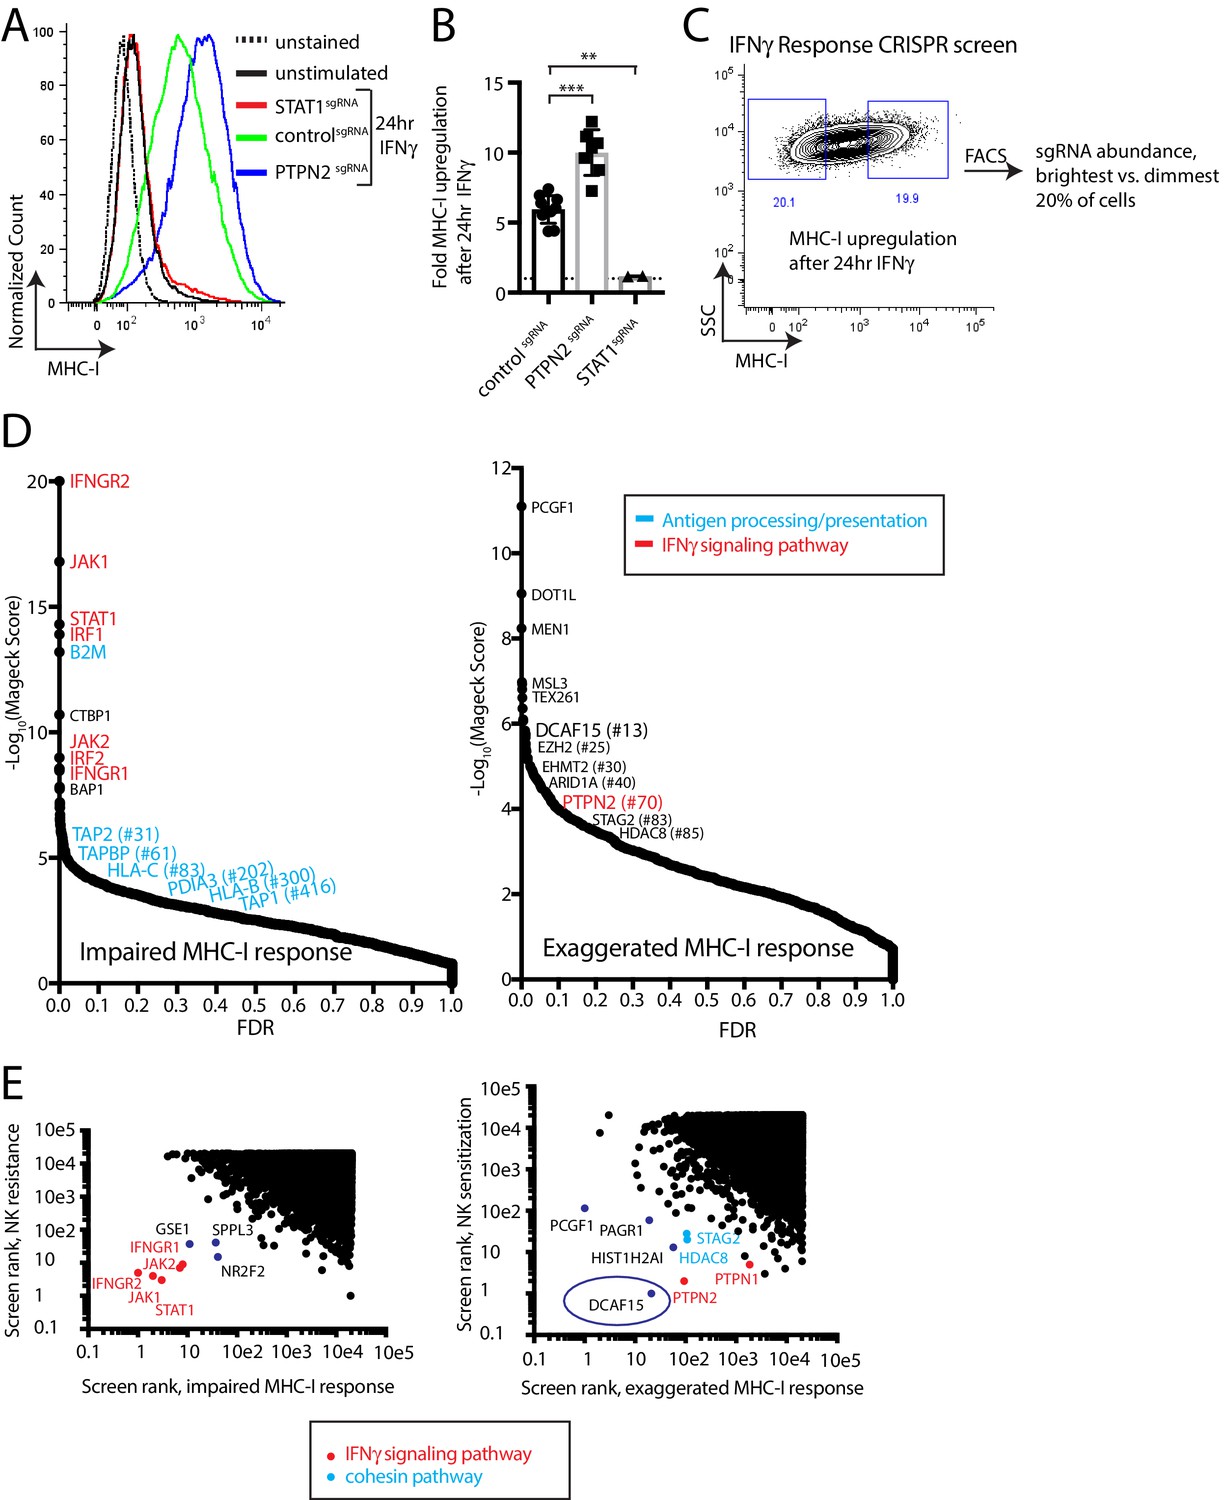
A phenotypic screen based on MHC-I upregulation to identify modulators of the IFNγ response.
(A) Flow cytometry measurement of MHC-I expression in K562 cells transduced with the indicated sgRNAs after 24 hr of 10 ng/ml IFNγ treatment. (B) Fold upregulation of MHC-I expression after IFNγ treatment in K562 cells transduced with the indicated sgRNAs. Mean and standard deviation are shown. ***p value=0.0002, **p value=0.03, Mann-Whitney test. (C) Design of CRISPR screen for IFNγ-induced upregulation of MHC-I expression. SSC, side-scatter. (D) Analysis of the MHC-I upregulation CRISPR screen results. The MAGeCK algorithm was used to compare sgRNA abundance between cells in the bottom two and top two deciles of MHC-I expression. The false discovery rate (FDR) is plotted against the -log10 transformation of the MAGeCK score. The top 5 to 10 enriched or depleted genes are shown, as rank-ordered by MAGeCK score; other manually selected genes are highlighted with their rank indicated in parentheses. (E-F) Comparison of the NK and MHC screening results. Results of each screen were rank-ordered based on their MAGeCK score. Select genes are highlighted.
Figure 2—figure supplement 1
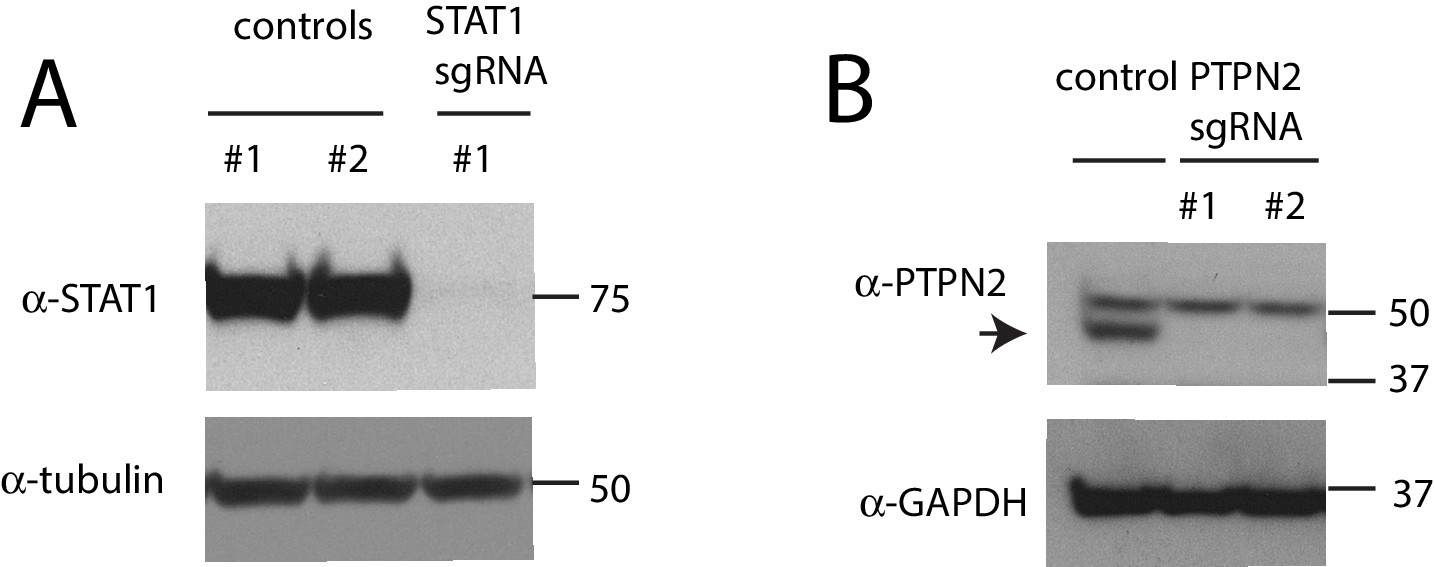
Confirmation of gene disruption in K562 cells.
(A) Western blot of total STAT1 levels in K562 cells infected with control or STAT1 sgRNAs. (B) Western blot of PTPN2 levels in K562 cells infected with control or PTPN2 sgRNAs.
Figure 3 with 2 supplements

Disruption of the E3 ubiquitin ligase substrate adaptor DCAF15 enhances NK effector functions.
(A) Experimental design of competitive co-culture experiments, with FACS data illustrating a hypothetical sgRNA that enhances NK-mediated target cell clearance. (B) Representative results from NK-92:K562 competitive co-culture experiments performed at a 2.5:1 E:T ratio. (C) Results of competitive co-culture performed at a 2.5:1 E:T ratio and measured 48–96 hr after challenge of K562 cells with NK-92 cells. Mean and standard deviation are shown. *** p-value<0.0001, Mann-Whitney test. (D) Results of competitive co-culture performed at a 1:1 E:T ratio and measured 48–96 hr after challenge of K562 cells with IL-2 activated isolated peripheral NK cells. ** p-value<0.01, * p-value=0.06, Wilcoxon matched-pairs signed rank test. (E) Results of competitive co-culture performed at a 2.5:1 E:T ratio and measured 48–96 hr after challenge of Daudi cells with NK-92 cells. Mean and standard deviation are shown. *** p-value<0.0001, ** p-value=0.0022, * p-value=0.09, Mann-Whitney test. F)Flow cytometry analysis of NK cell degranulation (cell surface CD107A expression) after 2 hr coculture of primary NK cells with indicated target cell types at 2.5:1 E:T ratio. Line indicates median value. ** p-value=0.095, * p-value=0.067, NS p-value>0.10, Mann-Whitney test.
Figure 3—figure supplement 1
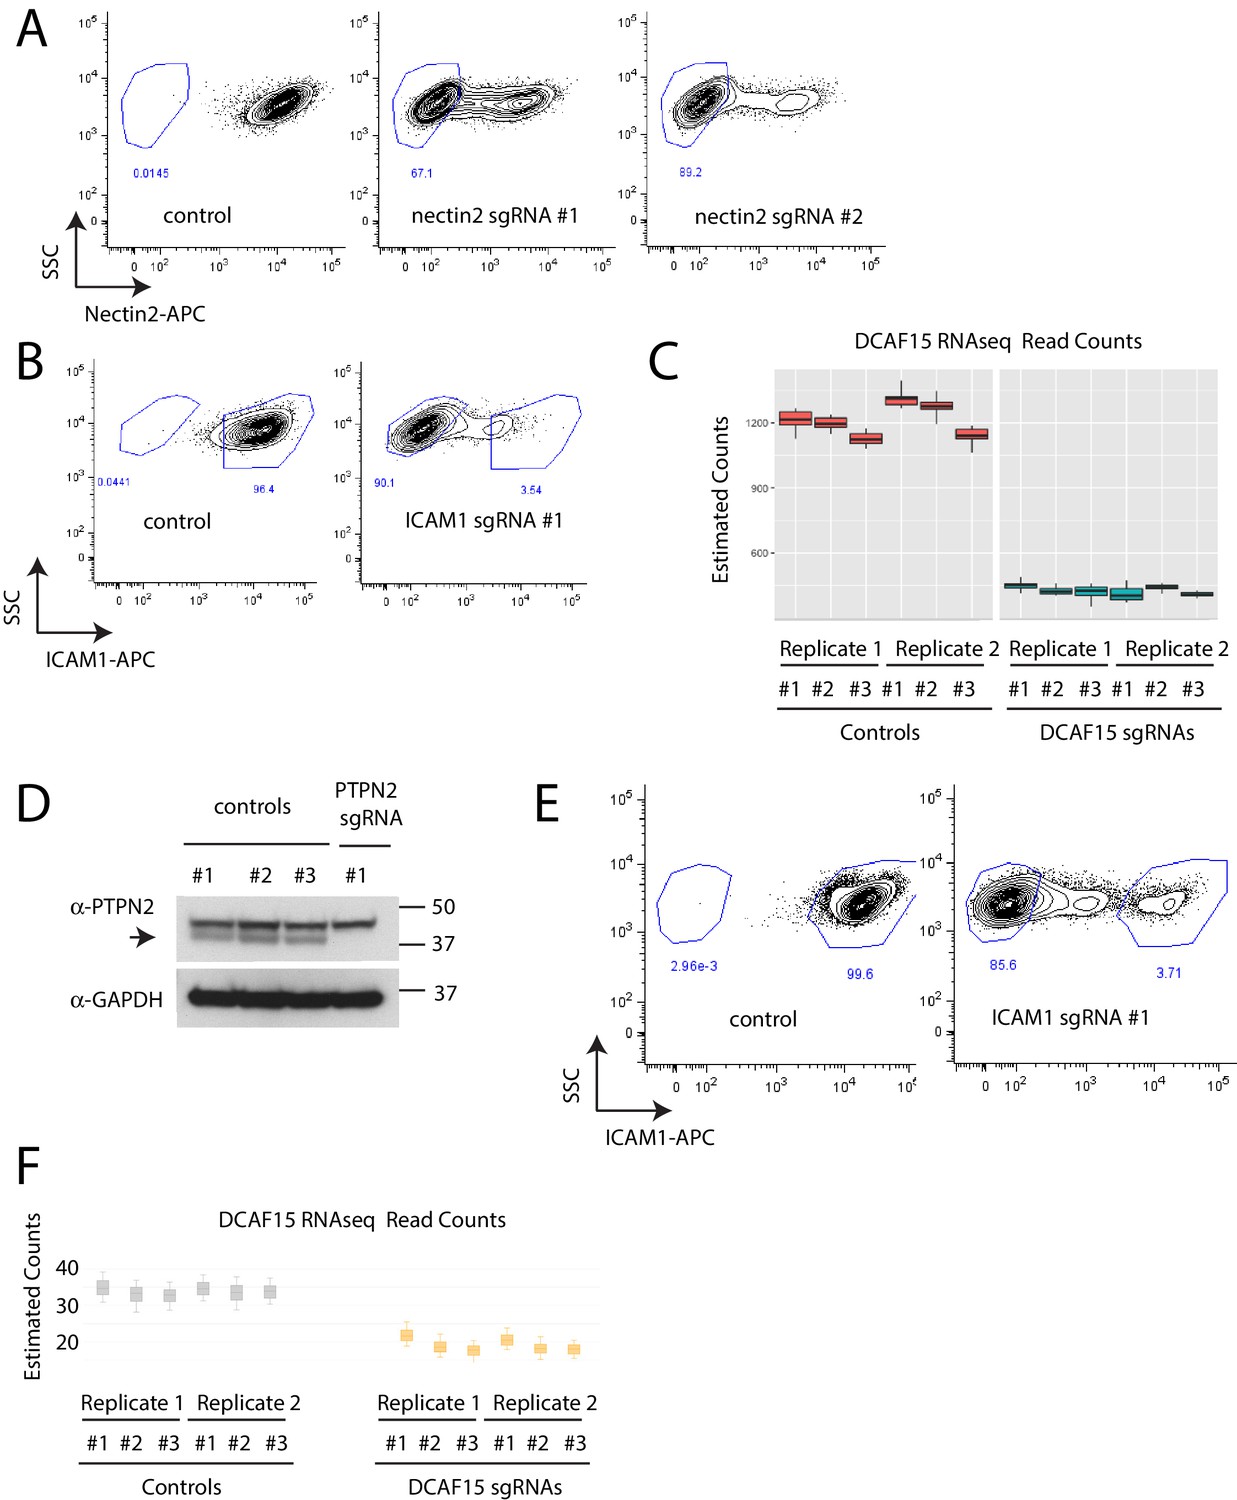
Confirmation of gene disruption in K562 and Daudi cells.
(A) Measurement of cell surface NECTIN2 expression by flow cytometry in K562 cells expressing control or NECTIN2 sgRNAs. Gates show background levels of fluorescence. (B) Measurement of cell surface ICAM1 expression by flow cytometry in K562 cells expressing control or ICAM1 sgRNAs. Gates show background levels of fluorescence. (C) Measurement of DCAF15 mRNA expression by RNAseq in K562 cells transduced with control or DCAF15 sgRNAs. (D) Western blot of PTPN2 levels in Daudi cells infected with control or PTPN2 sgRNAs. (E) Measurement of cell surface ICAM1 expression by flow cytometry in Daudi cells expressing control or ICAM1 sgRNAs. Gates show background levels of fluorescence. (F) Measurement of DCAF15 mRNA expression by RNAseq in Daudi cells transduced with control or DCAF15 sgRNAs.
Figure 3—figure supplement 2
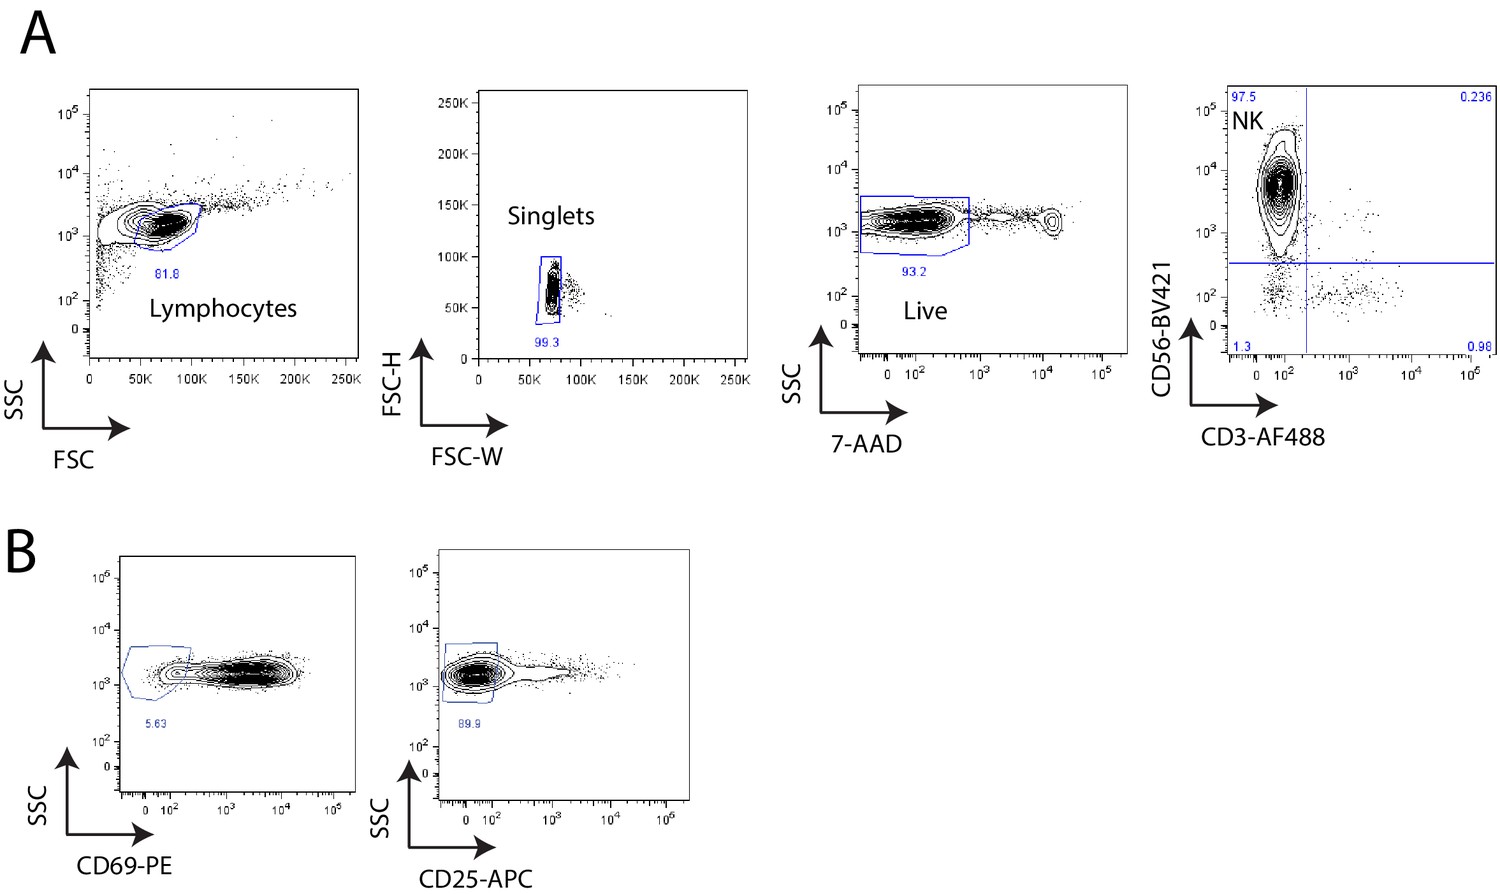
Co-culture of primary NK cells with K562 cells.
A)Flow cytometry analysis of purity of isolated peripheral NK cells 24 hr after IL-2 stimulation. B)Flow cytometry analysis of activation status of CD3-CD56+ NK cells after 24 hr of IL-2 stimulation.
Figure 4 with 1 supplement
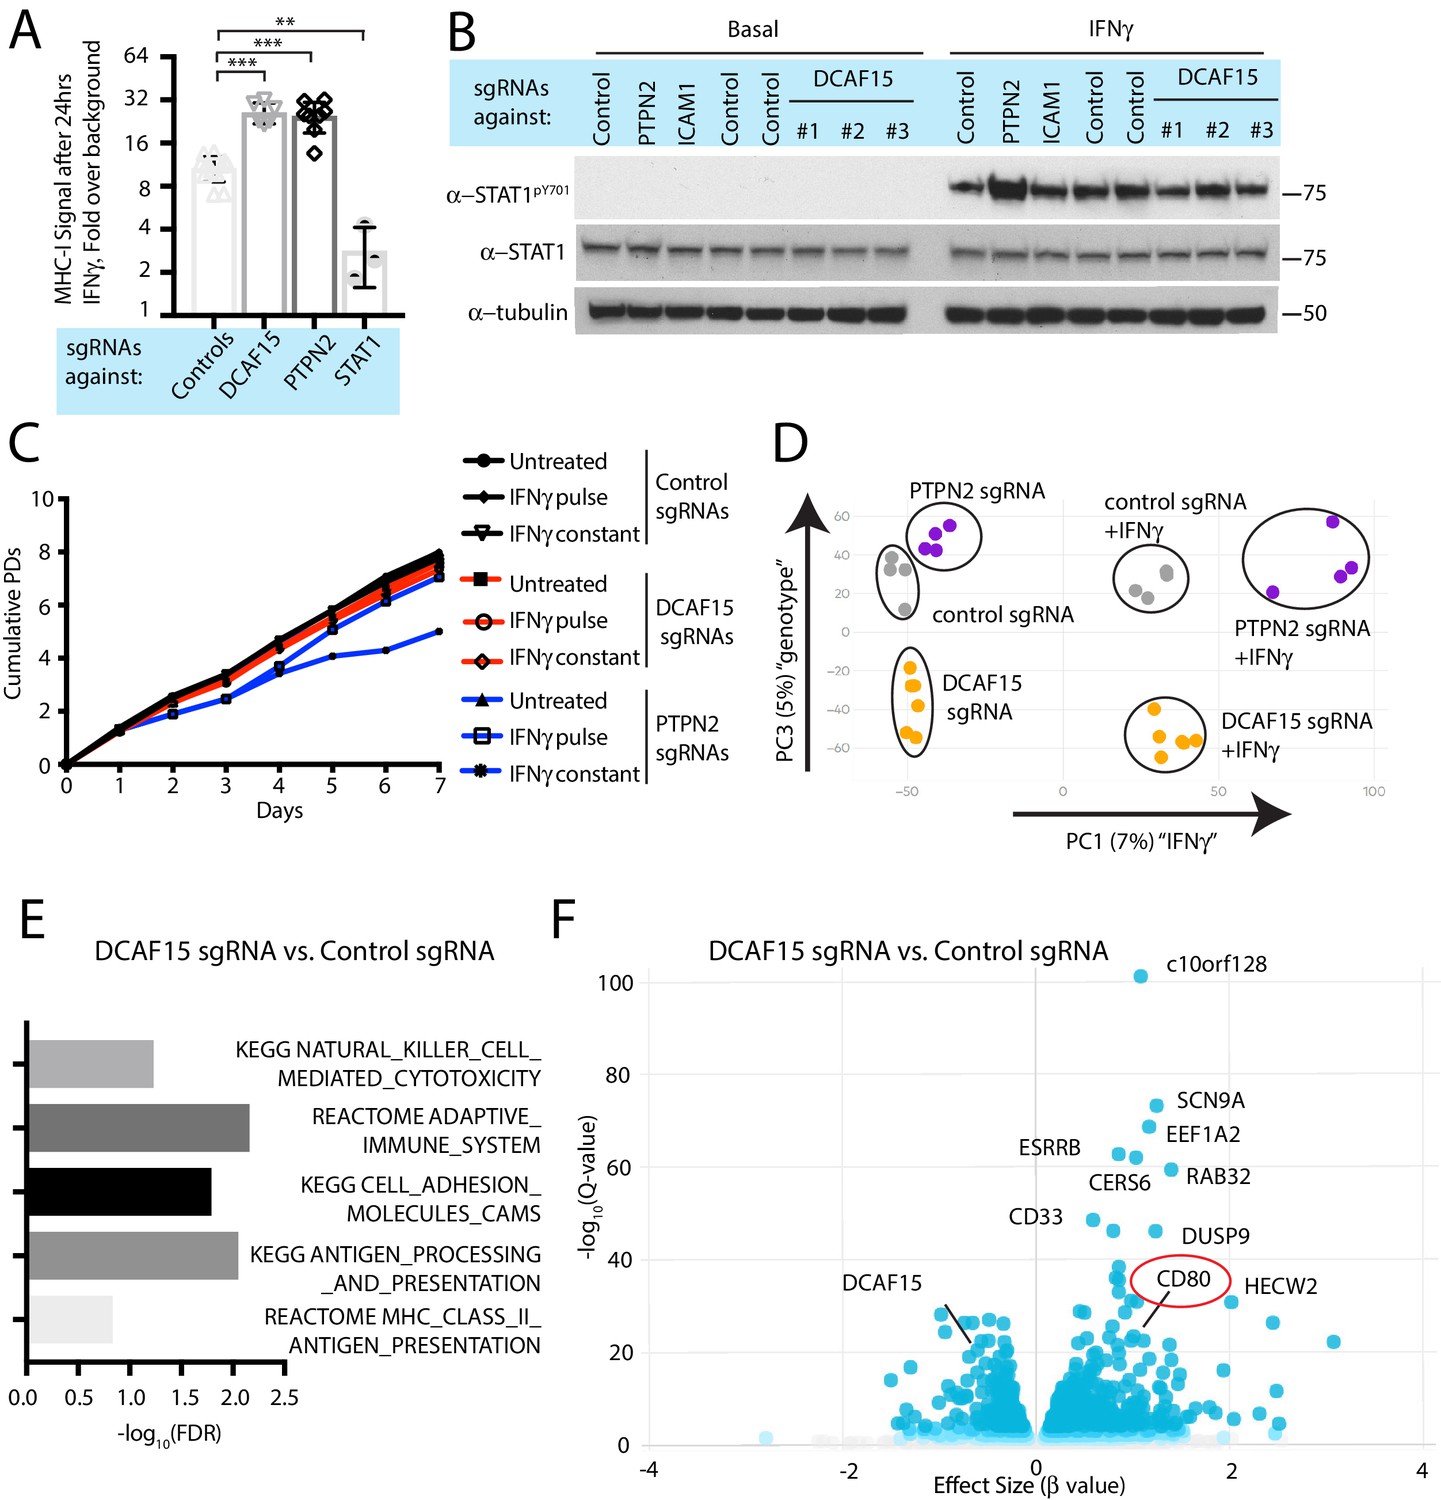
DCAF15 disruption leads to an inflamed state distinct from dysregulated IFNγ-JAK-STAT signaling.
(A) Flow cytometry measurement of cell surface MHC-I expression in K562 cells transduced with the indicated sgRNAs after 24 hr of 10 ng/ml IFNγ treatment. ***p<0.0001; **p=0.0044, Mann-Whitney test. (B) Western blots illustrating total and phosphorylated STAT1 after 30 min of 1 ng/ml IFNγ treatment in K562 cells infected with the indicated sgRNAs. (C) Growth rate of K562 cells expressing the indicated sgRNAs, cultured under basal conditions (‘untreated’), treated 24 hr with 10 ng/ml IFNγ (‘IFNγ pulse’), or continuously retreated with 10 ng/ml IFNγ every day (‘IFNγ constant’). (D) Principle component analysis (for principle components (PC) 1 and 3) of transcriptomes from K562 cells expressing the indicated sgRNAs and treated + /- 10 ng/ml IFNγ for 24 hr. (E) Selected GO terms, identified by RNA-seq, enriched in DCAF15 KO cells. Negative log10 transformation of the Benjamini-Hochberg corrected P value. (F) Volcano plot of genes differentially expressed between DCAF15 KO cells compared to control KO cells. Selected genes are highlighted. The FDR-corrected P-value generated from a likelihood ratio test (Q-value) is plotted against an approximate measure of the fold change in expression (Beta value).
Figure 4—figure supplement 1
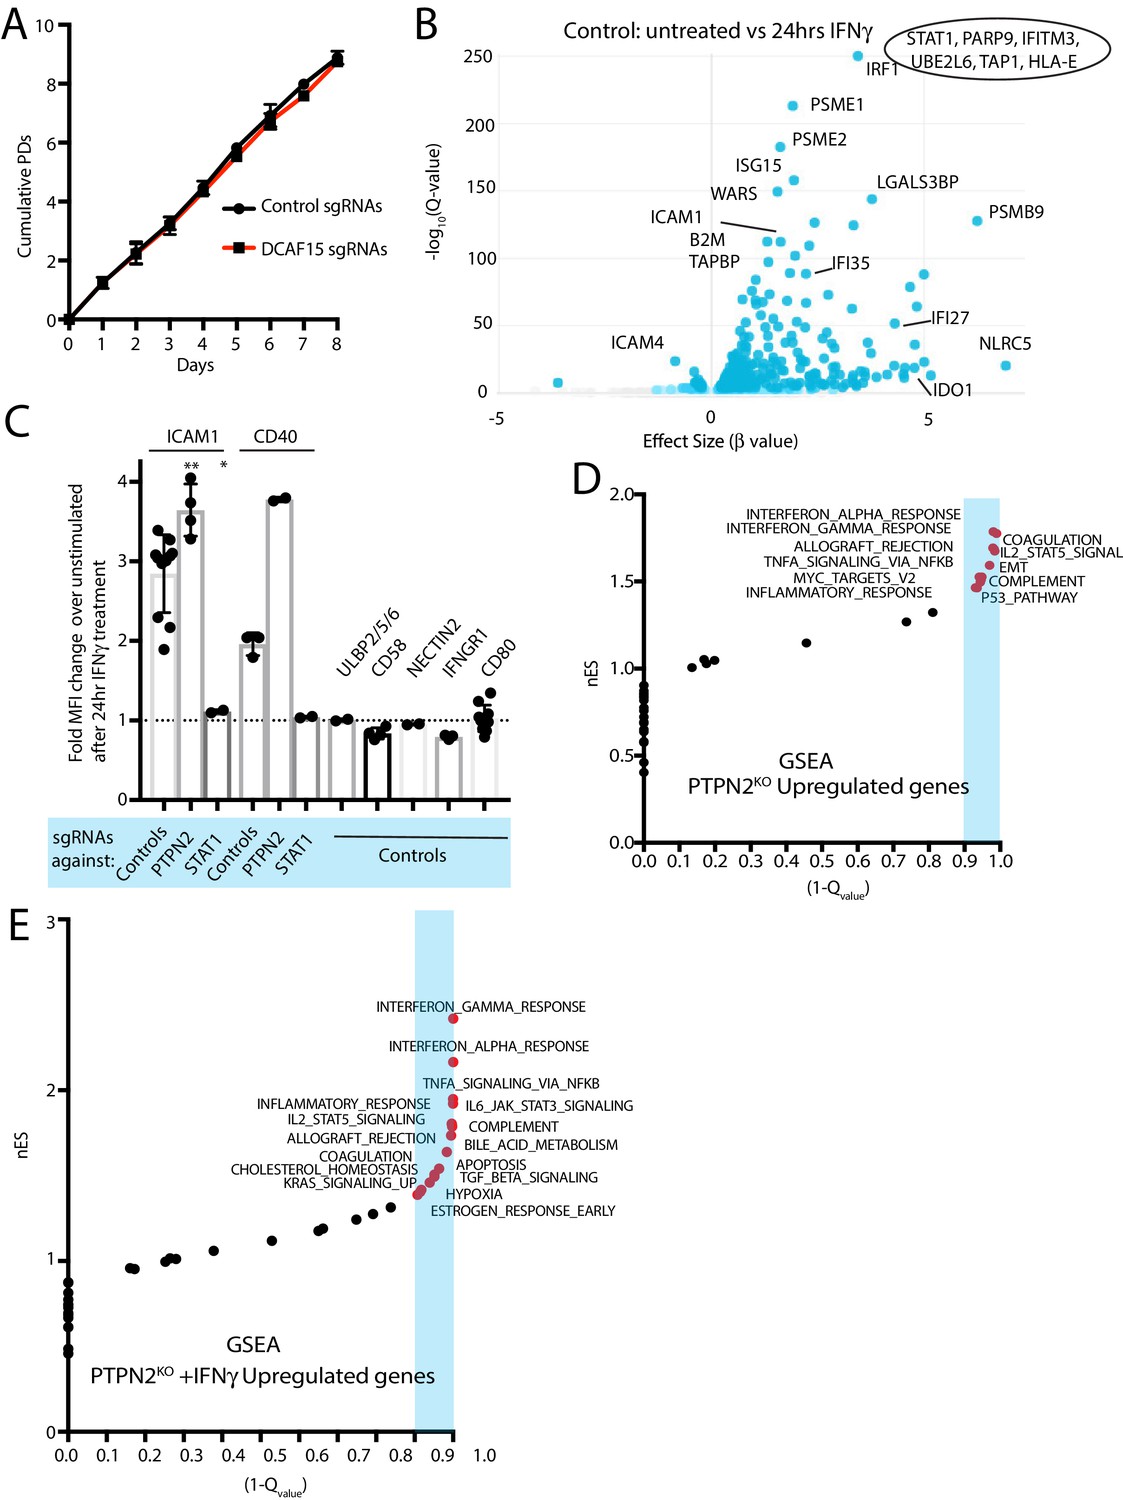
Transcriptional responses of K562 DCAF15 KO and PTPN2 KO cells to IFNγ.
(A) Growth rate of K562 cells expressing sgRNAs against DCAF15 or a control gene. Results from 2 to 3 independent experiments and 2–3 different sgRNAs per gene. Mean and standard deviation are shown. DCAF15 sgRNAs, 1.1+ /- 0.01 population doublings per day. Control sgRNAs, 1.13+ /- 0.03 population doublings per day. (B) Volcano plot of genes differentially expressed in control K562 cells after 24 hr of IFNγ treatment. Selected genes are highlighted. Genes that were off-scale and could not be plotted are shown in the oval. The FDR-corrected P-value generated from a likelihood ratio test (Q-value) is plotted against an approximate measure of the fold change in expression (Beta value). (C) Flow cytometry analysis of the change in cell surface expression of the indicated cell surface markers in K562 cells transduced with the indicated sgRNAs after 24 hr of 10 ng/ml IFNγ treatment. **p value=0.003, *p value=0.026, Mann-Whitney test. (D) Gene set enrichment analysis (GSEA) of genes differentially upregulated in PTPN2 KO cells. nES, normalized enrichment score. Categories with a FDR Q-value of <0.1 are shaded in blue. E)GSEA of genes differentially upregulated in PTPN2 KO cells after IFNγ treatment.
Figure 5 with 1 supplement
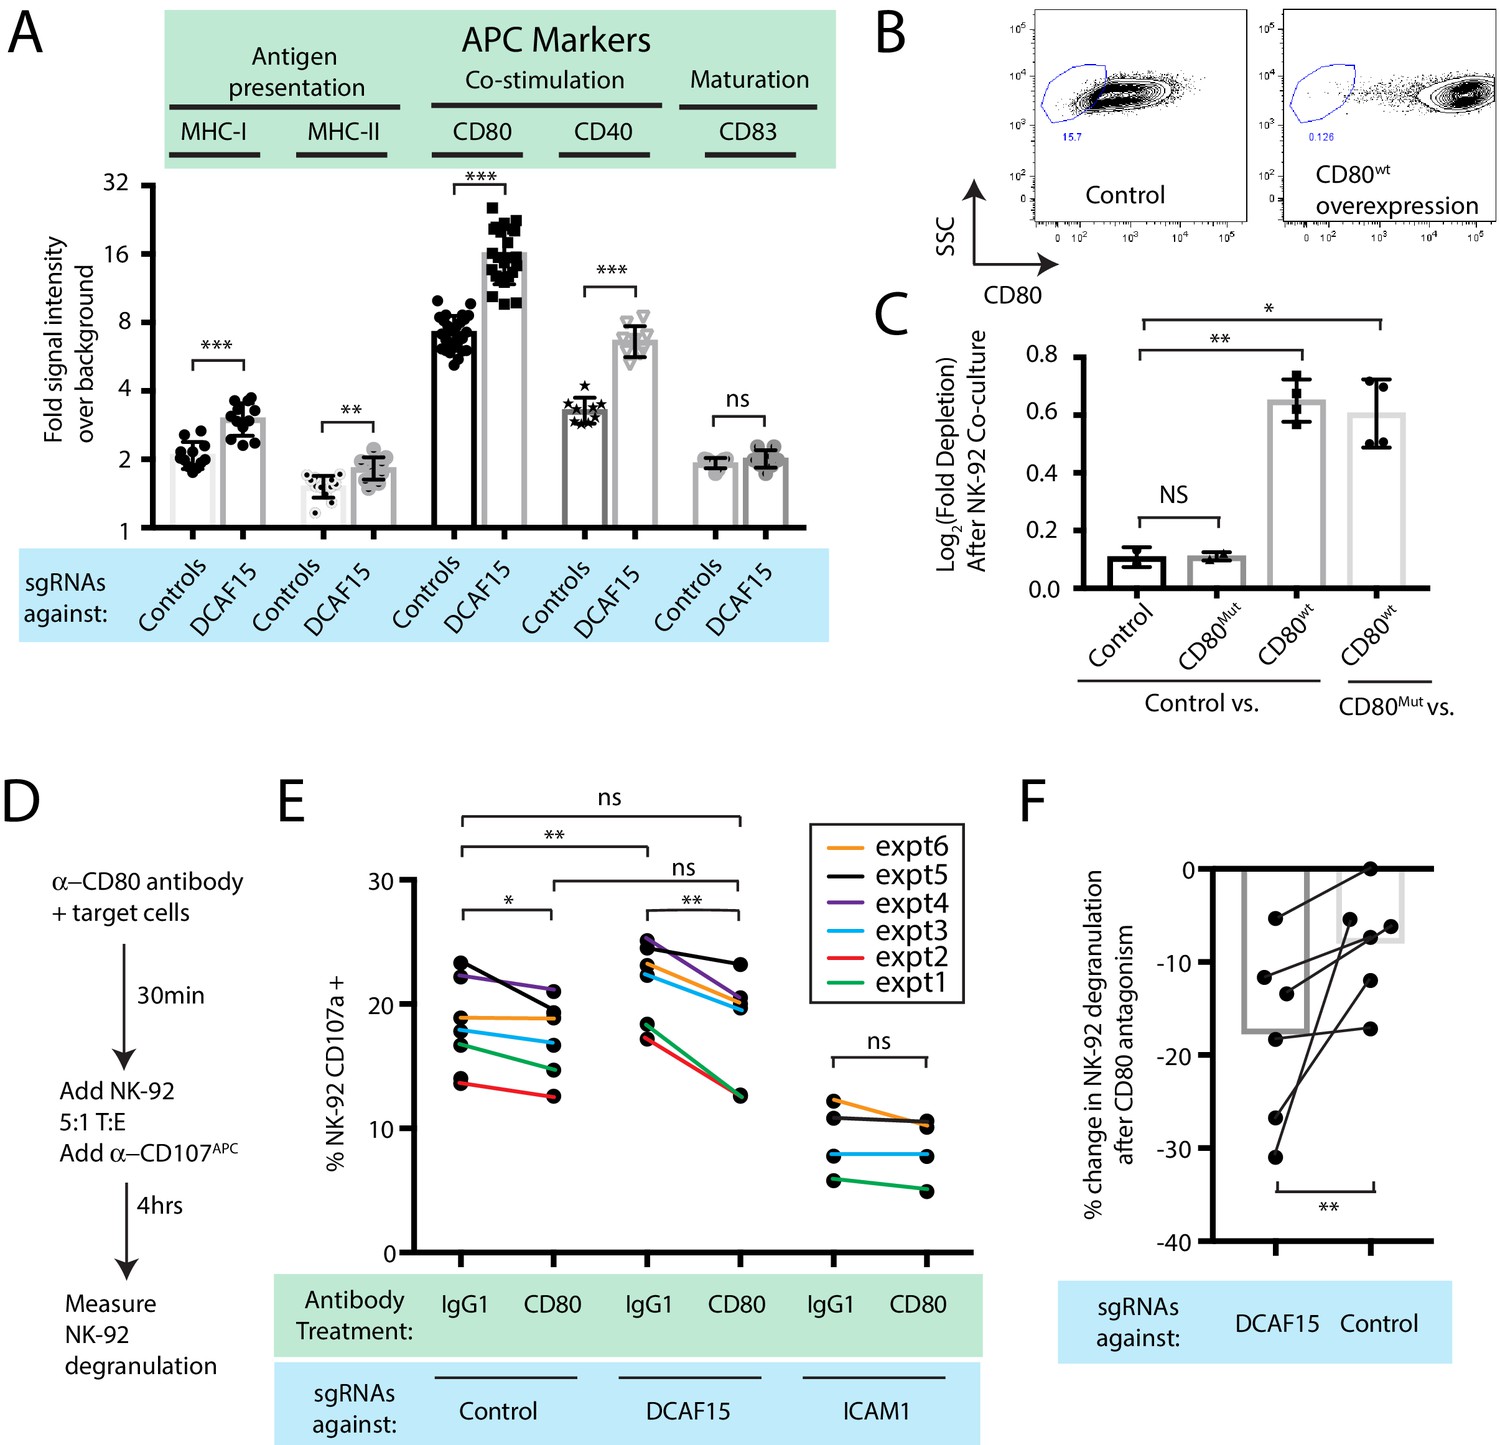
DCAF15 knockout cells enhance NK-92 triggering via CD80 expression.
(A) Flow cytometry measurements of the indicated cell surface markers in K562 cells expressing the indicated sgRNAs. N = 9–24 samples per condition. ***p<0.0001, **p=0.001, ns p>0.1, Mann-Whitney Test. (B) Flow cytometry measurement of CD80 surface expression in control K562 cells or those transduced with lentivirus to overexpress CD80. Gate shows level of background fluorescence in unstained cells. (C) Results of competitive co-culture between indicated K562 cell types and NK-92 cells, performed at 1:1 E:T ratio. K562 cells were unmanipulated (‘control’) or overexpressed wild-type CD80 (CD80wt) or mutant CD80 (CD80mut; contains Q65A and M72A point mutations that abrogate CD28 binding). *p=0.005, **p=0.0007, NS p>0.1, unpaired T test. (D) xperimental design of CD80 blockade experiment. (E) Effect of blocking antibodies to CD80 on NK-92 activation, measured by CD107 flow cytometry on NK-92 cells after 4 hr of co-culture. Data points from experiments performed on the same day are joined by lines of the same color. **p=0.03, *p=0.06, ns p>0.1, Wilcoxon matched-pairs signed rank test. Experiment performed four times, 2x sgRNAs per condition. (F) Percent decrease in NK-92 degranulation after CD80 antibody treatment of indicated target cells. Data points from experiments performed same day are joined by lines. Mean is indicated. **p=0.03, Wilcoxon matched-pairs signed rank test.
Figure 5—figure supplement 1
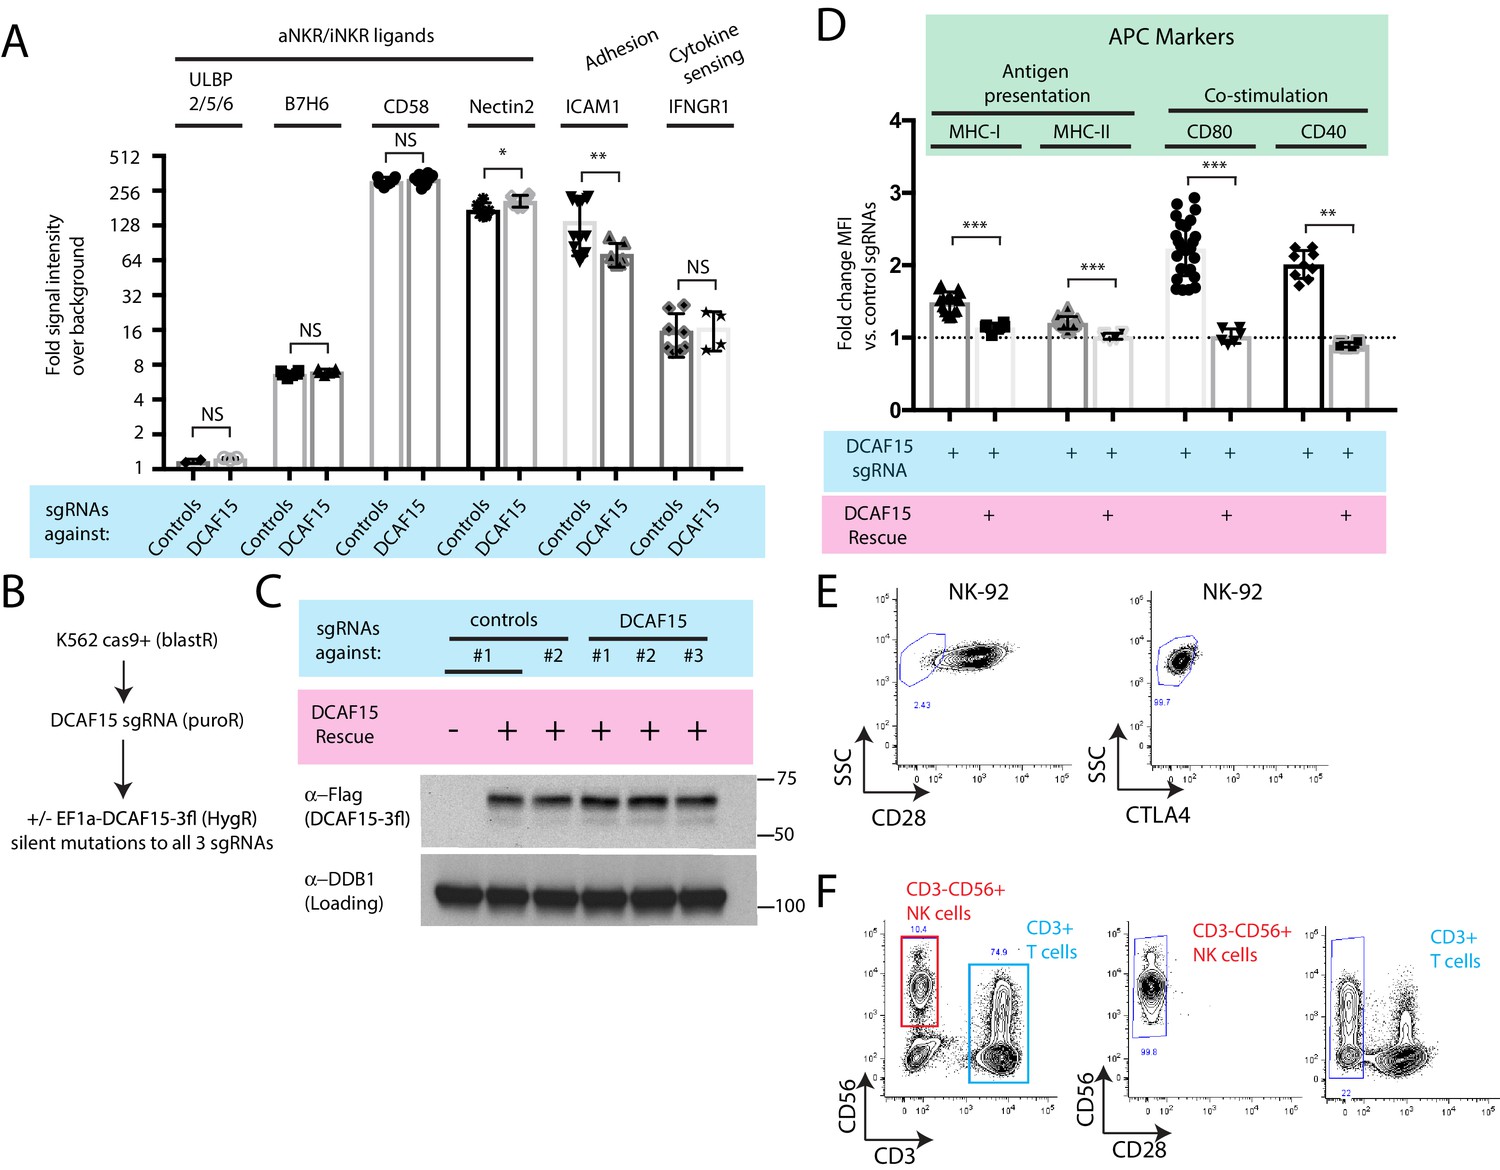
Additional immunophenotypic characterization of K562 DCAF15 KO cells.
(A) Flow cytometry measurements of the indicated cell surface markers in K562 cells expressing the indicated sgRNAs. N = 2–14 samples per condition. Ns p>0.1, *p=0.04, **p=0.01, Mann-Whitney Test. (B) Experimental design for rescuing DCAF15 disruption in K562 by lentiviral expression of a sgRNA-resistant DCAF15 open reading frame. (C) Western blot of DCAF15 rescue construct expression. (D) Flow cytometry measurements of the indicated cell surface markers in K562 cells expressing the indicated sgRNAs and rescue constructs. N = 6–24 samples per condition. ***p<0.0001, **p=0.004, Mann-Whitney test. (E) Flow cytometry measurement of CTLA4 and CD28 expression on NK-92 cells. Gates show background fluorescence levels in unstained cells. (F) Flow cytometry measurement of CD28 expression in peripheral unstimulated NK cells.
Figure 6 with 1 supplement
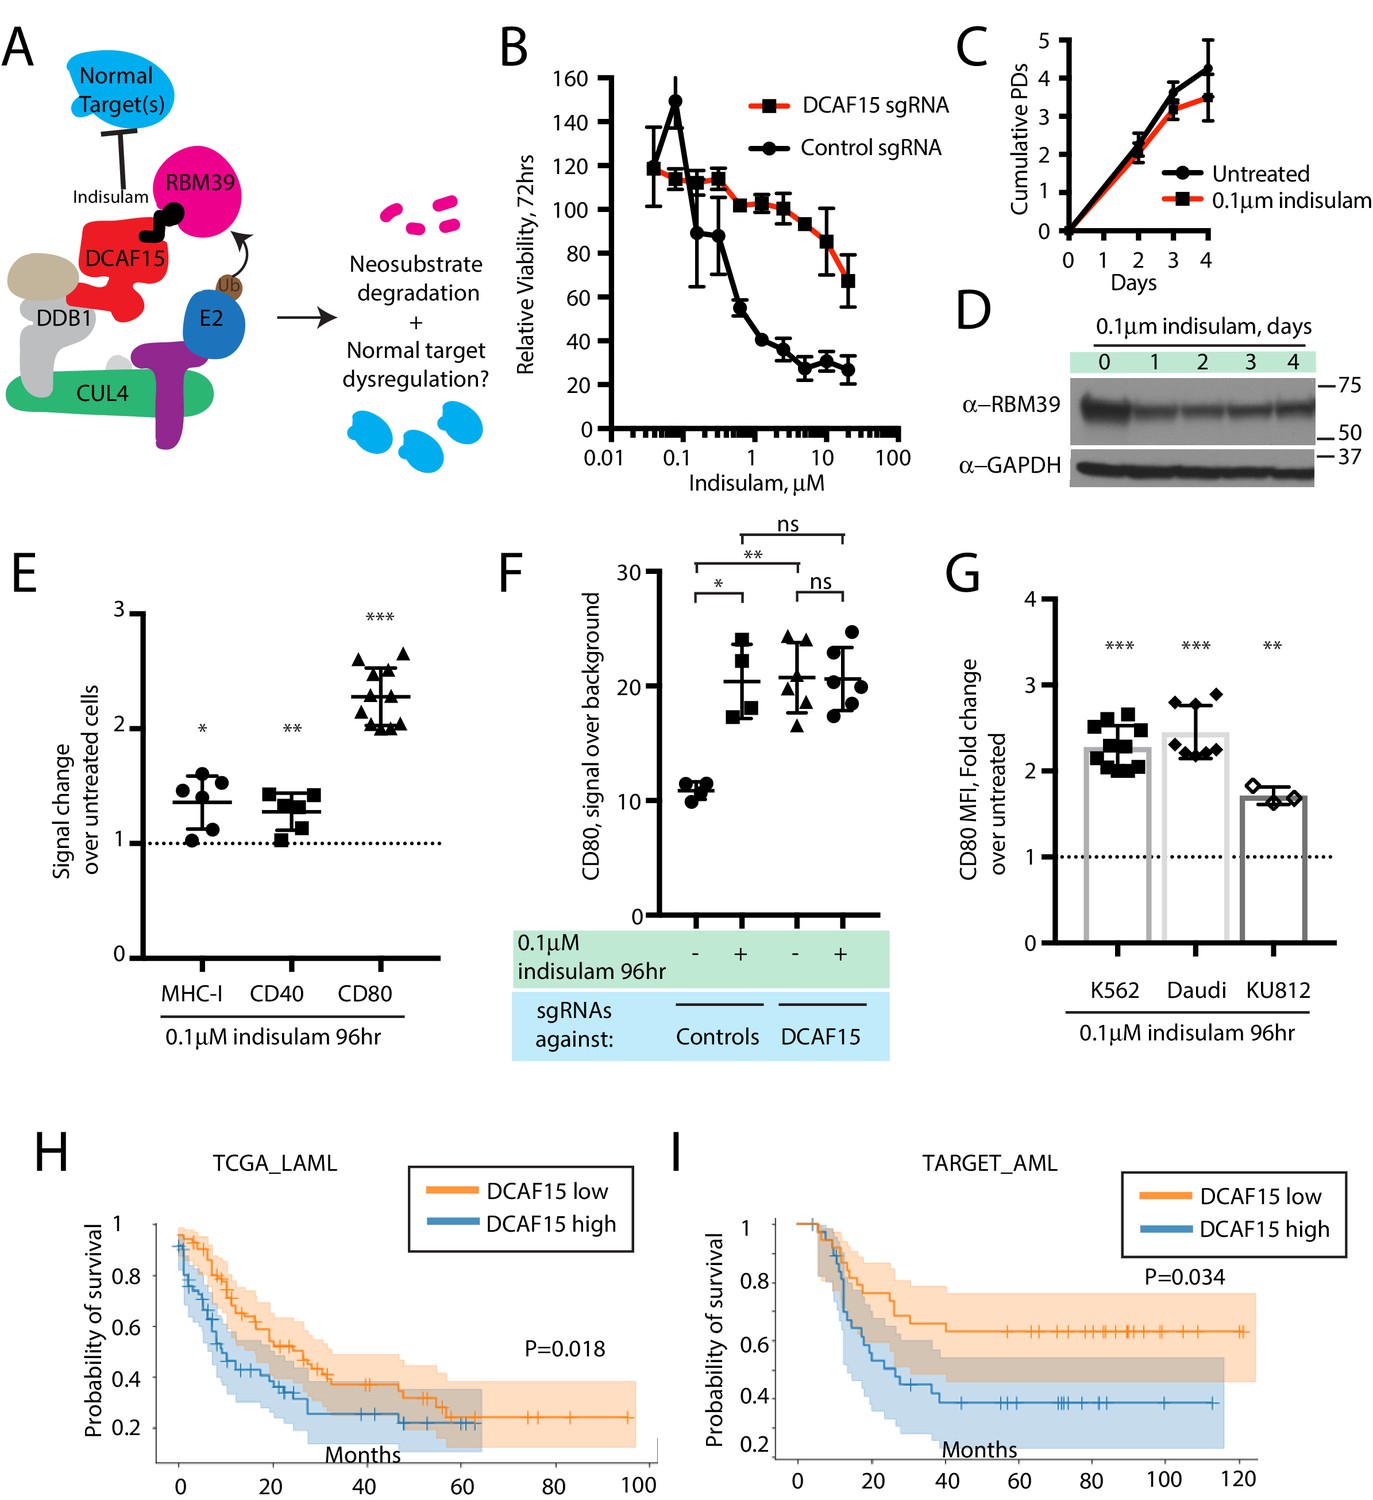
The anti-leukemia drug indisulam inhibits DCAF15 function.
(A) Proposed model for DCAF15 gain- and loss-of-function phenotypes triggered by indisulam treatment. (B) Dose response of K562 cells expressing the indicated sgRNAs to indisulam. Relative viability measured by ATP content. N = 2 experiments. Mean and standard deviation are shown. (C) Growth of K562 cells treated with 0.1 μM indisulam over 4 days. N = 12 per timepoint. Mean and standard deviation are shown. (D) Western blot for total RBM39 levels in K562 cells after 0.1 μM indisulam treatment for the indicated number of days. (E) Flow cytometry measurements of the indicated cell surface markers in K562 cells after indisulam treatment. Mean and standard deviation are shown. ***p<0.0001, **p=0.0085, *p=0.013, mean significantly different from 1, one sample T test. (F) CD80 expression measured by flow cytometry in indisulam-treated K562 cells expressing the indicated sgRNAs. Mean and standard deviation are shown. N = 4–6 samples. **p=0.0095, *p=0.0286, ns p>0.1, Mann-Whitney test. (G) Effect of indisulam treatment on CD80 expression in the indicated cell lines. N = 3–12 samples. Mean and standard deviation are shown. ***p<0.0001, **p=0.0066, mean significantly different from 1, one sample T test. (H) Kaplan-Meier analysis of overall survival in adult AML patients from TCGA LAML project stratified by DCAF15 expression. ‘DCAF15 high’ and ‘DCAF15 low’ represents patients in top or bottom 50% of DCAF15 expression, respectively. N = 142 patients. 95% confidence interval shown. Median survival, 16.17 vs 12.18 months. P-value from log-rank test. (I) Kaplan-Meier analysis of overall survival in pediatric AML patients from TARGET project stratified by DCAF15 expression. ‘DCAF15 high’ and ‘DCAF15 low’ represents patients in top or bottom 20% of DCAF15 expression, respectively. N = 76 patients. 95% confidence interval shown. Median survival, 21.17 vs NA. P-value from log-rank test.
Figure 6—figure supplement 1
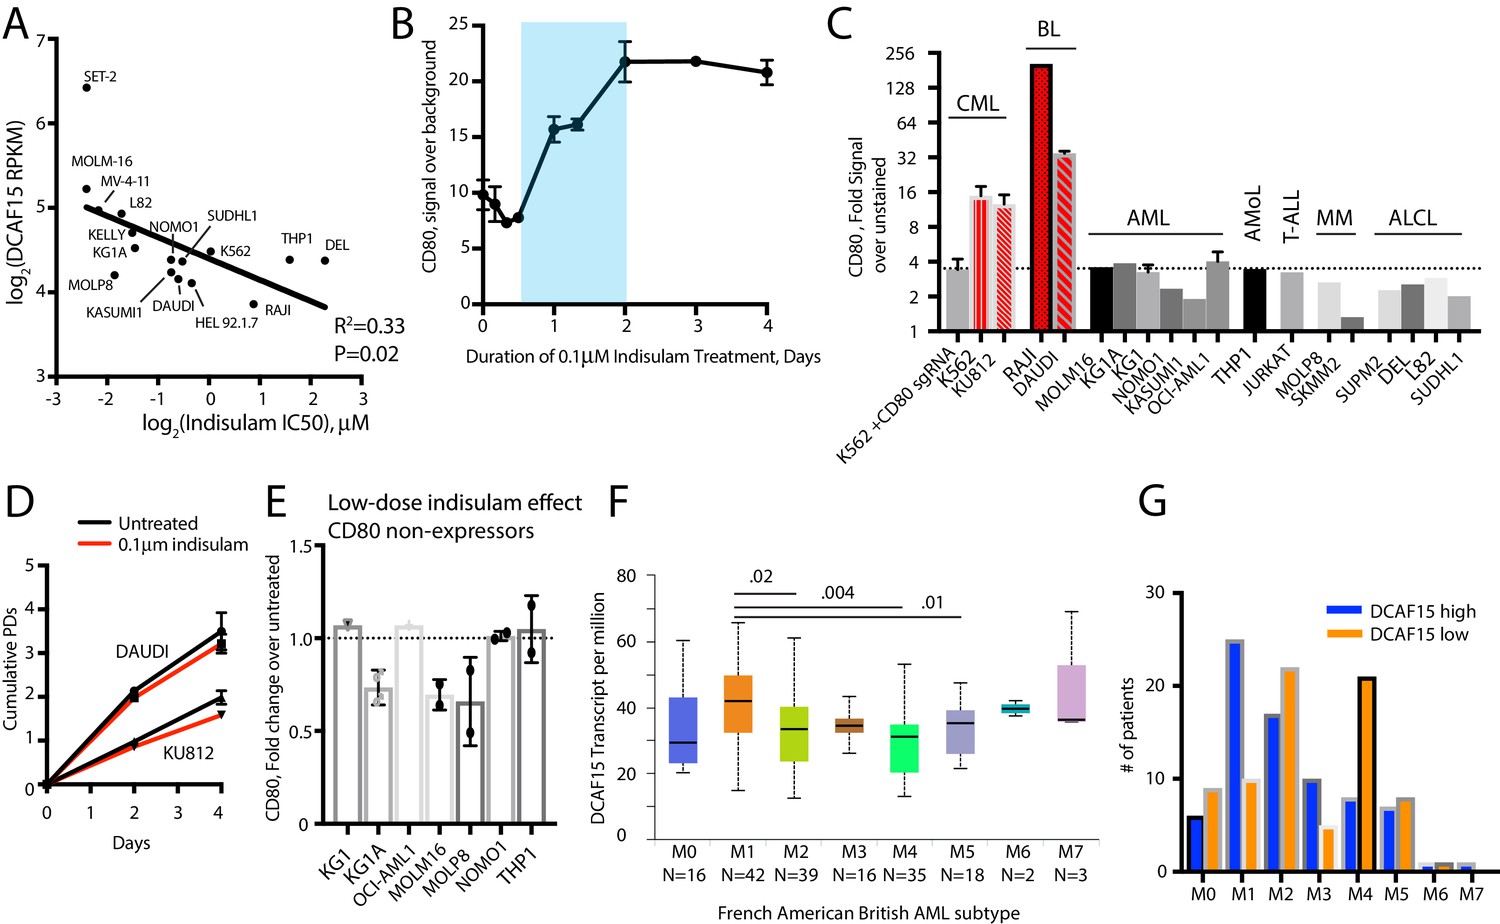
Additional indisulam experiments.
(A) Relationship between DCAF15 mRNA expression and indisulam sensitivity across a panel of cell lines. (B) Time-course of CD80 expression after indisulam treatment in K562 cells measured by flow cytometry. Blue shading indicates period of CD80 upregulation. N = 2–4 samples per timepoint. Mean and standard deviation are shown. (C) CD80 expression measured by flow cytometry across a panel of cancer cell lines. Dashed line indicates background level of antibody staining, with cell lines in red have expressing above background levels of the protein. CML, chronic myelogenous leukemia. BL, Burkitt’s lymphoma. AML, acute myeloid leukemia. AMoL, acute monocytic leukemia. T-ALL, T-acute lymphoblastic leukemia. MM, multiple myeloma. ALCL, anaplastic large cell lymphoma. (D) Growth of Daudi and KU812 cells treated with 0.1 μM indisulam over 4 days. N = 3 per timepoint. Mean and standard deviation are shown. (E) Fold change in CD80 expression in the indicated cell lines after 4 days treatment with 0.1 μM indisulam. (F) Box and whisker plot of DCAF15 expression in TCGA LAML samples, stratified by subtype using the French American British (FAB) AML classification scheme. Analysis from UALCAN portal (Chandrashekar et al., 2017). Subtypes with significantly different median expression values are indicated. (G) FAB classification of adult AML patients in the TCGA LAML project, stratified by top 50% (‘DCAF15 high’) or bottom 50% (‘DCAF15 low’) of DCAF15 expression.
Figure 7 with 1 supplement

Cohesin complex members are CRL4-DCAF15 E3 ligase client proteins.
(A) Experimental system for discovering DCAF15 interaction partners by proximity ligation. (B) Indicated constructs were stably expressed in K562 cells, and biotinylated proteins detected by HRP-conjugated streptavidin (‘α-biotin’). Asterisks denote major endogenous biotin-containing proteins. ‘MG132’ and ‘Biotin’ refer to 18 hr treatment with 5 μM MG132 or 50 μM biotin. (C) Proteins identified by quantitative mass spectrometry as differentially biotinylated by DCAF15-BioID as compared to GFP-BioID. Log2-fold changes are plotted against precision of the measurement (1/coefficient of variation). Colors denote the posterior probability that a protein fold change was small (referred to as ‘P-null’ in the legend), as explained in the Materials and methods. Data points in red are select CRL4 core complex members. Data points in blue are endogenous biotin-containing proteins. (D-E) Affinity capture of biotinylated proteins by streptavidin beads (‘biotin IP’) and detection by western blot. Indicated constructs were stably expressed in K562 cells. ‘Indisulam’ refers to 48 hr 0.1 μM indisulam treatment prior to MG132 and biotin addition. (F) Capture of 6xhis-ubiquitinated species by nickel chromatography under denaturing conditions and detection by western blot. The indicated expression plasmids were transiently transfected into 293 T cells. Input samples were prepared from whole cell lysates (WCL). ‘MG132’ and ‘Indisulam’ refer to 12 hr treatment with 10 μM MG132 or 2 μM Indisulam prior to harvest. G)Model of DCAF15 function.
Figure 7—figure supplement 1
Functionality of exogenous DCAF15.
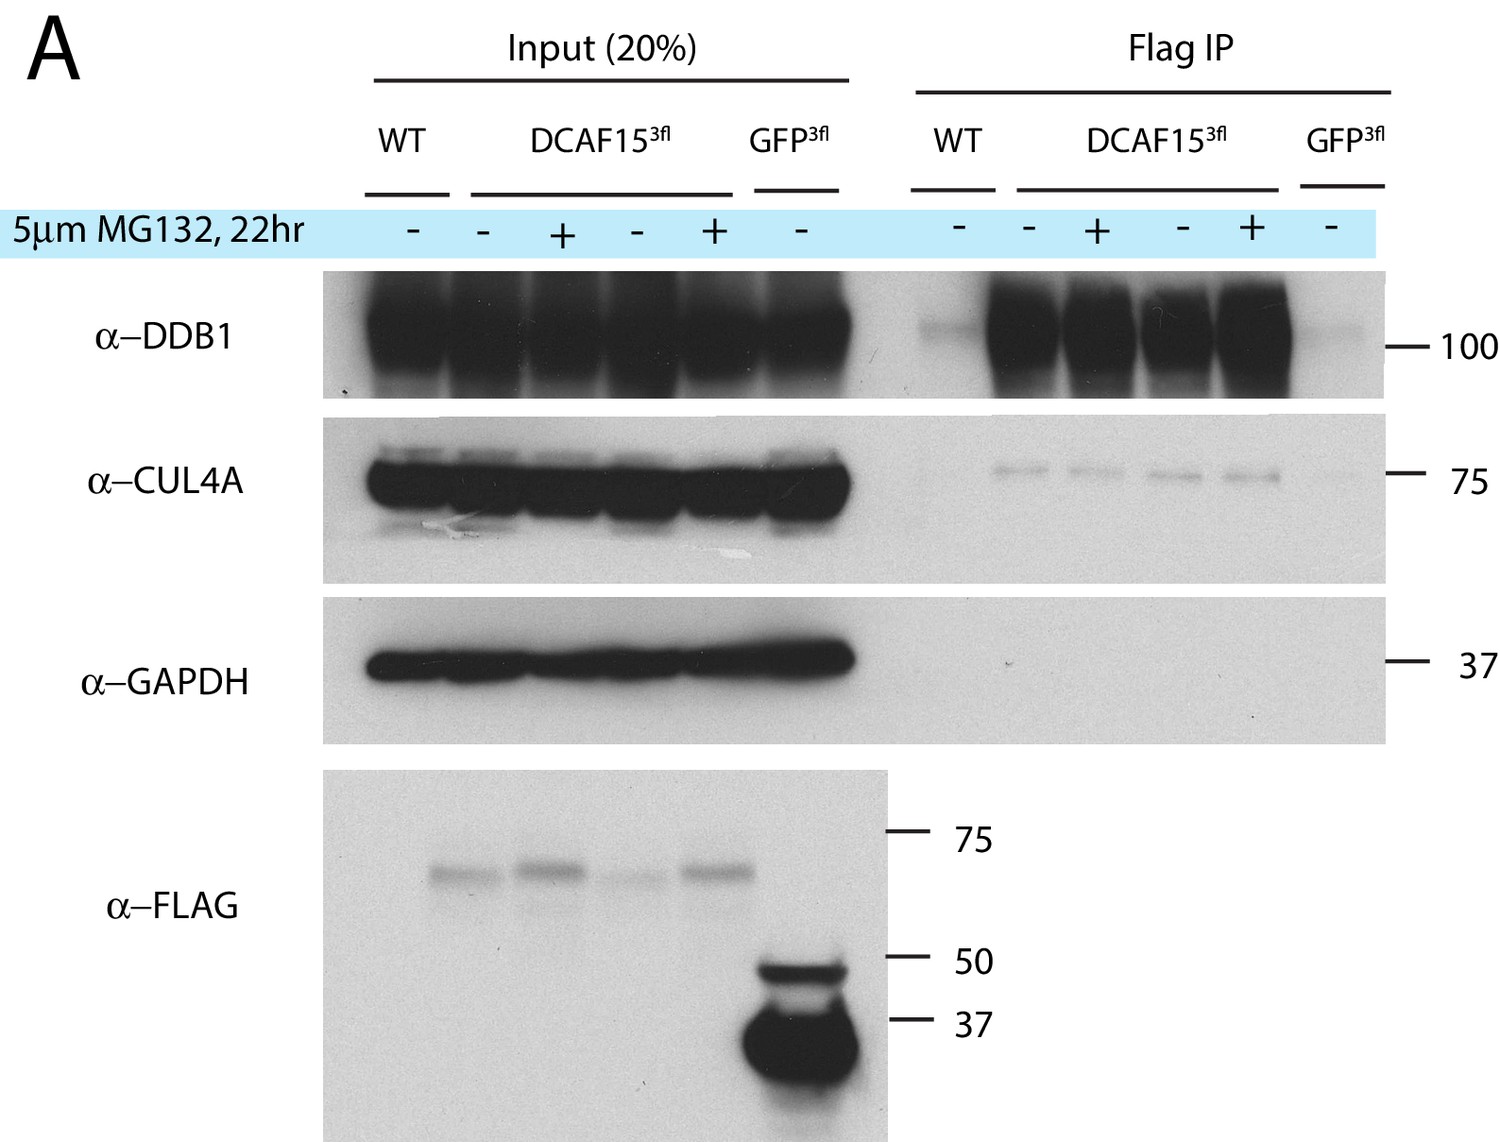
(A) Exogenous DCAF15 interacts with CRL4 core complex members. Indicated constructs were stably expressed in K562 cells. Anti-Flag immunoprecipitations were performed and analyzed by western blot.
Author response image 1
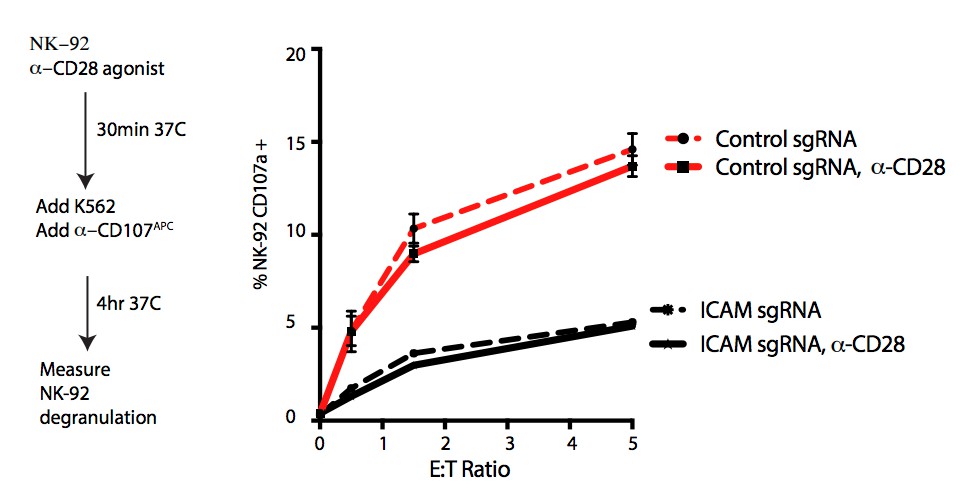
Effect of CD28 agonism on NK-92 degranulation.
Author response image 2

CD28 expression in untouched PBMCs.
Author response image 3
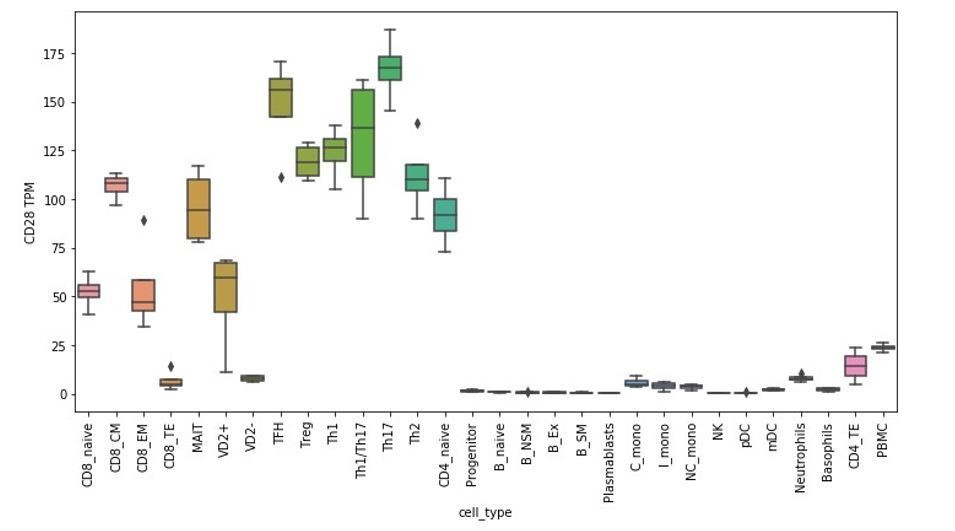
RNA-seq analysis of CD28 expression in isolated peripheral blood subtypes.
Author response image 4
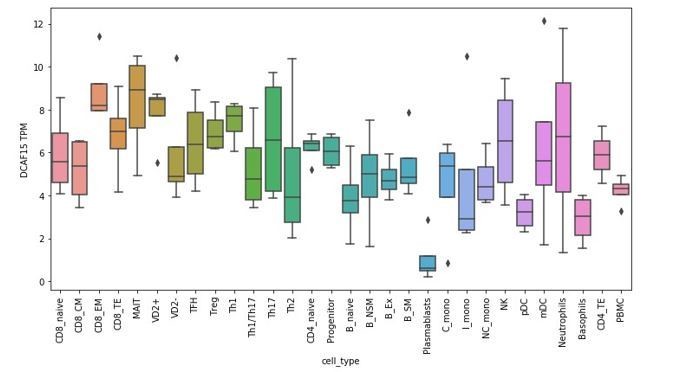
RNA-seq analysis of DCAF15 expression in isolated peripheral blood subtypes.
Author response image 5
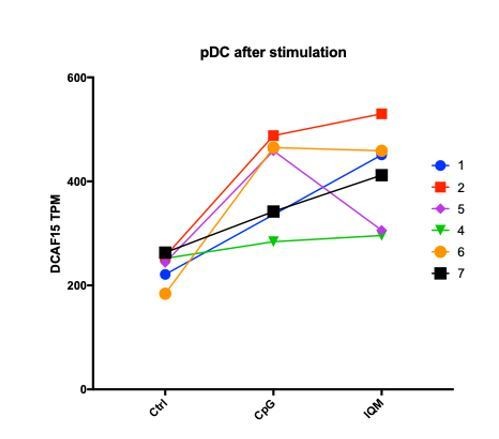
DCAF15 expression in human pDCs after stimulation with TLR agonists.
Author response image 6
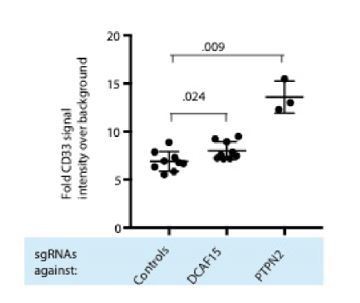
CD33 expression in K562 cells of indicated genotypes.
Author response image 7
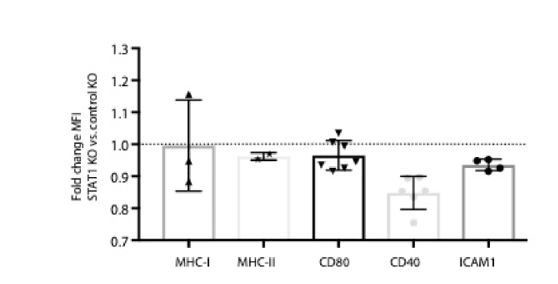
Expression of APC activation markers in STAT1 KO K562 cells.
Author response image 8
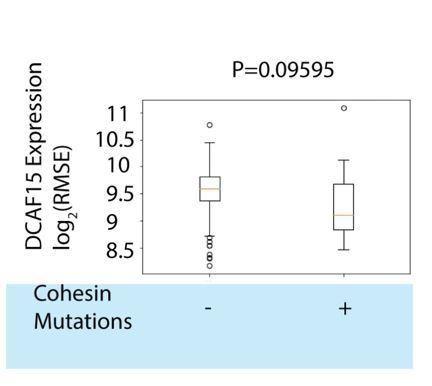
DCAF15 expression in TCGA AML samples stratified by cohesin mutation status.
Additional files
-
Supplementary file 1
Design of genome-scale CRISPR library. sgRNA sequences and coordinates of the intended target locus are provided.
- https://doi.org/10.7554/eLife.47362.019
-
Supplementary file 2
NK CRISPR screen data.
Normalized sgRNA counts and MAGeCK analysis output are provided.
- https://doi.org/10.7554/eLife.47362.020
-
Supplementary file 3
Raw MHC-I screen data.
Normalized protospacer counts and MAGeCK analysis output are included.
- https://doi.org/10.7554/eLife.47362.021
-
Supplementary file 4
List of differentially expressed genes determined by RNA-seq of control, DCAF15 or PTPN2 KO K562 cells.
- https://doi.org/10.7554/eLife.47362.022
-
Supplementary file 5
Comparison of biotinylated proteins recovered from K562 cells expressing DCAF15-BIoID or GFP-BioID using isobaric labeling and mass spectrometry.
- https://doi.org/10.7554/eLife.47362.023
-
Supplementary file 6
List of sgRNA sequences used.
- https://doi.org/10.7554/eLife.47362.024
-
Supplementary file 7
Primer design for sequencing sgRNA libraries.
- https://doi.org/10.7554/eLife.47362.025
-
Supplementary file 8
List of antibodies used.
- https://doi.org/10.7554/eLife.47362.026
-
Transparent reporting form
- https://doi.org/10.7554/eLife.47362.027
Download links
A two-part list of links to download the article, or parts of the article, in various formats.
Downloads (link to download the article as PDF)
Open citations (links to open the citations from this article in various online reference manager services)
Cite this article (links to download the citations from this article in formats compatible with various reference manager tools)
Systematic identification of cancer cell vulnerabilities to natural killer cell-mediated immune surveillance
eLife 8:e47362.
https://doi.org/10.7554/eLife.47362


