N-chlorination mediates protective and immunomodulatory effects of oxidized human plasma proteins
- Ruhr University Bochum, Germany
Figures
Figure 1
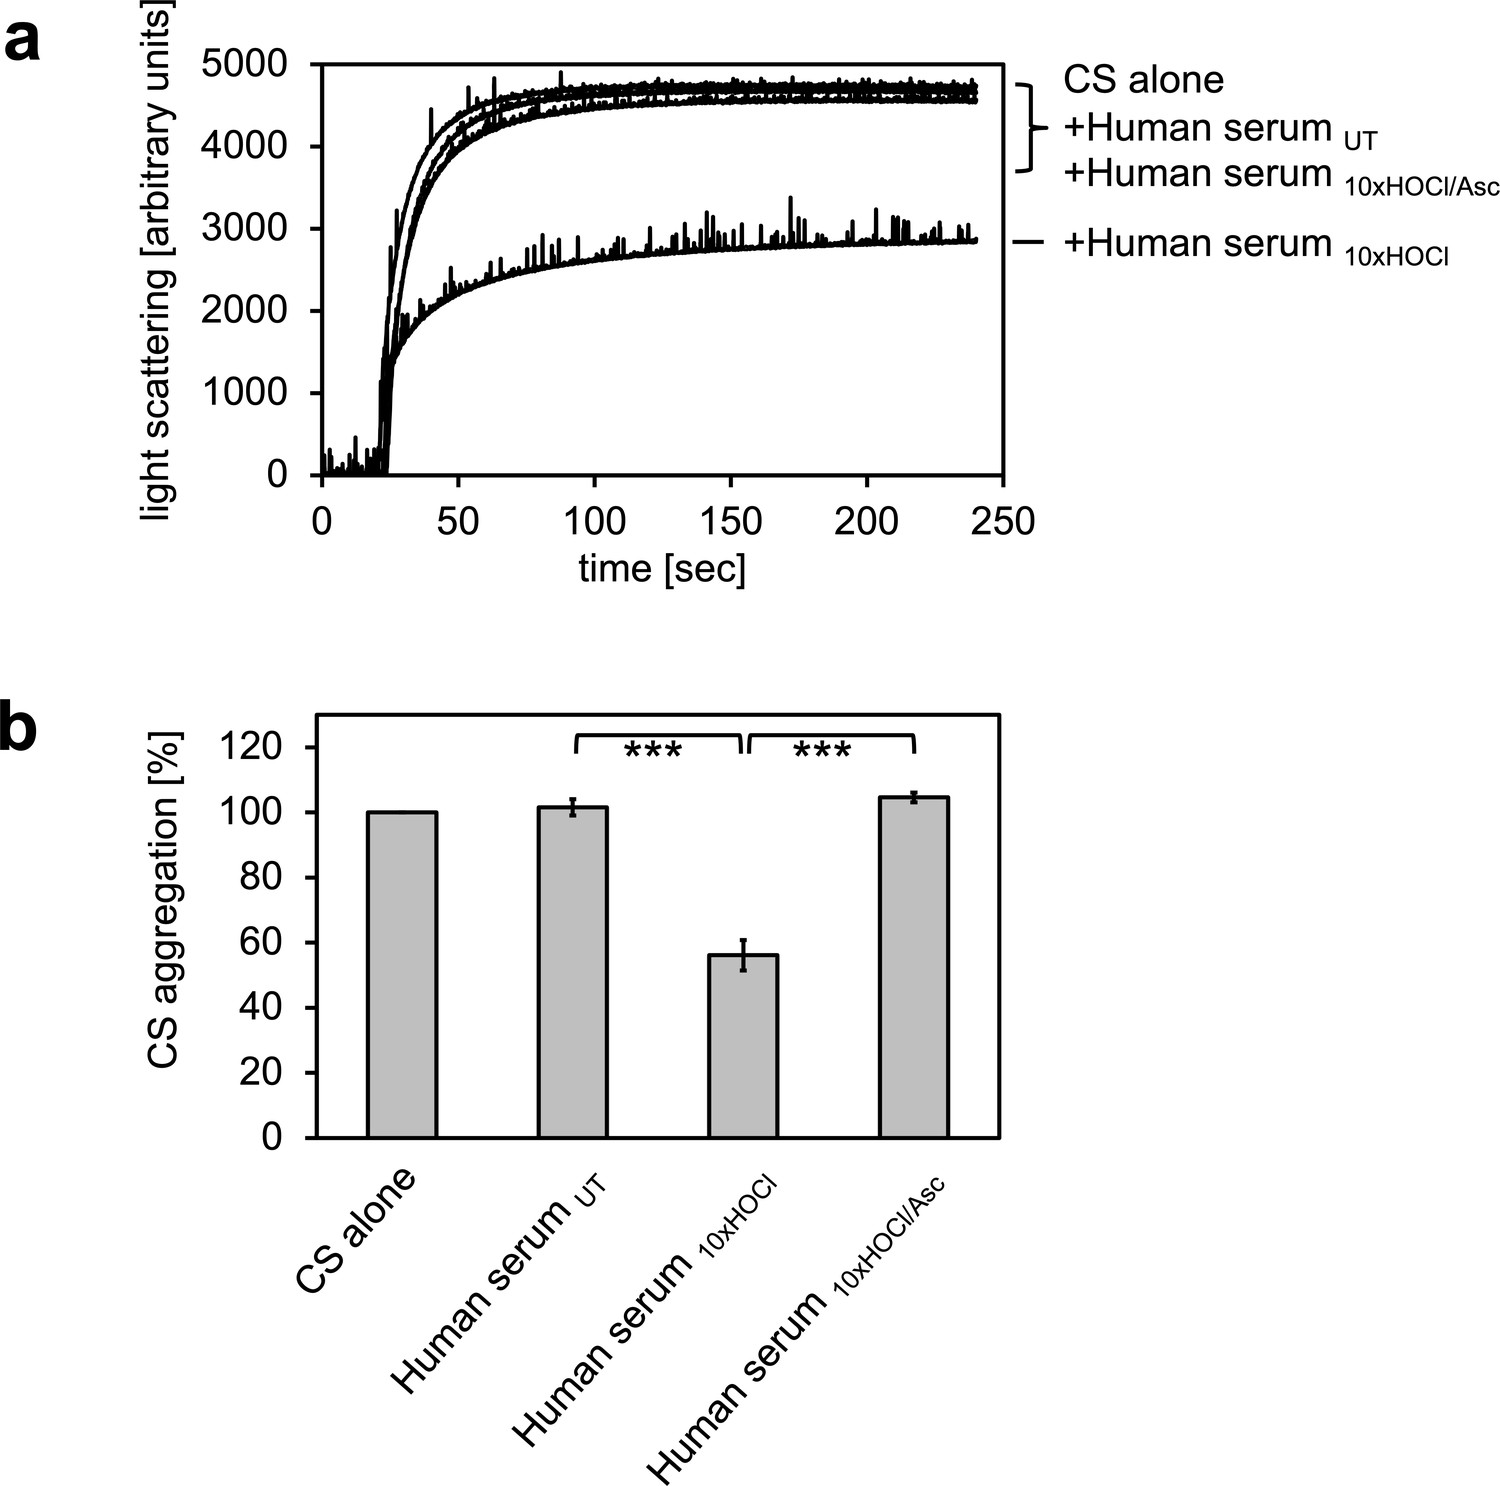
HOCl-treated human serum decreases protein aggregation.
Human serum, when treated with a 10-fold molar excess of HOCl (Human serum 10xHOCl), significantly decreases aggregation of chemically denatured citrate synthase as measured by light scattering at 360 nm. Reduction of HOCl-treated human serum with a 50-fold molar excess of the antioxidant ascorbate (Human serum 10xHOCl/Asc) reverses this chaperone-like conversion of the serum. (a) A representative measurement of citrate synthase aggregation in the presence of untreated (Human serum UT), HOCl-treated (Human serum 10xHOCl) and re-reduced (Human serum 10xHOCl/Asc) human serum is shown. (b) Data are represented as means and standard deviations from three independent aggregation assays. Student’s t-test: ***p<0.001. Aggregation of citrate synthase in the absence of human serum was set to 100% and all the data are presented as percentage of this control. Labels of aggregation curves are written in the order of the final intensity of light scattering of the respective treatment.
-
Figure 1—source data 1
Numerical light scattering data obtained during protein aggregation assays represented in Figure 1a and b.
- https://doi.org/10.7554/eLife.47395.003
Figure 2 with 4 supplements
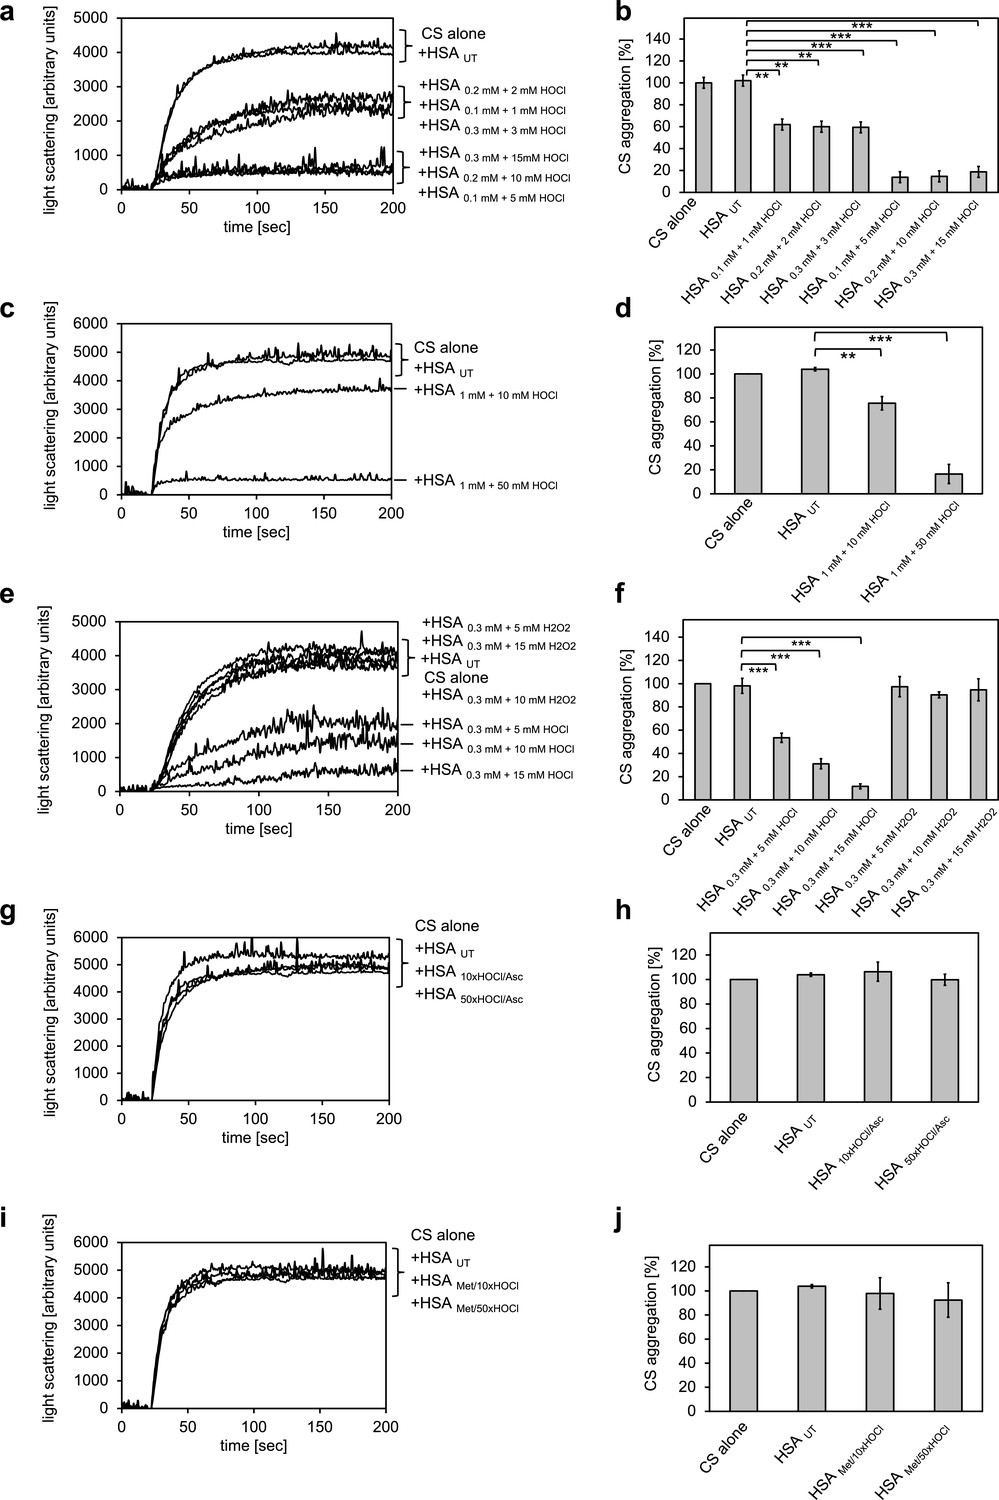
Conversion of serum albumin into a potent chaperone upon HOCl exposure is based on reversible N-chlorination of its basic amino acids.
(a, b) Serum albumin in different concentrations, when treated with a 10- or 50-fold molar excess of HOCl (HSA 10xHOCl and HSA 50xHOCl, respectively), significantly decreases aggregation of chemically denatured citrate synthase as measured by light scattering at 360 nm. (c, d) After testing several concentrations, we decided to perform further experiments with 1 mM HSA treated with a 10- and 50-fold excess of HOCl. (e, f) Treatment with H2O2 does not mimic HOCl treatment. (g, h) Reduction of HOCl-treated HSA with a 50-fold molar excess of the antioxidant ascorbate (HSA 10xHOCl/Asc and HSA 50xHOCl/Asc) switches off its chaperone activity. (i, j) Methylation of basic amino acid side chains prior to HOCl treatment (HSA Met/10xHOCl and HSA Met/50xHOCl) abrogates the chaperone-like conversion of HSA. In a, c, e, g, and i representative measurements are shown. In b, d, f, h, and j data are represented as means and standard deviations from three independent experiments. Student’s t-test: *p<0.05, **p<0.01, ***p<0.001. Aggregation of citrate synthase in the absence of HSA was set to 100% and all the data are presented as percentage of this control. Labels of aggregation curves are written in the order of the final intensity of light scattering of the respective treatment.
-
Figure 2—source data 1
Numerical light scattering data obtained during protein aggregation assays represented in Figure 2a and b.
- https://doi.org/10.7554/eLife.47395.013
-
Figure 2—source data 2
Numerical light scattering data obtained during protein aggregation assays represented in Figure 2c and d.
- https://doi.org/10.7554/eLife.47395.014
-
Figure 2—source data 3
Numerical light scattering data obtained during protein aggregation assays represented in Figure 2e and f.
- https://doi.org/10.7554/eLife.47395.015
-
Figure 2—source data 4
Numerical light scattering data obtained during protein aggregation assays represented in Figure 2g and h.
- https://doi.org/10.7554/eLife.47395.016
-
Figure 2—source data 5
Numerical light scattering data obtained during protein aggregation assays represented in Figure 2i and j.
- https://doi.org/10.7554/eLife.47395.017
Figure 2—figure supplement 1
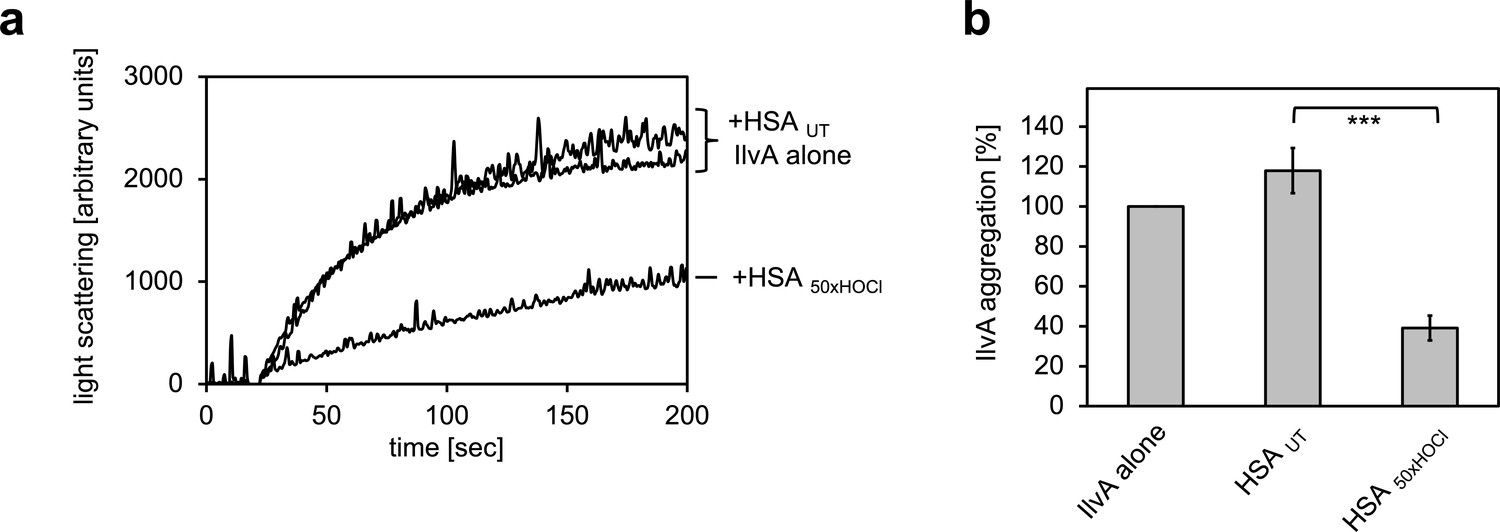
Serum albumin, when treated with a 50-fold molar excess of HOCl, significantly decreases aggregation of chemically denatured IlvA as measured by light scattering at 360 nm.
(a) Representative measurements are shown. (b) Data represented as means and standard deviations from three independent experiments. Student’s t-test: ***p<0.001. Aggregation of citrate synthase in the absence of HSA was set to 100% and all the data are presented as percentage of this control. Labels of aggregation curves are written in the order of the final intensity of light scattering of the respective treatment.
-
Figure 2—figure supplement 1—source data 1
Numerical light scattering data obtained during protein aggregation assays represented in Figure 2—figure supplement 1.
- https://doi.org/10.7554/eLife.47395.006
Figure 2—figure supplement 2
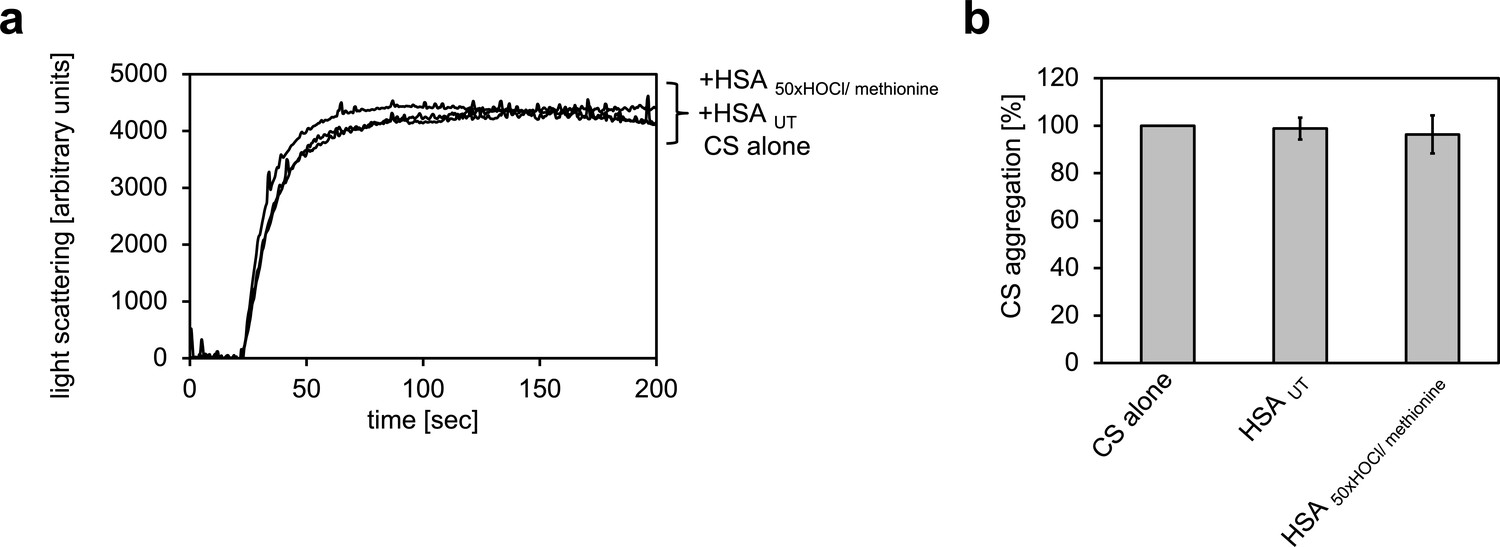
Serum albumin, when treated with a 50-fold molar excess of HOCl and then reduced with methionine, loses its propensity to decrease aggregation of chemically denatured citrate synthase.
(a) Representative measurements are shown. (b) Data represented as means and standard deviations from three independent experiments. Aggregation of citrate synthase in the absence of HSA was set to 100% and all the data are presented as percentage of this control. Labels of aggregation curves are written in the order of the final intensity of light scattering of the respective treatment.
-
Figure 2—figure supplement 2—source data 1
Numerical light scattering data obtained during protein aggregation assays represented in Figure 2—figure supplement 2.
- https://doi.org/10.7554/eLife.47395.008
Figure 2—figure supplement 3
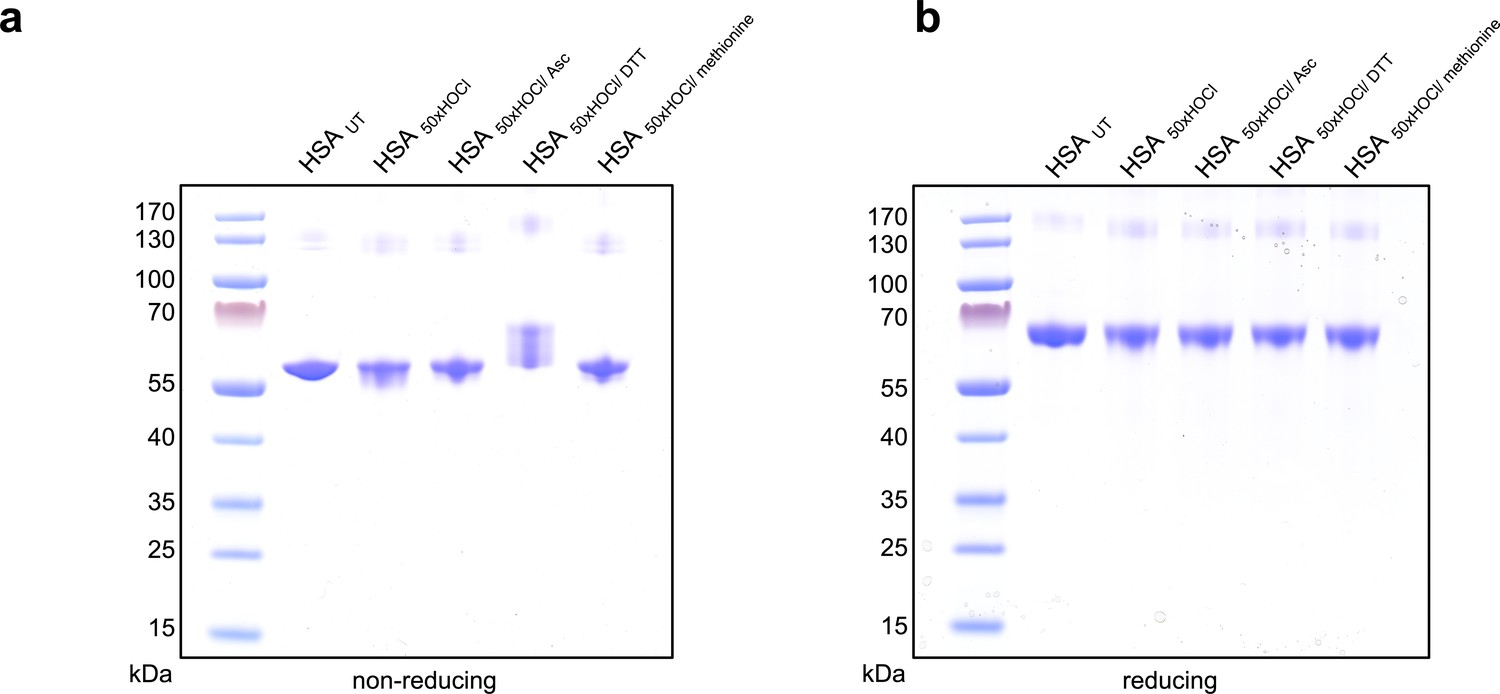
Influence of reducing agents on the migration of HSA on reducing and non-reducing SDS PAGE gels.
(a) Untreated HSA and HSA treated with a 50-fold molar excess of HOCl and subsequently reduced with various reductants separated on a non-reducing gel. HOCl-treatment does not lead to accumulation of a disulfide linked dimer that could potentially form by oxidation of the single free cysteine in HSA. DTT-treatment leads to a change in the migration of HSA, presumably by reducing HSA’s many intramolecular disulfide bonds. Neither ascorbate nor methionine induce a change in migration. (b) On a reducing gel (containing β-mercaptoethanol in the loading buffer) all samples migrate to the same, compared to the non-reducing gel, higher position.
-
Figure 2—figure supplement 3—source data 1
Original scans of gels represented in Figure 2—figure supplement 3.
- https://doi.org/10.7554/eLife.47395.010
Figure 2—figure supplement 4
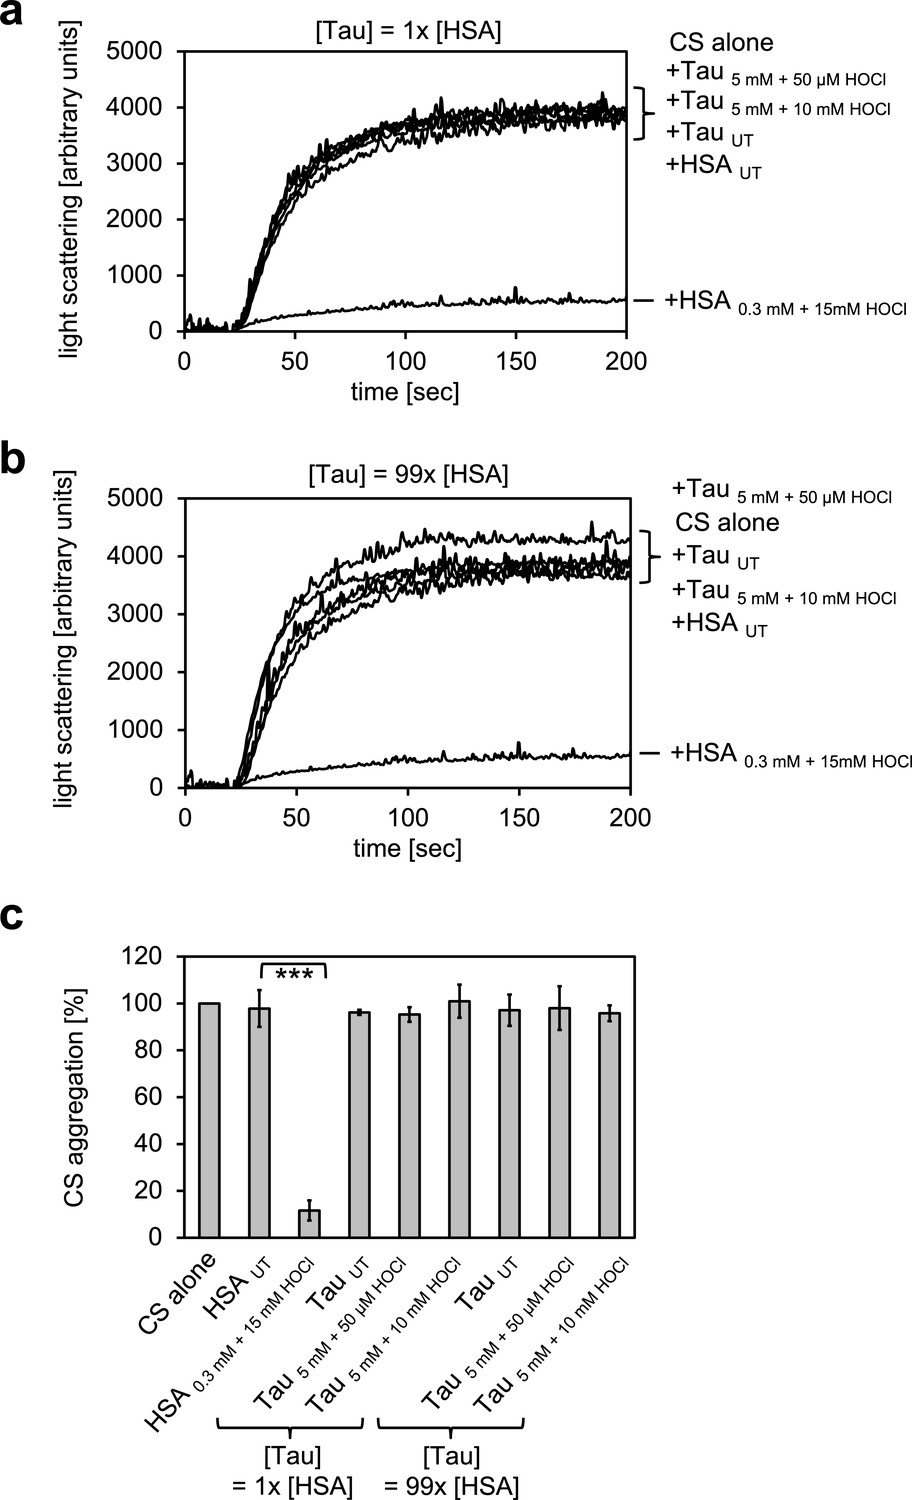
Taurine N-chloramine, a model N-chloramine does not affect our light-scattering assay.
Taurine monochloramine was generated by incubation of 5 mM taurine with 50 µM HOCl. Taurine dichloramine was generated by incubation of 5 mM taurine with 10 mM HOCl. Untreated taurine or taurine treated with the different amounts of HOCl was added at the same concentration as HSA (1x) or a concentration comparable to the concentration of chlorinated nitrogen atoms in HSA assuming that all Lys, Arg, His and Trp residues as well as the N-terminus were chlorinated (99x). Taurine N-chloramine did not affect the citrate synthase aggregation assay. In a and b representative measurements are shown. In c data are represented as means and standard deviations from three independent experiments. Student’s t-test: ***p<0.001. Aggregation of citrate synthase in the absence of HSA or taurine was set to 100% and all the data are presented as percentage of this control. Labels of aggregation curves are written in the order of the final intensity of light scattering of the respective treatment.
-
Figure 2—figure supplement 4—source data 1
Numerical light scattering data obtained during protein aggregation assays represented in Figure 2—figure supplement 4.
- https://doi.org/10.7554/eLife.47395.012
Figure 3 with 1 supplement
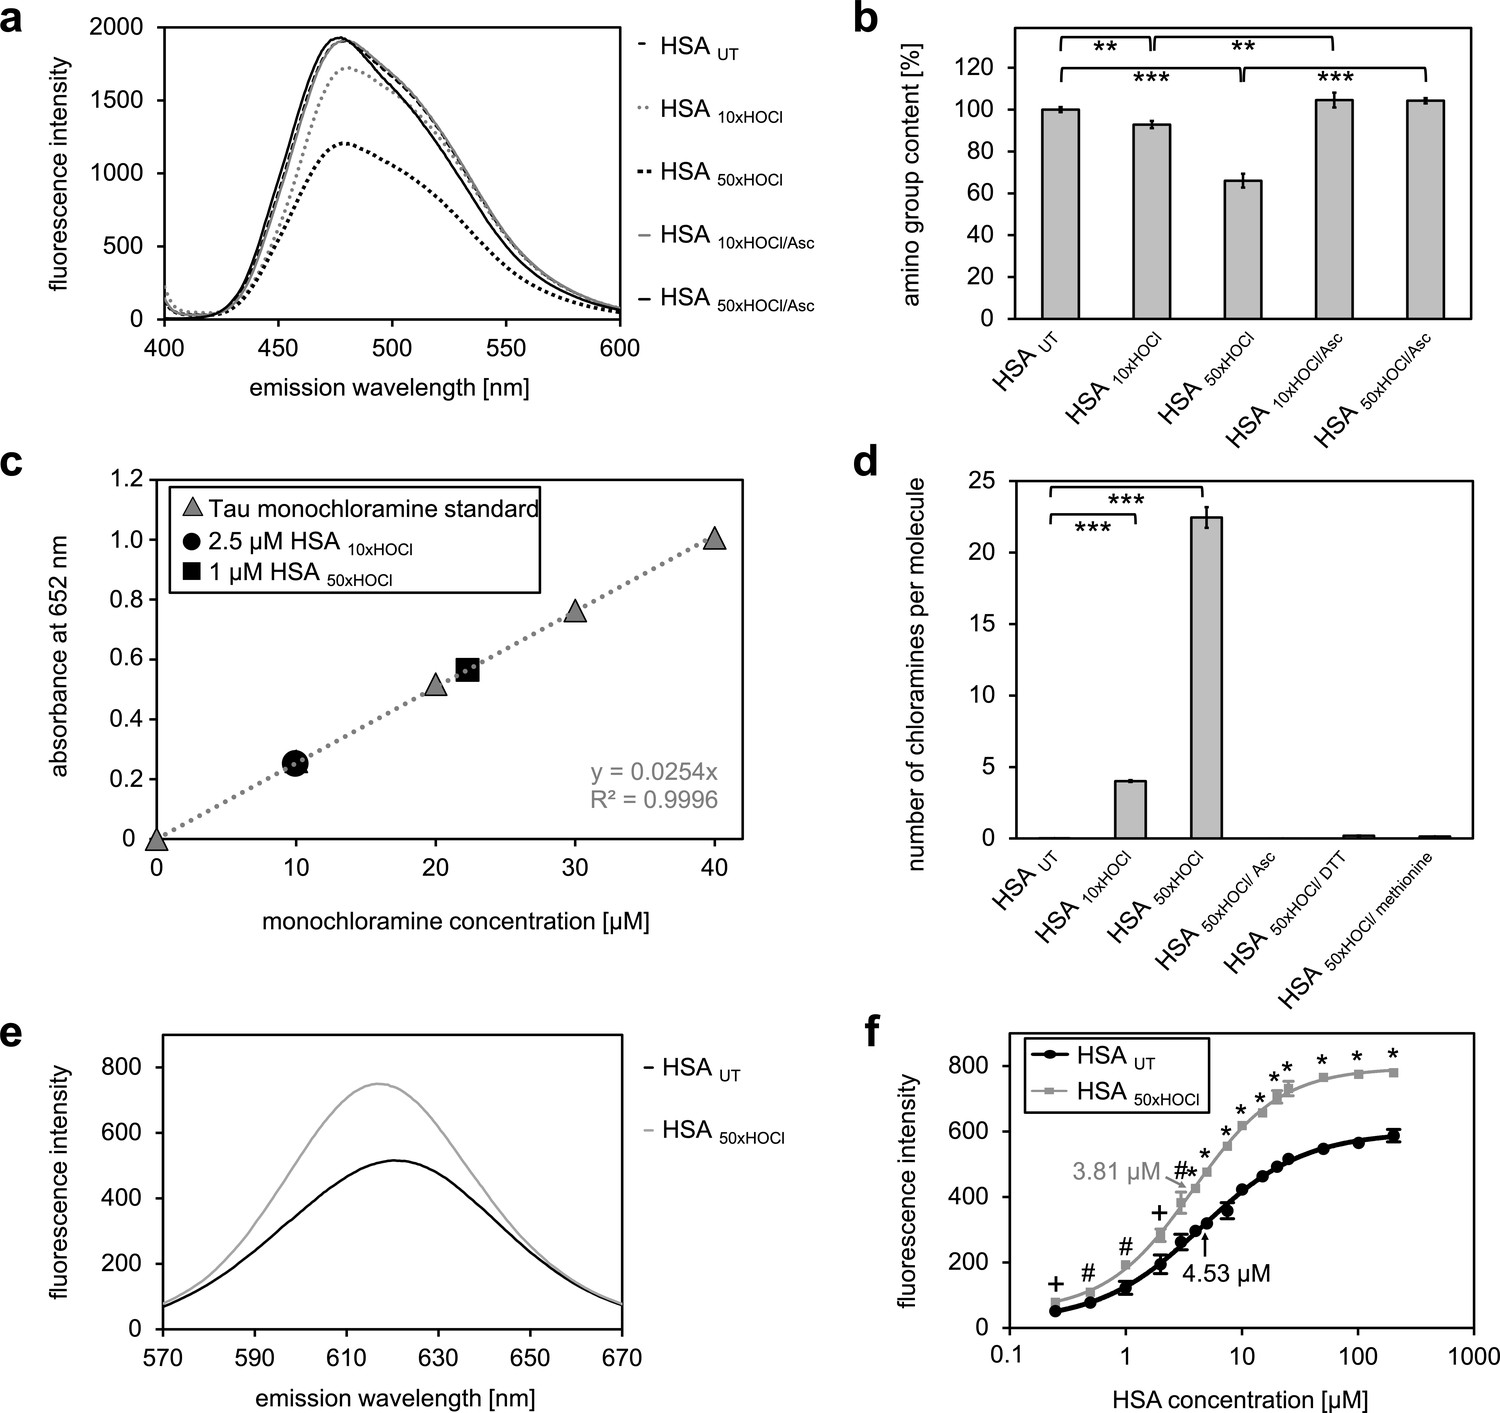
N-chlorination of serum albumin decreases accessible amino group content and increases chloramine content and surface hydrophobicity.
(a, b) Amino group content of variously treated HSA was analyzed using fluorescamine. Treatment of HSA with HOCl resulted in a dose-dependent loss of free amino groups. Reduction of chlorinated HSA with ascorbate fully restored the free amino group content. (c) Chloramine content of HSA treated with 10- or 50-fold molar excess of HOCl. Chloramines were determined in 2.5 µM HSA treated with a 10-fold excess of HOCl and 1 µM HSA treated with a 50-fold excess and compared to a standard curve generated with known quantities of taurine N-chloramine. (d) Quantified chloramine content in HSA treated with a 10- and 50-fold excess of HOCl. (e) Fluorescence of 1.6 μM Nile red in the presence of native HSA or HSA, that has been treated with a 50-fold molar excess of HOCl. An increased absolute fluorescence and a shift in maximum emission wavelength (from 621.5 nm to 616.5 nm) can be observed for HSA 50xHOCl. (f) Absolute fluorescence of Nile red measured at the emission maximum at 621.5 nm and 616.5 nm, respectively, was plotted against the corresponding HSA UT and HSA 50xHOCl concentrations, respectively. The average concentrations, at which HSA UT and HSA 50xHOCl have been half-saturated with Nile red are marked by arrows. Means and standard deviations in b, d, and f are based on three independent experiments. (b and d) Student’s t-test: *p<0.05, **p<0.01, ***p<0.001. (f) Student’s t-test:+p < 0.05, #p<0.01, *p<0.001. For a, c, and d representative measurements are shown.
-
Figure 3—source data 1
Numerical fluorescence spectroscopy data obtained during determination of free amino groups represented in Figure 3a and b.
- https://doi.org/10.7554/eLife.47395.021
-
Figure 3—source data 2
Numerical fluorescence spectroscopy data obtained during determination of protein chloramines represented in Figure 3c.
- https://doi.org/10.7554/eLife.47395.022
-
Figure 3—source data 3
Numerical fluorescence spectroscopy data obtained during determination of protein chloramines represented in Figure 3d.
- https://doi.org/10.7554/eLife.47395.023
-
Figure 3—source data 4
Numerical fluorescence spectroscopy data obtained during determination of protein hydrophobicity represented in Figure 3e.
- https://doi.org/10.7554/eLife.47395.024
-
Figure 3—source data 5
Numerical fluorescence spectroscopy intensity data obtained during determination of protein hydrophobicity represented in Figure 3f.
- https://doi.org/10.7554/eLife.47395.025
Figure 3—figure supplement 1
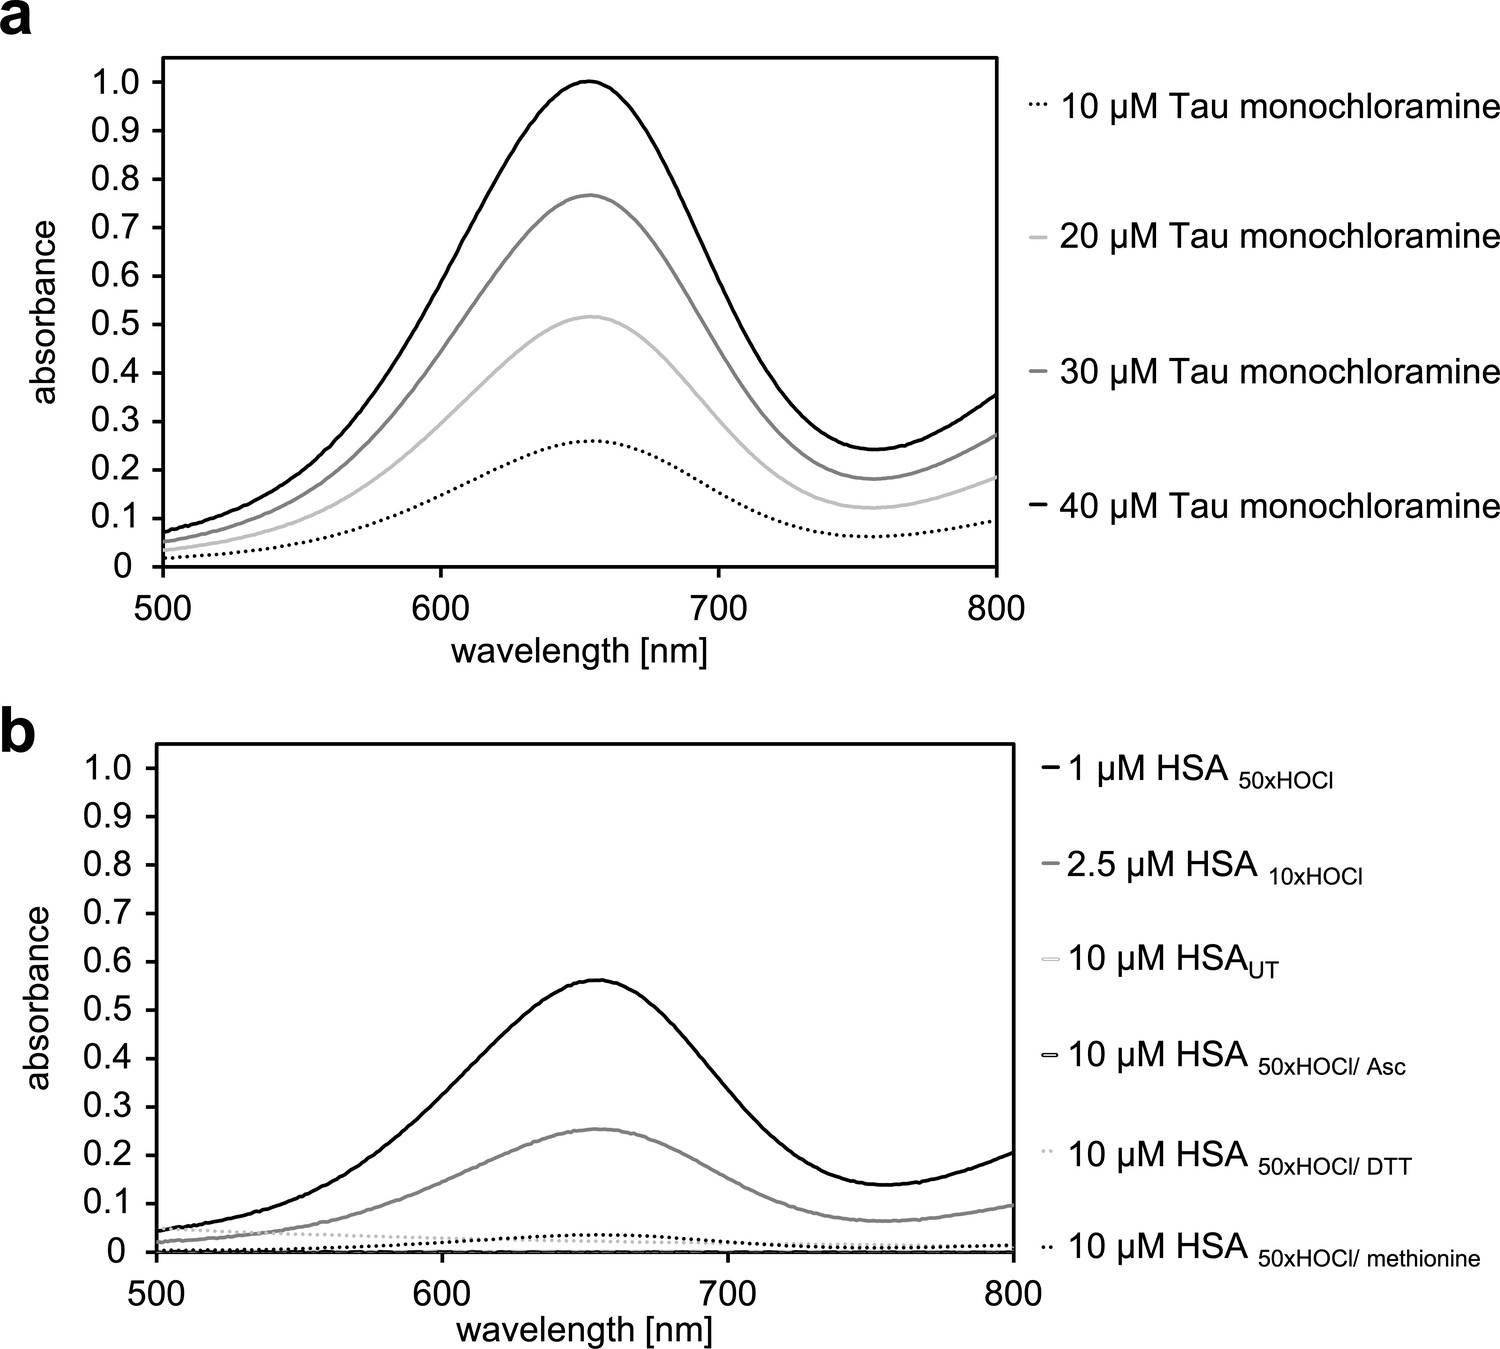
Determination of the N-chloramine content of HOCl-treated HSA.
(a) Measurement of the standard curve using known concentrations of taurine monochloramine. The standard curve is shown in Figure 3c in the main manuscript. (b) Determination of the content of chloramines in HSA treated with HOCl at different concentrations and reductants as indicated. Bar graph representation of this data is shown in Figure 3d in the main manuscript. Representative measurements shown. Data represented as means and standard deviations from three independent experiments found in Figure 3c and d in the main manuscript.
-
Figure 3—figure supplement 1—source data 1
Numerical fluorescence spectroscopy data obtained during determination of protein chloramines represented in Figure 3—figure supplement 1.
- https://doi.org/10.7554/eLife.47395.020
Figure 4 with 3 supplements
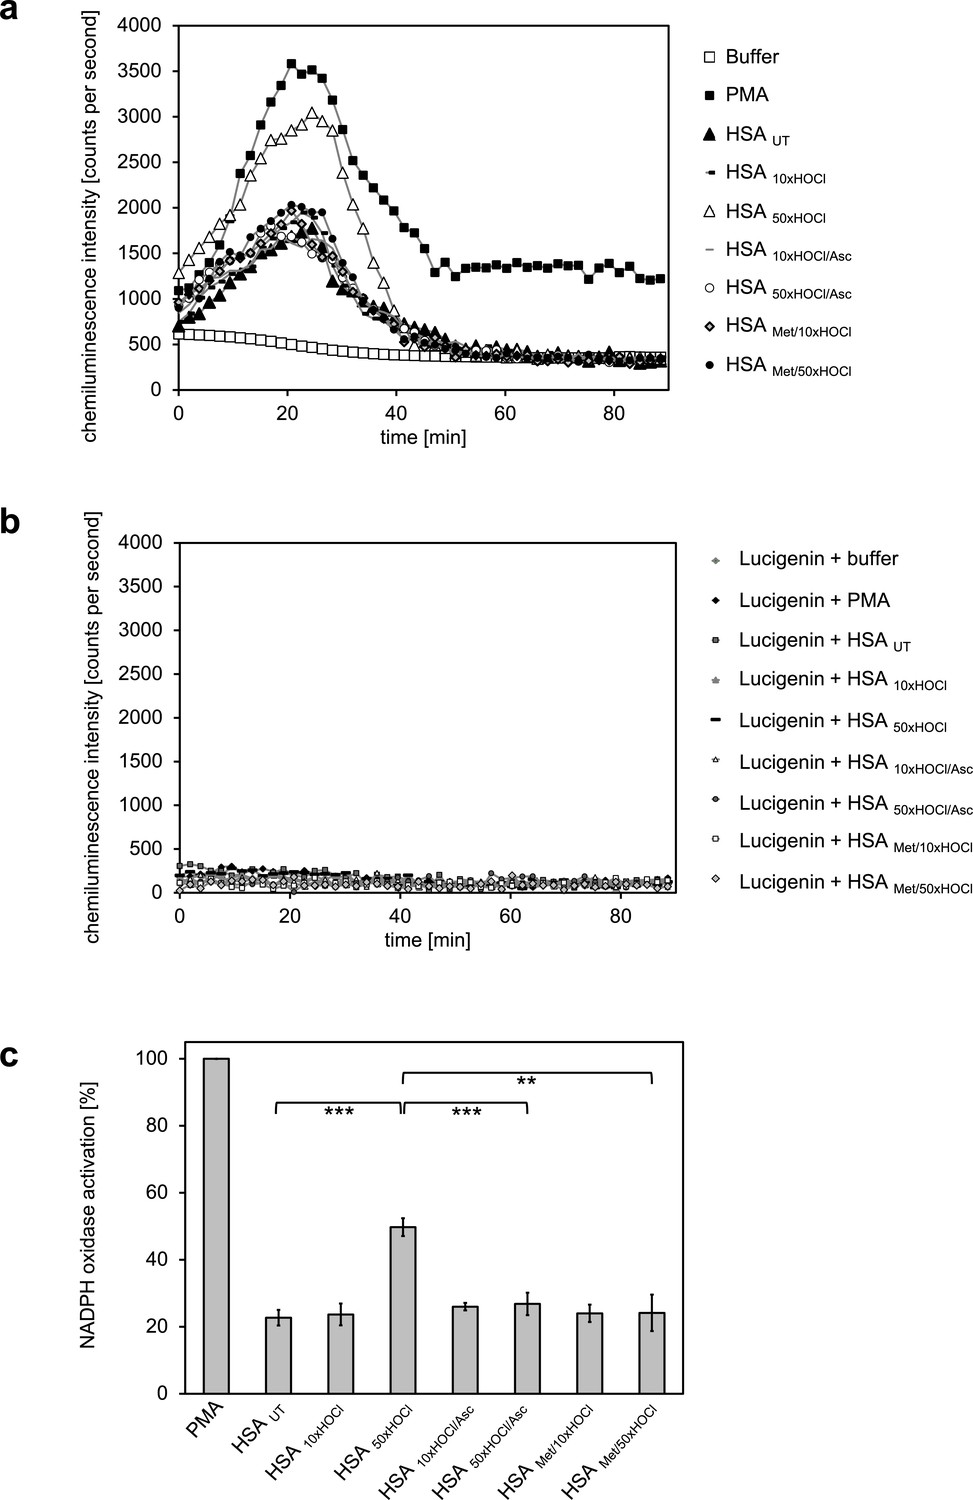
Activation of neutrophil-like cells by HOCl-treated serum albumin is mediated by reversible N-chlorination.
Treatment with a 50-fold molar excess of HOCl (HSA 50xHOCl) converted HSA into an efficient inducer of the neutrophil respiratory burst, reflected by the increased production and release of oxidants that induce lucigenin chemiluminescence. This activating function of HSA 50xHOCl could be reversed by reduction with the antioxidant ascorbate (HSA 50xHOCl/Asc) and was abrogated by methylation of its basic amino acid side chains prior to HOCl exposure (HSA Met/50xHOCl). (a) Extracellular oxidant production by neutrophil NADPH oxidase was measured in one- to two-minutes intervals over 90 min at 37°C using lucigenin-enhanced chemiluminescence. Phorbol 12-myristate 13-acetate (PMA; final concentration, 0.2 µM), untreated and variously treated HSA samples (final concentration, 3 mg · mL−1) from the previous citrate synthase aggregation assays (see above) or PBS buffer (basal oxidant production) were added to (a) differentiated PLB-985 cells in PBS buffer or (b) cell-free PBS puffer containing 400 µM lucigenin immediately prior to chemiluminescence measurement. (c) Results shown in a are expressed as integrated total counts (means and standard deviations of three independent measurements) higher than buffer control. Student’s t-test: **p<0.01, ***p<0.001. PMA-induced activation of NADPH-oxidase was set to 100%.
-
Figure 4—source data 1
Numerical chemiluminescence plate reader data represented in Figure 4a and c.
- https://doi.org/10.7554/eLife.47395.033
-
Figure 4—source data 2
Numerical chemiluminescence plate reader data represented in Figure 4b.
- https://doi.org/10.7554/eLife.47395.034
Figure 4—figure supplement 1
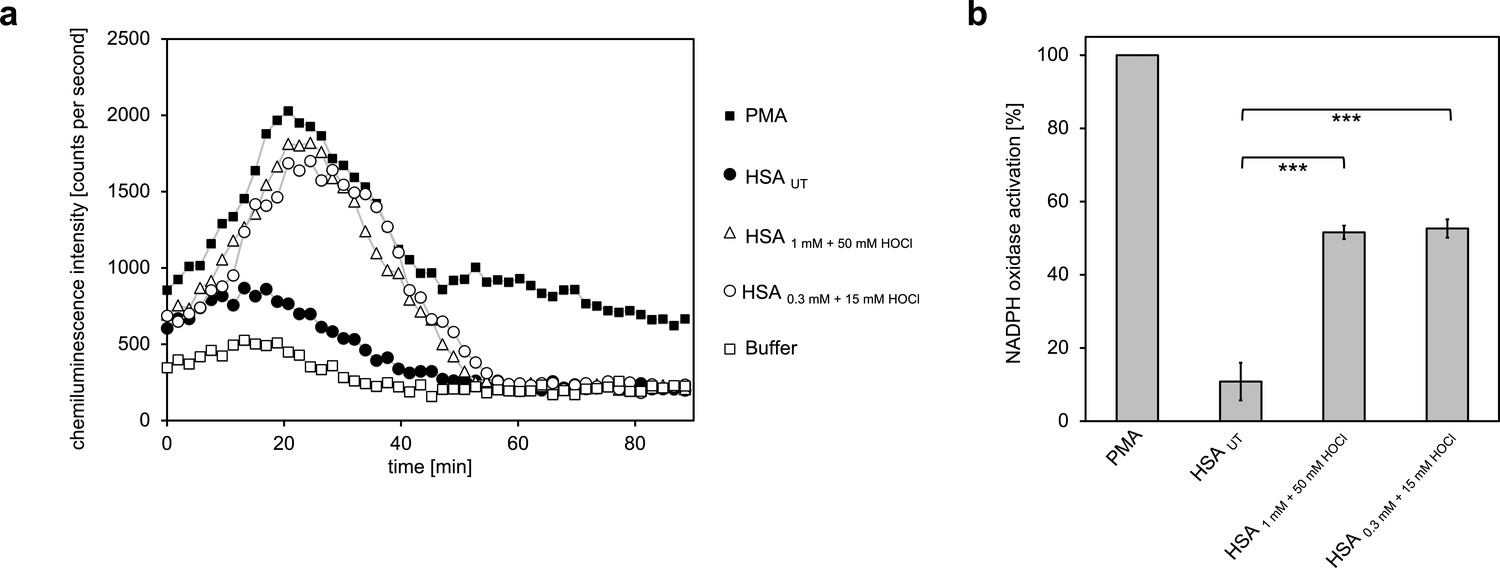
Activation of neutrophil-like cells by HOCl-treated serum albumin.
Treatment with a 50-fold molar excess of HOCl converted HSA into an efficient inducer of the neutrophil respiratory burst, irrespective of the preparation (1 mM HSA treated with 50 mM HOCl or 0.3 mM HSA treated with 15 mM HOCl). (a) Extracellular oxidant production by neutrophil NADPH oxidase was measured in one- to two-minutes intervals over 90 min at 37°C using lucigenin-enhanced chemiluminescence. Phorbol 12-myristate 13-acetate (PMA; final concentration, 0.2 µM), untreated and differently treated HSA samples (final concentration, 3 mg · mL−1) were added to differentiated PLB-985 cells in PBS buffer. (b) Results shown in a are expressed as integrated total counts (means and standard deviations of three independent measurements) higher than buffer control. Student’s t-test: ***p<0.001. PMA-induced activation of NADPH-oxidase was set to 100%.
-
Figure 4—figure supplement 1—source data 1
Numerical chemiluminescence plate reader data represented in Figure 4—figure supplement 1.
- https://doi.org/10.7554/eLife.47395.028
Figure 4—figure supplement 2
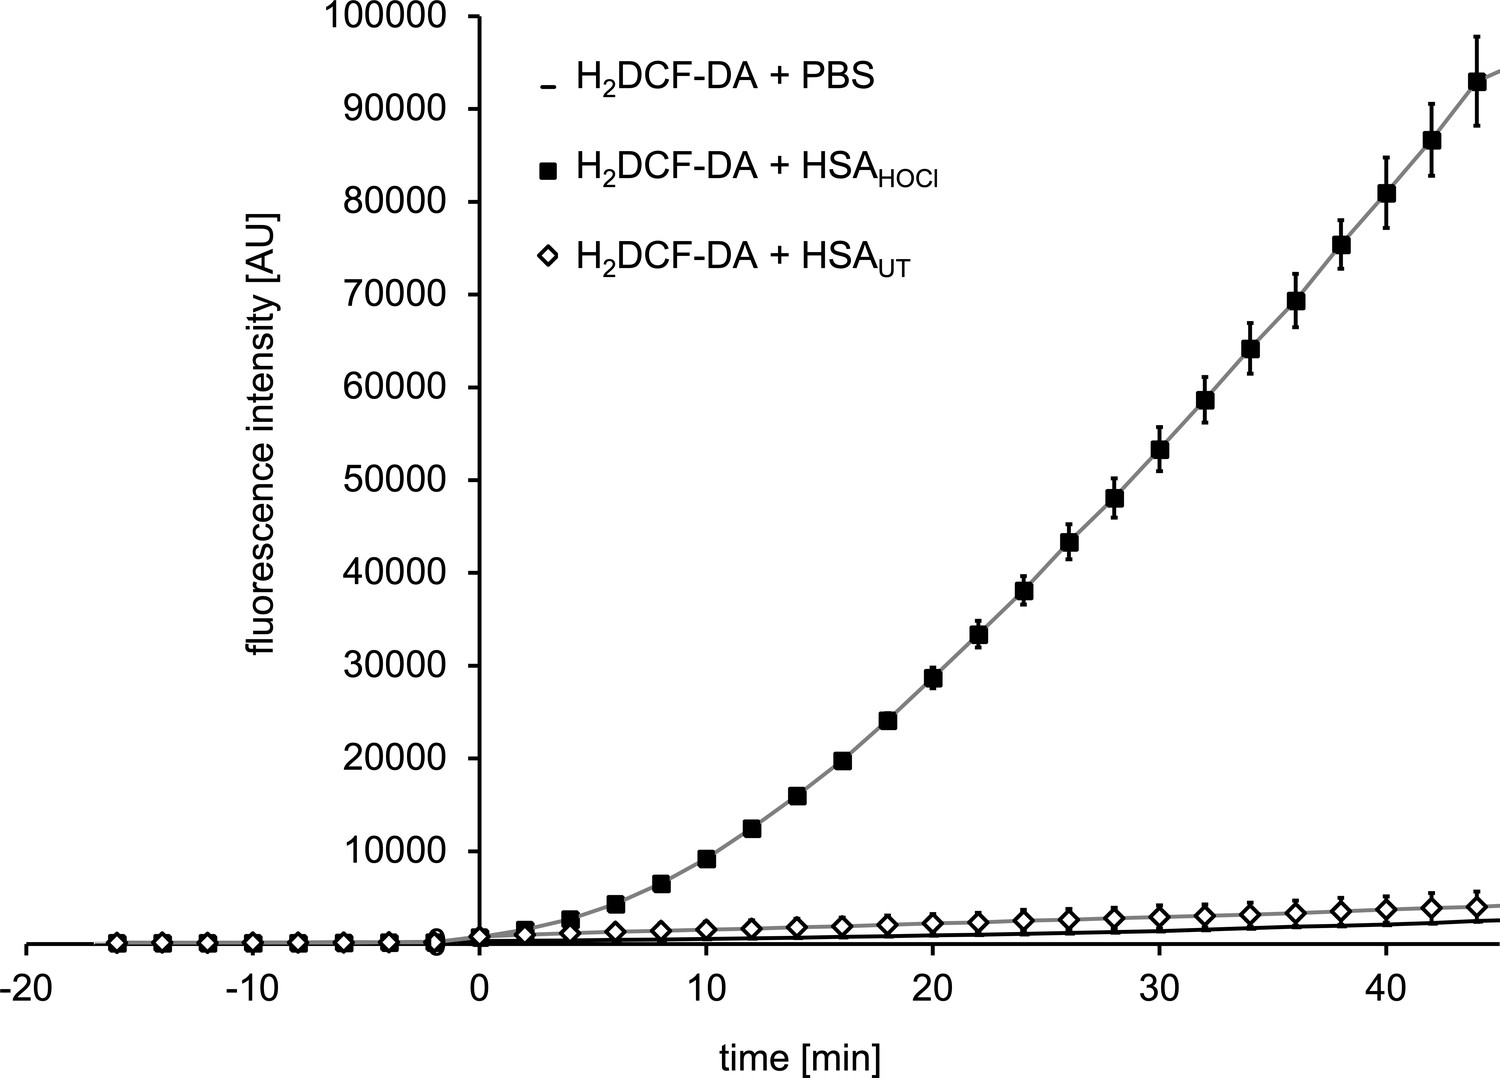
N-chlorinated serum albumin converts 7‘-dichlorodihydrofluorescein diacetate (H2DCF-DA) to the fluorescent 2’, 7’-dichlorofluorescein (DCF).
H2DCF-DA is a commonly used fluorescent probe for monitoring intracellular production of reactive oxygen species. H2DCF-DA was preincubated with 1xPBS for 15 min prior to the addition of native HSA (HSA UT), HOCl-modified HSA (HSA HOCl) or buffer (PBS). The fluorescence intensity of DCF was recorded for 45 min.
-
Figure 4—figure supplement 1—source data 1
Numerical chemiluminescence plate reader data represented in Figure 4—figure supplement 2.
- https://doi.org/10.7554/eLife.47395.030
Figure 4—figure supplement 3
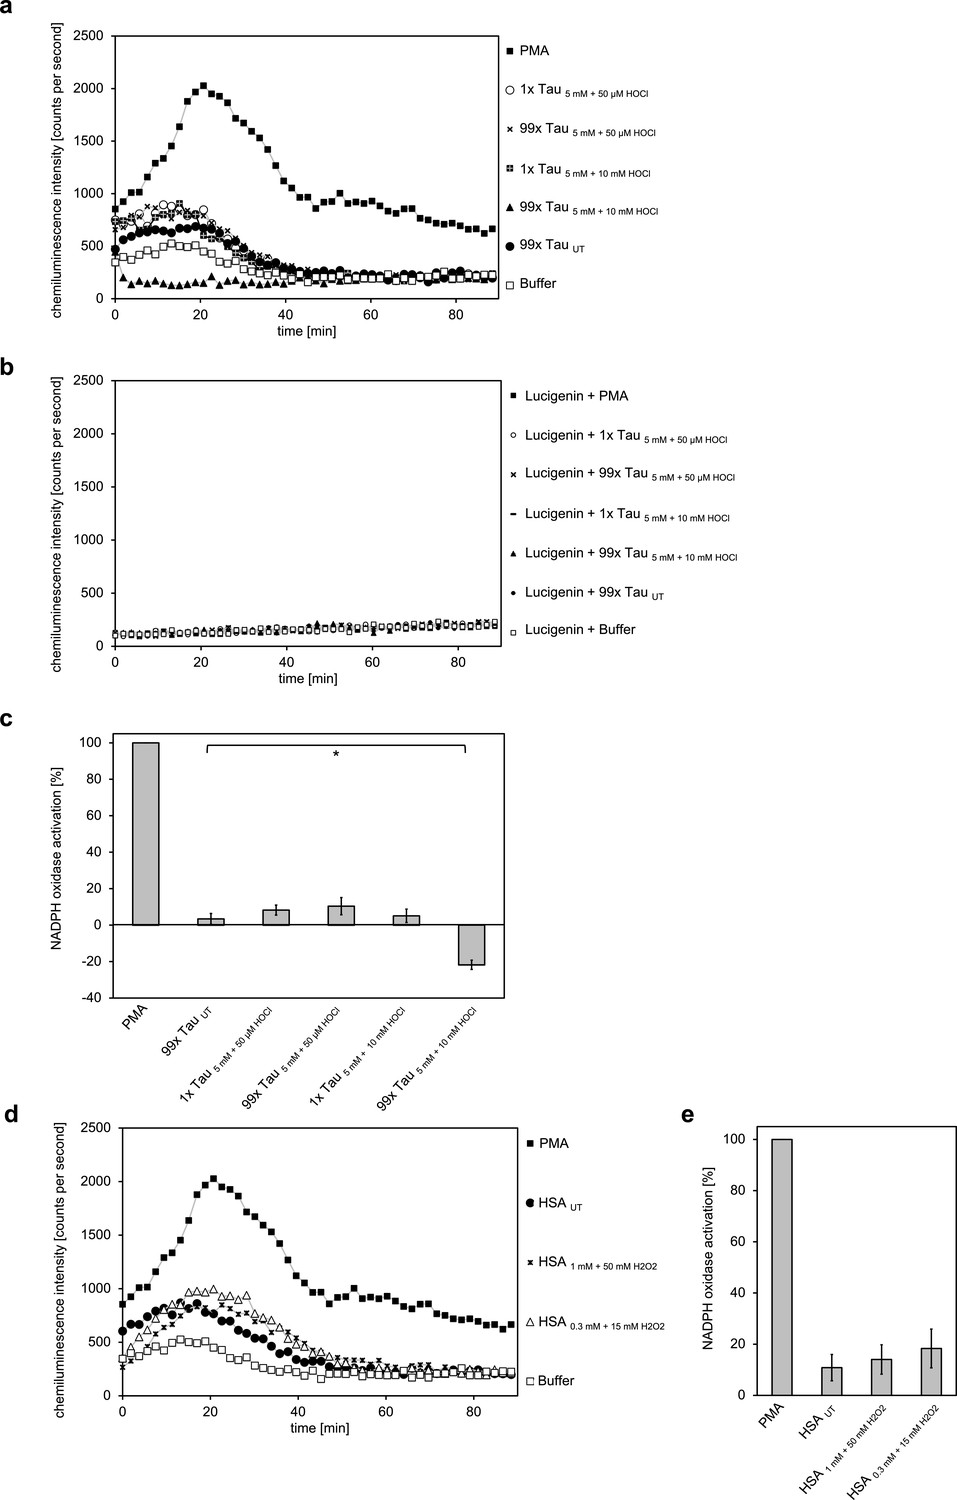
Taurine N-chloride and hydrogen peroxide-treated HSA do not induce the respiratory burst in neutrophil-like cells.
(a) The model N-chloramine prepared in different ways (5 mM of taurine treated with either 50 µM or 10 mM of HOCl) at different molar excesses (1- or 99-fold the molarity of HSA used) did not lead to significant activation of the respiratory burst in differentiated PLB-985 cells. (b) Likewise, it did not have an effect on lucigenin in the absence of cells. (c) Results shown in a are expressed as integrated total counts (means and standard deviations of three independent measurements) higher (or in case of 99 x Tau 5 mM +10 mM HOCl lower) than buffer control. PMA-induced activation of NADPH-oxidase was set to 100%.
-
Figure 4—figure supplement 3—source data 1
Numerical chemiluminescence plate reader data represented in Figure 4—figure supplement 3.
- https://doi.org/10.7554/eLife.47395.032
Figure 5

All plasma protein fractions tested exhibit reversible chaperone activity upon modification by HOCl.
α2-Macroglobulin (a, b), Cohn fraction IV (c, d) and the γ-globulin fraction (e, f) were analyzed for chaperone activity in a citrate synthase aggregation assay upon treatment with various doses of HOCl. Each plasma protein fraction, when treated with a 10-, 50- or 150-fold molar excess of HOCl, significantly decreased aggregation of chemically denatured citrate synthase as measured by light scattering at 360 nm. Exposure of the various HOCl-treated plasma proteins to the reductant ascorbate significantly decreased or completely inhibited their chaperone function. Methylation of basic amino acid residues prior to HOCl treatment mostly prevented chaperone-like conversion of the plasma proteins. In a, c and e representative measurements are shown. In b, d and f data are depicting means and standard deviations from three independent experiments. Student’s t-test: *p<0.05, **p<0.01, ***p<0.001. Aggregation of citrate synthase in the absence of any plasma protein fraction was set to 100% and all the data are presented as percentage of this control. Labels of aggregation curves are written in the order of the final intensity of light scattering of the respective treatment.
-
Figure 5—source data 1
Numerical light scattering data obtained during protein aggregation assays represented in Figure 5a and b.
- https://doi.org/10.7554/eLife.47395.036
-
Figure 5—source data 2
Numerical light scattering data obtained during protein aggregation assays represented in Figure 5c and d.
- https://doi.org/10.7554/eLife.47395.037
-
Figure 5—source data 3
Numerical light scattering data obtained during protein aggregation assays represented in Figure 5e and f.
- https://doi.org/10.7554/eLife.47395.038
Figure 6
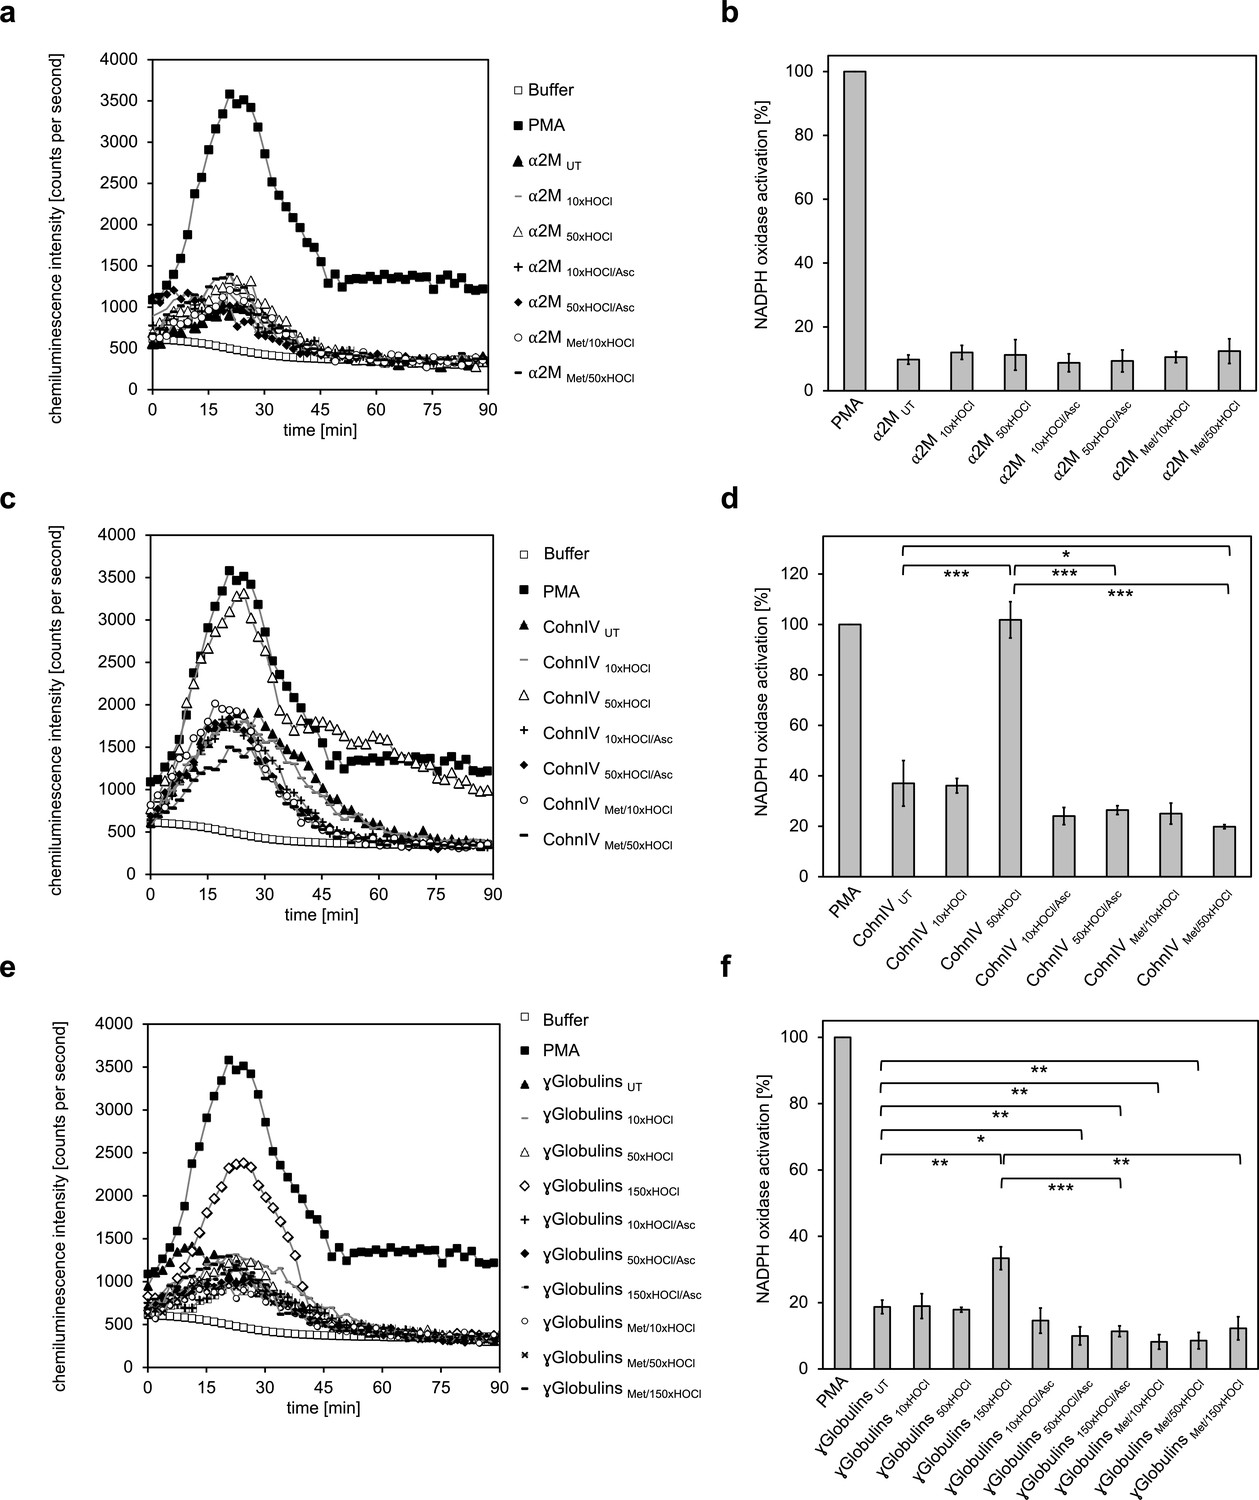
The majority of human plasma proteins stimulate neutrophil respiratory burst upon N-chlorination by HOCl.
The effect of HOCl-treated α2-macroglobulin (α2M) (a, b), Cohn fraction IV (c, d) and the γ-globulin fraction (e, f) on the activity of the neutrophil NADPH oxidase was investigated. α2M, when treated with various doses of HOCl, had no influence on ROS generation by the NADPH oxidase (a, b). Treatment with a 50- or 150-fold molar excess of HOCl converted at least some proteins of Cohn fraction IV (CohnIV 50xHOCl) and the γ-globulin fraction (γGlobulins 150xHOCl), respectively, into efficient inducers of the neutrophil respiratory burst, reflected by the increased production and release of oxidants that induce lucigenin chemiluminescence (c-f). The activating function of CohnIV 50xHOCl and γGlobulins 150xHOCl could be reversed by treatment with the reductant ascorbate (CohnIV 50xHOCl/Asc and γGlobulins 150xHOCl/Asc) and was abrogated by methylation of basic amine side chains prior to HOCl exposure (CohnIV Met/50xHOCl and γGlobulins Met/150xHOCl). (a, c, e) Extracellular oxidant production by neutrophil NADPH oxidase was measured in one- to two-minutes intervals over 90 min at 37°C using lucigenin-enhanced chemiluminescence. Phorbol 12-myristate 13-acetate (PMA; final concentration (fc), 0.2 µM), untreated and the variously treated plasma fraction samples (fc, 2 mg · mL−1 for α2-macroglobulin and 3 mg · mL−1 for Cohn fraction IV and the γ-globulin fraction) from the previous citrate synthase aggregation assays (see above) or PBS buffer (basal oxidant production) were added to differentiated PLB-985 cells in PBS buffer containing 400 µM lucigenin immediately prior to chemiluminescence measurement. (b, d, f) Results are expressed as integrated total counts (means and standard deviations of three independent measurements) higher than buffer control. Student’s t-test: *p<0.05, **p<0.01, ***p<0.001. PMA- induced activation of NADPH-oxidase was set to 100%.
-
Figure 6—source data 1
Numerical chemiluminescence plate reader data represented in Figure 6a and b.
- https://doi.org/10.7554/eLife.47395.040
-
Figure 6—source data 2
Numerical chemiluminescence plate reader data represented in Figure 6c and d.
- https://doi.org/10.7554/eLife.47395.041
-
Figure 6—source data 3
Numerical chemiluminescence plate reader data represented in Figure 6e and f.
- https://doi.org/10.7554/eLife.47395.042
Figure 7 with 1 supplement
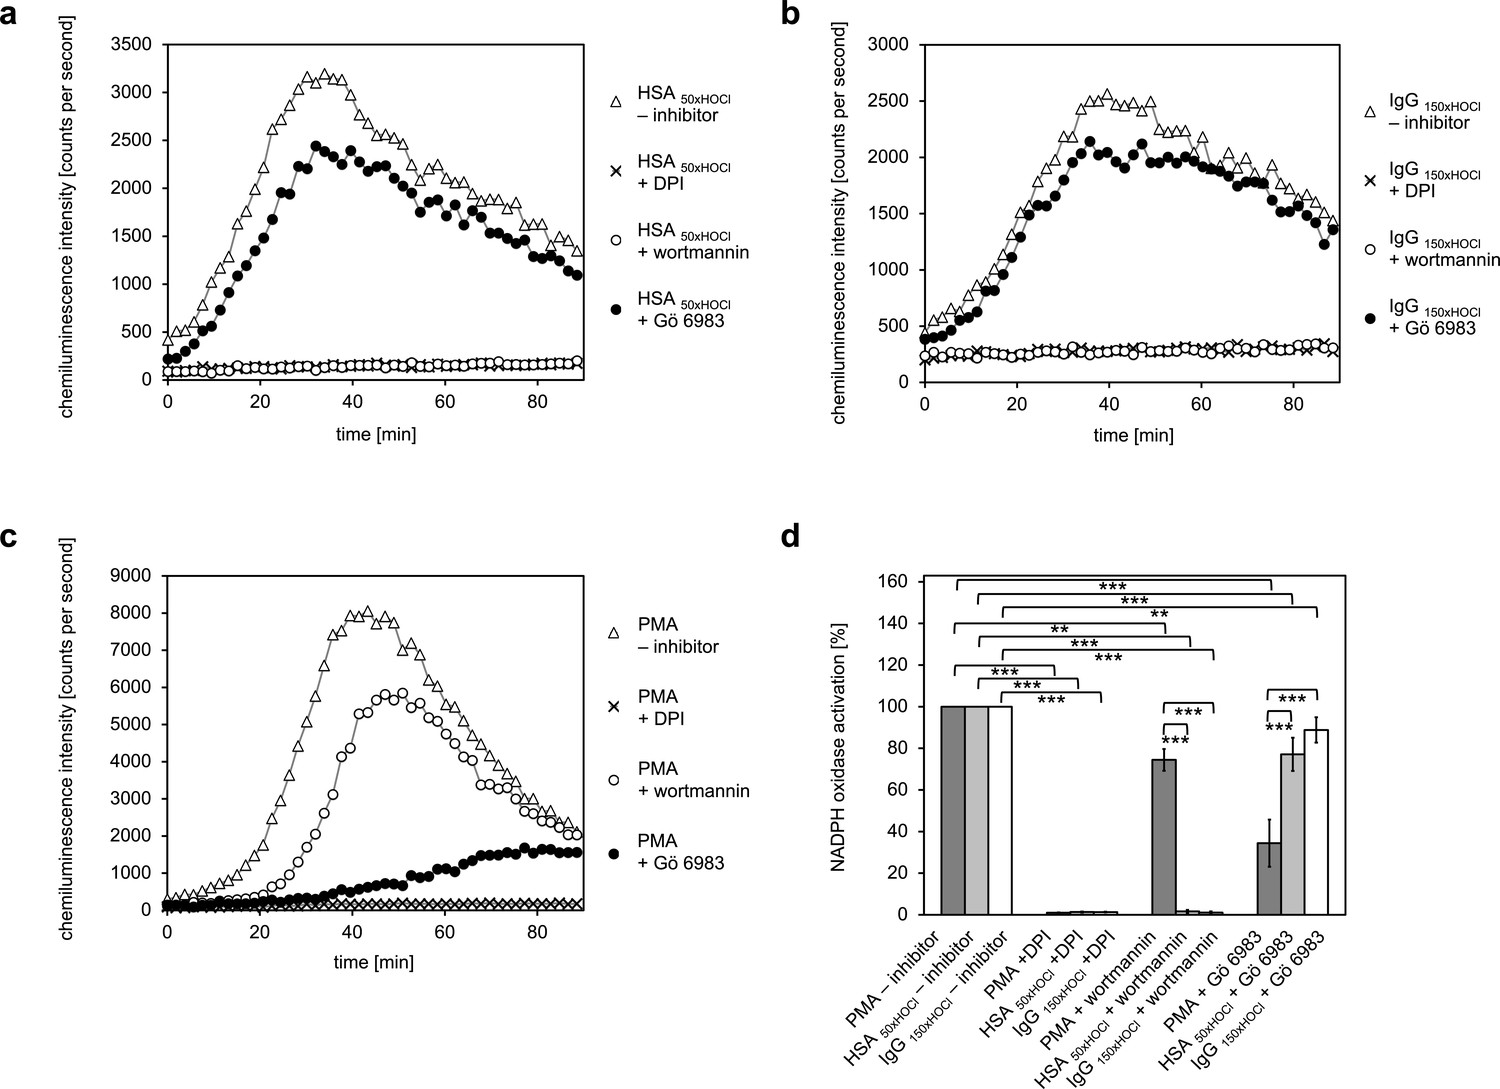
Activation of the NADPH oxidase of neutrophil-like cells by HOCl-treated serum albumin and immunoglobulin G occurs predominantly via a PI3K-dependent signaling pathway.
Effect of 10 μM diphenyleneiodonium (DPI; NADPH oxidase inhibitor), 100 nM wortmannin (PI3K inhibitor) and 200 nM Gö 6983 (protein kinase C (PKC) inhibitor) on the NADPH oxidase activation mediated by (a) 3 mg · mL−1 HSA 50xHOCl, (b) 3 mg · mL−1 IgG 150xHOCl and (c) 0.2 µM PMA was tested. (d) Results shown in a, b and c are expressed as integrated total counts (means and standard deviations of three independent measurements) higher than the respective buffer control. Student’s t-test: **p<0.01, ***p<0.001.
-
Figure 7—source data 1
Numerical chemiluminescence plate reader data represented in Figure 7a and d.
- https://doi.org/10.7554/eLife.47395.046
-
Figure 7—source data 2
Numerical chemiluminescence plate reader data represented in Figure 7b and d.
- https://doi.org/10.7554/eLife.47395.047
-
Figure 7—source data 3
Numerical chemiluminescence plate reader data represented in Figure 7c and d.
- https://doi.org/10.7554/eLife.47395.048
Figure 7—figure supplement 1
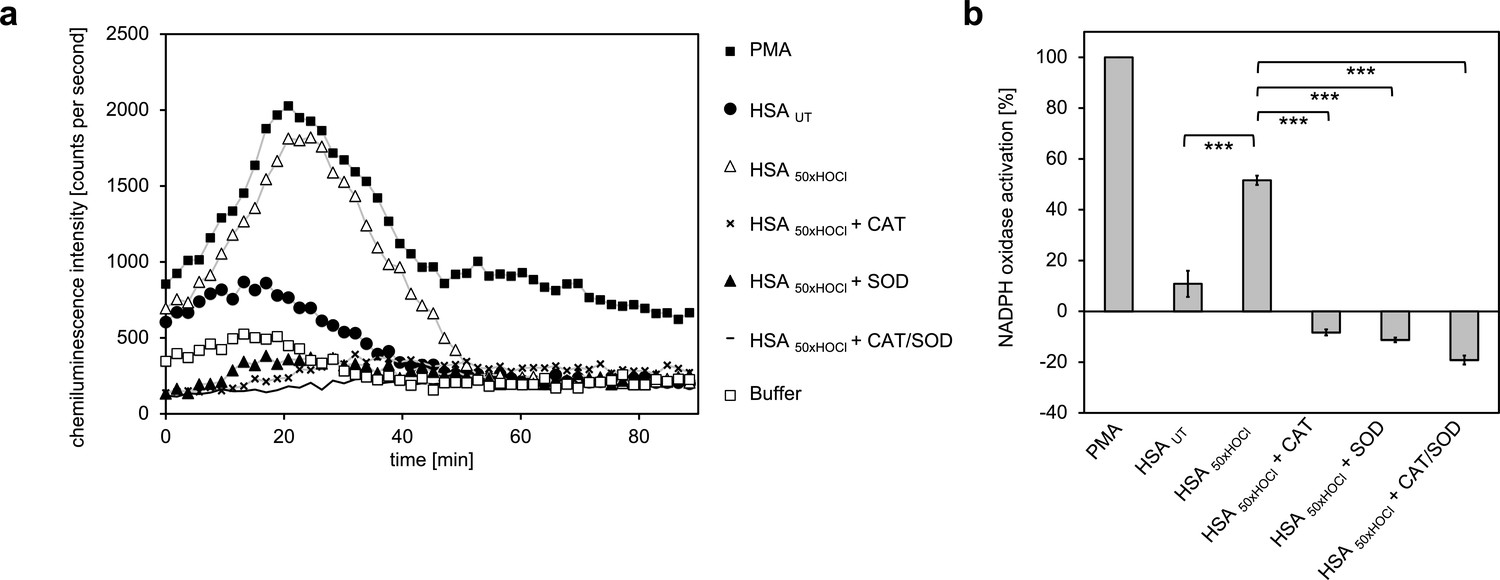
Addition of catalase, superoxide dismutase (SOD) or both inhibited immune cell-induced chemiluminescence of lucigenin.
(a) The addition of catalase (CAT), superoxide dismutase (SOD) or both to differentiated PLB-985 cells incubated with HOCl-treated HSA prevented lucigenin chemiluminescence. (b) Results shown in a are expressed as integrated total counts (means and standard deviations of three independent measurements) higher or lower than buffer control. Student’s t-test: ***p<0.001. PMA-induced activation of NADPH-oxidase was set to 100%.
-
Figure 7—figure supplement 1—source data 1
Numerical chemiluminescence plate reader data represented in Figure 7—figure supplement 1.
- https://doi.org/10.7554/eLife.47395.045
Figure 8
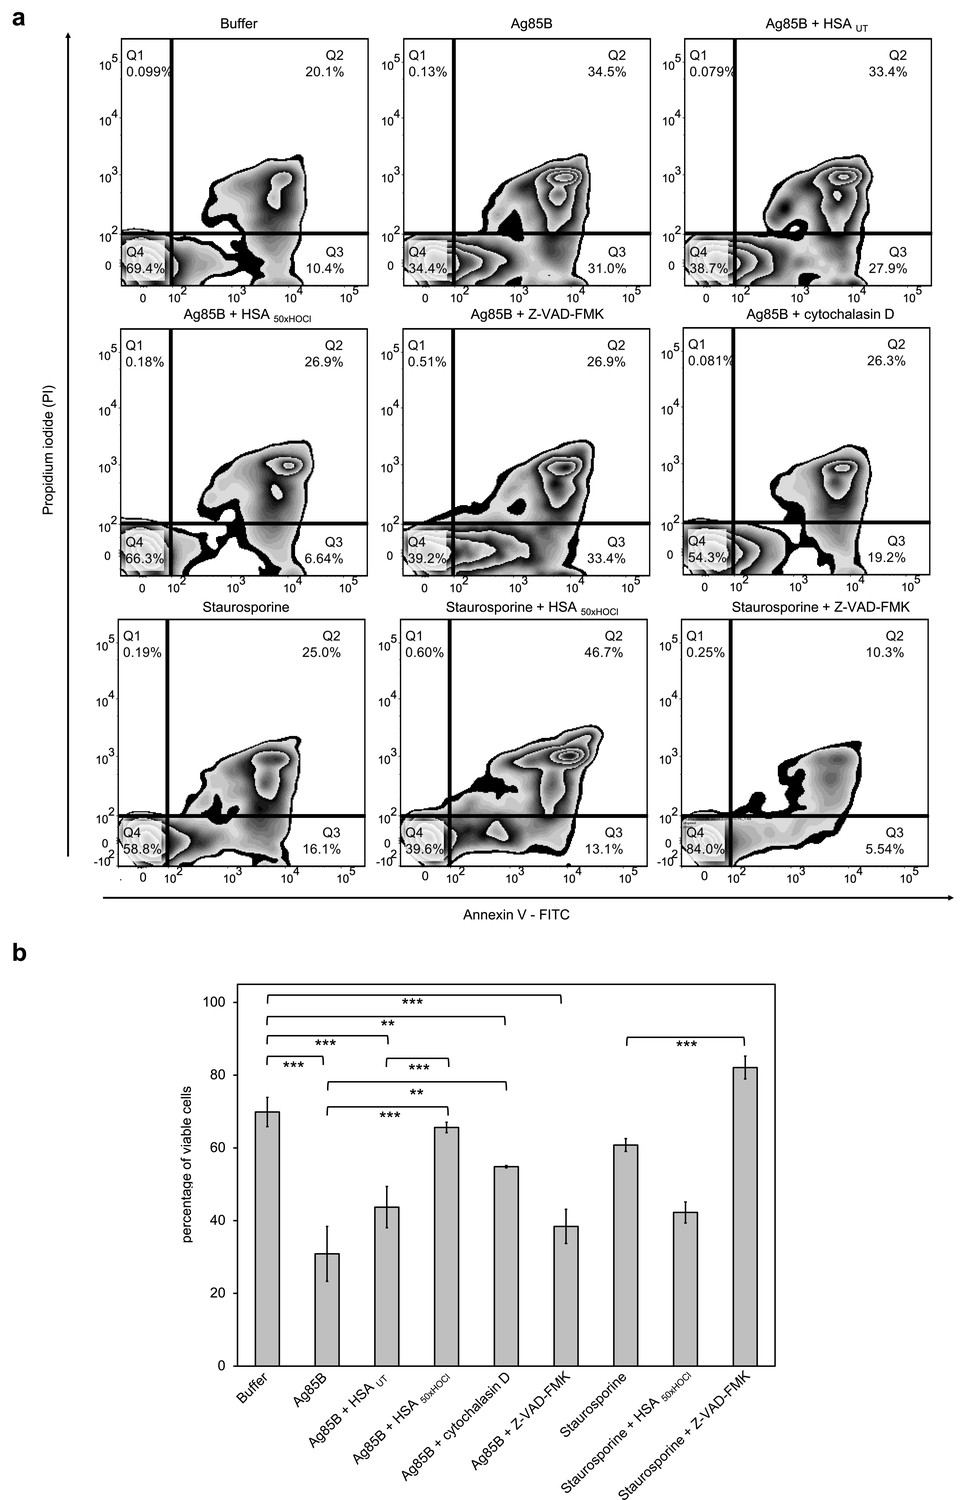
HOCl-treated serum albumin improves survival of neutrophil-like cells in the presence of the major mycobacterial protein antigen Ag85B.
Differentiated neutrophil-like PLB-985 cells were preincubated with 50 μM Z-VAD-FMK, 155 μM native (HSA UT) or HOCl-treated HSA (HSA 50xHOCl) prior to the addition of 1 μM Ag85B or 2 μM staurosporine. After 1 hr (Ag85B) or 6 hr (staurosporine) of incubation, viability of the variously treated cells was assessed by flow cytometry using Annexin V/propidium iodide (PI) staining. Cells treated only with buffer served as control. (a) Annexin V-FITC vs. propidium iodide dot plots show all analyzed events. Staining of cells simultaneously with Annexin V- FITC (green fluorescence) and the non-vital dye PI (red fluorescence) allows the discrimination of viable, intact cells (FITC-, PI-; Q4), early apoptotic (FITC+, PI-; Q3) and late apoptotic/necrotic cells (FITC+, PI+; Q2). 20,000 events were acquired and recorded per sample. Data were analyzed using FlowJo (version 10) software. Results shown are representative of three experiments. (b) Results of three independent experiments for viable cells are shown (means and standard deviations). Student’s t-test: *p<0.05, **p<0.01, ***p<0.001.
-
Figure 8—source data 1
Numerical flow cytometry data represented in Figure 8a and b.
- https://doi.org/10.7554/eLife.47395.050
Figure 9
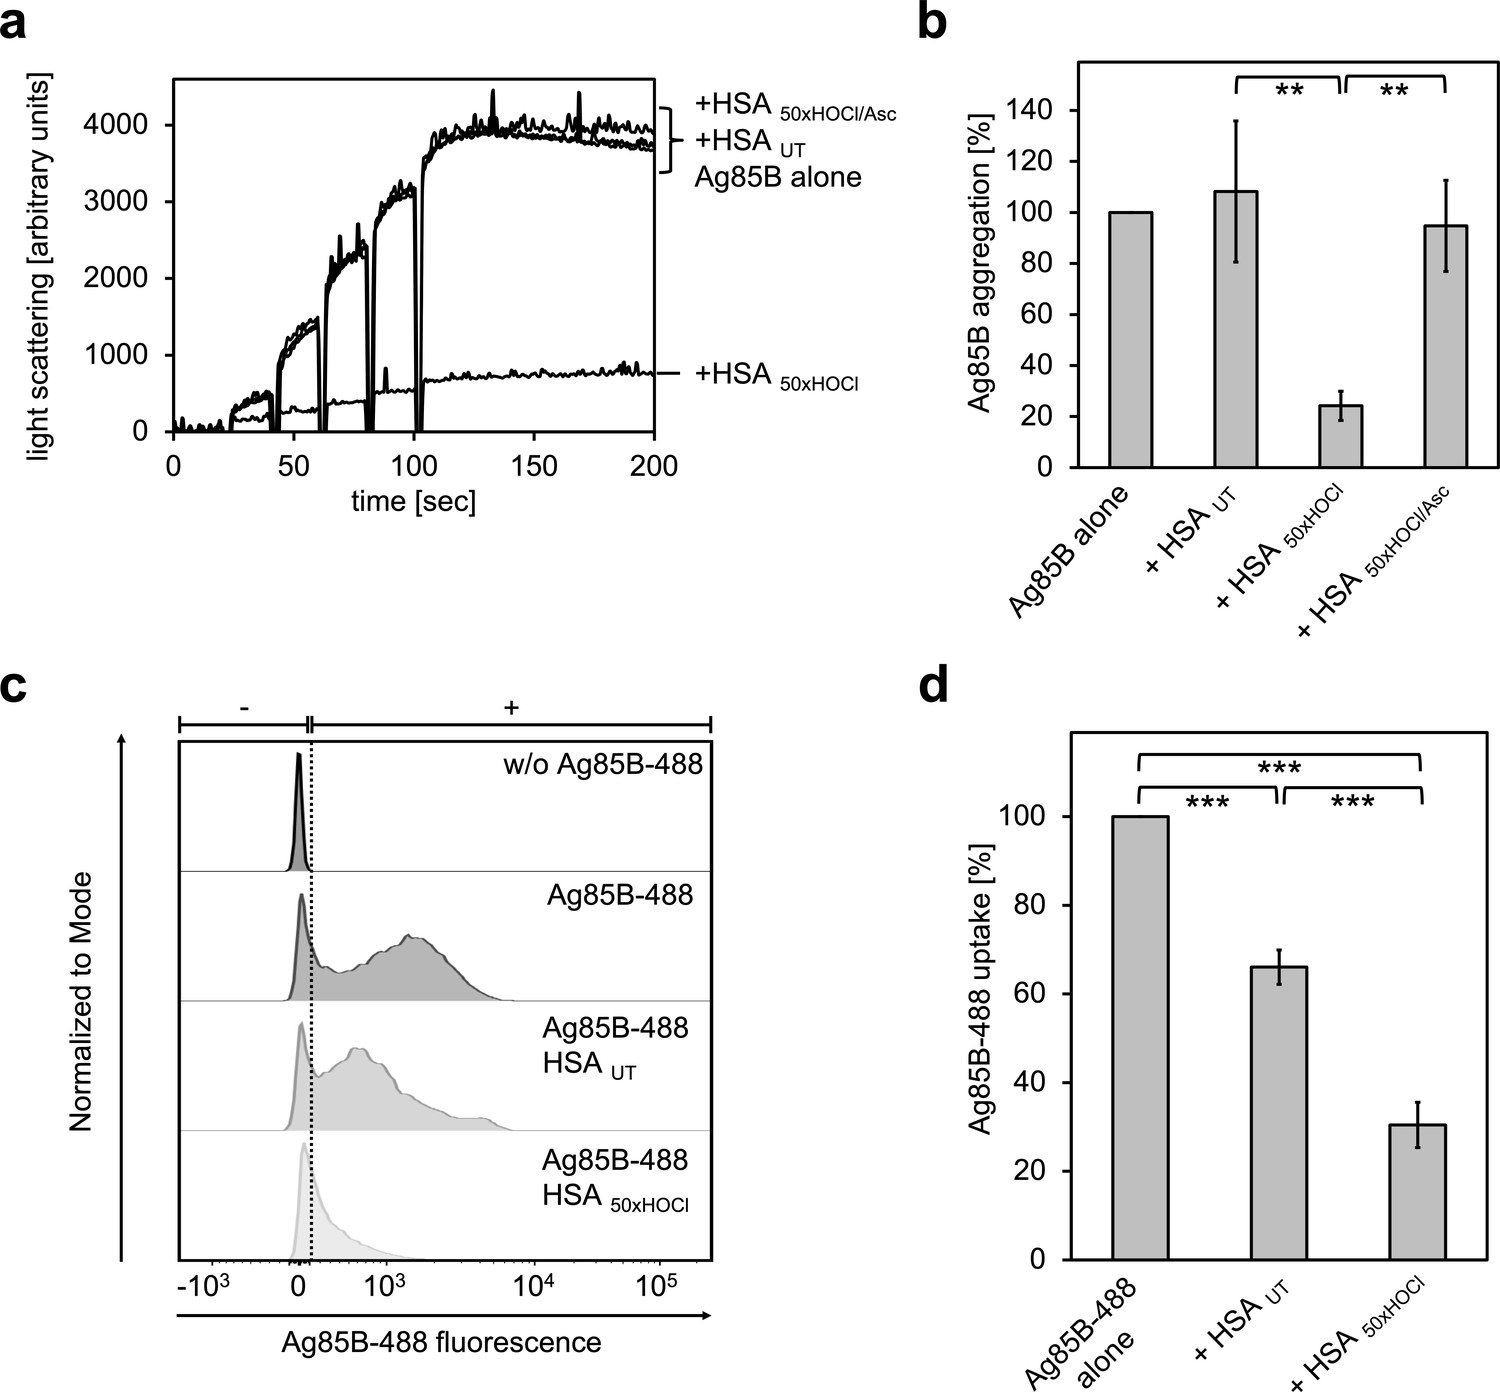
HOCl-treated serum albumin binds to and prevents uptake of the major mycobacterial protein antigen Ag85B by neutrophil-like cells.
(a, b) HSA, treated with a 50-fold molar excess of HOCl (HSA 50xHOCl) significantly decreased aggregation of denatured Ag85B as measured by light scattering at 360 nm. Reduction of HSA 50xHOCl with a 50-fold molar excess of the antioxidant ascorbate (HSA 50xHOCl/Asc) reversed this chaperone activity. (a) A representative measurement of Ag85B aggregation in the presence of native HSA (HSA UT), HSA 50xHOCl and HSA 50xHOCl/Asc is shown. Labels of aggregation curves are written in the order of the final intensity of light scattering of the respective treatment. (b) Data are represented as means and standard deviations from three independent aggregation assays. Aggregation of Ag85B in the absence of HSA was set to 100% and all the data are presented as percentage of this control. (c, d) Differentiated neutrophil-like PLB-985 cells were incubated in the absence or presence of the fluorescently-labeled Ag85B protein, Ag85B-488. In some cases, HSA UT or HSA 50xHOCl was added at a 50-fold molar excess over Ag85B-488 to the cells. After one hour of incubation, uptake of fluorescent Ag85B-488 by the variously treated cells was assessed by flow cytometry. 30,000 events were acquired and recorded per sample. Data were analyzed using FlowJo (version 10) software. (c) Single-parameter histogram overlays of Ag85B-488 fluorescence of the various samples are shown. (d) Results of three independent experiments are shown (means and standard deviations). Student’s t-test: **p<0.01, ***p<0.001. Uptake of Ag85B-488, reflected by the median fluorescence intensity, in the absence of HSA was set to 100%.
-
Figure 9—source data 1
Numerical light scattering data obtained during protein aggregation assays represented in Figure 9a and b.
- https://doi.org/10.7554/eLife.47395.052
-
Figure 9—source data 2
Numerical flow cytometry data obtained during protein aggregation assays represented in Figure 9c and d.
- https://doi.org/10.7554/eLife.47395.053
Figure 10
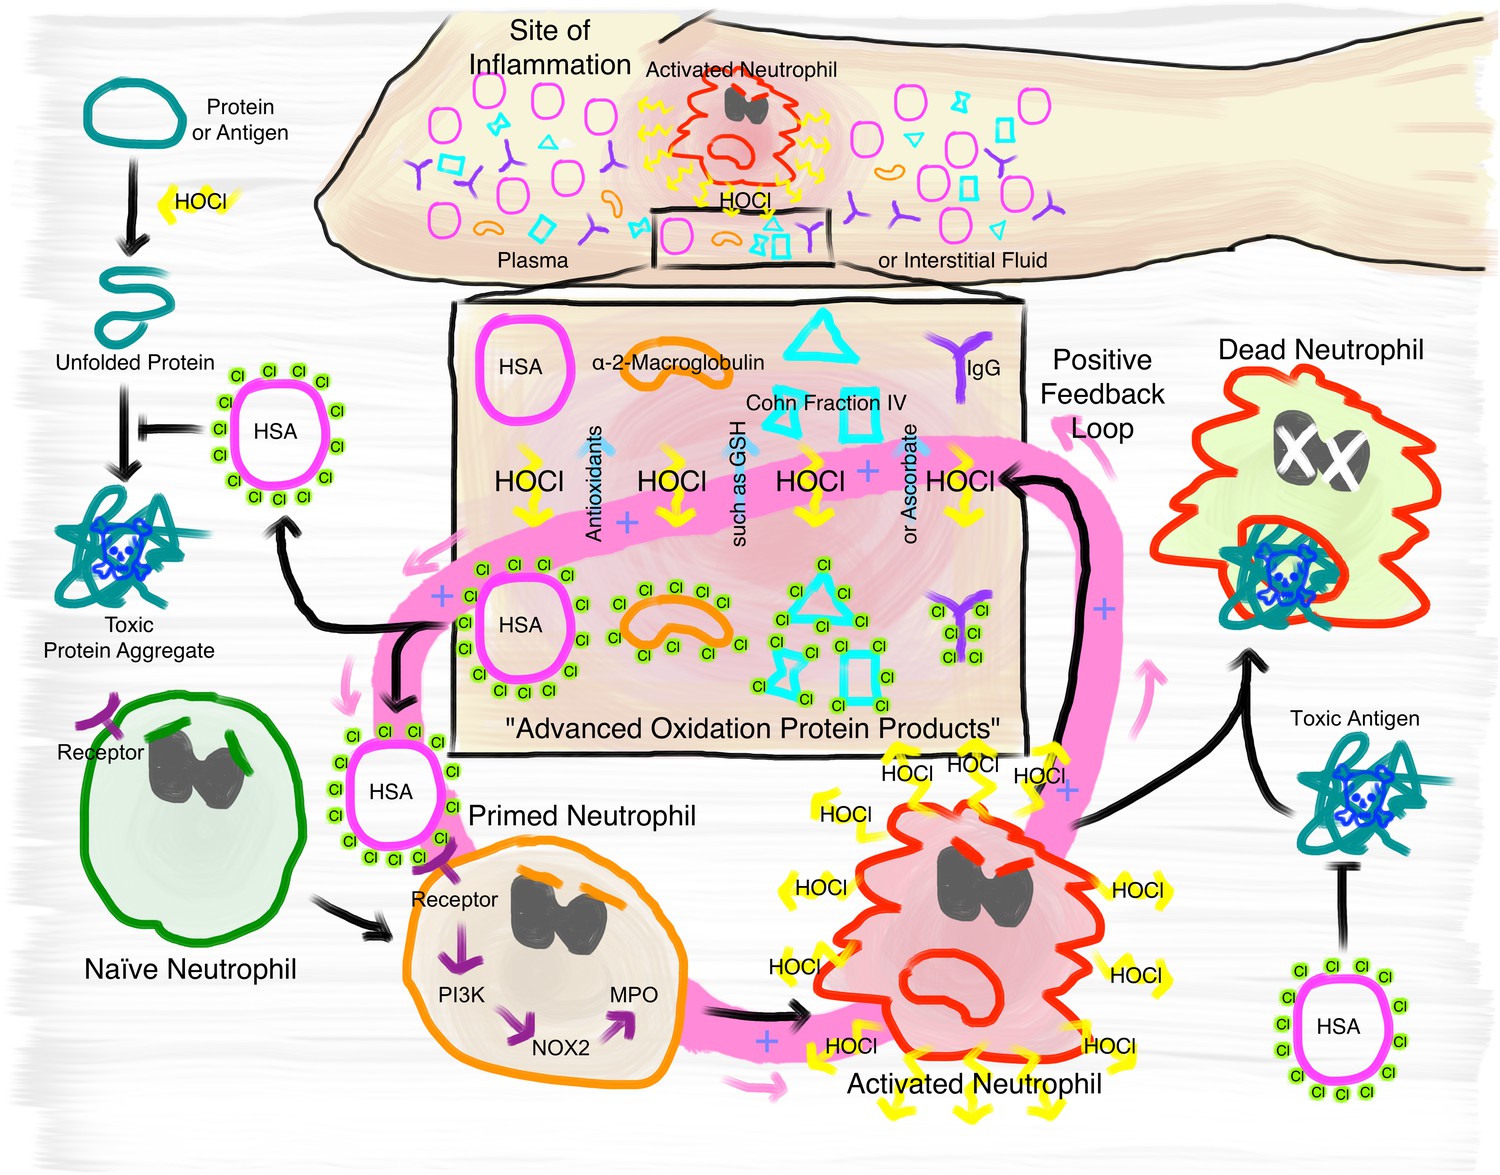
Proposed mechanism of the immunomodulatory role of N-chlorination of plasma proteins at a site of inflammation.
At the site of inflammation neutrophils (and potentially other immune cells) are activated. Neutrophils then produce HOCl at concentrations of up to 25 to 50 mM per hour. Plasma proteins, such as HSA, α- and β-globulins (Cohn Fraction IV), γ-globulins (IgG), and α2-Macroglobulin then act as an effective sink. Reversible N-chlorination of these proteins turns them into effective chaperons, which can prevent the formation of protein aggregates and their uptake by immune cells, enhancing the survival of neutrophils in the presence of toxic antigens. N-chlorinated plasma proteins also activate more immune cells, which then in turn produce more HOCl, leading to the formation of more N-chlorinated plasma proteins. This positive feedback loop can be attenuated and deactivated by antioxidants present in plasma, such as ascorbate and reduced glutathione (GSH).
Tables
Table 1
E. coli strains, plasmids and primers used in this study.
https://doi.org/10.7554/eLife.47395.055| Relevant properties or genotype | Source or reference | |
|---|---|---|
| E. coli strains | ||
| DH5α | supE44, ΔlacU169 (φ80 lacZΔM15) hsdR17 recA1 endA1 hsdR gyrA relA thi | Invitrogen |
| BL21(DE3) | F– ompT gal dcm lon hsdSB(rB- mB-) λ(DE3 [lacI lacUV5- T7 gene one ind1 sam7 nin5]) | Stratagene, Santa Clara, CA |
| Plasmids | ||
| pEXA_fbpB | AmpR pEX-A128 vector carrying synthesized fbpB gene from M. bovis | Eurofins Genomics |
| pET22b (+) | AmpR, vector for overexpression of genes in E. coli | Novagen |
| pET22b-fbpB | AmpR, vector for overexpression of fbpB gene in E. coli BL21(DE3) | This study |
| Primers | Sequence (5’ - > 3’) | |
| fbpB-fw | CCCCATATGTTCTCTCGTCCGG | |
| fbpB-rv | CCCCTCGAGACCAGCACCCAG | |
-
* AmpR, ampicillin resistance.
Additional files
-
Transparent reporting form
- https://doi.org/10.7554/eLife.47395.056
Download links
A two-part list of links to download the article, or parts of the article, in various formats.
Downloads (link to download the article as PDF)
Open citations (links to open the citations from this article in various online reference manager services)
Cite this article (links to download the citations from this article in formats compatible with various reference manager tools)
N-chlorination mediates protective and immunomodulatory effects of oxidized human plasma proteins
eLife 8:e47395.
https://doi.org/10.7554/eLife.47395


