HDX-MS reveals nucleotide-dependent, anti-correlated opening and closure of SecA and SecY channels of the bacterial translocon
- King's College London, United Kingdom
- Imperial College London, United Kingdom
- University of Bristol, United Kingdom
- University of Oxford, United Kingdom
Figures
Figure 1
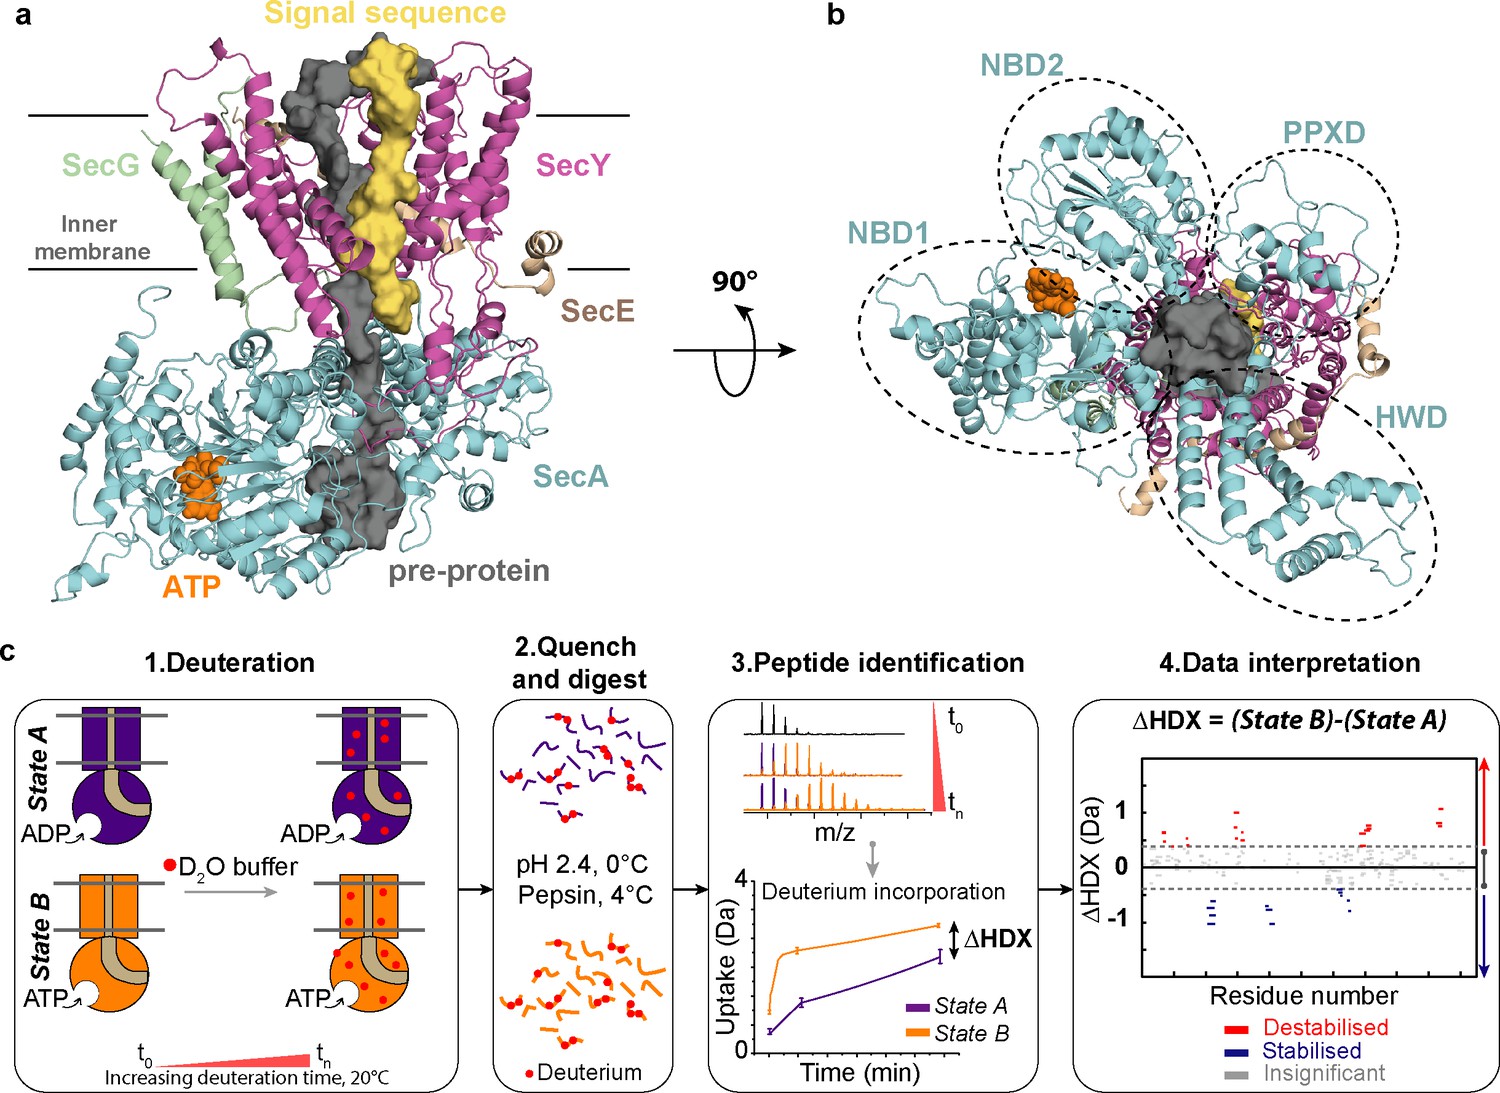
Structure of SecA-SecYEG complex and HDX-MS workflow.
(a) Structure and sub-domains of SecA-SecYEG (based in 3DIN as in Zimmer et al., 2008, modelled with a pre-protein; Corey et al., 2016a). The pre-protein, ATP and signal sequence are highlighted in grey, orange and yellow, respectively. (b) Top view of the complex highlighting the nucleotide-binding-domains NBD1 and NBD2 as well as PPXD (Pre-Protein cross-linking Domain) and HWD (Helical Wing Domain) (c) Overview of the HDX-MS process. The sample is prepared in detergent micelles (DDM) and after addition of nucleotides is incubated in a deuterated solvent (1). Following deuteration of the mixture at different time-points, the HDX reaction is quenched and the protein is digested with pepsin (2). Peptides are separated by liquid chromatography and subsequently identified by mass spectrometry (MS). The mass uptake of the protein in different conditions (e.g. AMPPNP vs ADP) is then compared (3). Peptides with significant difference in deuterium uptake are mapped onto a Woods plot (4). The length of lines represent the peptide sizes. Blue and red regions indicate significant protection and deprotection, respectively. Insignificant differences, calculated by a 99% confidence interval, are shown in grey.
Figure 2 with 3 supplements
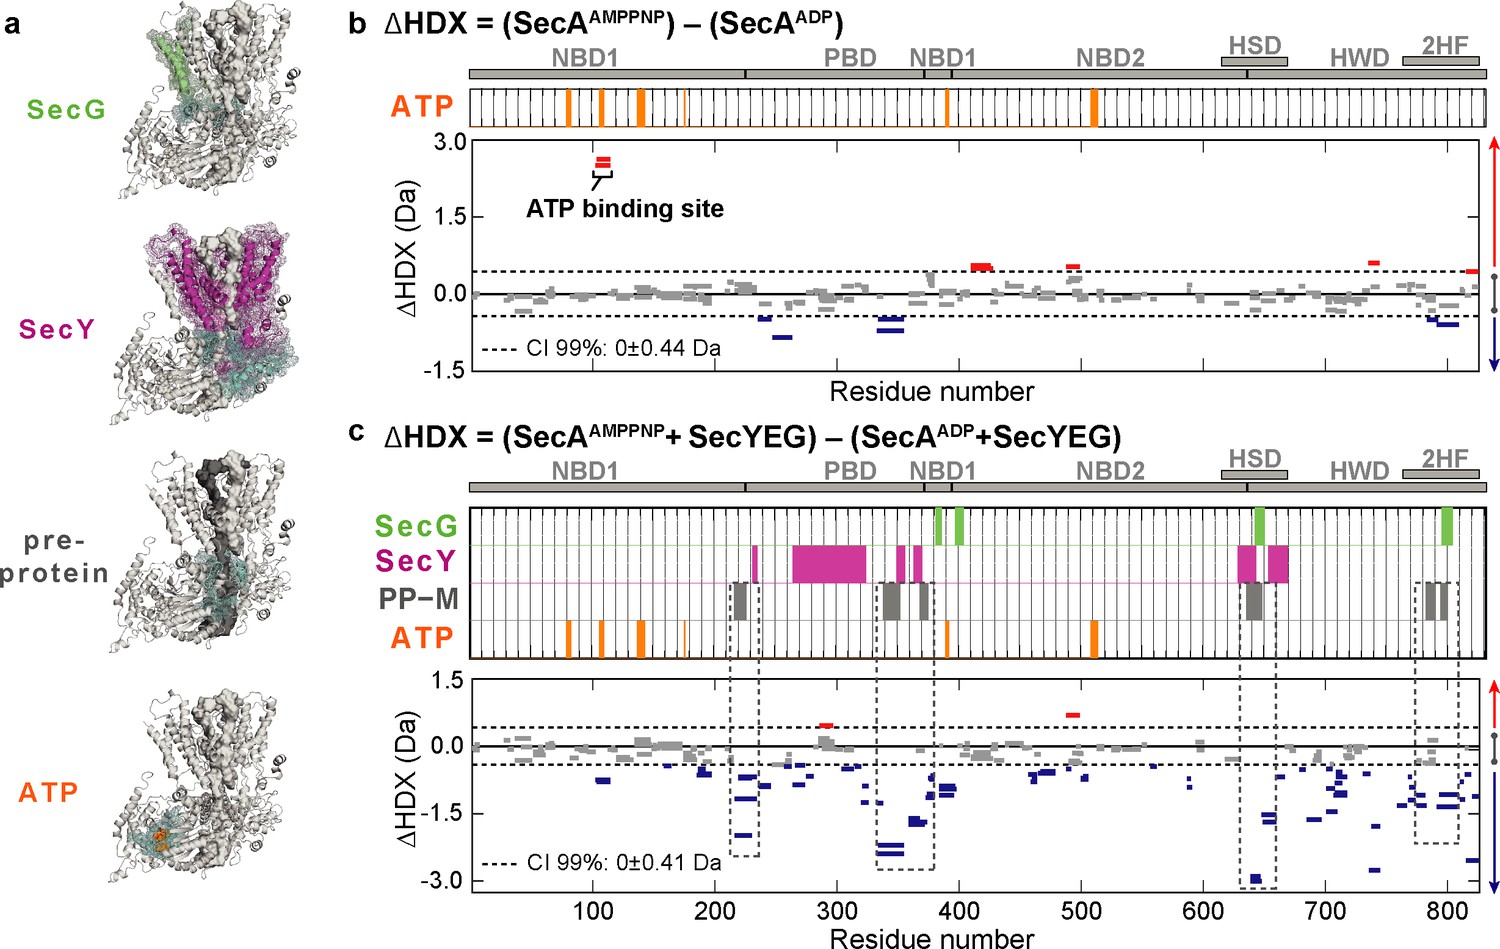
Impact of nucleotides on the conformational dynamics of SecA.
(a) Structures of the complex highlighting the contact sites (cyan) in SecA with SecG (green), SecY (pink), mature regions of the pre-protein (PP-M; grey) and ATP (orange). Significant sum differences in relative deuterium uptake (ΔHDX = AMPPNP-ADP) of (b) SecA without SecYEG, and (c) of SecA in the presence of a molar excess of SecYEG after 30 min of deuteration. Highlighted regions represent contacts with SecG, SecY, pre-protein (mature domain, PP-M) and ATP; coloured according to (a). Dashed boxes in (c) highlight regions in contact with the pre-protein mature domain (PP-M). Detailed information of HDX-MS data is provided in Supplementary files 1a and 1b.
Figure 2—figure supplement 1
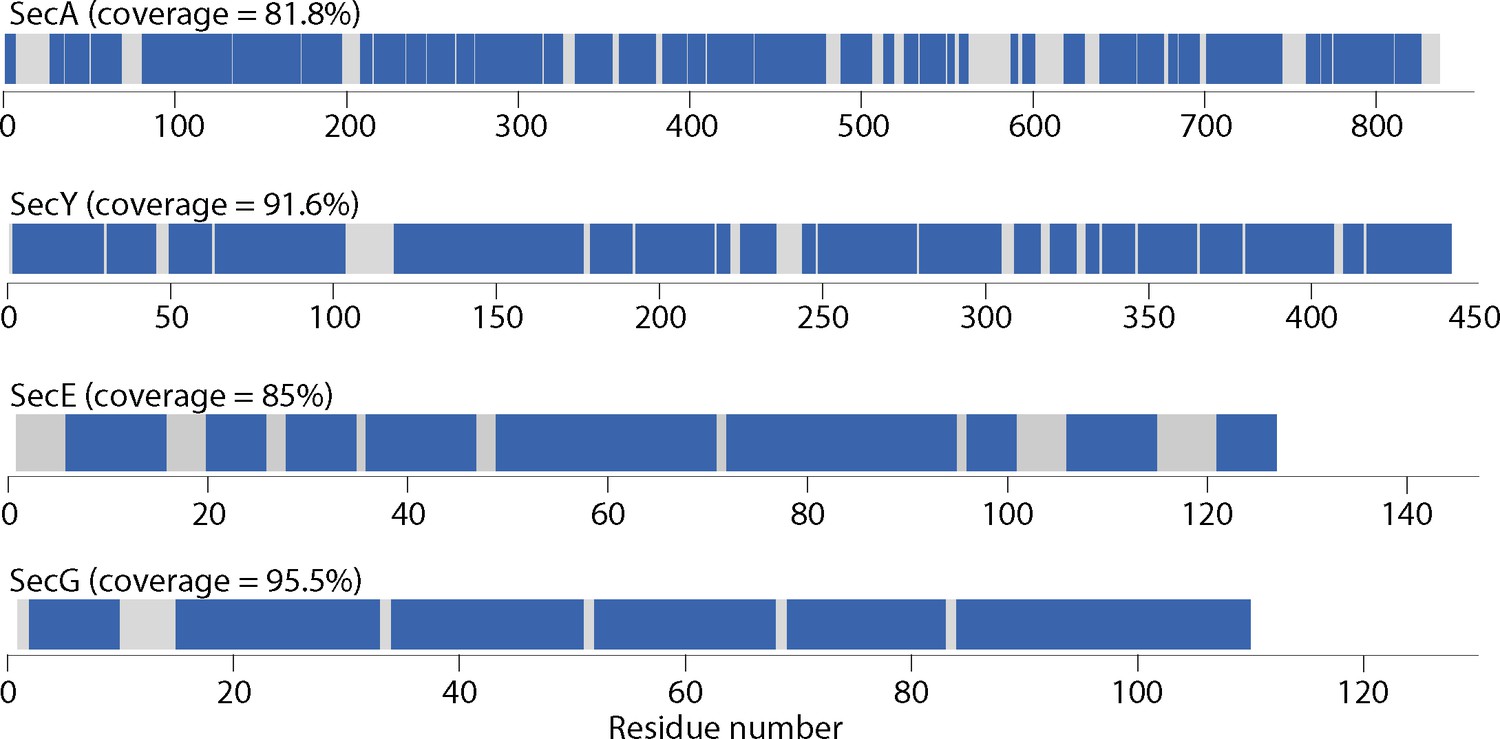
Linear protein coverage maps for SecA, SecY, SecE and SecG.
Maps were generated using Deuteros (Lau et al., 2019).
Figure 2—figure supplement 2
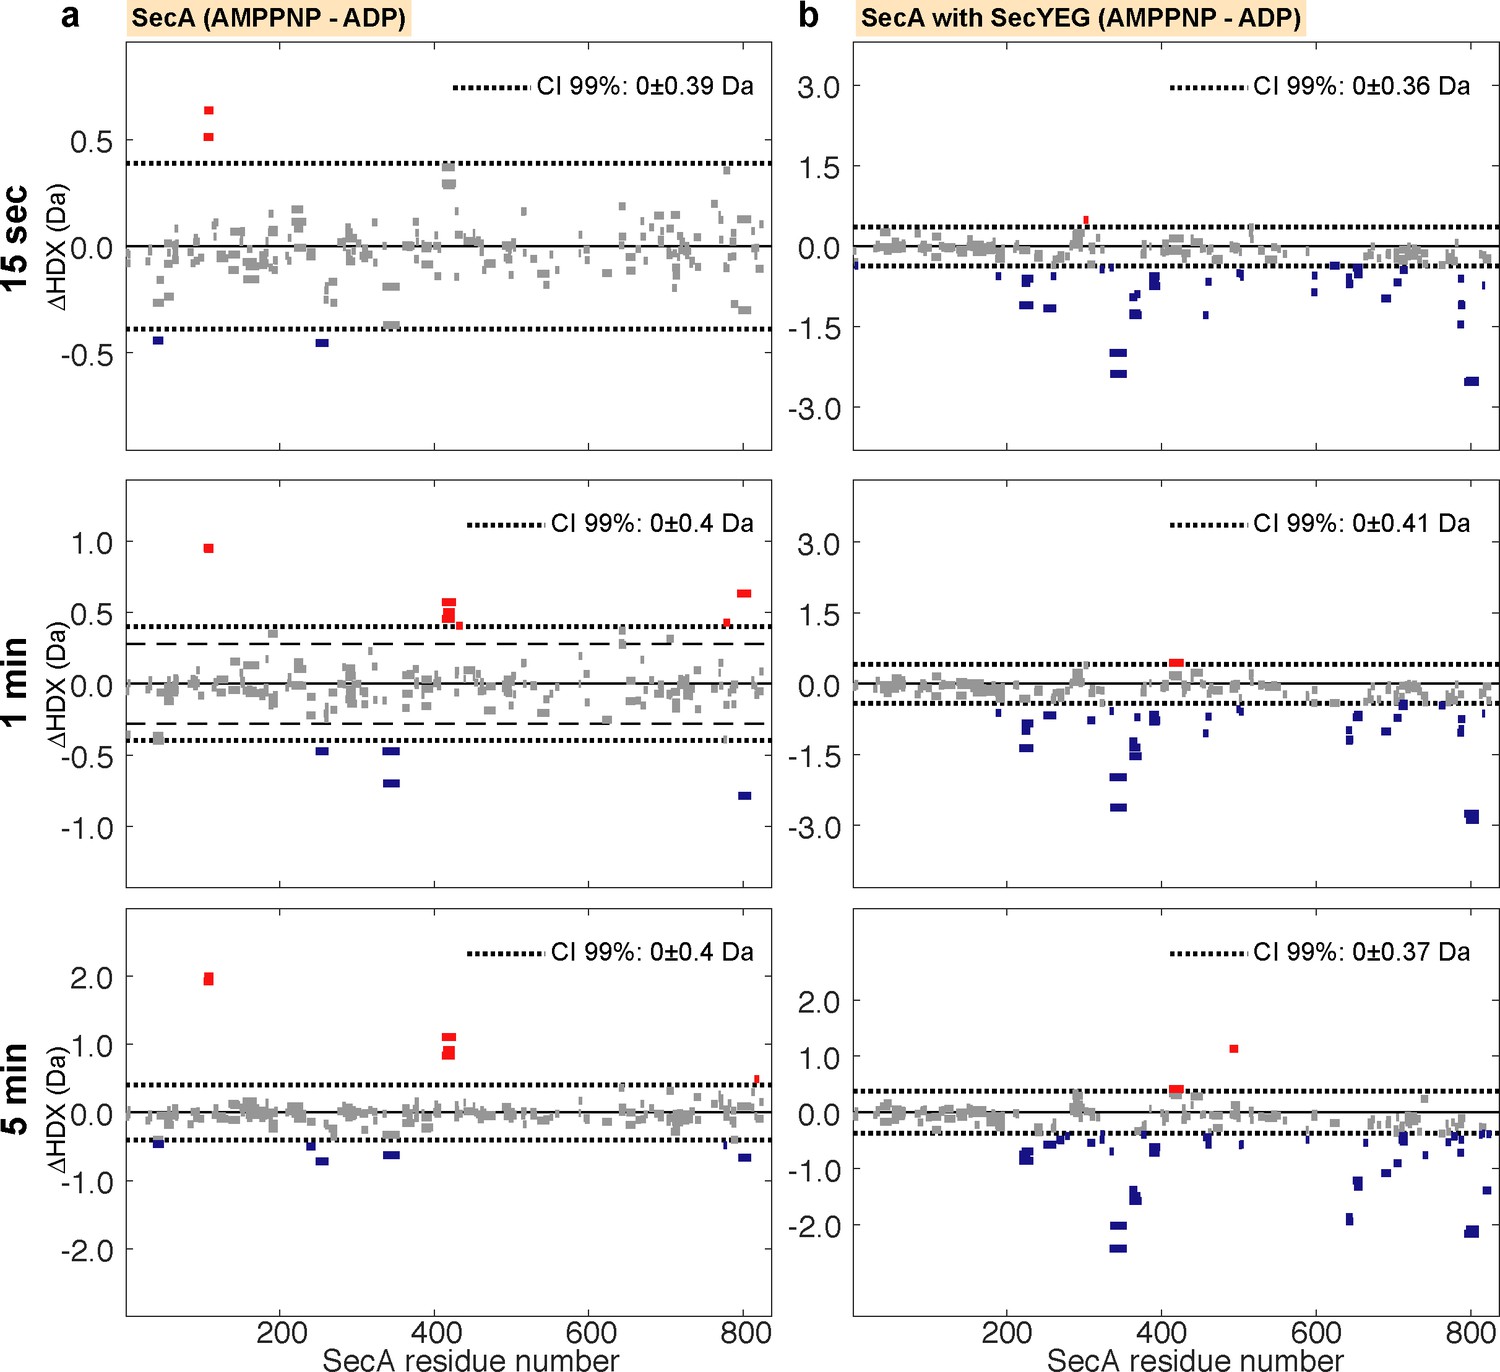
Woods plots illustrating the impact of nucleotides on the conformational dynamics of SecA.
Woods plots comparing the relative deuterium uptake (AMPPNP-ADP) of (a) SecA alone and (b) SecA in complex (and saturated) with SecYEG after incubation at 25°C in deuterated solvent for 15 s, 1, or 5 min. The dotted lines represent the 99% confidence interval, which indicates that the level of difference of deuterium uptake between the two compared states is statistically significant. Bars represent individual peptides. Bar length corresponds to peptide size. Red and blue coloured bars indicate statistically significant deprotected or protected peptides, respectively.
Figure 2—figure supplement 3
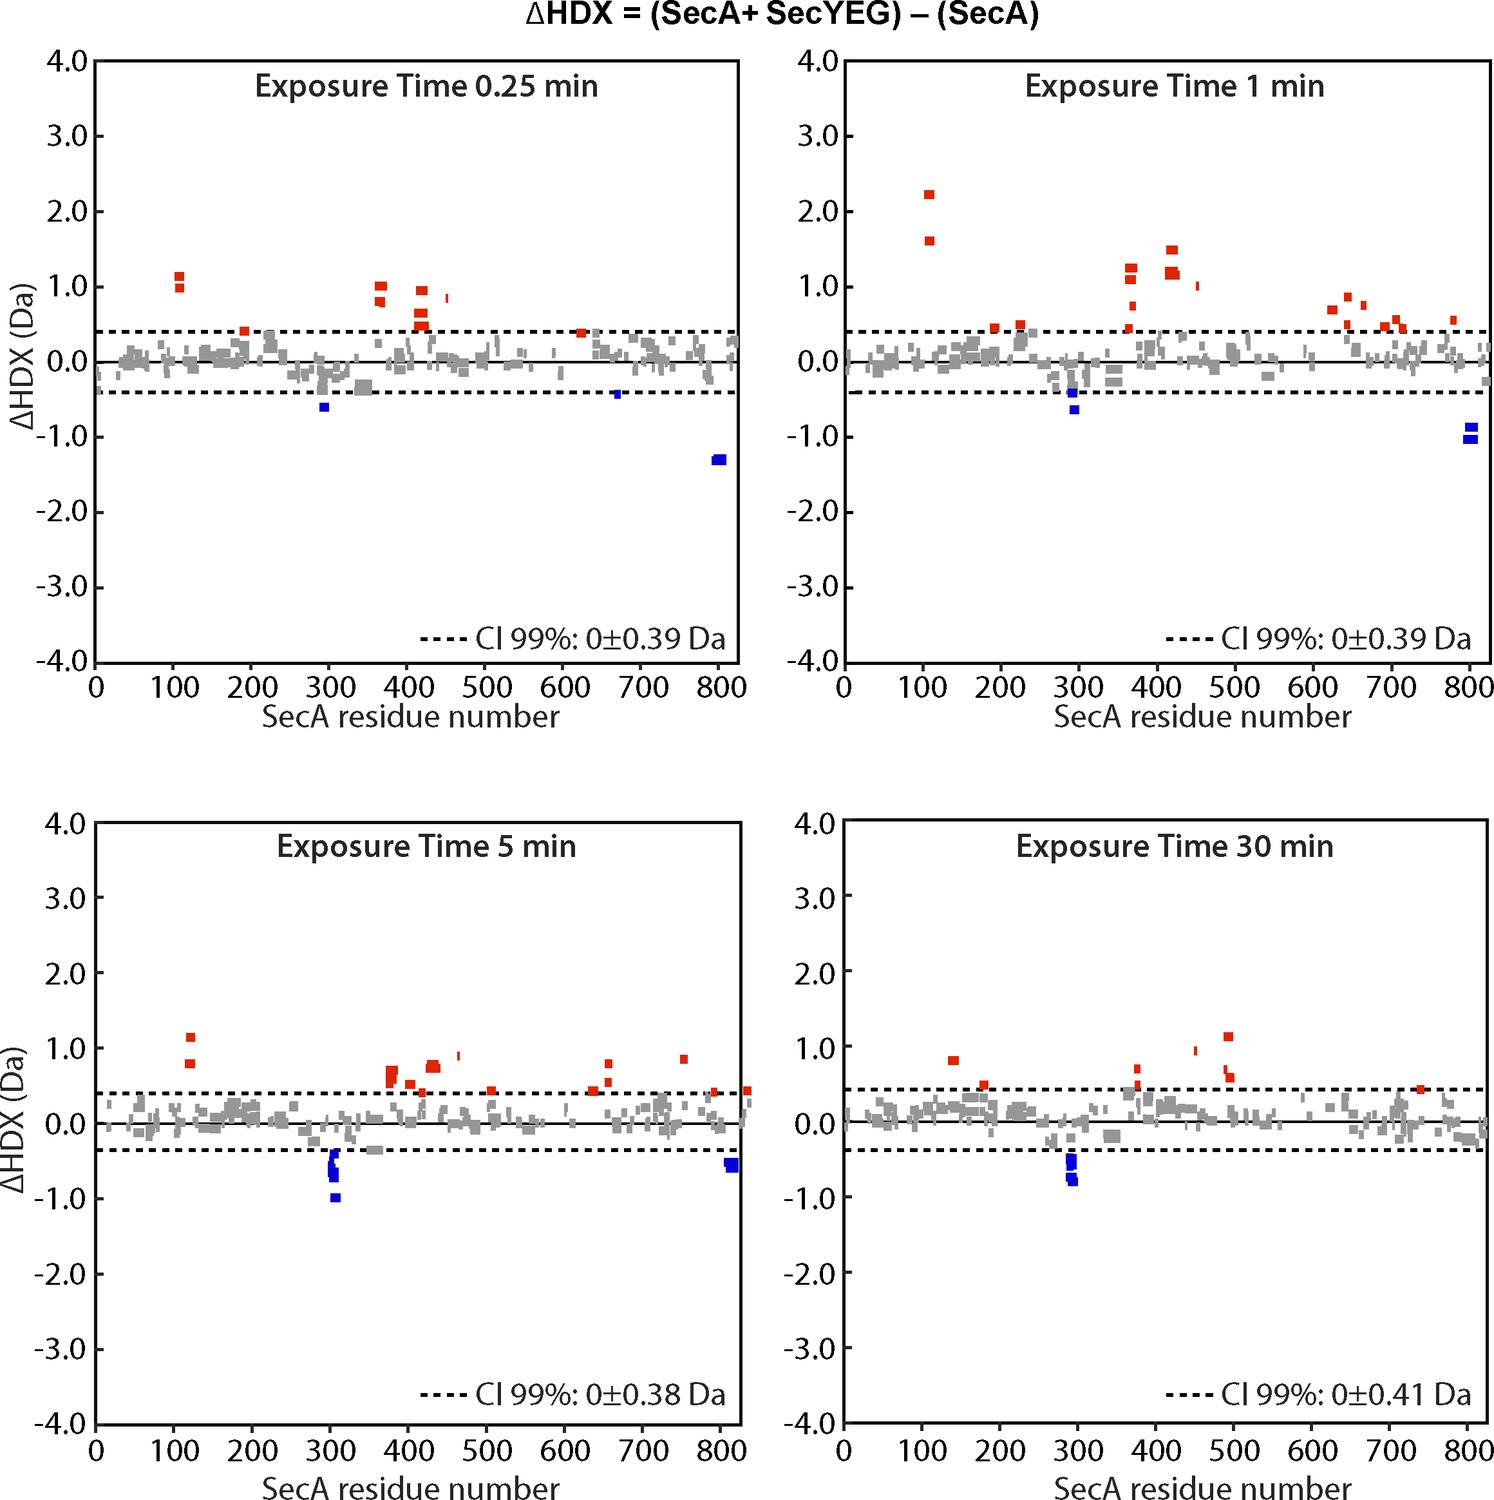
Impact of SecYEG binding on SecA.
Woods plots comparing the relative deuterium uptake of SecA upon interaction with SecYEG (present in excess) at 15 s, 1, 5 or 30 min. Results indicate an overall deprotection, hence destabilisation of SecA upon SecYEG binding.
Figure 3 with 1 supplement

Impact of nucleotides on the conformational dynamics of SecY, SecE and SecG.
(a) Structures of the SecA-SecYEG complex highlighting the contact sites of SecY (pink) and SecG (green) with SecA (cyan), signal sequence (PP-S; yellow) and pre-protein (PP-M; grey). (b-d) Significant sum differences in relative deuterium uptake (ΔHDX = AMPPNP-ADP) of (b) SecY, (c) SecE and (d) SecG in the presence of excess SecA at 30 min of deuteration. Regions interacting with SecY (b) and SecG (d) are highlighted: SecA, pre-protein mature domain (PP-M) and pre-protein signal sequence (PP-S); colour coding as in (a). Confidence intervals (CI; 99%) are shown as grey dotted lines. Red and blue bars indicate structural stabilisation (positive ΔHDX) and destabilisation (negative ΔHDX) of peptides, respectively. Grey bars indicate peptides with insignificant ΔHDX. Dashed boxes in (b) highlight regions interacting with the pre-protein signal sequence (PP-S) and the mature pre-protein (PP-M). Detailed information of HDX-MS data is provided in Supplementary file 2.
Figure 3—figure supplement 1

Woods plots illustrating the impact of nucleotides on the conformational dynamics of SecY, SecE and SecG.
Woods plots comparing the relative deuterium uptake of SecYEG while bound to SecA (AMPPNP-ADP), showing: (a) SecY (b) SecE and (c) SecG after incubation at 25°C in deuterated solvent for 15 s, 1, or 5 min. The dotted lines represent the 99% confidence interval, which indicates the level of difference of deuterium uptake between the two compared states is statistically significant. Bars represent individual peptides. Bar length corresponds to peptide size. Red and blue coloured bars indicate statistically significant deprotected or protected peptides, respectively.
Figure 4
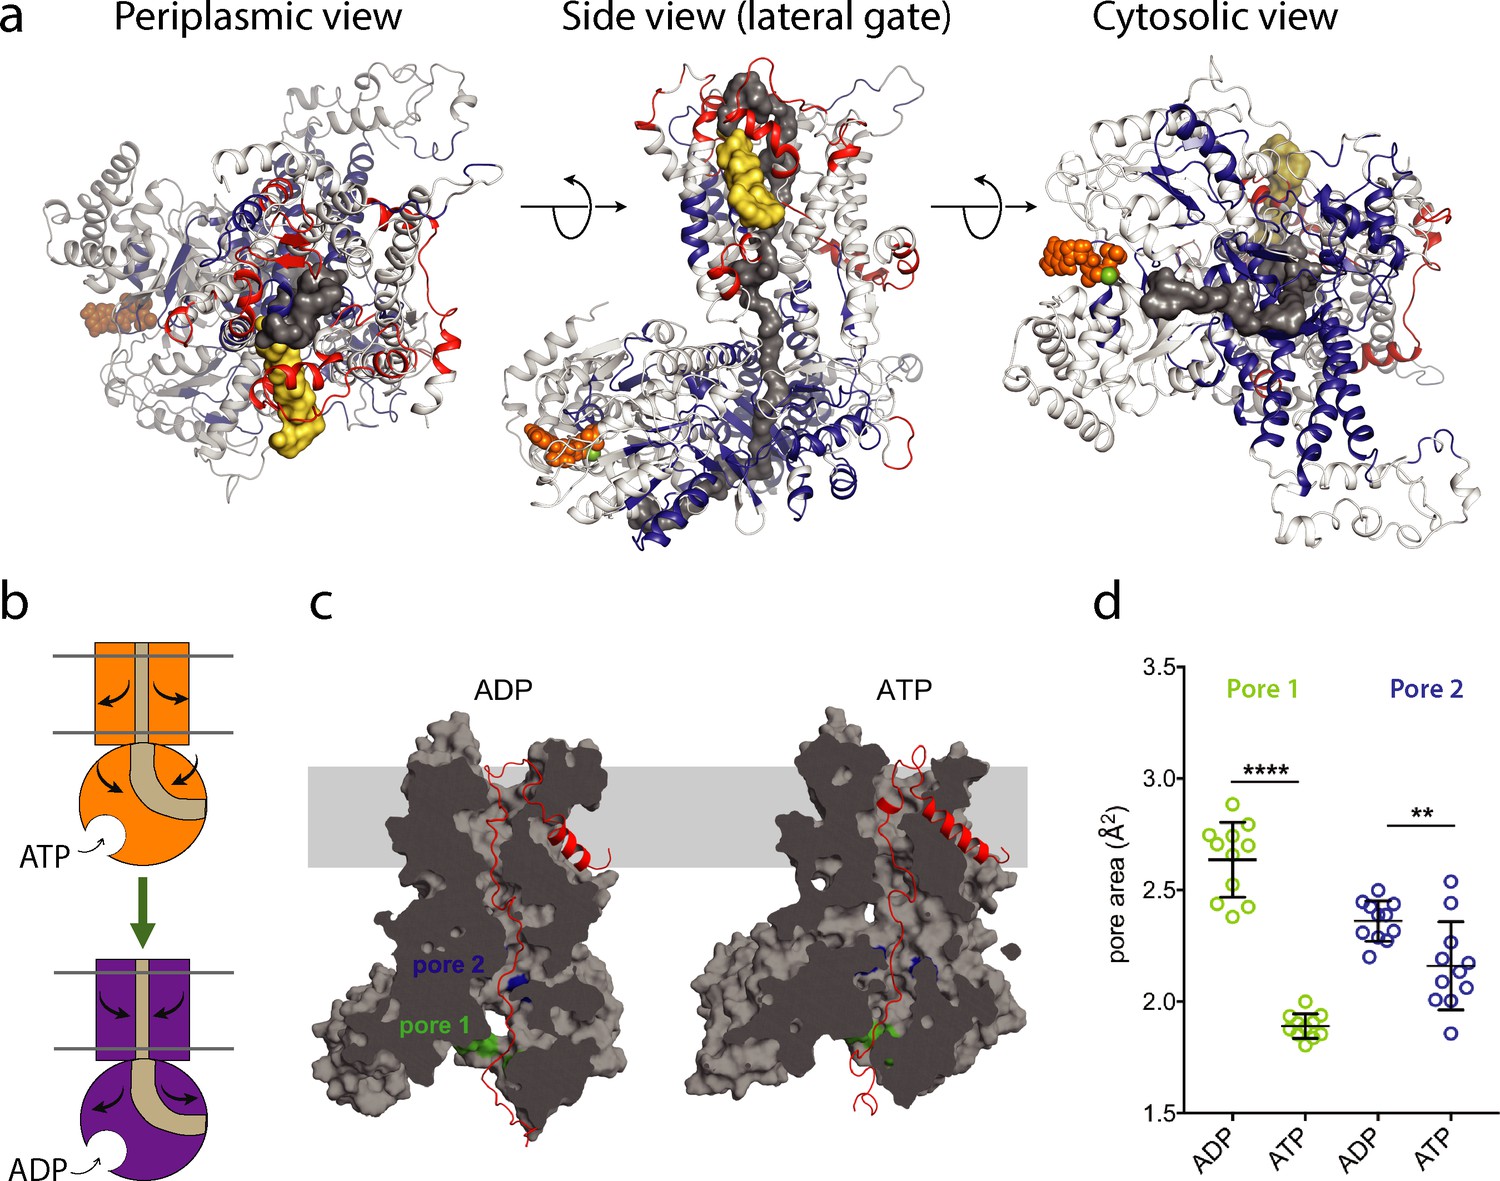
ATP-regulation of channel size.
(a) Periplasmic, membrane perpendicular and cytosolic views of the SecA-SecYEG-preprotein complex model, with ΔHDX of the peptides mapped onto the structure. The translocon complex is coloured light grey, with H-bonding destabilised and stabilised regions in red and blue, respectively. The pre-protein is shown in yellow (signal sequence) and dark grey (mature). ATP is shown as orange spheres. (b) Schematic summarising the primary outcomes from the data here. (c) Snapshots of SecA-SecYE with an engaged pre-protein after 1 µs all-atom MD simulation (Corey et al., 2019). SecA-SecYE is shown as grey surface and has been slabbed to show the pre-protein channel through both SecA and SecY. The pre-protein is shown as red cartoon, and was absent for the cavity size analysis in panel (d). The positions of the conserved SecA pores have been highlighted; pore 1 (green) and pore 2 (blue). Visual analysis suggests that pore 1 is more constricted in the ATP state (d). Quantification of the pore size, using snapshots every 25 ns from 750 to 1000 ns: both pores are tighter in ATP bound state (pore 1 means are 1.9 and 2.6 Å2, p<0.0001 using a 2 tailed t-test: pore 2 means are 2.4 and 2.1 Å2, p=0.0061).
Author response image 1
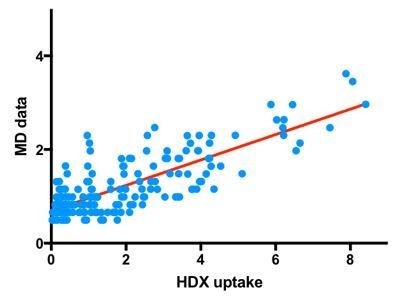
Experimental HDX uptake vs. theoretically predicted uptake; the theoretical uptake was constructed by taking into account both H-bonding and solvent accessibility statistics.
Additional files
-
Supplementary file 1
HDX-MS data summary table for ΔHDX = (SecAAMPPNP) – (SecAADP).
- https://doi.org/10.7554/eLife.47402.010
-
Supplementary file 2
HDX-MS data summary table for ΔHDX = (SecYEG +SecAAMPPNP) – (SecYEG +SecAADP).
Data is presented in Figure 3. Mass spectrometry raw data are deposited in the ProteomeXchange Consortium via the PRIDE database.
- https://doi.org/10.7554/eLife.47402.011
-
Transparent reporting form
- https://doi.org/10.7554/eLife.47402.012
Download links
A two-part list of links to download the article, or parts of the article, in various formats.
Downloads (link to download the article as PDF)
Open citations (links to open the citations from this article in various online reference manager services)
Cite this article (links to download the citations from this article in formats compatible with various reference manager tools)
HDX-MS reveals nucleotide-dependent, anti-correlated opening and closure of SecA and SecY channels of the bacterial translocon
eLife 8:e47402.
https://doi.org/10.7554/eLife.47402


