Demographic reconstruction from ancient DNA supports rapid extinction of the great auk
- Bangor University, United Kingdom
- University of Copenhagen, Denmark
- University of Otago, New Zealand
- Norwegian University of Science and Technology, Norway
- University of Sydney, Australia
- Verkís Consulting Engineers, Iceland
- Aarhus University, Denmark
- Greenland Institute of Natural Resources, Greenland
- University of California Santa Cruz, United States
- Chicago Zoological Society, United States
- Landesmuseum Natur und Mensch Oldenburg, Germany
- Bournemouth University, United Kingdom
- Cardiff University, United Kingdom
- University of Kiel, Germany
- University of Amsterdam, Netherlands
- Sociedad de Ciencias Aranzadi, Spain
- Natural History Museum of Los Angeles County, United States
- Freie Universität Berlin, Germany
- Gothenburg Museum of Natural History, Sweden
- University of Oslo, Norway
- University of Southampton, United Kingdom
- American Museum of Natural History, United States
- Independent researcher, United Kingdom
- University Museum of Bergen, Norway
- University of Greenland, Greenland
- University of Potsdam, Germany
Figures
Figure 1
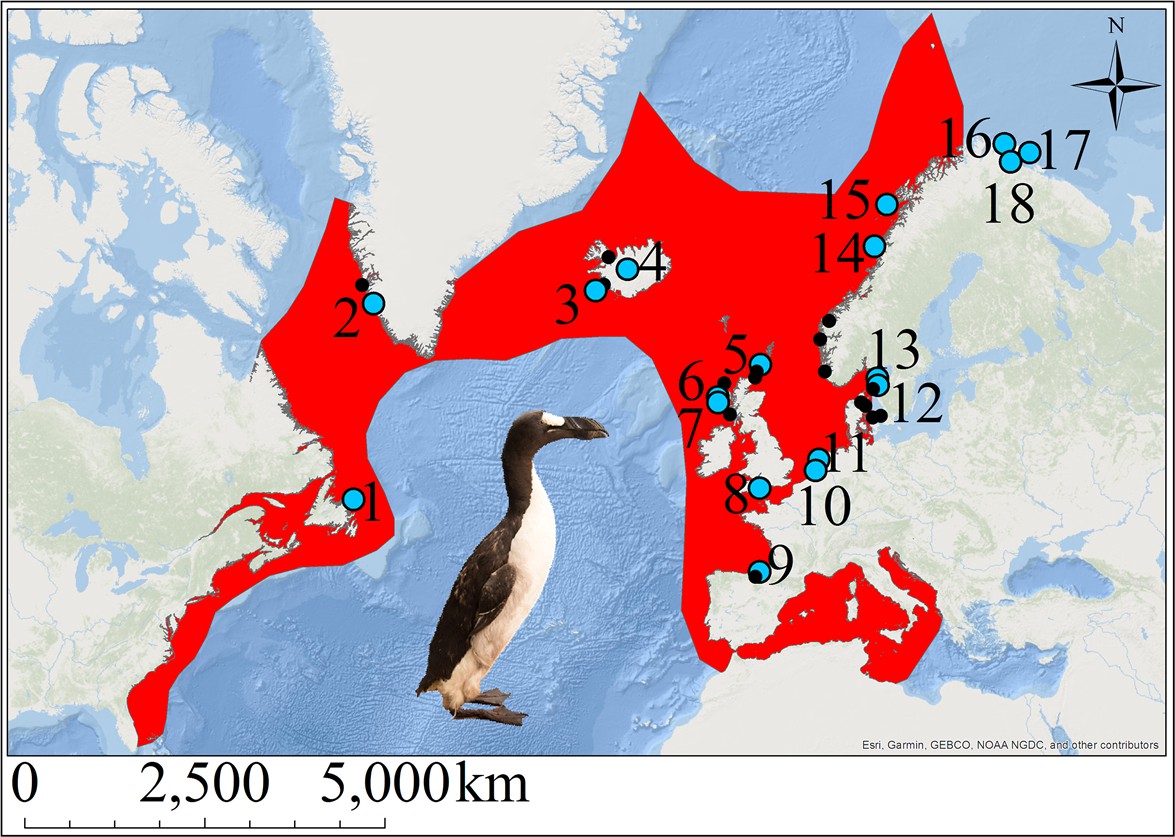
The great auk and its former distribution in the North Atlantic.
Red shading indicates the geographic distribution of the great auk, as defined by BirdLife International/IUCN (BirdLife International, 2016a). Sites marked with blue dots represent samples used in our analyses. Black dots denote other sites from which material was obtained, but for which samples were not sequenced or for which sequences did not pass filtering settings. Numbers associated with blue dots correspond to the following sites: 1: Funk Island (n = 14), 2: Qeqertarsuatsiaat (n = 1), 3: Eldey Island (n = 2), 4: Iceland (n = 5), 5: Tofts Ness (n = 2), 6: Bornais (n = 1), 7: Cladh Hallan (n = 1), 8: Portland (n = 1), 9: Santa Catalina (n = 2), 10: Schipluiden (n = 1), 11: Velsen (n = 1), 12: Sotenkanalen (n = 2), 13: Skalbank Otterön (n = 2), 14: Kirkehlleren (n = 1), 15: Storbåthelleren (n = 1), 16: Iversfjord (n = 1), 17: Vardø (n = 2), and 18: Nyelv (n = 1).
Figure 2
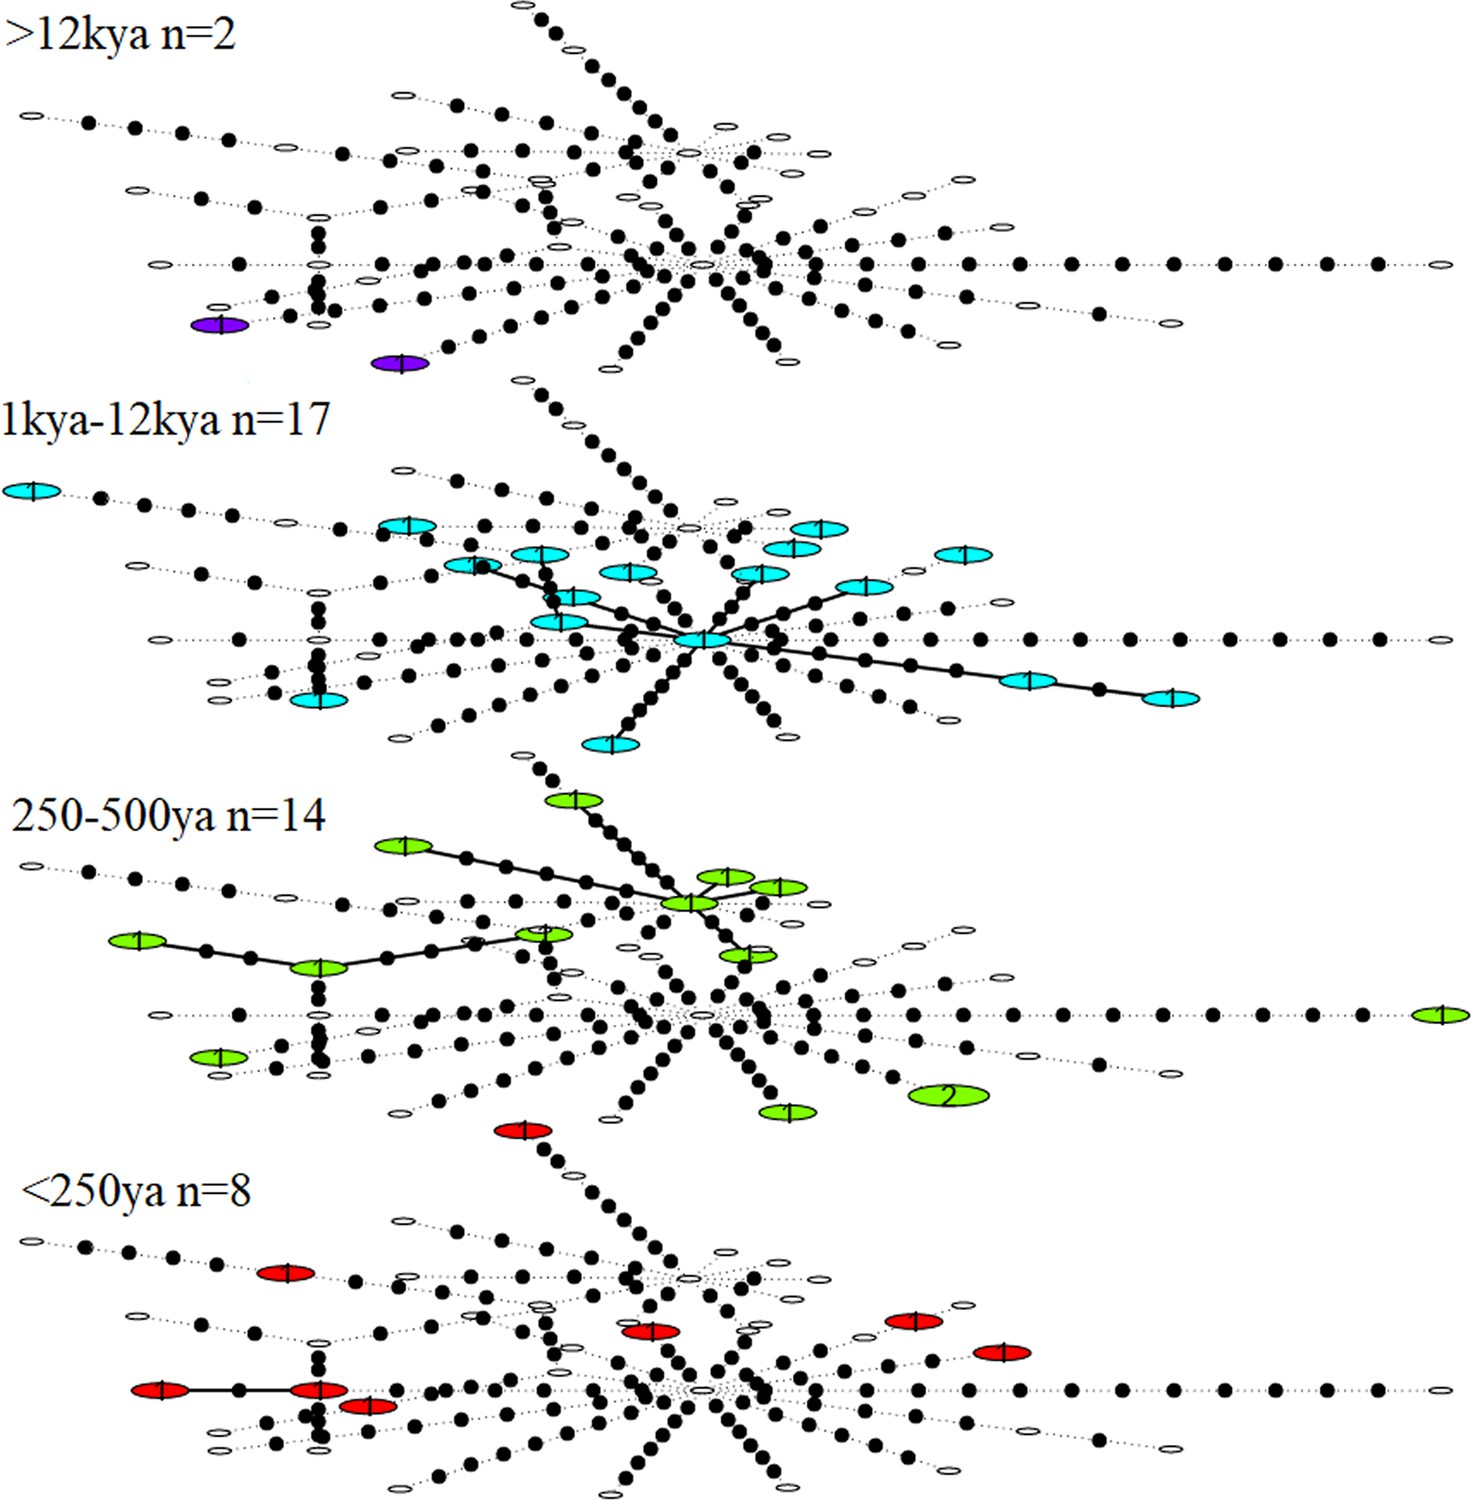
Statistical parsimony network showing haplotype diversity of great auk mitogenomes through time.
In each age category observed haplotypes are shown in colour, absent haplotypes are shown as empty circles, and mutations between haplotypes are marked as black dots. All samples have been included in this figure.
Figure 3
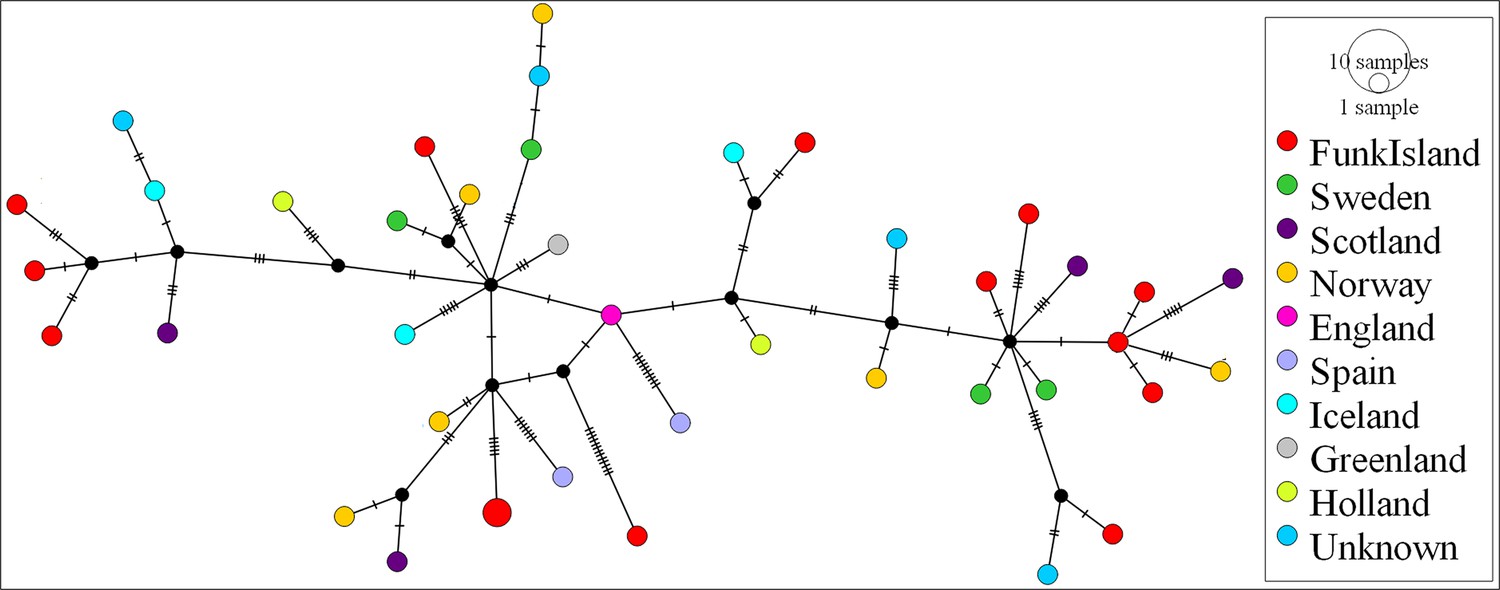
Median-joining network of great auk mitogenomes.
The network was inferred in PopART18 and shows a lack of phylogeographic structure among the dated and undated samples of great auks. Haplotypes are coloured according to sampling location.
Figure 4
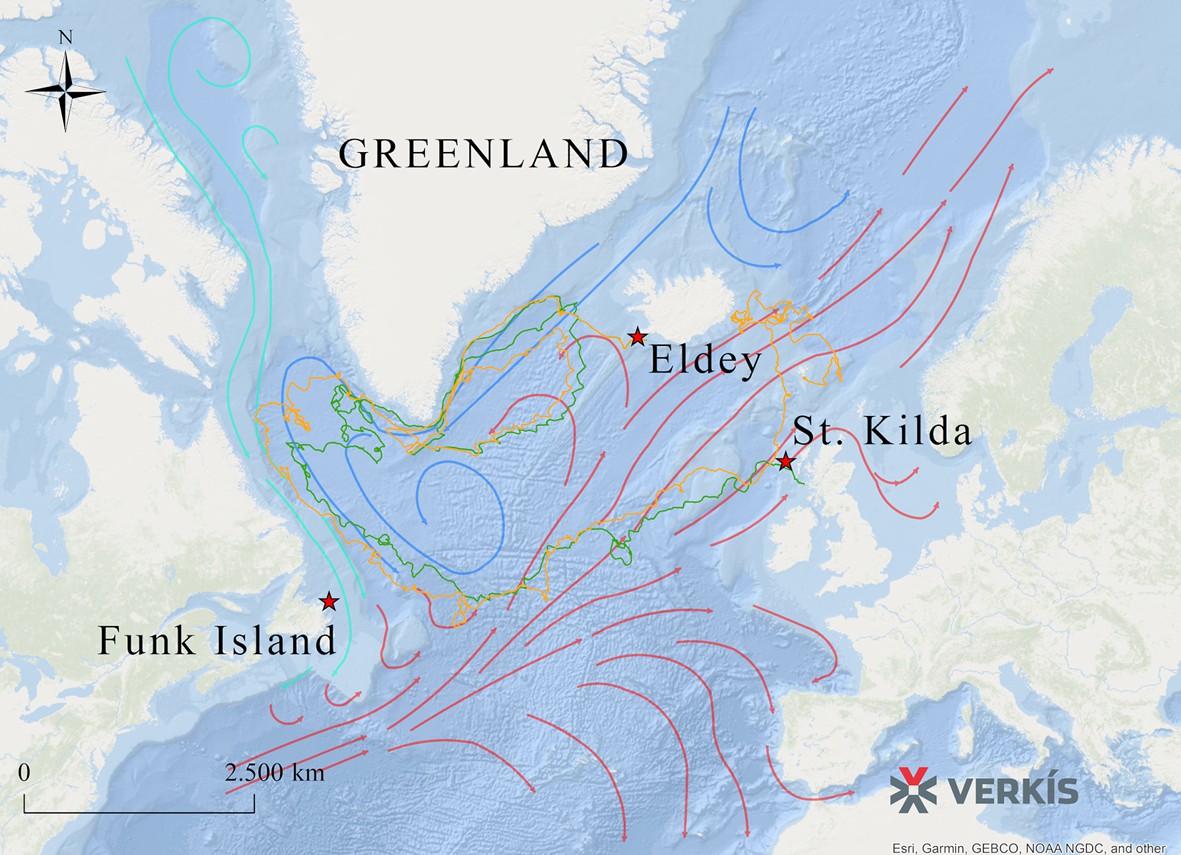
Routes taken by GPS capsules in the North Atlantic.
The map shows GPS data from two capsules (green and yellow lines). These tracks show possible routes that the great auk might have used to move between colonies, aided by ocean currents, waves, and wind. Legend: Red Star: Known breeding sites of the great auk (Funk Island, New Newfoundland; Eldey Island, Iceland; St Kilda, Scotland). Green line: GPS capsule 1. Yellow line: GPS capsule 2. Pink arrows: Warm sea currents (Gulf Stream and North Atlantic Drift). Dark blue arrows: Cold sea currents (East Greenland Current and Labrador Current).
Figure 5
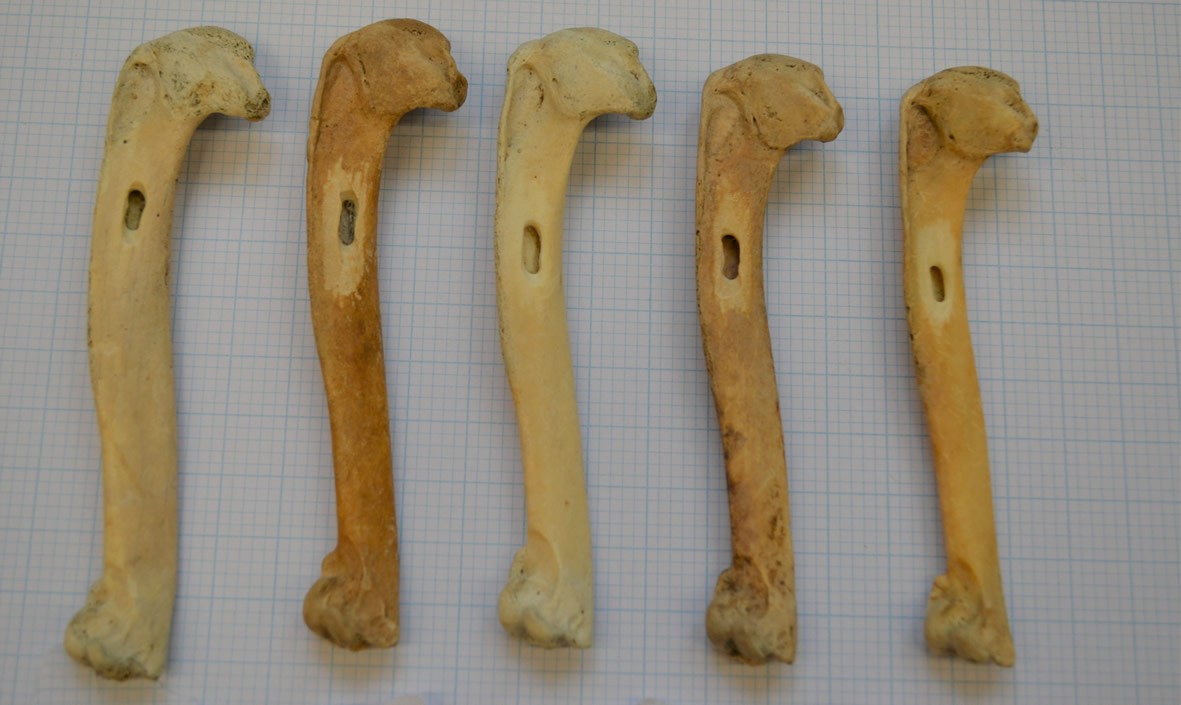
Great auk humeri following sampling.
Great auk humeri, collected from Funk Island, following sampling to collect bone powder for use in DNA extraction. Bones part of the collection at the American Museum of Natural History (Credit: J. Thomas).
Appendix 1—figure 1
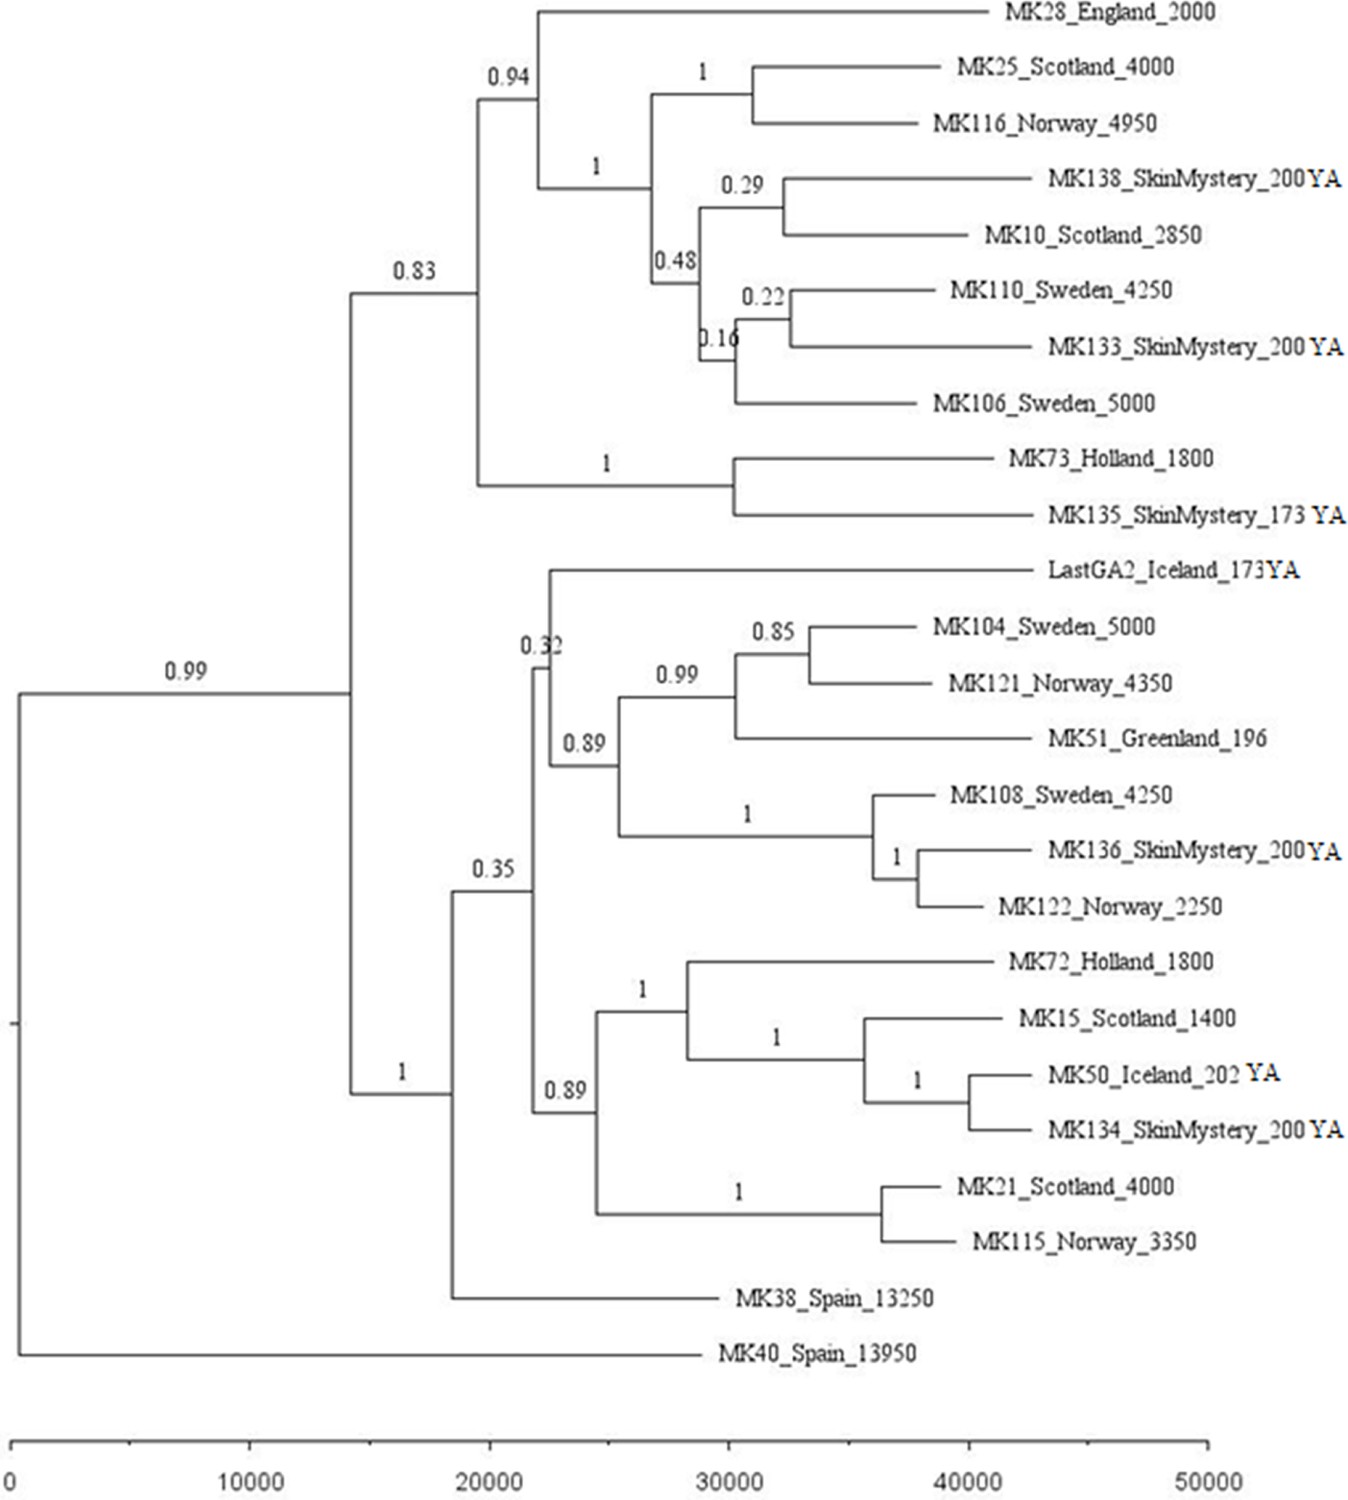
Phylogenetic tree showing the relationships among dated mitogenomes from the great auk.
This maximum-clade-credibility tree was inferred by Bayesian analysis in BEAST. Nodes are labelled with posterior probabilities. The tree is drawn to a timescale, as indicated by the horizontal scale bar. Samples included in the analysis are those with associated date information (see Supplementary file 1e). For samples with a stratigraphically assigned date the median age has been used. Tip labels give the sample names, sampling locations, and sample ages (years before present, with the exception of mounted specimens labelled YA- years ago).
Appendix 1—figure 2
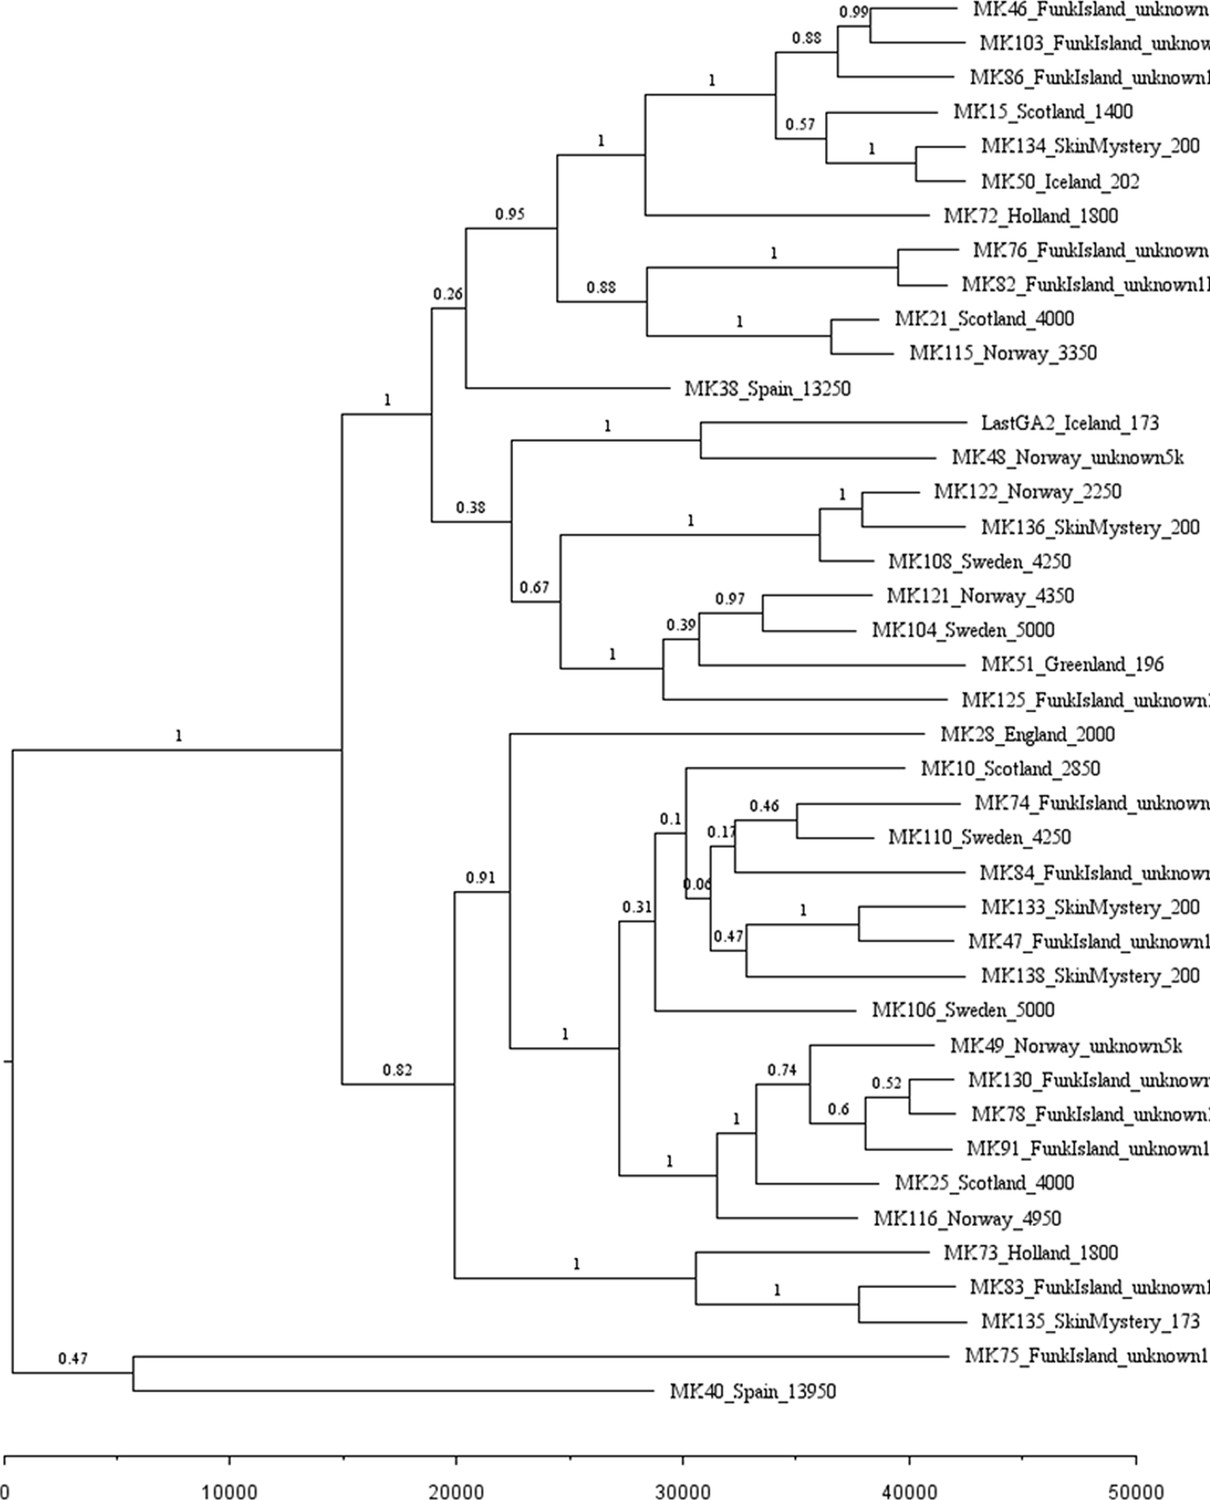
Phylogenetic tree showing the relationships among dated and undated mitogenomes from the great auk.
This maximum-clade-credibility tree was inferred by Bayesian analysis in BEAST. Nodes are labelled with posterior probabilities. The tree is drawn to a timescale, as indicated by the horizontal scale bar. Samples included in the analysis are those with and without associated date information (Supplementary file 1e). For samples with a stratigraphically assigned date the median age has been used. Tip labels give the sample names, sampling locations, and sample ages (years before present, with the exception of mounted specimens labelled YA- years ago).
Appendix 3—figure 1
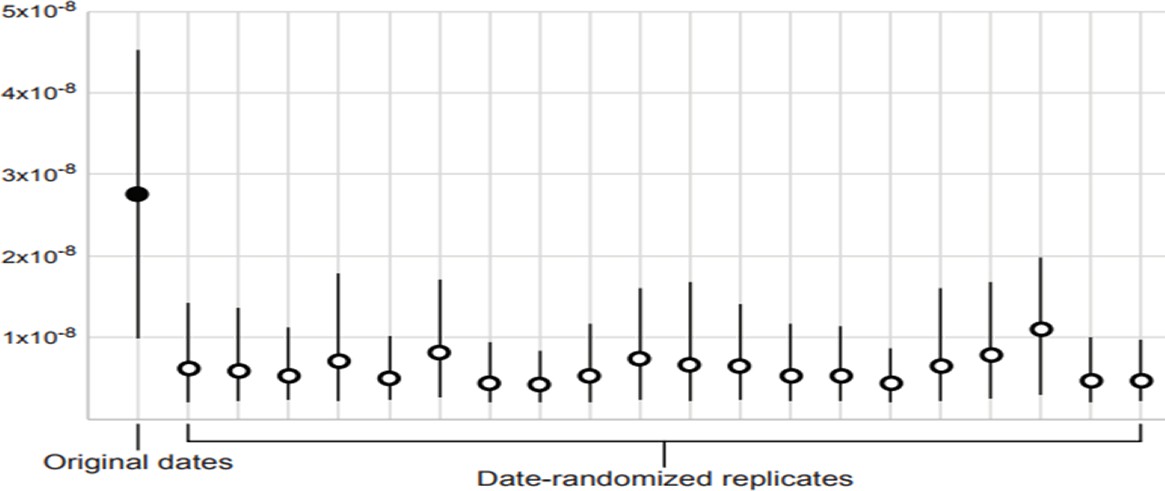
Date-randomisation test for temporal structure in dated mitogenome sequences.
The filled circle indicates the median posterior estimate of the mutation rate from the original data set, whereas the empty circles show the median posterior estimates from 20 date-randomised replicate data sets. The 95% credibility intervals (vertical black lines) of the estimates from the date-randomised replicates do not overlap with the median estimate from the original data set, providing some evidence of temporal structure in the data set (criterion CR1). However, the 95% credibility intervals of the estimates from the date-randomised replicates overlap with the 95% credibility interval of the estimate from the original data set, indicating that the data set does not meet the more stringent criterion CR2.
Appendix 4—figure 1
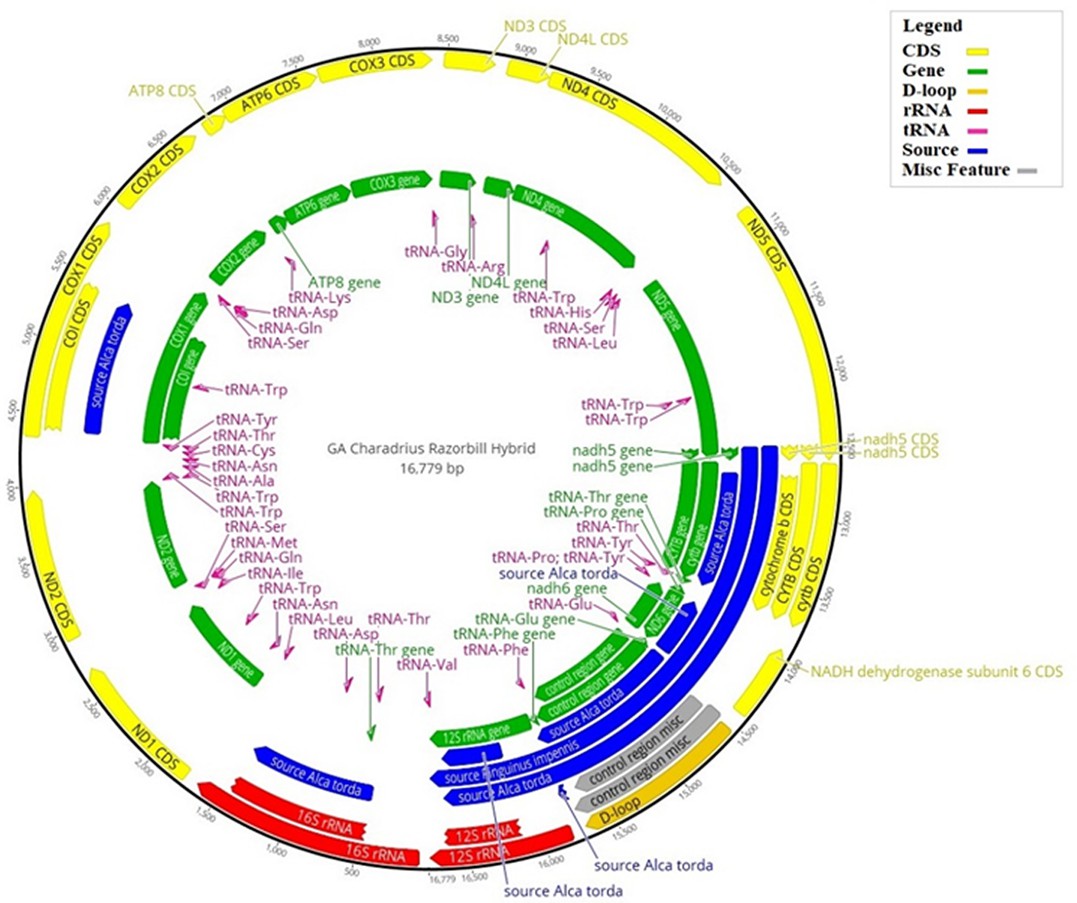
Hybrid reference mitogenome used for bait design.
Illustration of the hybrid reference mitogenome constructed using the killdeer (Charadrius vociferous) mitogenome, with orthologous gene regions replaced by those of the great auk (Pinguinus impennis), or razorbill (Alca torda), when great auk data were unavailable. Annotations correspond to the various regions of the mitogenome: those in blue show where great auk or razorbill genes have been used; yellow corresponds to coding regions; green shows all gene regions; the D-loop is shown in gold; rRNA regions are in red; tRNA regions are in pink; and any miscellaneous features are in grey. The numbers on the outer black circle correspond to the base position of the mitogenome.
Appendix 9—figure 1
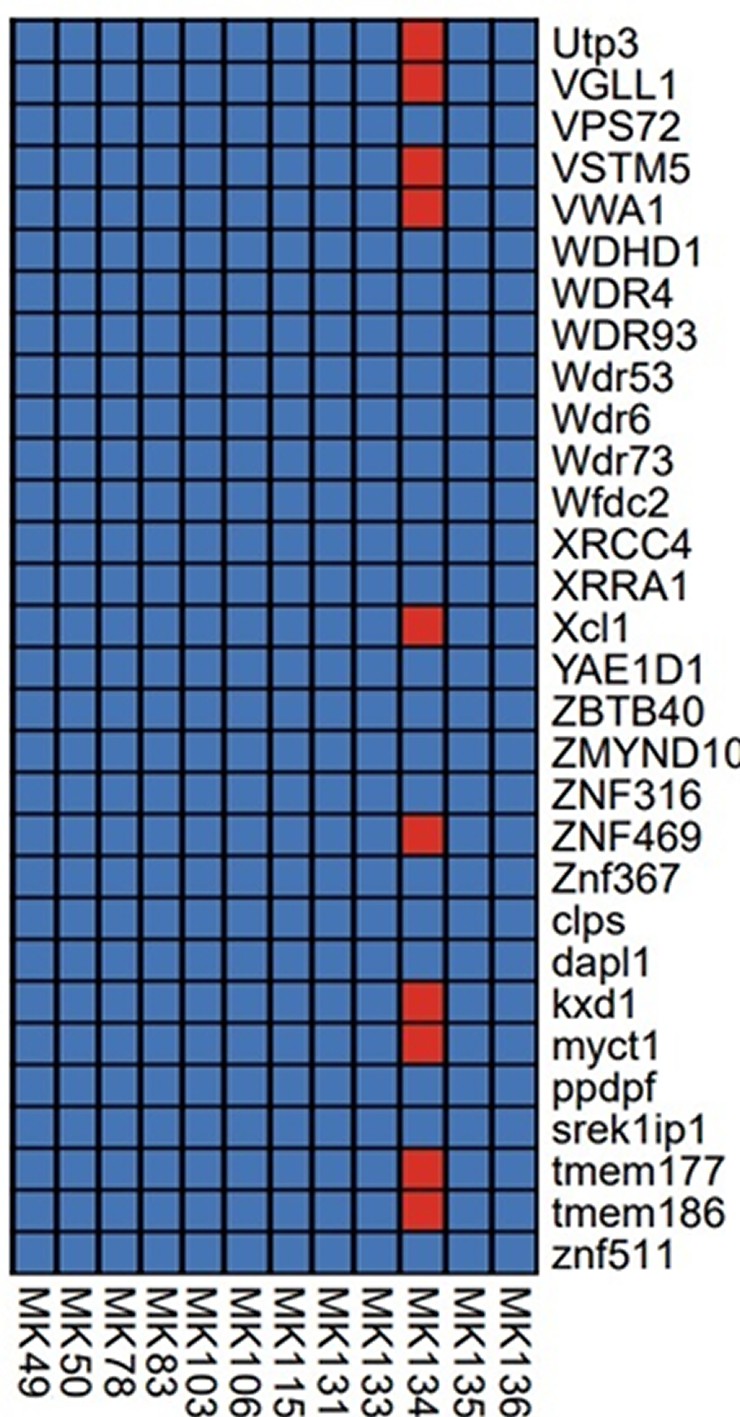
Section of the presence/absence matrix showing coverage of 30/495 captured genes (listed on the right-hand side) for each sample sent for sequencing.
Presence is defined as coverage >= 3, indicated by a red square, absence is indicated by a blue square.
Appendix 10—figure 1
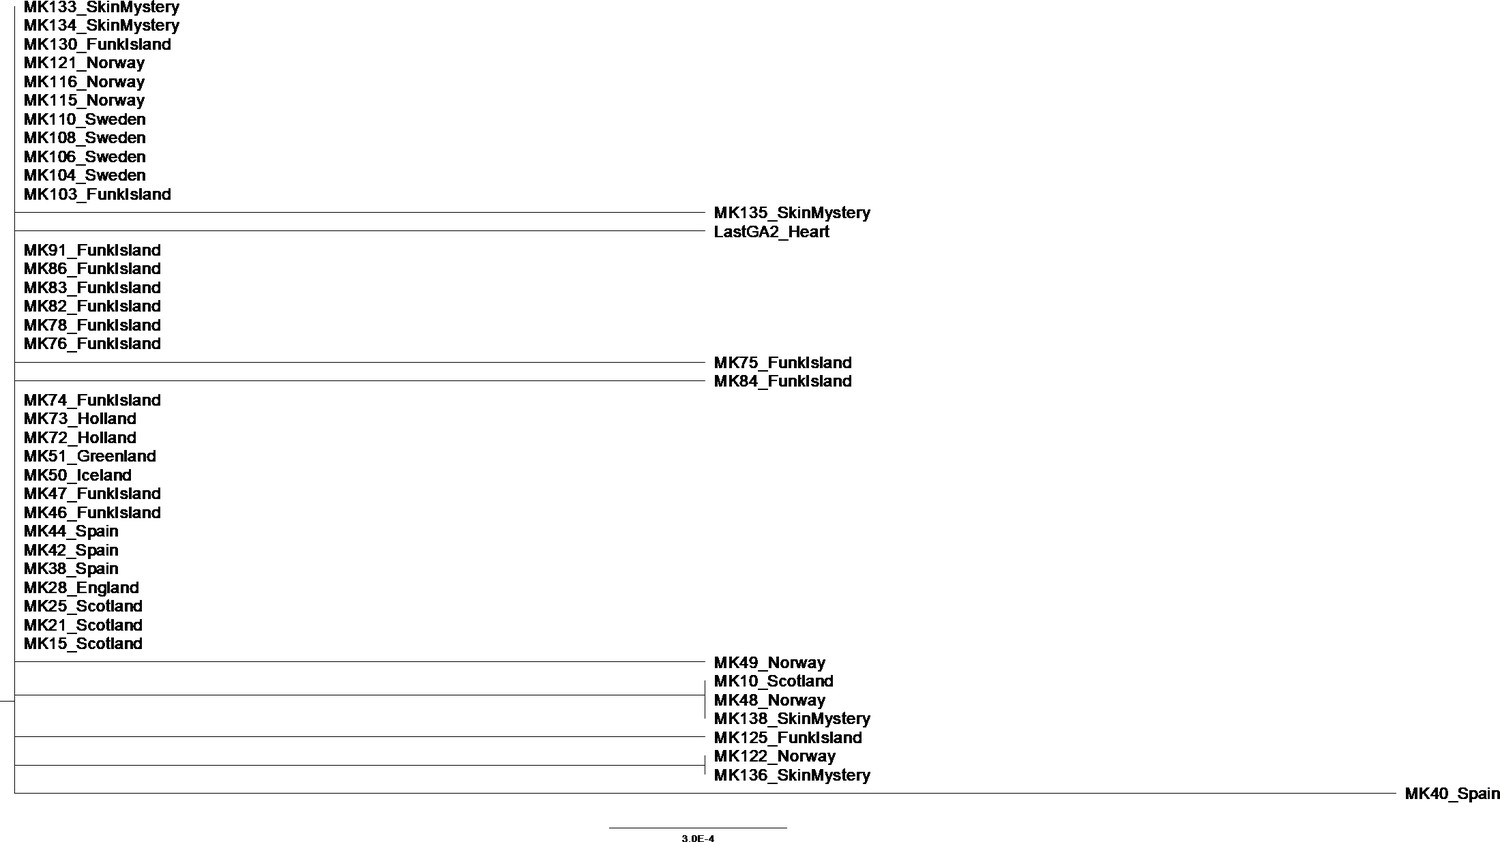
Phylogenetic tree showing the relationship between all samples that passed filtering criteria, plus additional Spanish samples previously excluded from analysis.
The evolutionary history was inferred using the Neighbor-Joining method (Saitou and Nei, 1987) in MEGAX (Kumar et al., 2018). The optimal tree with the sum of branch length = 0.01164144 is shown. The percentage of replicate trees in which the associated taxa clustered together in the bootstrap test (1000 replicates) are shown next to the branches (Felsenstein, 1985). The tree is drawn to scale, with branch lengths in the same units as those of the evolutionary distances used to infer the phylogenetic tree. The evolutionary distances were computed using the p-distance method (Nei and Kumar, 2000) and are in the units of the number of base differences per site. This analysis involved 43 nucleotide sequences. All positions containing gaps and missing data were eliminated (complete deletion option). There were a total of 859 positions in the final dataset. Tip labels give the sample names and sampling locations.
Author response image 1
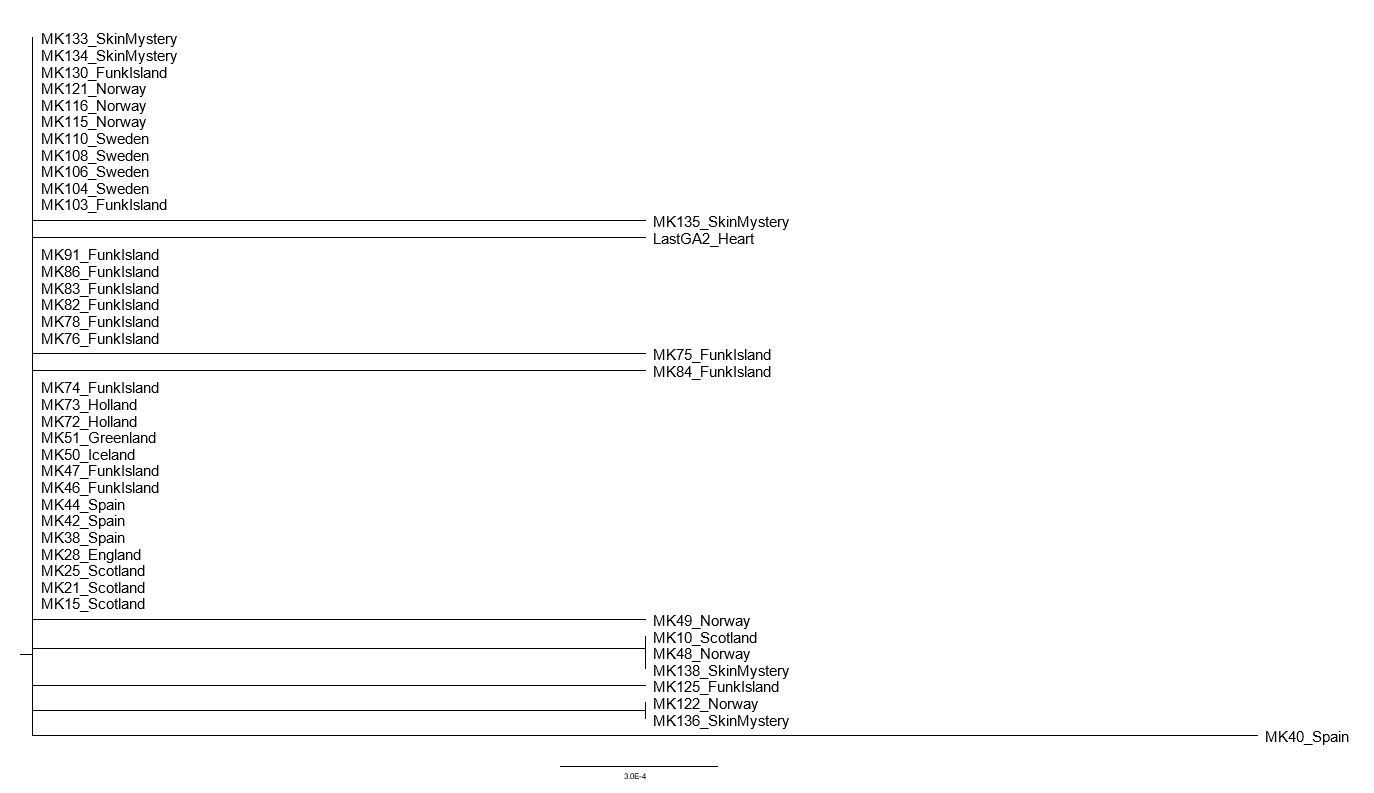
The evolutionary history was inferred using the Neighbor-Joining method [Saitou and Nei, 1987].
The optimal tree with the sum of branch length = 0.01164144 is shown. The percentage of replicate trees in which the associated taxa clustered together in the bootstrap test (1000 replicates) are shown next to the branches [Felsenstein, 1985]. The tree is drawn to scale, with branch lengths in the same units as those of the evolutionary distances used to infer the phylogenetic tree. The evolutionary distances were computed using the p-distance method [Nei and Kumar, 2000] and are in the units of the number of base differences per site. This analysis involved 43 nucleotide sequences. All positions containing gaps and missing data were eliminated (complete deletion option). There were a total of 859 positions in the final dataset. Evolutionary analyses were conducted in MEGA X [Kumar et al., 2018].
Tables
Table 1
Population viability analysis.
Extinction is defined as ‘only one sex remains’. The number of mature individuals was estimated in Vortex 10.2.8.0, assuming a stable age distribution and given our fixed mortality rates. ‘Maximum- number of eggs’ refers to the number of eggs that would be produced if all mature individuals were breeding. ‘Harvest rate’ describes the percentage of the population that is harvested annually, with egg harvest rate calculated from the maximum number of eggs in parentheses. ‘DD’ refers to density-dependent reduction of mortality. ‘Number of birds’ is the total number of birds killed annually, which was split between the age cohorts (see Appendix 8). ‘Number of eggs’ is total number of eggs harvested annually.
| Conservative settings | ||||||||
|---|---|---|---|---|---|---|---|---|
| Population size (total) | Mature birds (>4 years) | Maximum number of eggs | Harvest rate (% of starting population size) | DD | Number of birds | Number of eggs | Probability of extinction within 350 years | |
| 2,000,000 | 1,027,532 | 513,766 | 9 (5) | No | 180,000 | 25,688 | 0.00 | |
| 2,000,000 | 1,027,532 | 513,766 | 10 (5) | No | 200,000 | 25,688 | 0.79 | |
| 2,000,000 | 1,027,532 | 513,766 | 10 (5) | Yes | 200,000 | 25,688 | 0.22 | |
| 2,000,000 | 1,027,532 | 513,766 | 10.5 (5) | Yes | 210,000 | 25,688 | 1.00 | |
| 2,000,000 | 1,027,532 | 513,766 | 10.5 (0) | No | 210,000 | 0 | 0.71 | |
| 2,000,000 | 1,027,532 | 513,766 | 10.5 (0) | Yes | 210,000 | 0 | 0.19 | |
| 6,000,000 | 3,082,594 | 1,541,297 | 9 (5) | No | 540,000 | 77,065 | 0.00 | |
| 6,000,000 | 3,082,594 | 1,541,297 | 10 (5) | No | 600,000 | 77,065 | 0.86 | |
| 6,000,000 | 3,082,594 | 1,541,297 | 10 (5) | Yes | 600,000 | 77,065 | 0.33 | |
| 6,000,000 | 3,082,594 | 1,541,297 | 10.5 (5) | Yes | 630,000 | 77,065 | 1.00 | |
| 6,000,000 | 3,082,594 | 1,541,297 | 10.5 (0) | No | 600,000 | 0 | 0.81 | |
| 6,000,000 | 3,082,594 | 1,541,297 | 10.5 (0) | Yes | 630,000 | 0 | 0.15 | |
| ‘Realistic’ settings | ||||||||
| Population size (total) | Mature birds (>5 years) | Maximum number of eggs | Harvest rate (% of starting population size) | DD | Number of birds | Number of eggs | Probability of extinction within 350 years | |
| 2,000,000 | 1,027,532 | 513,766 | 2 (0) | Yes | 40,000 | 0 | 0.19–0.33 (range across multiple repeat simulations) | |
Appendix 6—table 1
Marginal likelihoods of six partitioning schemes and two tree priors for the 25 dated mitogenomes.
| Partitioning schemea | Marginal likelihoodb | |
|---|---|---|
| Constant size | Exponential growth | |
| Unpartitioned | −24,151.6 | −24,143.6 |
| two subsets: (CR rRNA tRNA) (PC1 PC2 PC3) | −24,222.3 | −24,212.4 |
| three subsets: (CR) (rRNA tRNA) (PC1 PC2 PC3) | −24,162.4 | −24,150.1 |
| four subsets: (CR) (rRNA tRNA) (PC1 PC2) (PC3) | −23,659.7 | −23,647.5 |
| five subsets: (CR) (rRNA tRNA) (PC1) (PC2) (PC3) | −23,248.7 | −23,235.9 |
| six subsets: (CR) (rRNA) (tRNA) (PC1) (PC2) (PC3) | −23,229.1 | −23,217.5 |
-
aComponents of the mitogenome are the ribosomal RNA genes (rRNA), transfer RNA genes (tRNA), three codon positions of the protein-coding genes (PC1, PC2, and PC3), and the control region (CR). bMarginal likelihoods were estimated by stepping-stone sampling with 25 path steps, each with a chain length of 2,000,000 steps.
Appendix 9—table 1
Estimated coverage information from the twelve sequenced samples.
The estimated coverage of the 495 targeted genes and estimated coverage of the reads that mapped to the razorbill genome is reported.
| Sample | Country | Estimated coverage of razorbill genome | Estimated coverage of targeted genes |
|---|---|---|---|
| MK49 | Norway | 0.0101 | 0.0152 |
| MK50 | Iceland | 0.0190 | 0.0155 |
| MK78 | Funk Island | 0.0022 | 0.0018 |
| MK83 | Funk Island | 0.00006 | 0.0071 |
| MK103 | Funk Island | 0.0011 | 0.0150 |
| MK106 | Sweden | 0.0172 | 0.0105 |
| MK115 | Norway | 0.0012 | 0.0021 |
| MK131 | Iceland | 0.0090 | 0.0423 |
| MK133 | Skin Mystery | 0.0190 | 0.0154 |
| MK134 | Skin Mystery | 0.0179 | 1.2592 |
| MK135 | Skin Mystery | 0.0073 | 0.0106 |
| MK136 | Skin Mystery | 0.0021 | 0.0128 |
Appendix 9—table 2
Coverage range of captured markers.
Numbers in square brackets represent the number of markers which have 0 coverage. Genes with the highest coverage are shown in brackets.
| Sample | Country | Coverage range of captured markers |
|---|---|---|
| MK49 | Norway | 0 [125] – 0.4898 (Fam174b) |
| MK50 | Iceland | 0 [157] – 0.2204 (Isca2) |
| MK78 | Funk Island | 0 [379] – 0.1087 (Mrp130) |
| MK83 | Funk Island | 0 [223] – 0.2960 (Nipbl) |
| MK103 | Funk Island | 0 [164] – 0.7049 (Glrx5) |
| MK106 | Sweden | 0 [190] – 0.2403 (Pcp4) |
| MK115 | Norway | 0 [366] – 0.2263 (Tmem60) |
| MK131 | Iceland | 0[78] – 1.5238 (Ssna1) |
| MK133 | Skin mystery | 0 [129] – 0.3061 (Fam174b) |
| MK134 | Skin mystery | 0.0628 (TPK1) – 17.7232 (Ssna1) |
| MK135 | Skin mystery | 0 [172] – 0.2580 (myct1) |
| MK136 | Skin mystery | 0 [142] – 0.4067 (myct1) |
Additional files
-
Source data 1
Nuclear SNP bait design.
- https://cdn.elifesciences.org/articles/47509/elife-47509-data1-v1.zip
-
Supplementary file 1
Sample Information.
Supplementary file 1a Sample information for all samples collected. Information listed shows institution name and number where sample was sourced, the site location and country where sample was discovered (if known), and any associated date/age information, if known. Those highlighted indicate samples that ultimately passed the filtering settings and were used in the final analysis. Asterisks indicate samples from Thomas et al. (2017). Supplementary file 1b Lab process table for all samples collected. Table includes information on sample type, weight used in extraction, which library build method was used, if hybridization capture was used, and which type of sequencing was performed. Those highlighted indicate samples that ultimately passed the filtering settings and were used in the final analysis. Asterisks indicate samples from Thomas et al. (2017). Supplementary file 1c PALEOMIX summary data for mitogenome samples. Summary statistics table from all great auk samples sent for sequencing. Library type: PE = Paired end, SE = Single end, *=both. Samples highlighted were used in final analysis. Supplementary file 1d GenBank accession numbers. GenBank accession numbers for samples used in analysis. Supplementary file 1e Age information for samples used in analysis. Age information for samples used in the BEAST and TempNet analyses.
- https://cdn.elifesciences.org/articles/47509/elife-47509-supp1-v1.xlsx
-
Supplementary file 2
Population Viability Analysis Settings.
Supplementary file 2a Settings used in Population Viability Analysis. Details of the settings used for Population Viability Analysis performed in Vortex 10.2.8.0. Information displayed corresponds to the various setting sections in the software and the variables that were changed. Further details on justification for these settings can be found in Appendix 8. Supplementary file 2b Details of mortality rates used in Population Viability Analysis. Details of the mortality rate settings used in Population Viability Analysis performed in Vortex 10.2.8.0, showing formula information for including density-dependent change and additional justification. Supplementary file 2c Harvest rate calculations. Example of how harvest rates of birds and eggs were calculated for the Population Viability Analysis.
- https://cdn.elifesciences.org/articles/47509/elife-47509-supp2-v1.xlsx
-
Transparent reporting form
- https://cdn.elifesciences.org/articles/47509/elife-47509-transrepform-v1.pdf
Download links
A two-part list of links to download the article, or parts of the article, in various formats.
Downloads (link to download the article as PDF)
Open citations (links to open the citations from this article in various online reference manager services)
Cite this article (links to download the citations from this article in formats compatible with various reference manager tools)
Demographic reconstruction from ancient DNA supports rapid extinction of the great auk
eLife 8:e47509.
https://doi.org/10.7554/eLife.47509


