A genetic selection reveals functional metastable structures embedded in a toxin-encoding mRNA
- University of Bordeaux, INSERM U1212, CNRS UMR 5320, ARNA Laboratory, France
Figures
Figure 1 with 2 supplements
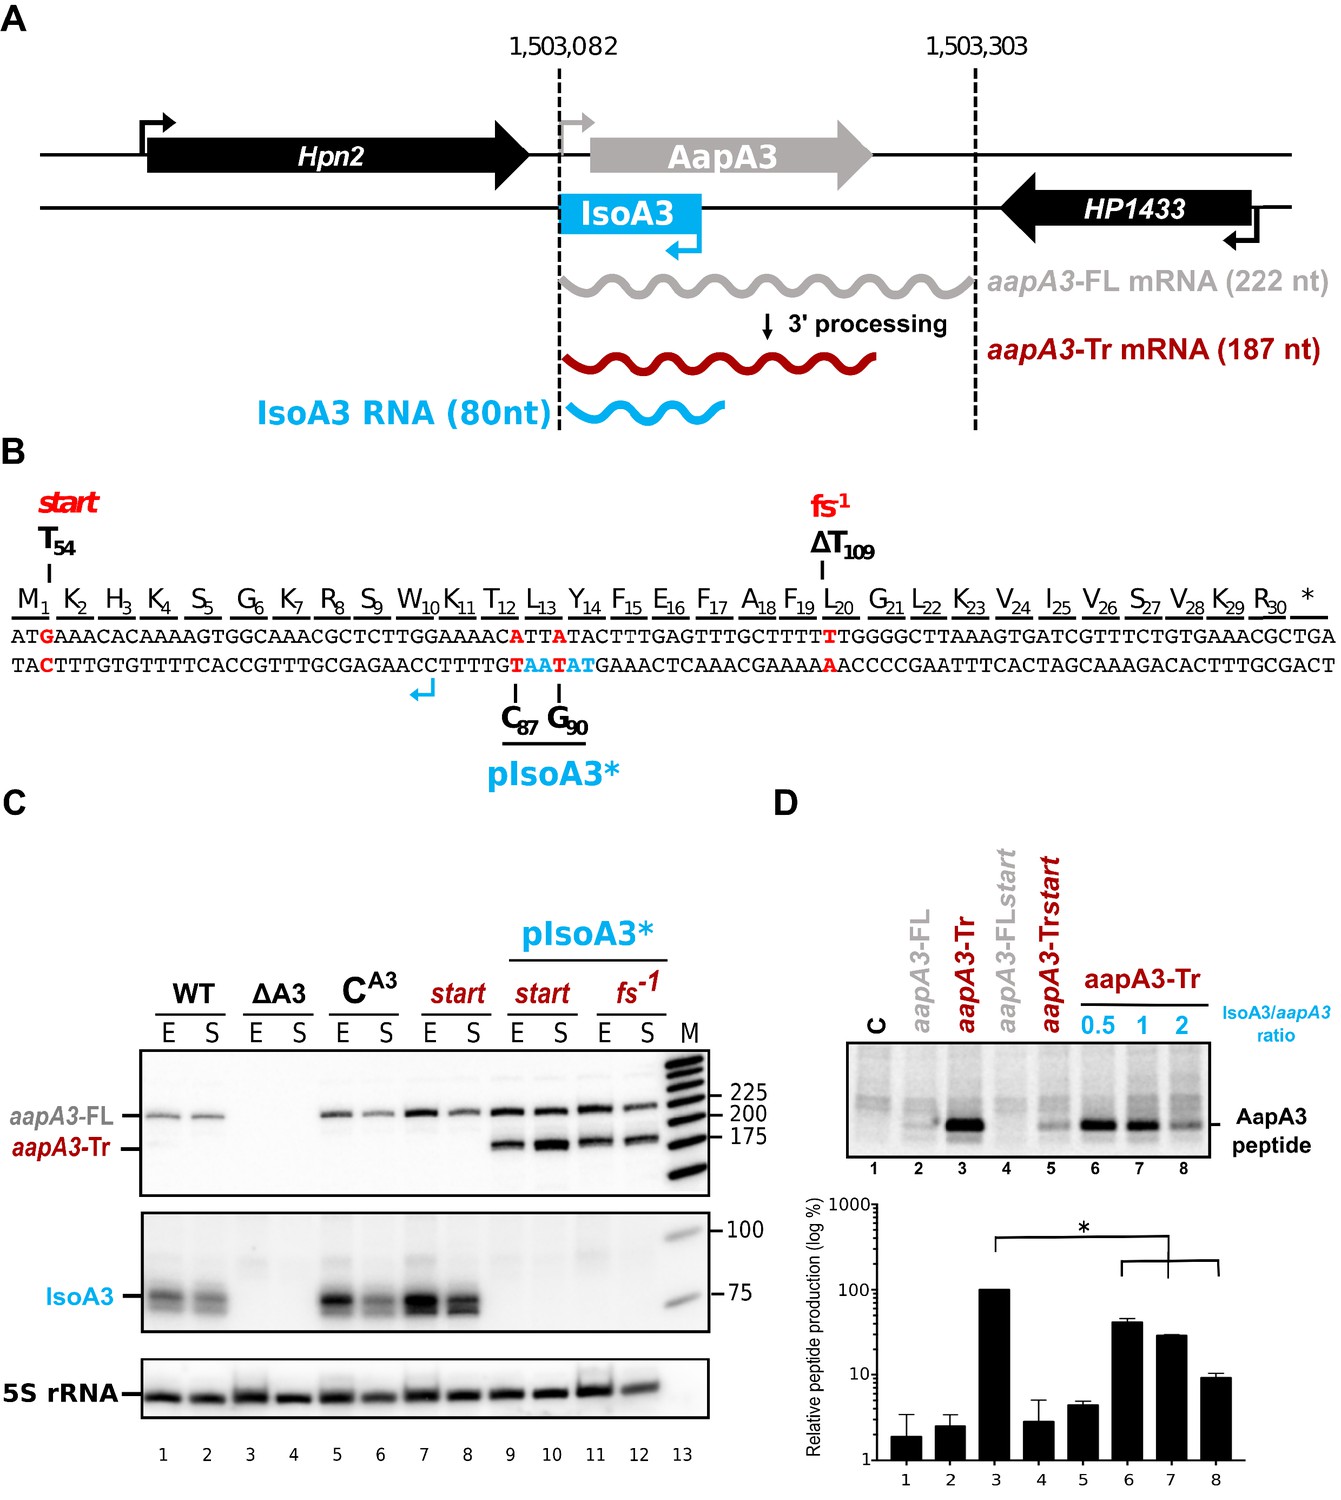
IsoA3 small RNA is essential to prevent AapA3 translation.
(A) Organization of the aapA3/IsoA3 locus in the H. pylori 26695 strain. Grey arrow, AapA3 ORF; blue box, IsoA3 RNA; small bent arrows, -10 box of each transcript. Grey, red and blue wavy lines represent aapA3-FL (full- length), aapA3-Tr (3’-end truncated) and IsoA3 transcripts, respectively. Their approximate length is also indicated. Detailed locus coordinates can be found at the T1TA database website under the following link: https://d-lab.arna.cnrs.fr/display/display_feature_table/TA00126). For details about the aapA3/IsoA3 locus deletion strategy see Figure 1—figure supplement 2. (B) Nucleotide and amino acid sequence of AapA3 ORF with hallmarks. The sequence of the IsoA3 promoter (-10 box) is shown in blue. The nucleotides that were mutated to inactivate the IsoA3 promoter (pIsoA3*) and the AapA3 start codon (start), and to create a -1 frameshift (fs -1 ) are shown in red. (C) The ‘WT’ strain corresponds to the 26695 H. pylori strain containing the K43R mutation in the rpsL gene, which confers resistance to streptomycin. The ∆A3 strain is the parental strain in which the aapA3/IsoA3 locus has been replaced by the rpsL Cj -erm cassette (∆aapA3/IsoA3::rpsL Cj -erm). The C A3 and start strains correspond to the ∆A3 strain complemented with the WT aapA3/IsoA3 locus and with the locus mutated at the start codon (G54T), respectively. The two strains inactivated for the IsoA3 promoter (pIsoA3*) also contain a frameshift mutation (fs -1 ) or a mutation in the start codon (start). Total RNA from stationary (S) or exponential (E) growth phase of the indicated strains was isolated and subjected to Northern blot. The aapA3-FL, aapA3-Tr, and IsoA3 transcripts are shown. 5S rRNA assessed proper loading. (D) Translation assays were performed with 0.5 μg of aapA3 mRNAs in absence or presence of IsoA3, in 0.5, 1 or 2 molar ratios. [ 35 S]-Met was used for labeling. The control lane (C) shows the translation background obtained without exogenous mRNA.
Figure 1—figure supplement 1
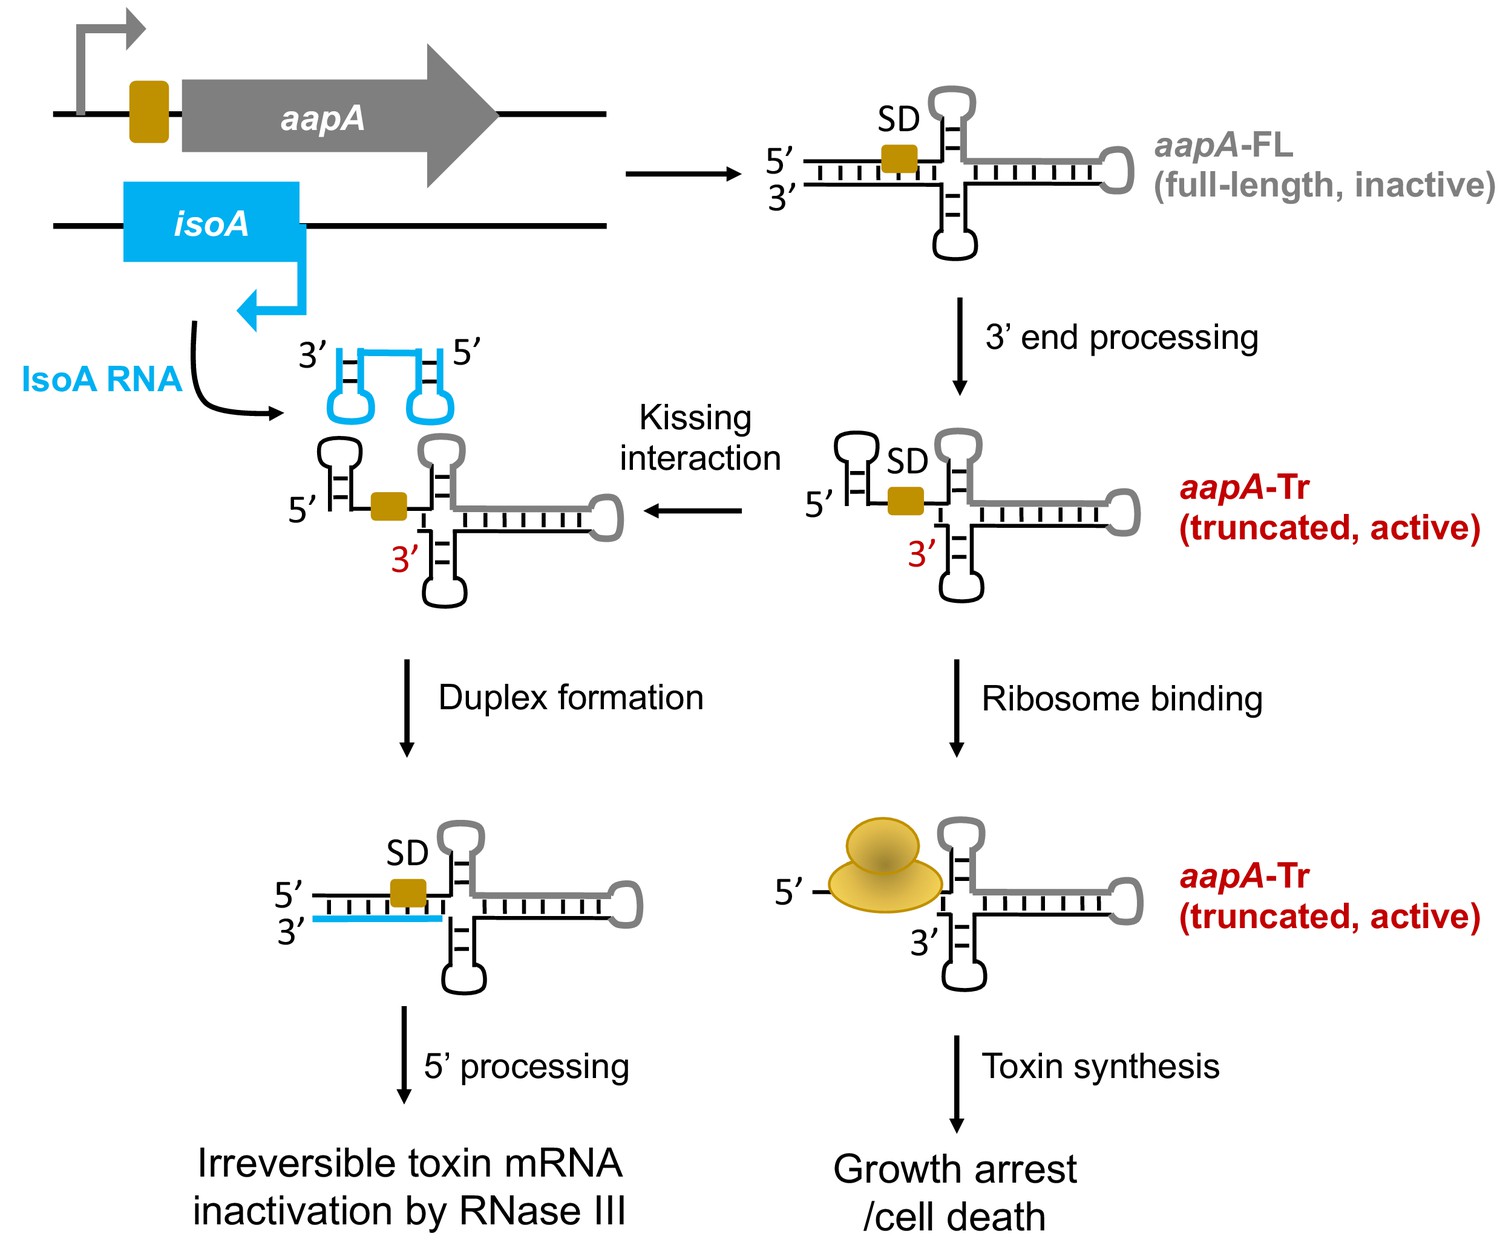
General model of the aapA/IsoA TA systems regulation in Helicobacter pylori.
This model is based on experimental data described in our previous study (Arnion et al., 2017). The genetic organization of the aapA/IsoA modules is shown in the upper-left part of the figure. Bent arrows indicate promoters (gray and blue for aapA and IsoA, respectively). The aapA coding-sequence is represented by a thick gray line on the secondary structures. The Shine-Dalgarno (SD) sequence of aapA gene is symbolized by a yellow box. The IsoA sRNA antitoxin is shown in blue.
Figure 1—figure supplement 2
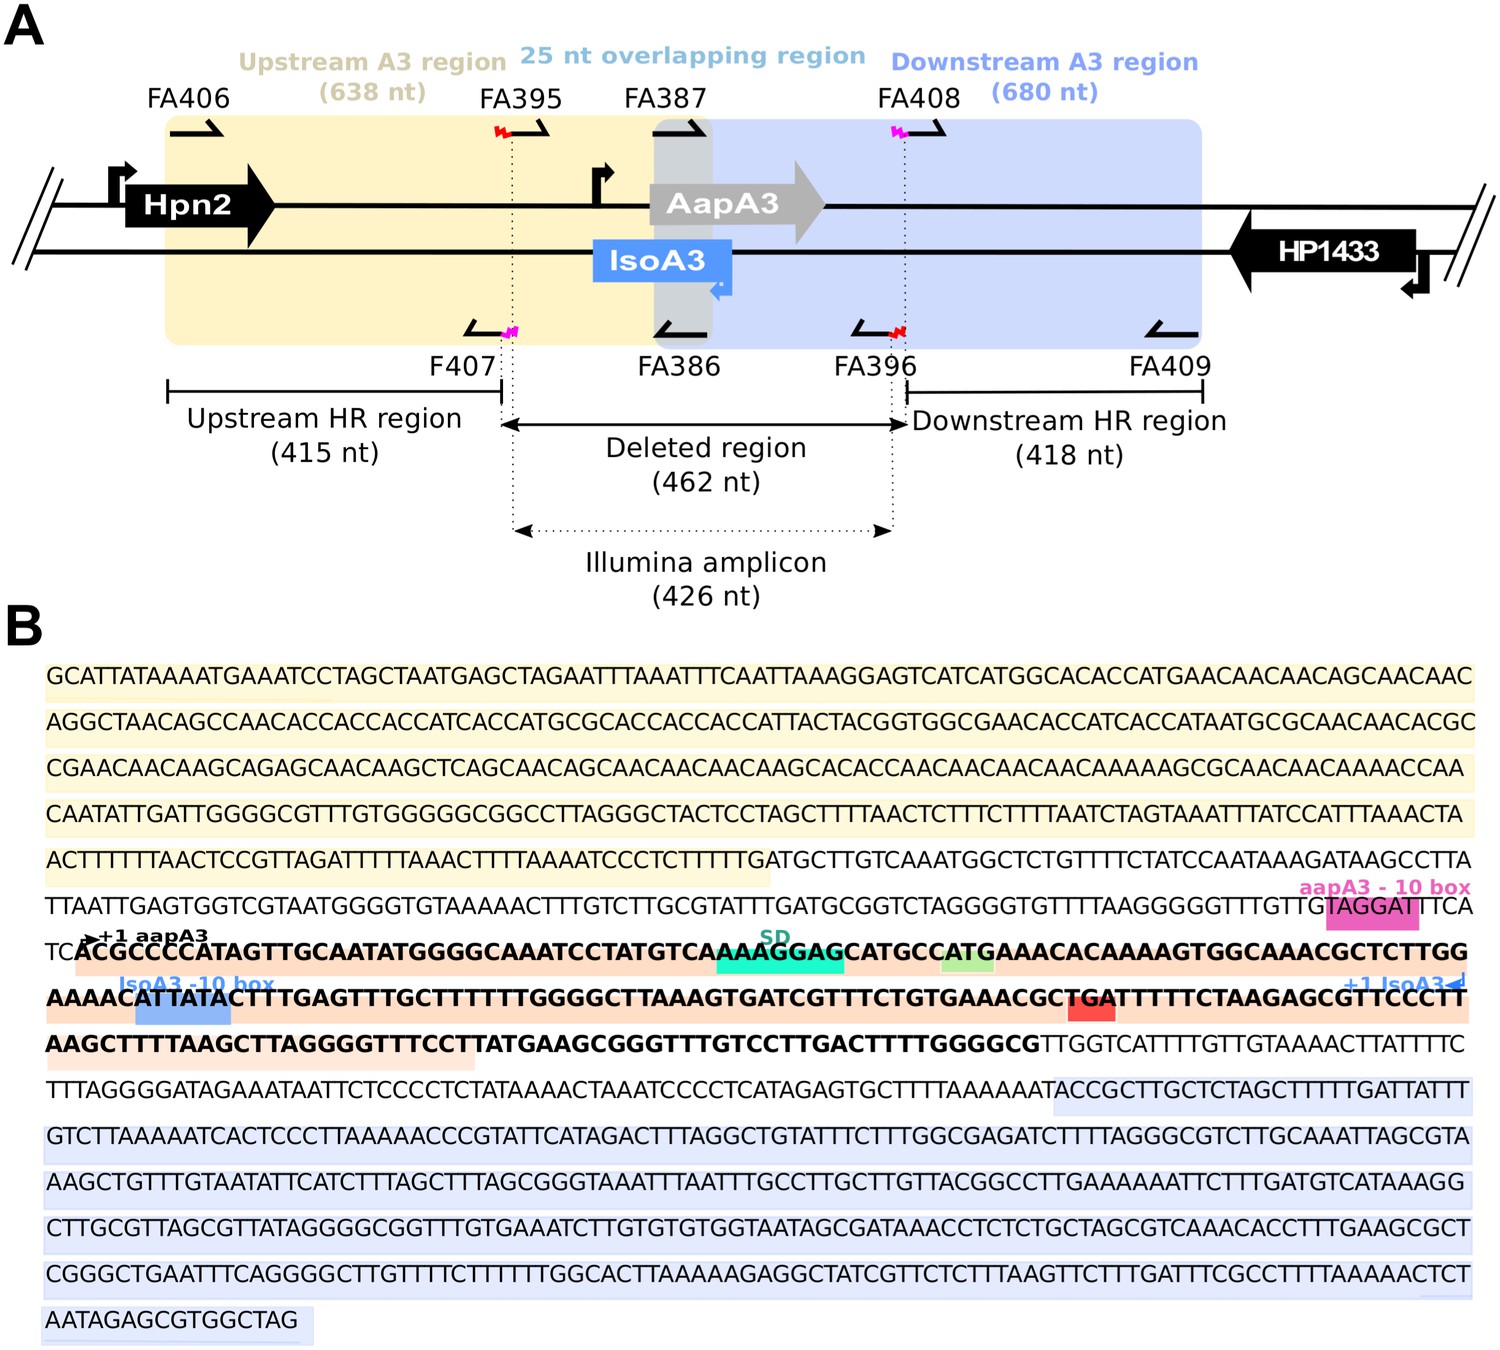
Details on aapA3/IsoA3 locus deletion and deep-sequencing approaches.
(A) Schematic view of the aapA3/IsoA3 locus showing the oligonucleotides used for deletion and Illumina paired-end sequencing. Are shown: the upstream and downstream homology regions (HR) used for homologous recombination in all transformation assays; the deleted region and the amplicon used for Illumina paired-end sequencing approach; primers FA407 and FA408 carrying overhang 5’ tails (in pink) complementary to the 5’ and 3’ ends of the rpsLCj-erm cassette used for locus deletion; primers FA395 and FA396 carrying an overhang 5’ tail (in red) containing the adapters for paired-end Illumina sequencing approach (see Table 1 for oligonucleotides sequences). (B) Sequence of the aapA3/IsoA3 module located at the chromosomal locus III of the H. pylori 26695 strain. Upstream (415 nt) and downstream (418 nt) regions used for homologous recombination (HR) are highlighted in yellow and purple, respectively. Deleted region in the aapA3/IsoA3 knockout mutant corresponds to the region flanked by the upstream and downstream HR regions. AapA3 −10 box is shown in pink. AapA3 transcription start site (TSS, +one aapA3) determined by RNA-seq analysis is represented with a black arrow. AapA3 full-length transcript is in bold. The 3’ end-truncated aapA3 mRNA is highlighted in orange. The aapA3 Shine-Dalgarno sequence (SD) is shown in turquoise. AapA3 start (ATG) and stop (TGA) codons are shown in green and red, respectively. IsoA3 −10 box is highlighted in blue. IsoA3 transcription start site (TSS, +1 IsoA3) is represented by a blue arrow.
Figure 2
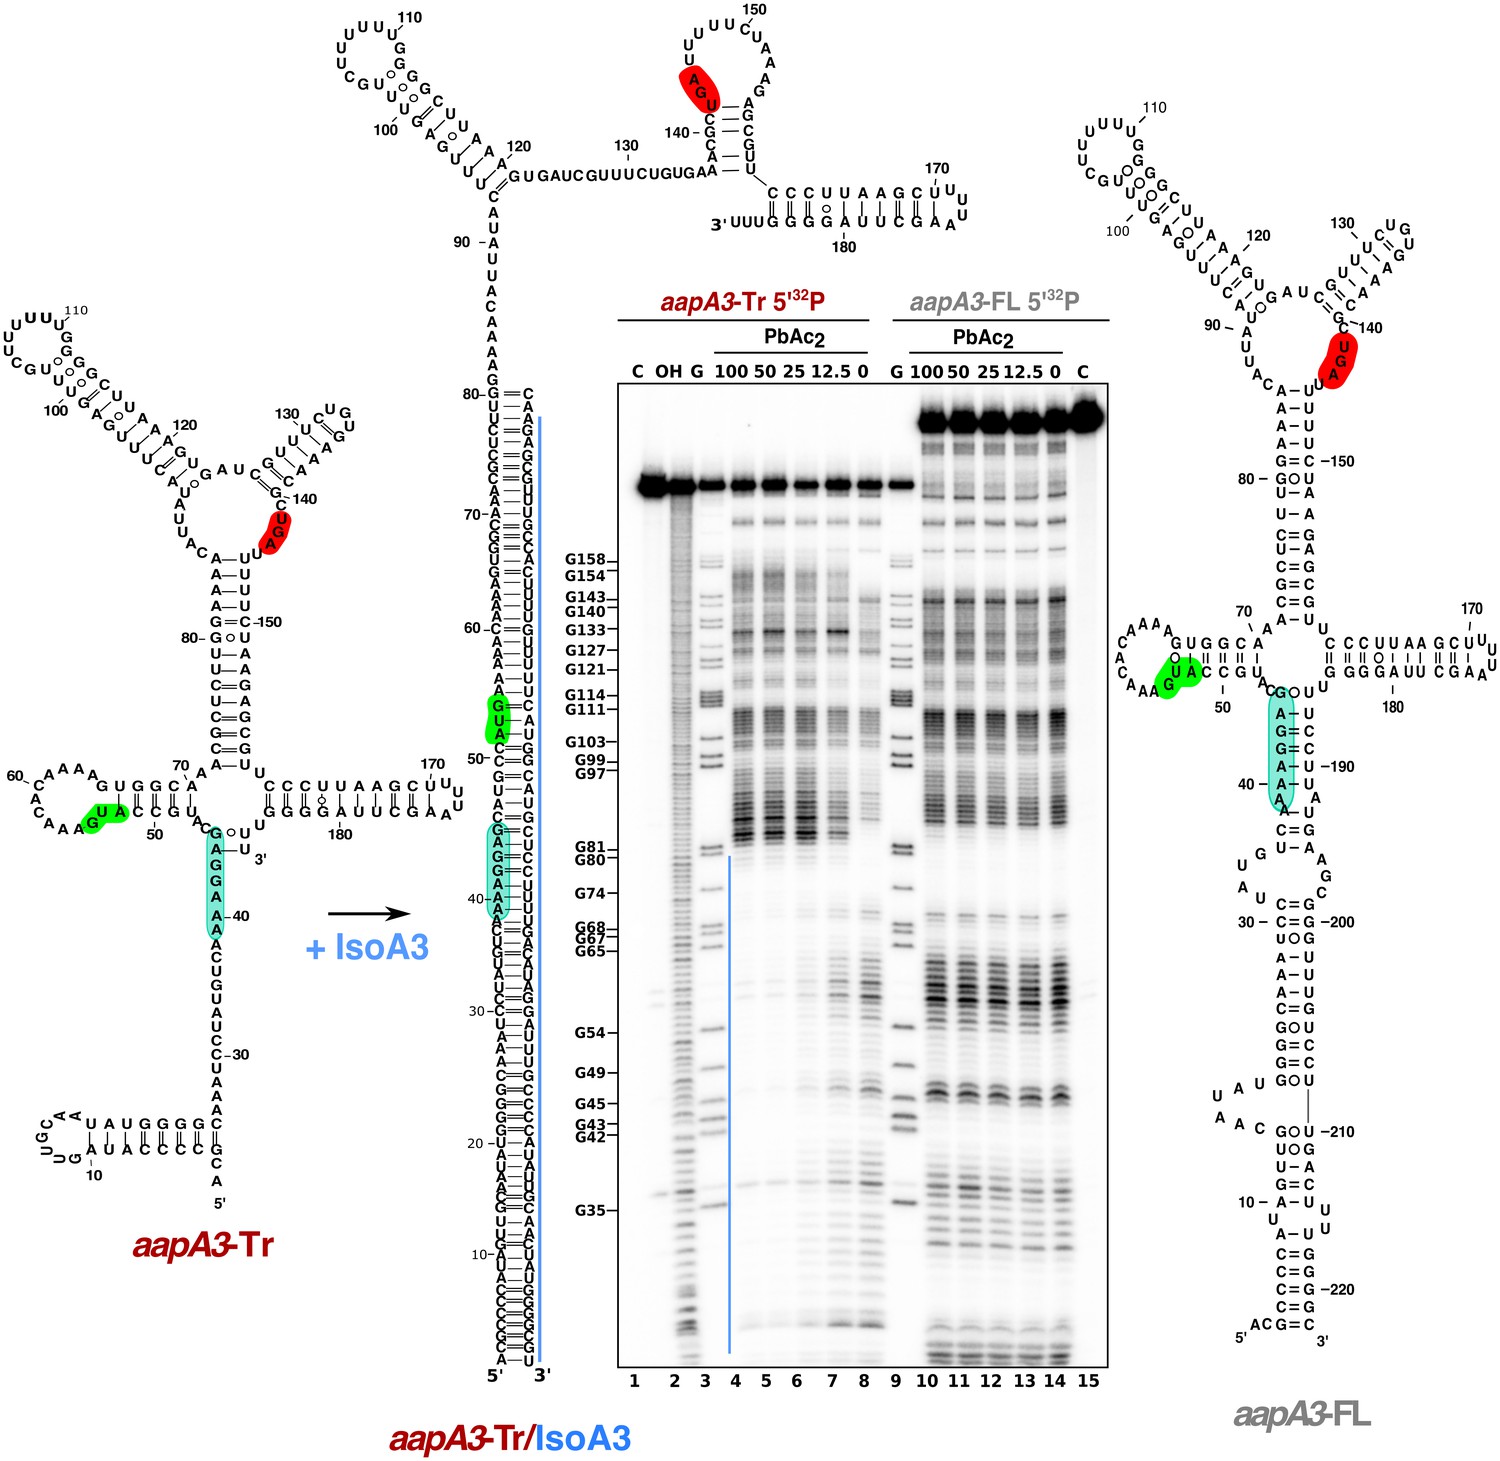
IsoA3 inhibits aapA3-Tr translation by masking its SD region.
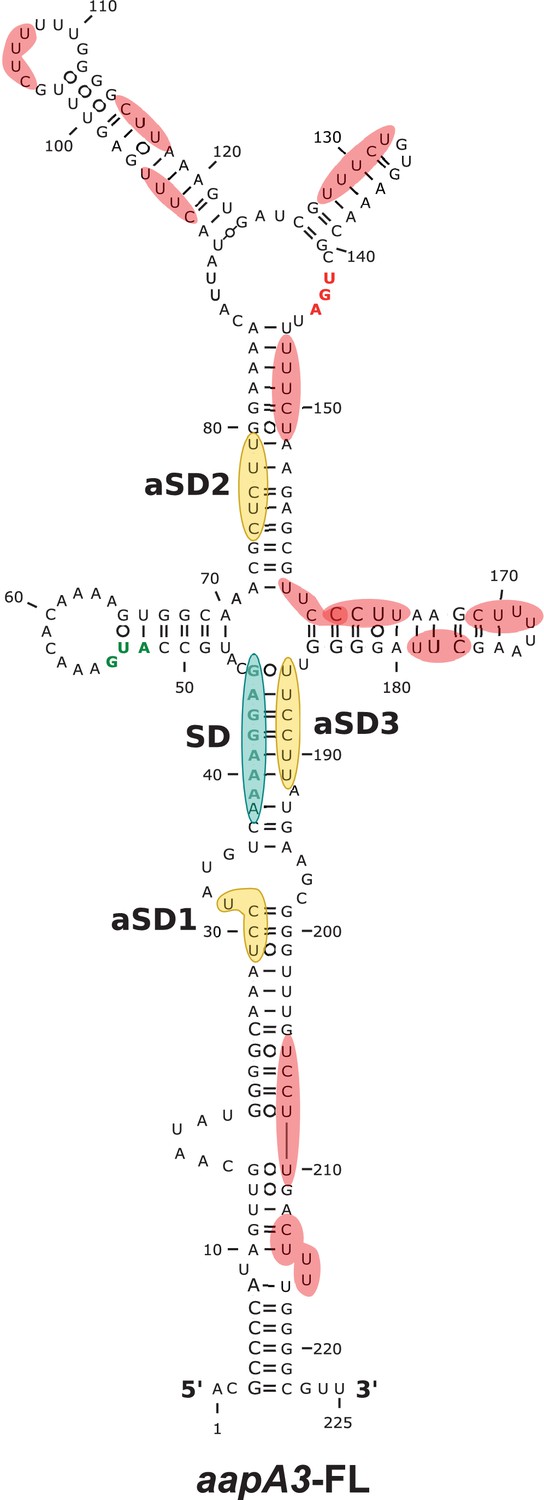
~0.1 pmol of 5’-end [32P]-labeled in vitro transcribed aapA3-FL and aapA3-Tr RNAs were subjected to lead probing in presence of increasing concentrations of IsoA3 (0–100 nM). Untreated RNA (lanes 1 and 15, denoted C) and partially alkali-digested RNA (denoted OH, lane 2) served as control and ladder, respectively. Positions of all G residues revealed upon T1 digestion under denaturing conditions (lanes ‘G’) are indicated relative to the transcription start site of the aapA3 gene. Cleaved fragments were analyzed on an 8% denaturing polyacrylamide (PAA) gel. 2D structure predictions were generated with the RNAfold Web Server (Gruber et al., 2008) and by introducing additional constraints based on in vitro structure probing. The VARNA applet (Darty et al., 2009) was used to draw the diagrams. The region involved in duplex formation between IsoA3 and aapA3-Tr mRNA is indicated with a blue line; the start codon, stop codon and SD sequence of AapA3 are highlighted in green, red and turquoise, respectively.
Figure 3 with 3 supplements
Unveiling intragenic toxicity determinants with nucleotide resolution.
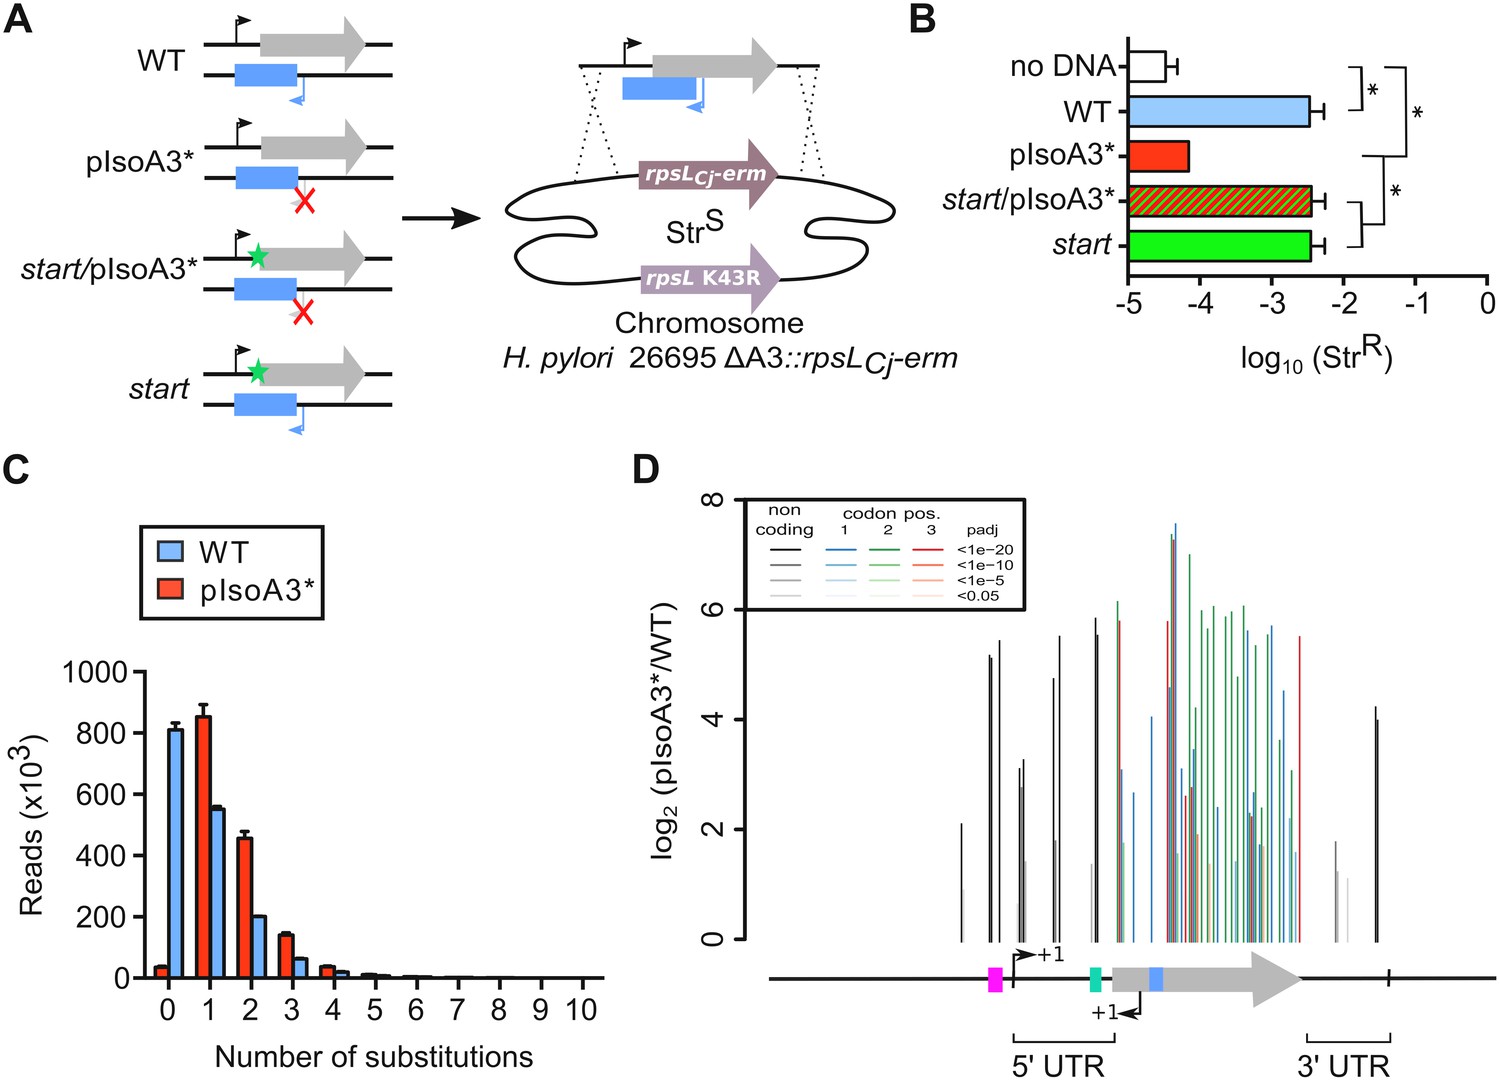
(A) PCR fragments used for transformation of the ∆A3 strain (∆aapA3/IsoA3::rpsLCj-erm) are shown. A green star indicates a mutation in the start codon (G54T). The red cross indicates the two mutations (A87G and A90C) introduced to inactivate the IsoA3 promoter (pIsoA3*). Gene replacement at the locus was selected by plating transformants on streptomycin. (B) Transformation efficiency (number of StrR transformants divided by the total number of transformed cells) was determined for each construct. A control in which the PCR fragment was replaced by H2O (no DNA) is also shown. Error bars represent standard deviations (s.d); n = 3 biological replicates (*p<0.05; values according to unpaired t-test). (C) Number of reads containing 0 to 10 substitutions in the sequenced amplicon of 426 nt encompassing the aapA3/IsoA3 TA locus. Error bars represent s.d; n = 3 biological replicates. (D) Positional analysis of single-nucleotide substitutions on the aapA3/IsoA3 locus. Bar plot shows the log2 fold-change (pIsoA3*/WT ratio) for the 70 positions with an adjusted p-value (padj) lower than 0.05. Bars are drawn with different shades of gray according to the p-value in the non-coding regions, and with different shades of color within the coding region (red, green, or blue, for the first, second, and third codon position, respectively). The relevant sequence elements are indicated by arrows and boxes under the graph. 5’ UTR, 5’ untranslated region; purple box, aapA3 −10 box; small bent arrows, +1 transcription start site (TSS) of aapA3 and IsoA3; turquoise box, aapA3 SD sequence; large gray arrow, aapA3 ORF; small blue box, IsoA3 −10 box; 3’ UTR, 3’ untranslated region. A comparison of the distribution and relative frequency of single-nucleotide suppressors in the strains transformed with the WT or pIsoA3* PCR constructs can be found in Figure 3—figure supplement 1.
-
Figure 3—source data 1
Raw data to determine the transformation efficiency in Figure 3B.
- https://doi.org/10.7554/eLife.47549.010
Figure 3—figure supplement 1
Comparison of the distribution and relative frequency of single-nucleotide suppressors in the WT and pIsoA3* aapA3/IsoA3 modules.
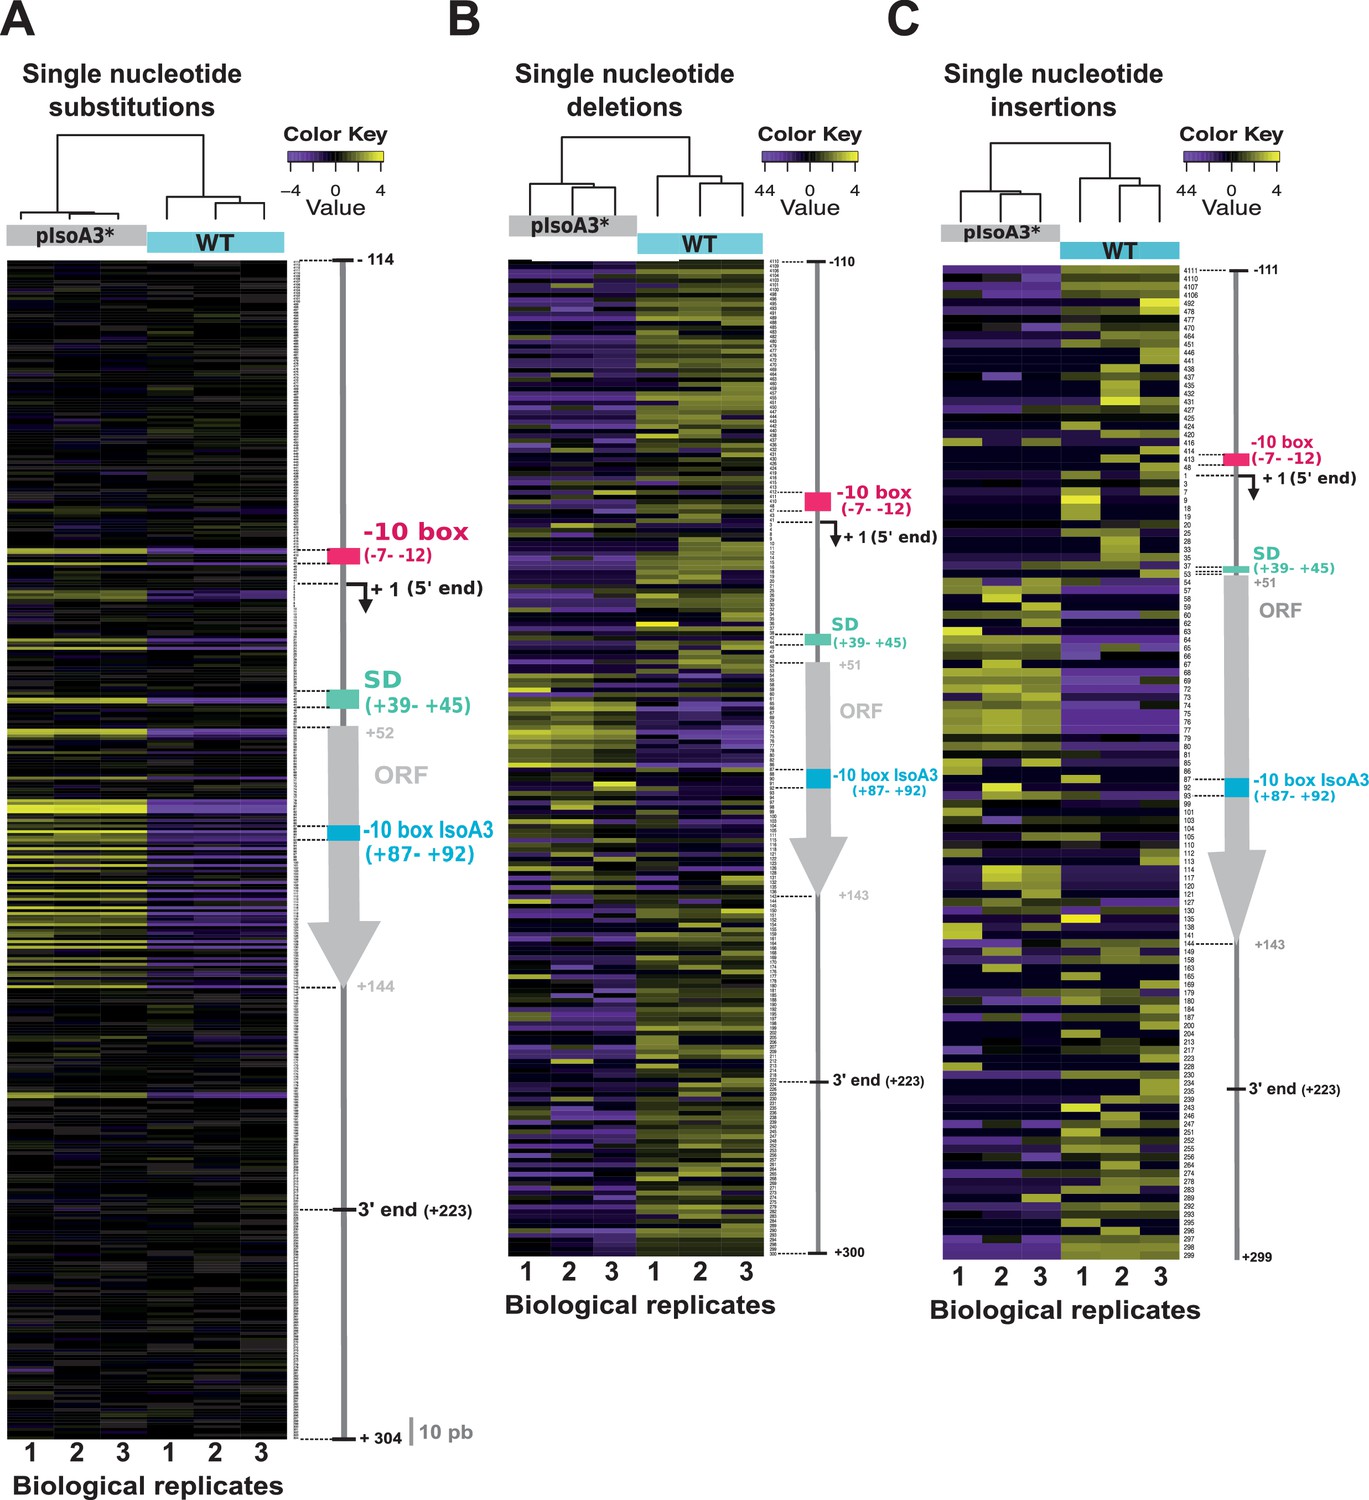
Heatmap of the location and relative abundance of single-nucleotide substitutions (A), deletions (B), and insertions (C), in WT (aapA3/IsoA3) and pIsoA3* (aapA3/pIsoA3*) samples coming from Miseq Ilumina deep-sequencing. For a given position, all sequences showing a single-nucleotide substitution (A), deletion (B), or insertion (C) at that position were counted irrespective of the nucleotide identity (‘positional’ analysis). Sequence counts were converted into TMM-normalized, median-centered, and log2-transformed FPKM values, which were then hierarchically clustered according to biological replicate sample (see Materials and methods section for details). The color key gives the log2 value scale (negative and positive values represent relative frequencies below and above the median, respectively). Positions are numbered relative to the aapA3 transcriptional start site (TSS, +1). Colored arrows and boxes on the right-hand side of each heatmap indicate the locations of relevant sequence elements on the aapA3/IsoA3 locus: −10 box, aapA3 promoter −10 box; −10 box IsoA3, IsoA3 promoter −10 box; +1 (5’ end), aapA3 transcription start site; SD, Shine-Dalgarno; ORF, open reading frame; 5’ and 3’ ends delimit the UTRs (untranslated regions) on the aapA3 mRNA; the ‘10 nt’ scale bar at the bottom of panel (A) is used to measure intervals of 10 nucleotides alongside the map.
Figure 3—figure supplement 2

Defining and validating the aapA3 promoter with nucleotide resolution.
(A) Statistical analysis of the differential number of individual single-nucleotide substitution sequences in WT (aapA3/IsoA3) and pIsoA3* (aapA3/pIsoA3*) samples was carried out using DESeq2 (‘nucleotide-specific’ analysis; see Materials and methods section for details). Nucleotide substitutions that are significantly enriched (padj ≤0.05) in pIsoA3* compared to WT sequences in aapA3 promoter region are shown. The −10 box of the aapA3 gene promoter is highlighted in pink; an enriched mutation located at position −26 from aapA3 +1 is highlighted in yellow. (B) Total RNA was isolated from the indicated strains and 10 μg were subjected to Northern Blot analysis. The same membrane was successively probed with FD38 labeled oligonucleotide and IsoA3 riboprobe to detect aapA3 and IsoA3 transcripts, respectively. The different transcripts are annotated as: aapA3-FL (full length), aapA3-Tr (3’ end truncated), and IsoA3 full-length and processed transcripts. Proper loading was assessed by the level of 5S rRNA using the labeled oligoprobe FD35.
Figure 3—figure supplement 3

Single-nucleotide suppressor mutations located in the 5’ and 3’ terminal stem-loops of the active aapA3 mRNA.
2D structure prediction was generated with the RNAfold Web Server (Gruber et al., 2008) with no additional constrains. VARNA (Darty et al., 2009) was used for drawing. The single-nucleotide substitutions in the 5’ or 3’ aapA3-Tr stem-loops are highlighted in yellow and gray, respectively. The selected nucleotide substitutions are indicated next to each wild-type nucleotide. Translation start and stop codons are shown in bold green and red, respectively. Shine-Dalgarno sequence (SD) is shown in bold turquoise. The three main mutations lying outside the terminal stem-loops that are studied in this manuscript are highlighted in orange (A28C), purple (A40T), and dark blue (T78C).
Figure 4 with 2 supplements
Single point suppressor mutations in the 5’ UTR of the aapA3 mRNA inhibit its translation.
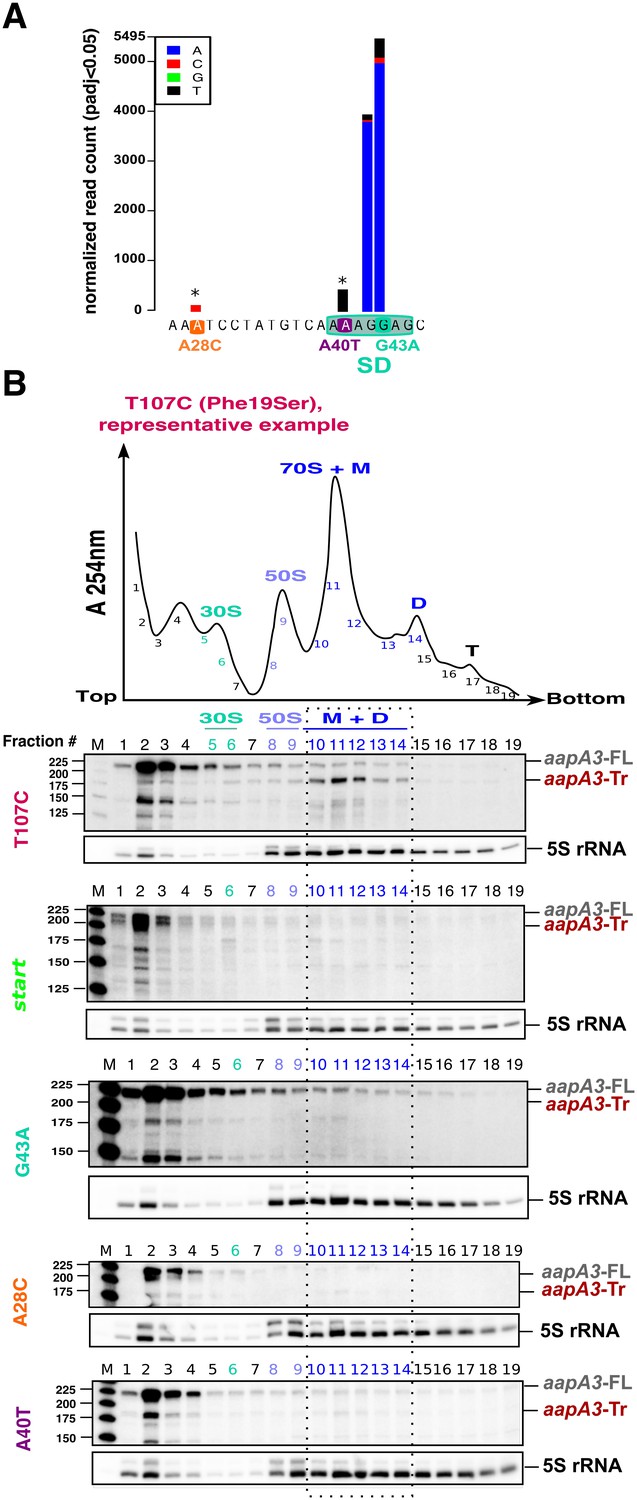
(A) Nucleotide substitutions within the aapA3 5’ UTR that are significantly enriched (pajd ≤0.05, ‘nucleotide-specific’ analysis, see Materials and methods section) in pIsoA3* compared to WT. Asterisks above the bars indicate transversion mutations. The SD sequence is boxed. (B) Cell lysates of the indicated aapA3 variant strains were subjected to ultracentrifugation through a sucrose gradient. A representative A254nm profile of the T107C strain is shown. Peaks of the free 30S and 50S subunits, 70S ribosomes (free ribosomes and monosomes (M)), and polysomes (D, disomes; T, trisomes) are indicated. RNA was extracted from each fraction and equal volumes of each fraction were subjected to Northern blot analysis. The different transcripts aapA3-FL, aapA3-Tr, and 5S rRNA (loading control) are indicated. The vertical dashed lines delineate the limits corresponding to 70S, monosome and disome fractions. Quantification of the relative band intensity of the aapA3 mRNAs in each fraction can be found in Figure 4—figure supplement 1.
Figure 4—figure supplement 1
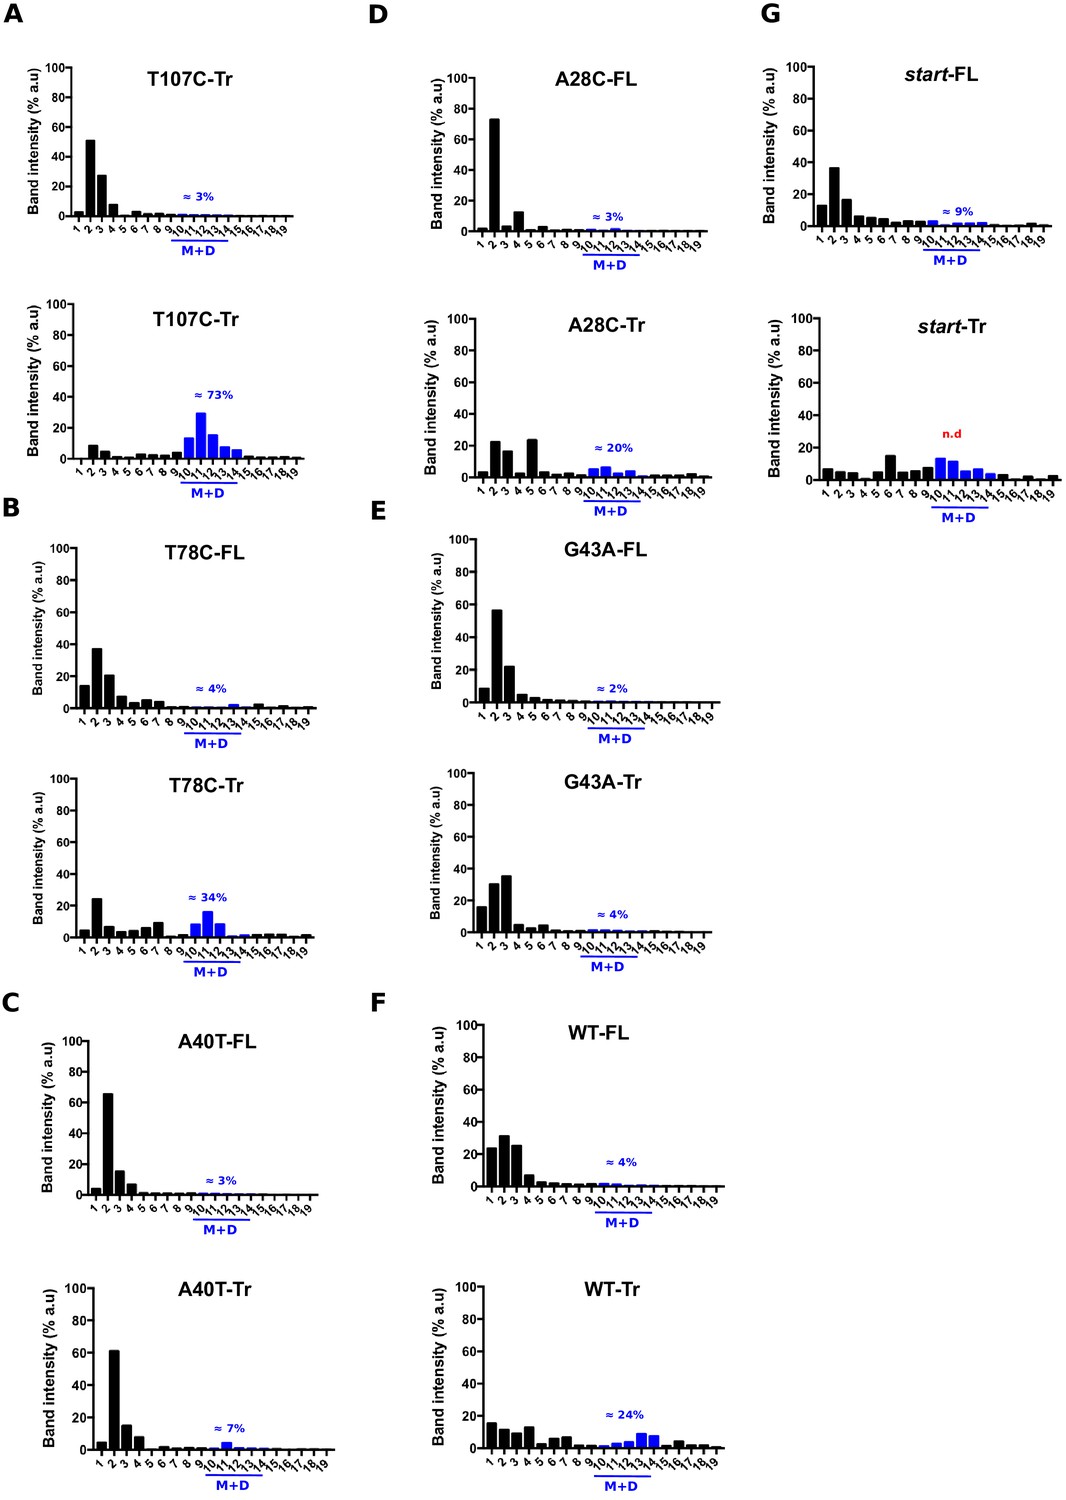
Quantification of the relative aapA3 mRNA band intensity from polysome fractionation Northern Blots shown in Figure 4.
Relative band intensity was determined using the ImageLab software. Percentage of band intensity located in 70S fractions was calculated for each aapA3 transcript (full-length, -FL or truncated, -Tr) by dividing the band intensity in 70S fractions by the total band intensity (intensity values in all fractions). Each panel shows the data for a given WT or mutant transcript. The blue line represents monosomes and disomes. In the case of the start (G54T/pIsoA3*) strain, the quantification of the aapA3-Tr form present on the M+D fractions was not possible due to a strong mRNA degradation (n.d = non detectable).
Figure 4—figure supplement 2
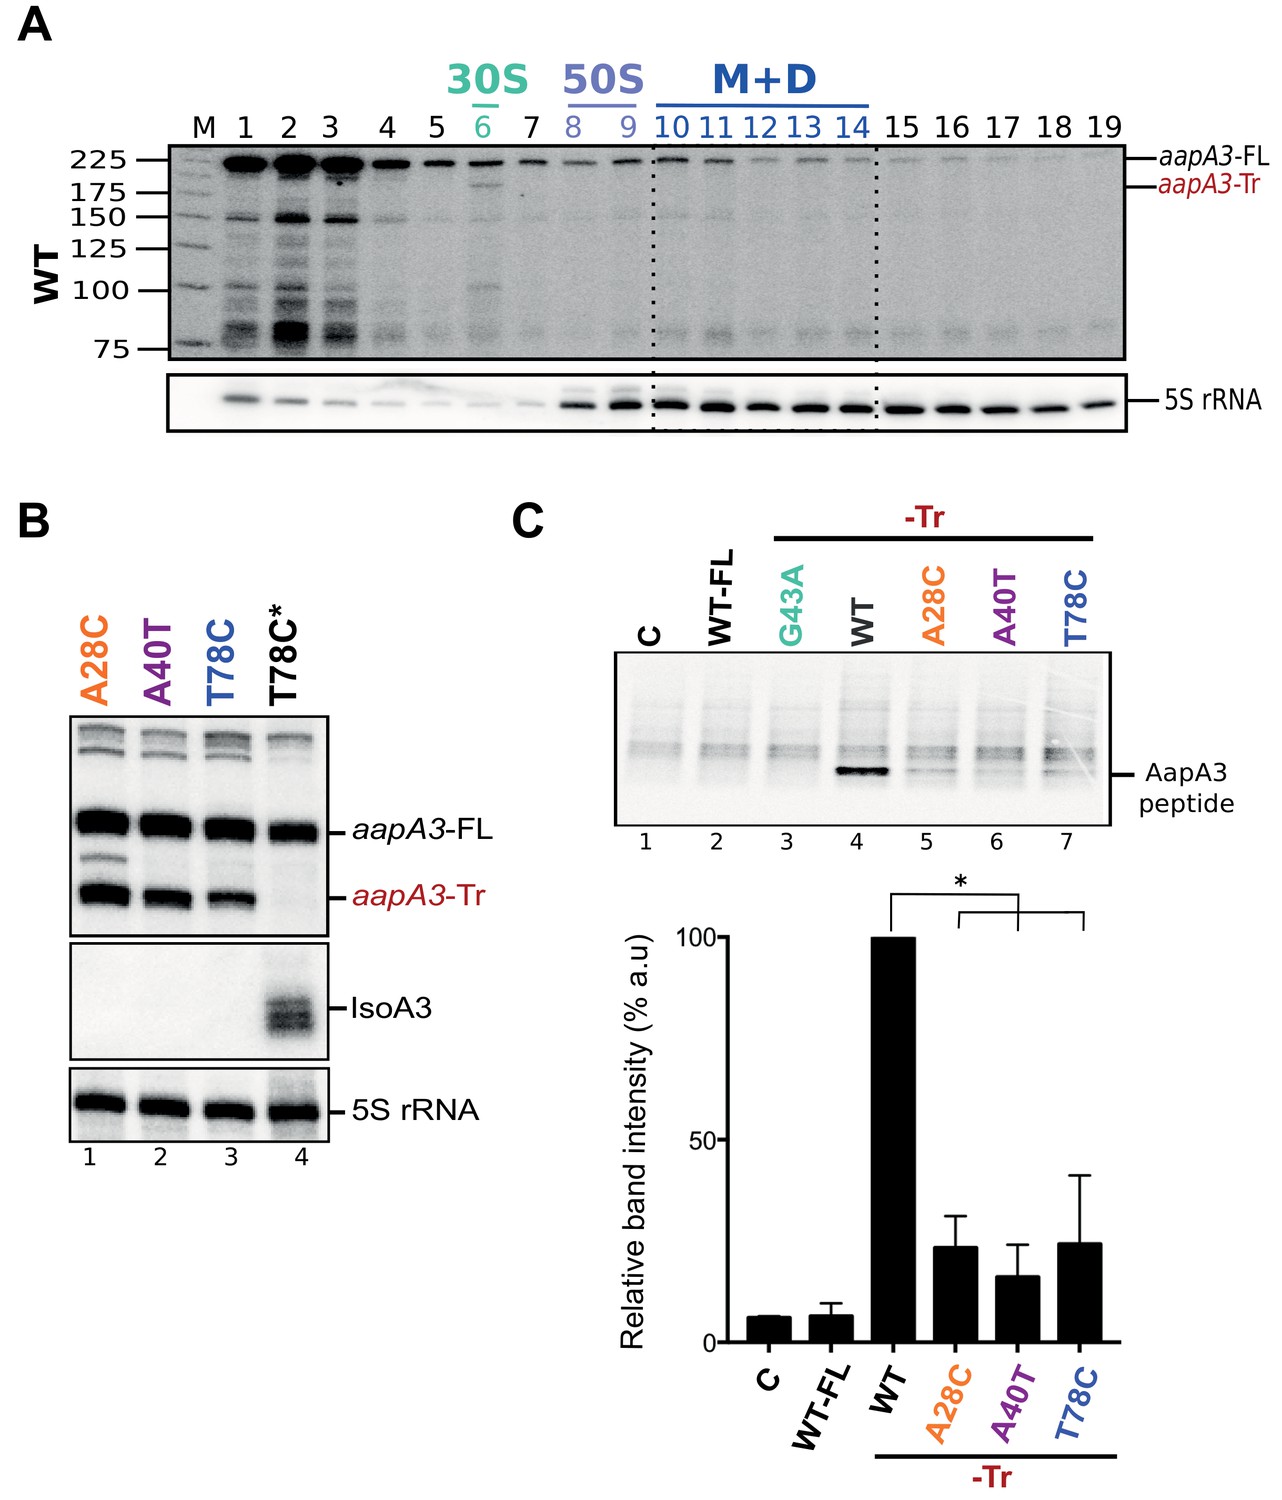
The A28C, A40T and T78C suppressors inhibit aapA3-Tr mRNA translation.
(A) Only the 3’ end truncated aapA3 mRNA form is translated in vivo. Cell lysate of the H. pylori 26695 wild-type (WT) strain was subjected to ultracentrifugation through a sucrose gradient. A profile of OD254nm was recorded. RNA was extracted from each fraction and equal volumes of each extract were subjected to Northern Blot analysis. Fractions corresponding to the free 30S and 50S subunits, 70S ribosomes (free and translating) and polysomes are indicated. The different transcripts are annotated as: aapA3-FL (full length, 225 nt), aapA3-Tr (3’ end truncated, 190 nt), and 5S rRNA as loading control (5S rRNA). M, monosomes; D, disomes. (B) Gene expression analysis of the indicated strains was analyzed by Northern Blot. Transcripts aapA3-FL (full length), aapA3-Tr (3’ end truncated), and IsoA3 full-length and processed transcripts are shown. Proper loading was assessed by the level of 5S rRNA. The T78C* construct contains a WT IsoA3. (C) Relative peptide production upon in vitro translation of aapA3-FL, aapA3-Tr and the aapA3-Tr form of the three independent suppressor mutants A28C-Tr, A40T-Tr and T78C-Tr (upper panel). A construct with inactivated SD sequence (G43A-Tr) was also included for comparison. Control lane (0) shows the translation background obtained without exogenous mRNA. A representative experiment is shown. Relative peptide production was quantified (lower panel). Error bars represent the s.d; n = 3 technical replicates, *p<0.0001 according to unpaired t-test. Peptide production using the G43A-Tr control RNA was not quantified as the experiment was performed only once. Figure 4—figure supplement 2—source data 1.
-
Figure 4—figure supplement 2—source data 1
Numerical values of the 3 replicates of the in vitro translation assays shown in Figure 4—figure supplement 2.
- https://doi.org/10.7554/eLife.47549.013
Figure 5 with 2 supplements
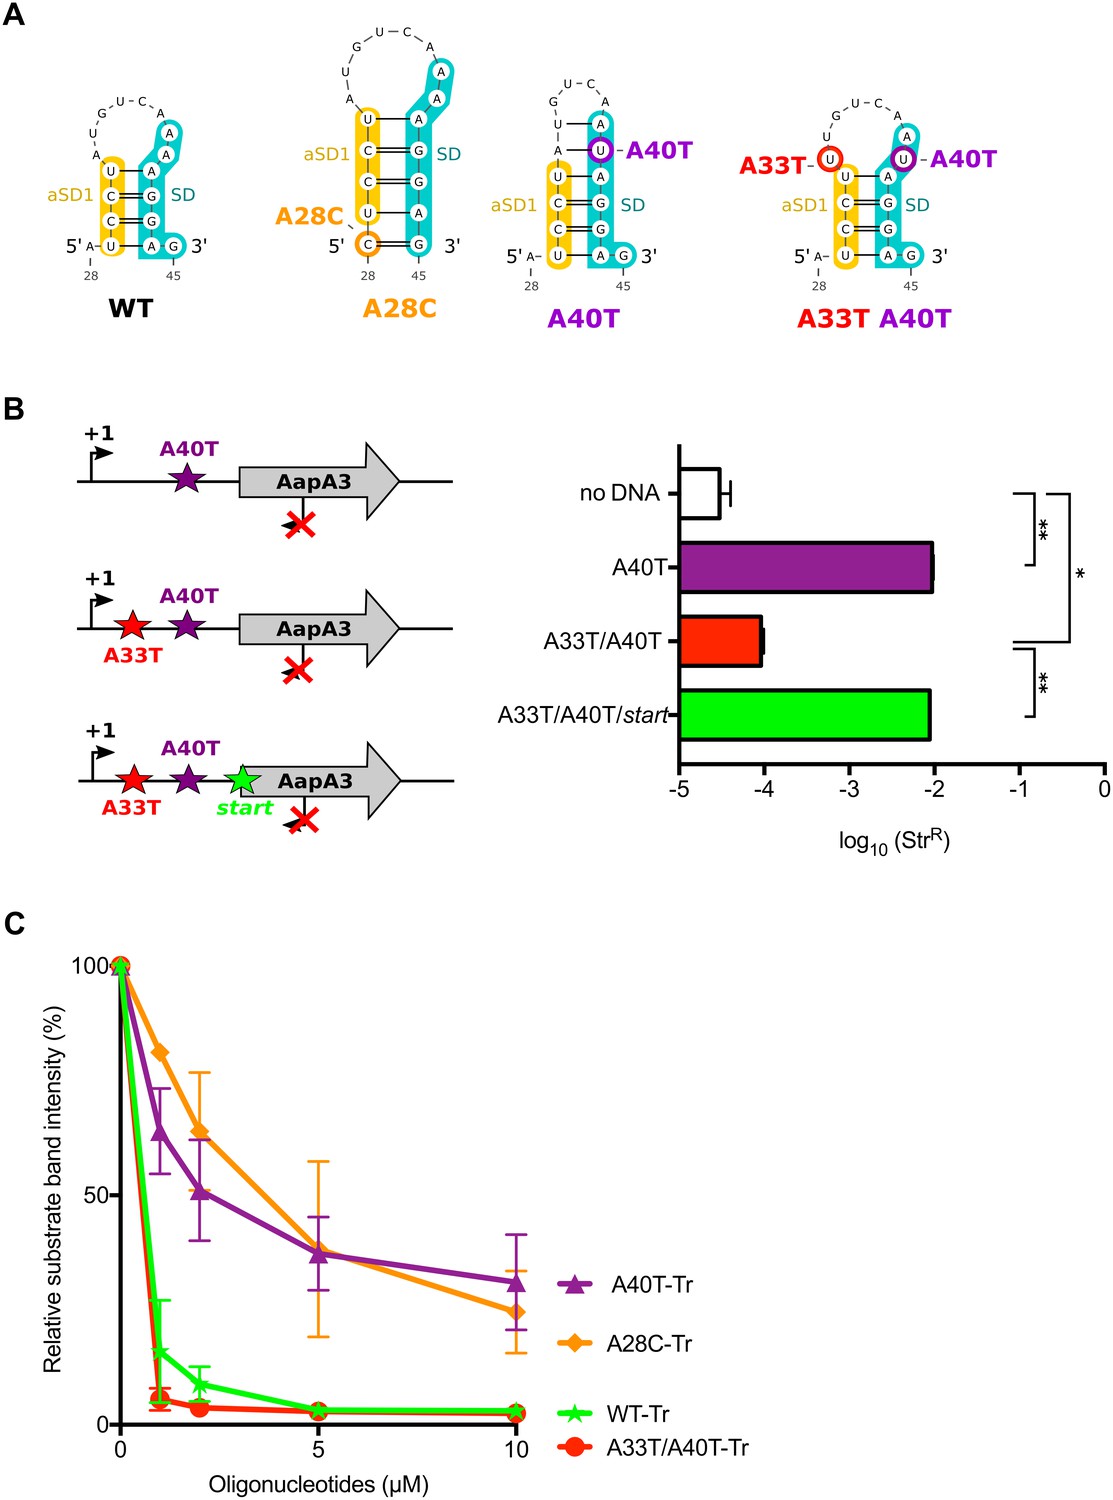
The A28C and A40T mutations suppress toxicity through SD sequestration.
(A) Predicted hairpins involving the sequestration of the SD sequence by the aSD1 motif. Prediction of these secondary structures were carried out on the aapA3-Tr transcript (see Figure 5—figure supplement 2 for visualizing the whole structure) using the same software as in Figure 2, but with no additional constraint. The A28C mutation (dark orange) generates an extra G-C base-pair; in the A40T mutant (purple), two additional A-U pairs stabilize the hairpin; the A40T antagonist mutation A33T is shown in red; the SD and aSD1 sequences are shown in turquoise and yellow, respectively. (B) (left) PCR constructs used to assess the SD sequestering structure by transformation assay. (right) For each transformation with the indicated PCR constructs, the number of StrR obtained per total number of transformed cells was calculated and plotted on a log scale. Error bars represent s.d; n = 3 biological replicates. (***p<0.0001; *p=0.001 according to unpaired t-test). (C) Graph representing the RNase H assays. The position of the oligonucleotides (FA644 for WT and A40T; FA651 for A33T/A40T; and FA652 for A28C, see Table 1) used in the RNase H protection assay is indicated by a black arrow along the first 45 nucleotides of the aapA3 mRNA (Figure 5—figure supplement 2). 30 fmol of internally labeled WT and mutated aapA3-Tr transcripts were incubated with 0 to 100 pmoles of each specific DNA oligonucleotide and subjected to digestion by E. coli RNase H1. Digestion products were analyzed on an 8% PAA denaturing gel (Figure 5—figure supplement 1). Substrate consumption was quantified as relative substrate band intensity, 100% corresponding to the intensity obtained in absence of oligonucleotide. Error bars represent the s.d; n = 2 technical replicates.
-
Figure 5—source data 1
Raw data to determine the transformation efficiency in Figure 5B.
- https://doi.org/10.7554/eLife.47549.018
-
Figure 5—source data 2
Numerical values of the graph shown in in Figure 5C.
- https://doi.org/10.7554/eLife.47549.019
Figure 5—figure supplement 1
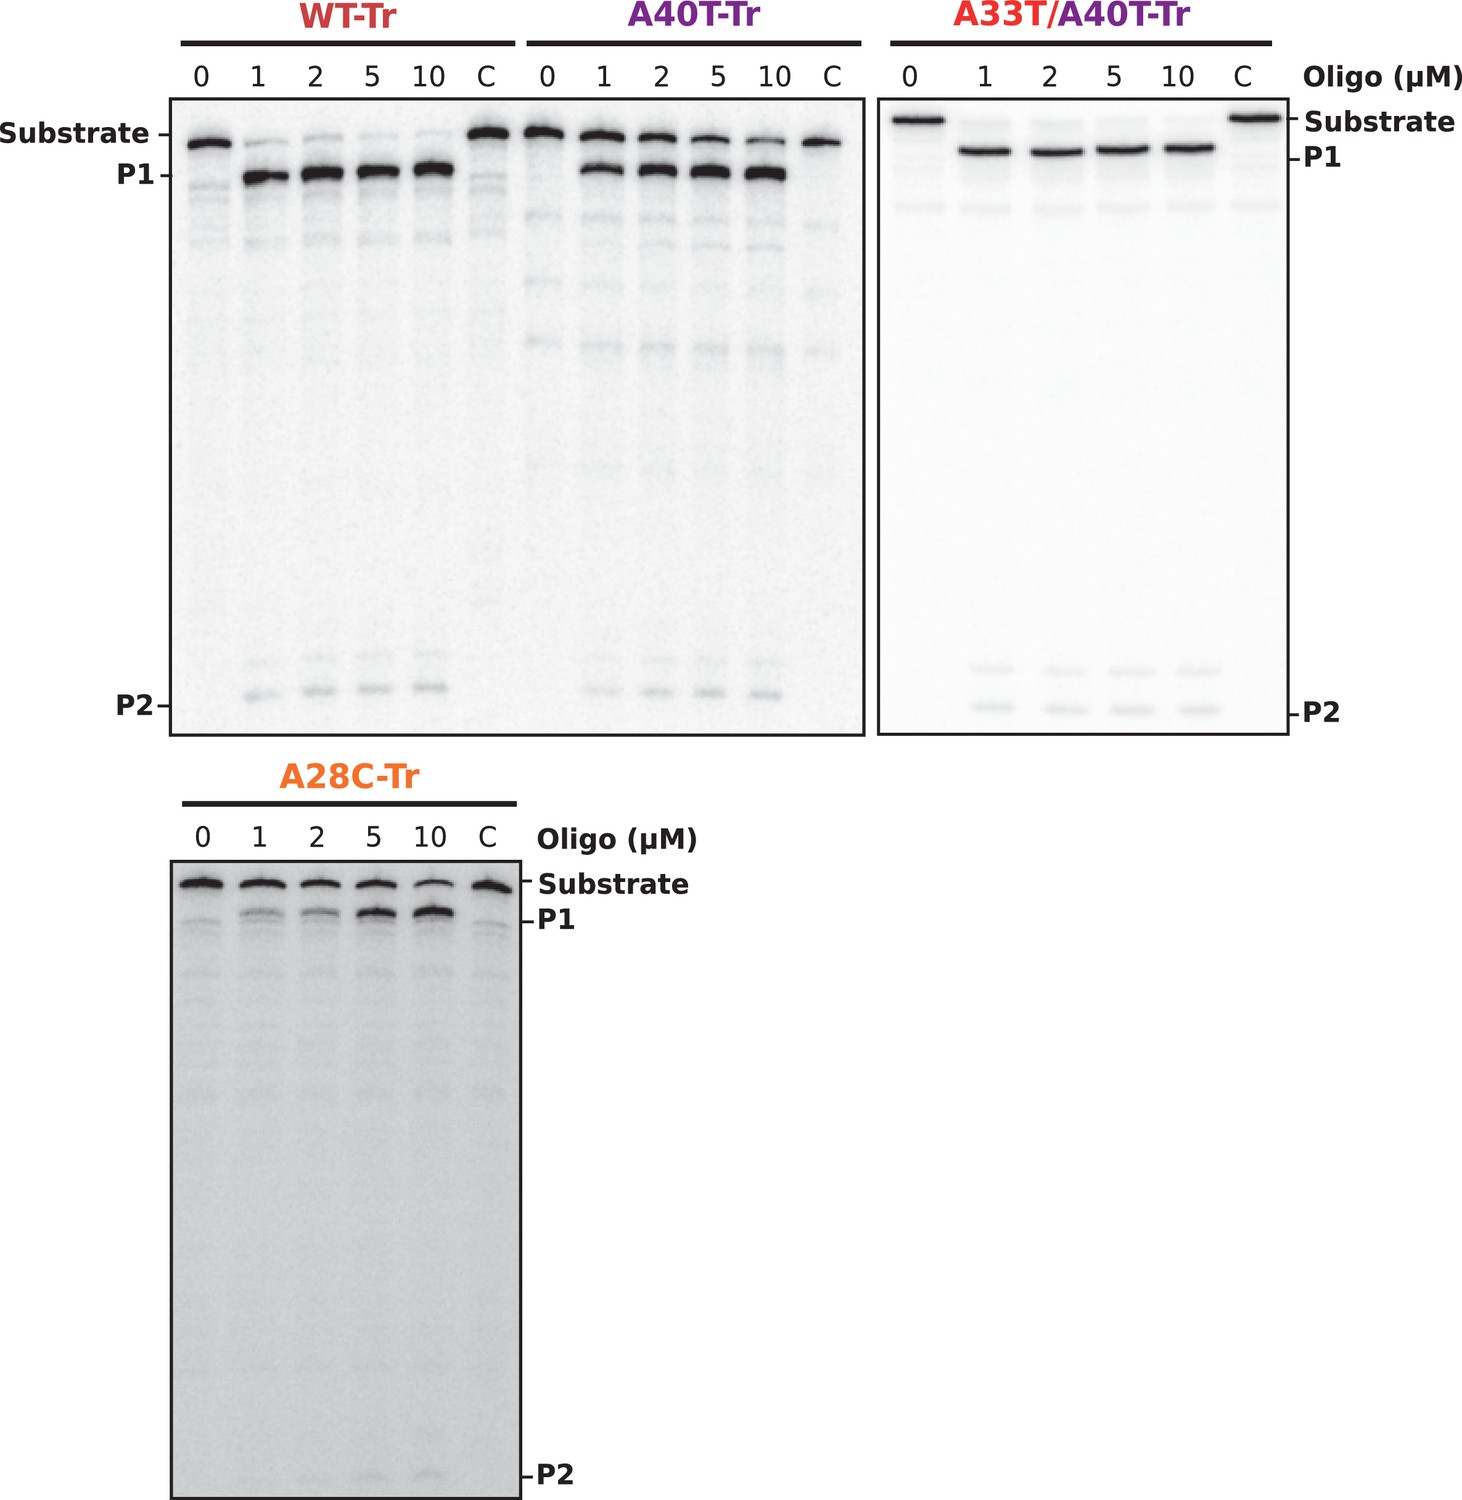
Gel analysis of RNase H/oligonucleotide accessibility assays.
30 fmol of internally labeled RNA were used. DNA oligonucleotides were used to a final concentration of 0 to 10 μM. Reactions were incubated for 30 min at 30°C in the presence or absence (C, control) of 0.25 U E. coli RNase H1. Reactions were stopped with 10 μl of 2X Loading Buffer and products were analyzed in an 8% denaturing PAA gel. See Figure 5C for relative band quantification. P1 and P2 indicate the two RNase H-oligonucleotide-mediated RNA cleavage products.
Figure 5—figure supplement 2
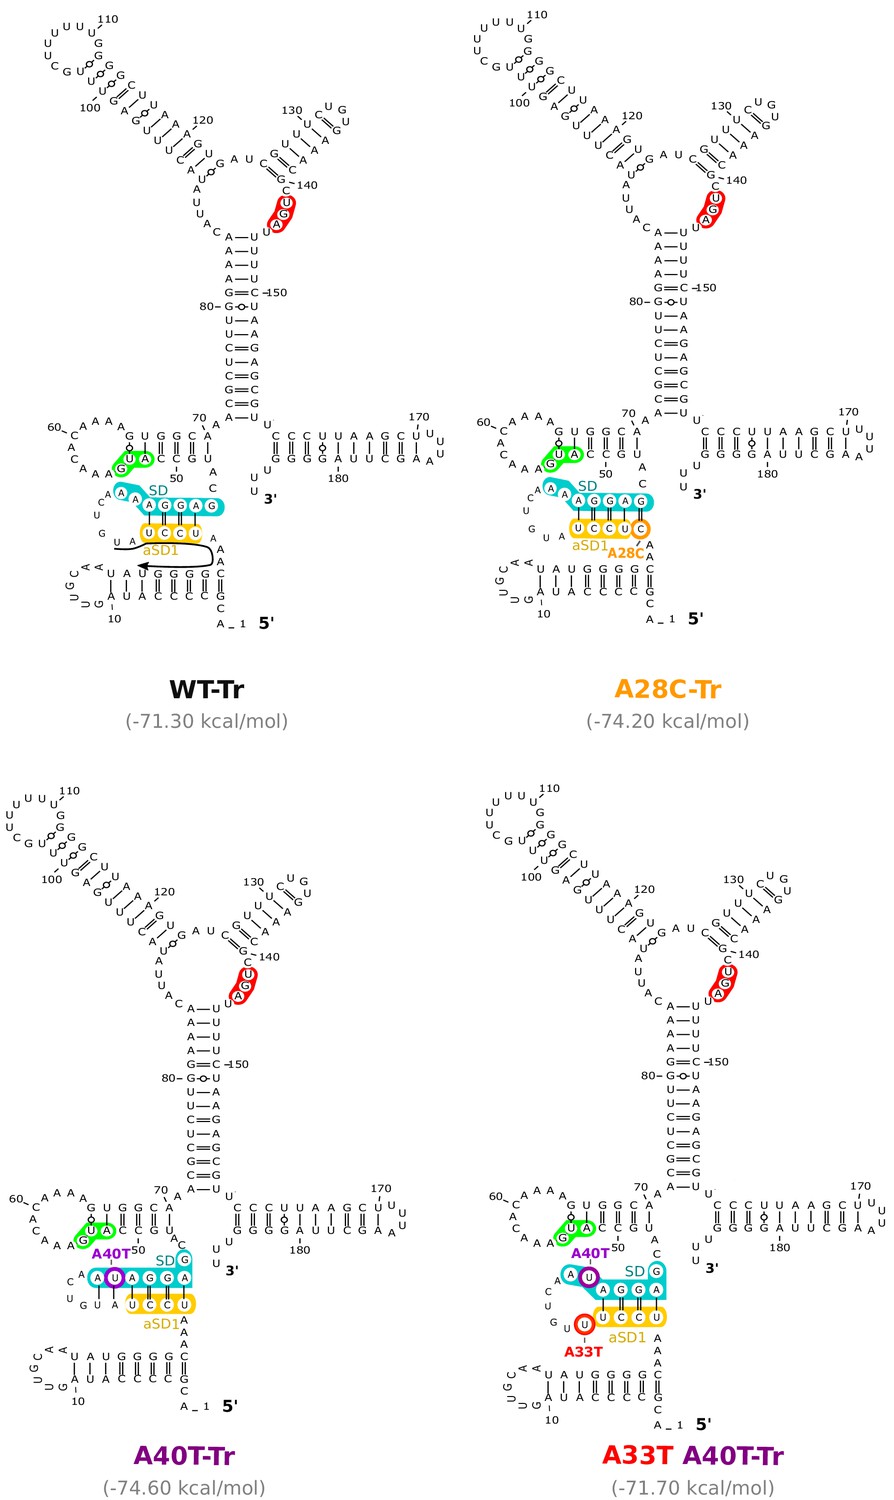
Location of the mutations working through the anti-SD sequence 1 (aSD1) in the aapA3-Tr mRNA.
RNAfold Web Server (Gruber et al., 2008) was used to generate 2D structure prediction without additional constrains and VARNA (Darty et al., 2009) was used for drawing. Translation start and stop codons are highlighted in green and red, respectively. Shine-Dalgarno (SD) and anti-SD (aSD) sequences are shown in turquoise and yellow, respectively. The suppressor mutations A28C and A40T are highlighted in orange and purple, respectively. The A40T compensatory mutation A33T is shown in red. Predicted delta G values (kcal/mol) of the represented structures are shown under each structure. A small black arrow in the WT-Tr structure represents the binding site of the oligonucleotides used in the RNase H assay shown in Figure 5.
Figure 6 with 2 supplements
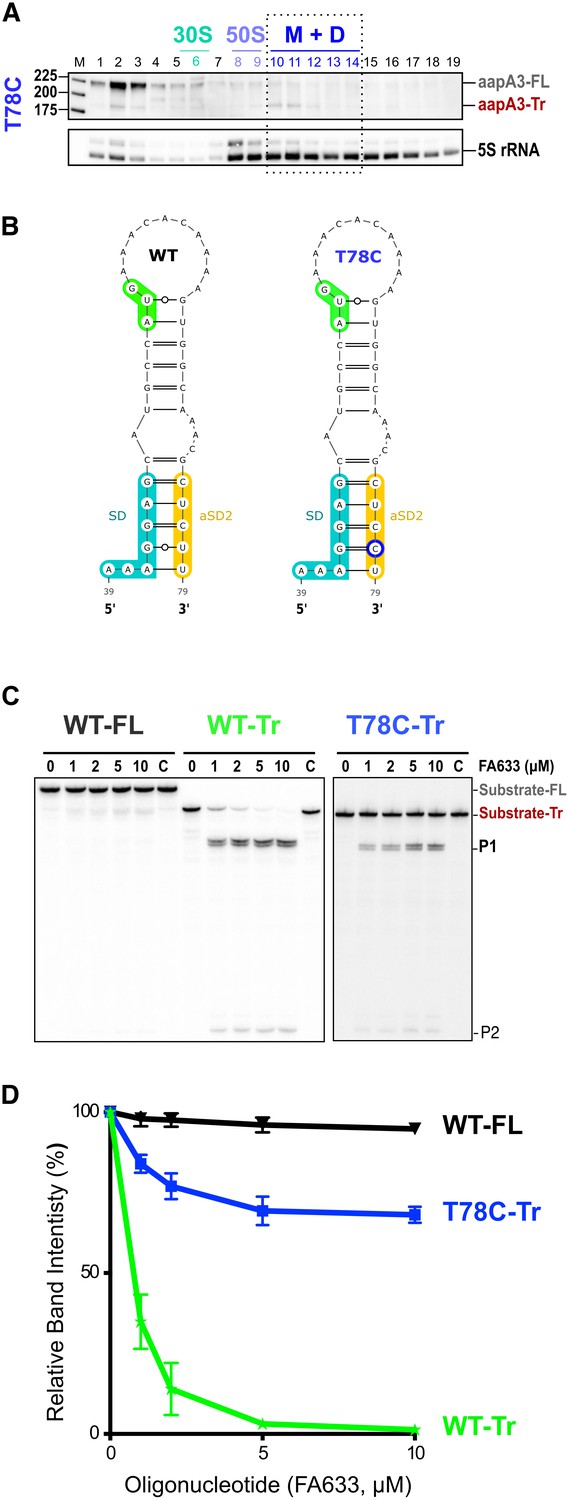
A synonymous mutation located within the toxin ORF inhibits aapA3 mRNA translation via SD sequestration.
(A) The cell lysate of the T78C strain was subjected to ultracentrifugation through a sucrose gradient. RNA was analyzed as in Figure 4. The different transcripts aapA3-FL, aapA3-Tr, and 5S rRNA (loading control) are indicated. M+D, monosomes + disomes. (B) Prediction of the secondary structure involving the second aSD sequence (aSD2). Prediction was carried out on the biologically relevant mRNA (aapA3-Tr) (see Figure 6—figure supplement 1). No additional constrains were used. The location of the oligonucleotide used in this assay (FA633) is shown by a black arrow in Figure 6—figure supplement 1. The T78C mutation is shown in dark blue, SD sequence in turquoise, anti-SD sequence in yellow and start codon in green. (C) A typical RNase H protection assay is shown. A total of 30 fmol of internally labeled aapA3-FL and aapA3-Tr RNA (WT or T78C) were incubated in presence of 0 to 100 pmoles of DNA oligonucleotide (FA633) and subjected to digestion by E. coli RNase H1. Lane C contains only the labeled substrate in absence of the enzyme. Two digestion products, P1 and P2, are indicated. (D) Substrate consumption was quantified as the relative substrate band intensity and plotted as a function of DNA oligonucleotide concentration. Error bars represent the s.d; n = 2 technical replicates.
-
Figure 6—source data 1
Numerical values of the graph shown in in Figure 6D.
- https://doi.org/10.7554/eLife.47549.024
Figure 6—figure supplement 1
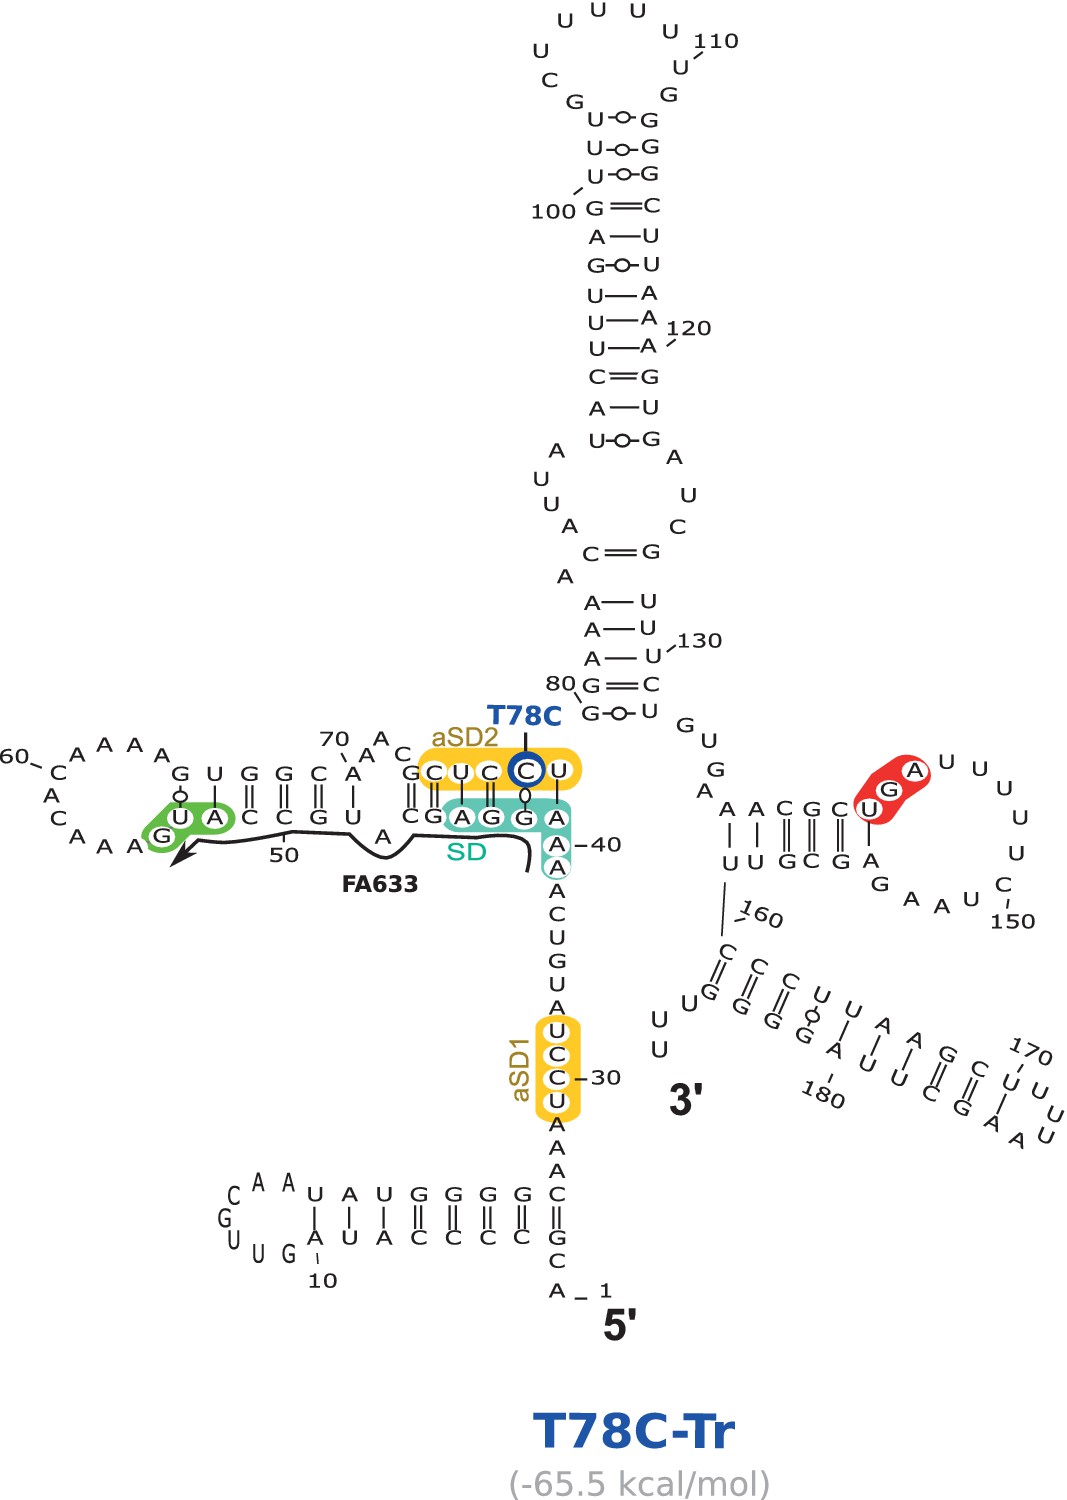
Location of the T78C suppressor mutation working through the anti-SD sequence 2 (aSD2) in the aapA3-Tr mRNA.
2D structure was predicted using the RNAfold Web Server (Gruber et al., 2008) with no additional constraints. VARNA (Darty et al., 2009) was used for drawing. Translation start and stop codons are highlighted in green and red, respectively. Shine-Dalgarno (SD) and anti-SD (aSD) sequences are shown in turquoise and yellow, respectively. The suppressor mutation T78C is highlighted in dark blue. The predicted delta G value (kcal/mol) is shown under the structure. The small black arrow indicates the binding site of the oligonucleotide used in the RNase H assay shown in Figure 6.
Figure 6—figure supplement 2
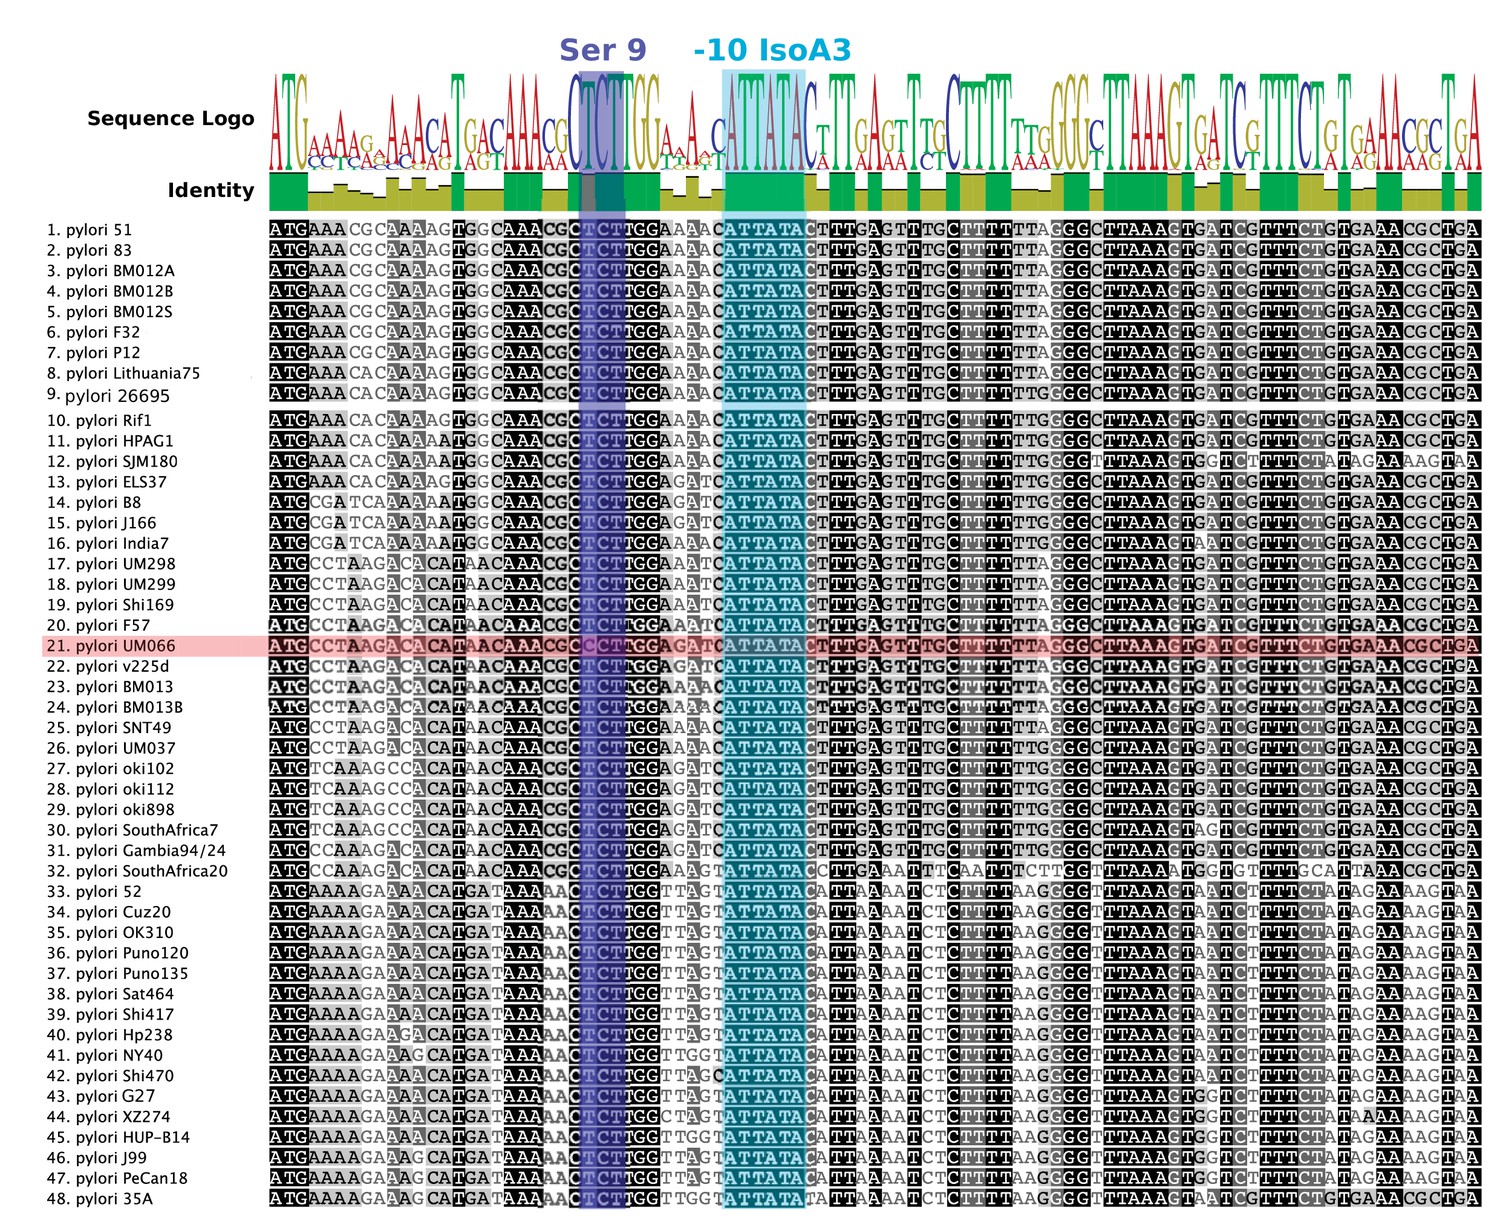
Nucleotide alignment of AapA3 coding region of 49 Helicobacter pylori strains.
Conserved nucleotides are highlighted in different tones of gray depending on their conservation level. Sequence logo and identity scores are shown on the top. The highly conserved region corresponding to the second SD sequestering-sequence (serine residue at position 9) and the IsoA3 −10 box are highlighted in dark and light blue, respectively. The UM066 strain, the only strain containing a CCT Proline codon at position 9, is highlighted in pink. Geneious software 8.1.8 (Kearse et al., 2012) was used for sequence collection and alignment.
Figure 7 with 1 supplement
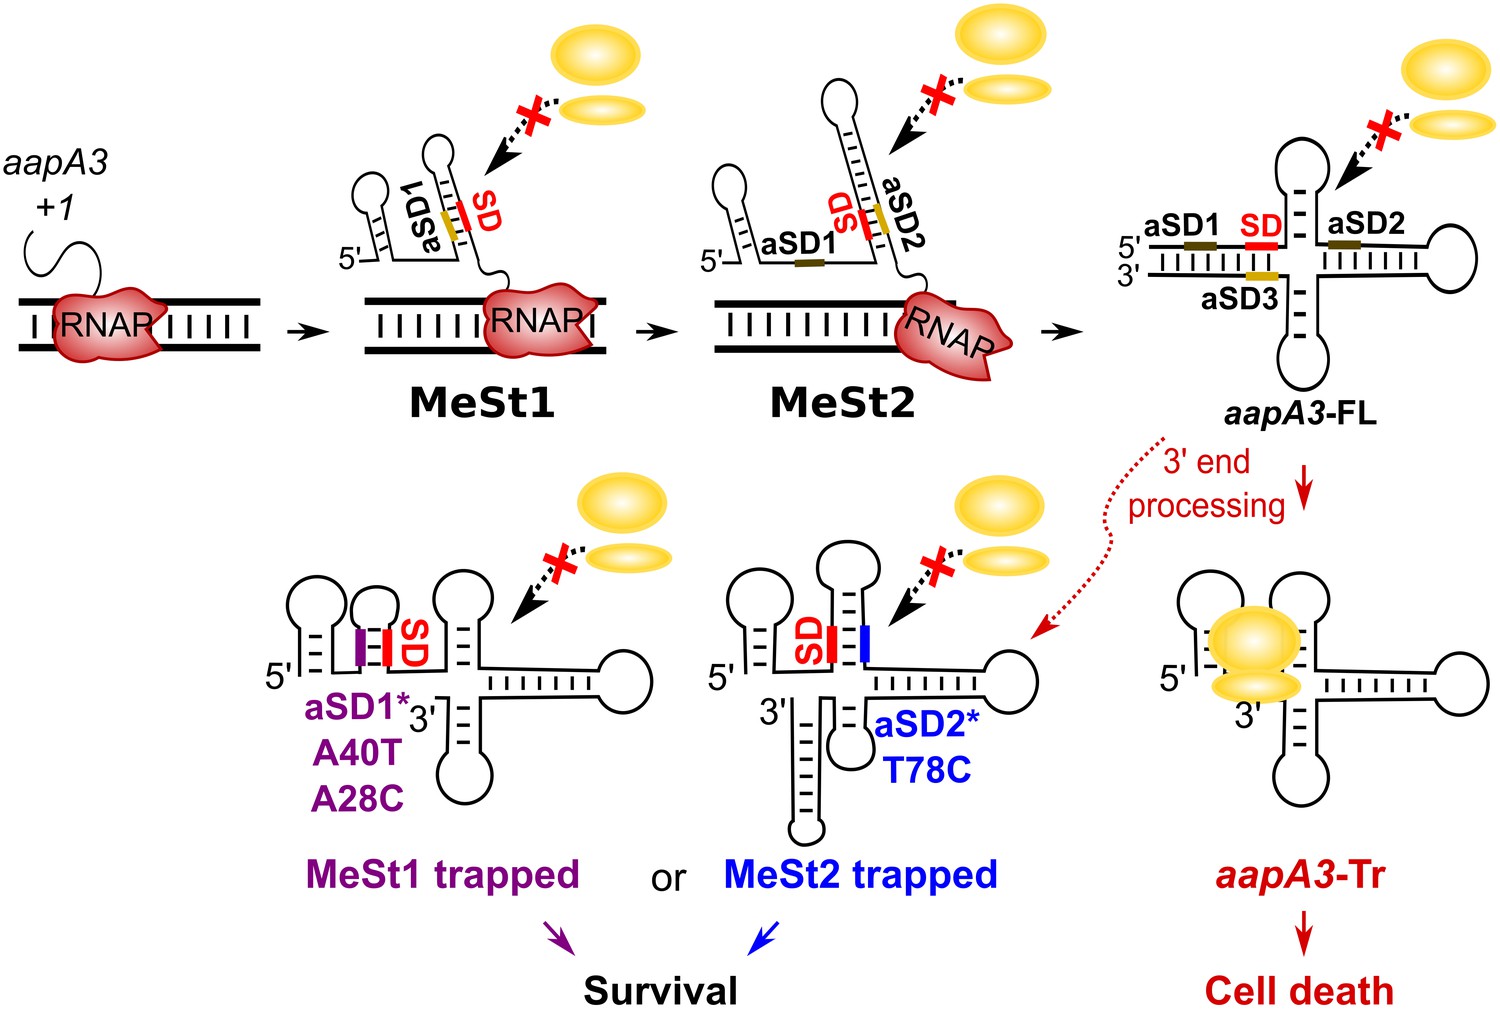
Working model of the aapA3 co- and post-transcriptional regulation.
Co-transcriptional folding of the aapA3 mRNA leads to the generation of two successive SD-sequestering hairpins, which constitute metastable structures (MeSt) temporarily impeding ribosome access during transcription. The RNA polymerase is shown in red. Upon transcription termination, the aapA3 full-length transcript (aapA3-FL) folds into a translationally inert conformation involving a 5’−3’-end long-distance interaction (LDI) in which the SD is sequestered by the aSD3 motif. A 3’-end nucleolytic truncation leads to the formation of aapA3-Tr, which is translationally active. In absence of IsoA3, its translation leads to cell death. We showed that the suppressor mutations A40T, A28C (purple) and T78C (blue) stabilize the metastable hairpins in the truncated isoform (involving the aSD1 and aSD2 sequences, respectively), leading to inhibition of aapA3-Tr translation. The suppressor strains can thus survive even in absence of IsoA3. The two successive MeSt structures act as thermodynamic traps to freeze the mRNA into translationally inert conformations.
Figure 7—figure supplement 1
Only three out of the 13 potential aSD sequences embedded in aapA3 mRNA are functional.
2D structure predictions were generated with the RNAfold Web Server (Gruber et al., 2008) with no additional constrains and VARNA (Darty et al., 2009) was used to perform the drawing. Potential, but not used, anti-Shine-Dalgarno (aSD) sequences (UC-rich motifs) are highlighted in red. The three functional aSD sequences (aSD1, aSD2, aSD3) are shown in gold. Shine-Dalgarno (SD) sequence is shown in turquoise. Translation start and stop codons are shown in green and red, respectively.
Figure 8 with 3 supplements
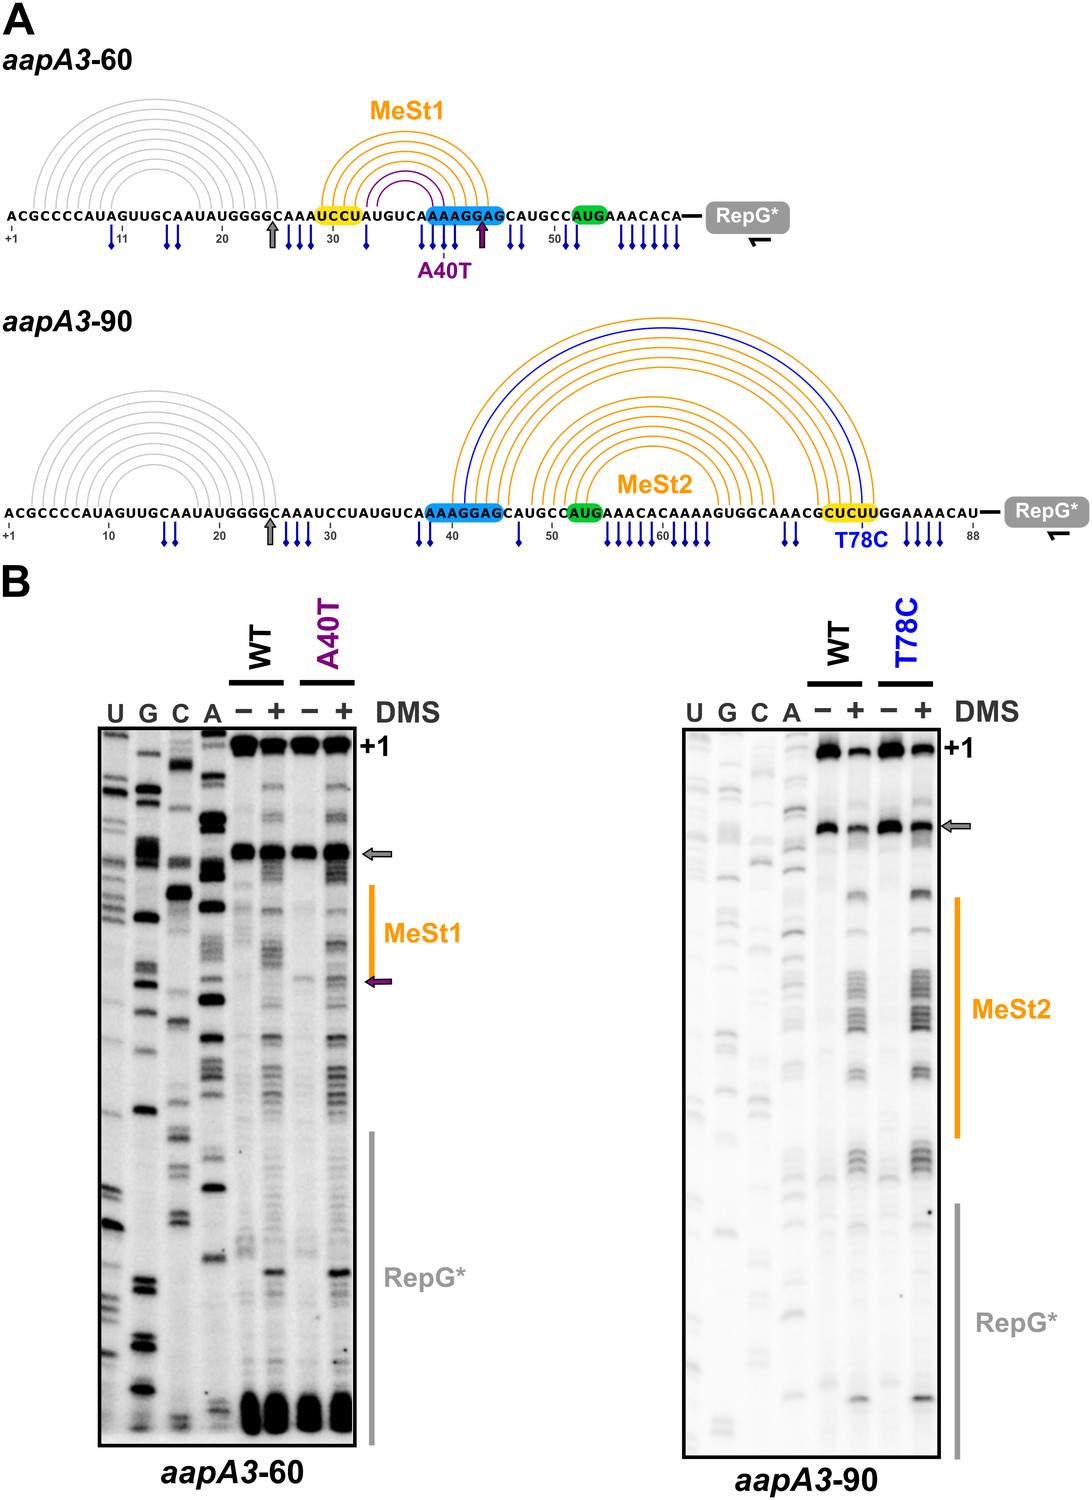
In vivo DMS footprinting confirms the existence of the MeSt1 and MeSt2 RNA hairpins.
(A) Linear representation of the secondary structure mapped in vivo through DMS modification of the aapA3-60 and aapA3-90 RNA nascent transcripts. The primary sequence of both transcripts is shown, as well as the predicted secondary structure represented by an arc diagram. The position of the point mutations A40T and T78C is shown in purple and blue, respectively. Each RNA intermediate was fused to the RepG non-coding RNA (Pernitzsch et al., 2014) to allow a precise transcription termination. The RepG sequence (gray box) was mutated (RepG*) to distinguish the chimeric transcript from the endogenous RepG RNA. The horizontal black arrow indicates the position of the oligonucleotide used for reverse extension. The SD and anti-SD sequences are highlighted in blue and yellow, respectively and the start codon is shown in green. The adenine and cytosine bases modified by DMS are indicated by a blue pin. The gray arrow indicates the Reverse Transcriptase (RT) stop observed for both transcripts due to the presence of the 5’ terminal (stable) stem-loop. Interestingly, another RT stop at nt 44 was observed with the aapA3-A40T mutant, confirming the stabilizing effect of the A40T mutation (purple arrow). (B) DMS-treated (+) and untreated (-) RNA samples were analyzed by primer extension. The reaction products were separated on a 6% PAA denaturing gel. Lanes A, C, G and U correspond to the sequencing ladder of the analyzed region. The arrows indicate the RT stops and the vertical orange lines indicate the position of the metastable hairpins. The RepG* region is shown by a vertical gray line. Note that methylated bases generate RT stops one nucleotide downstream the modified base.
Figure 8—figure supplement 1
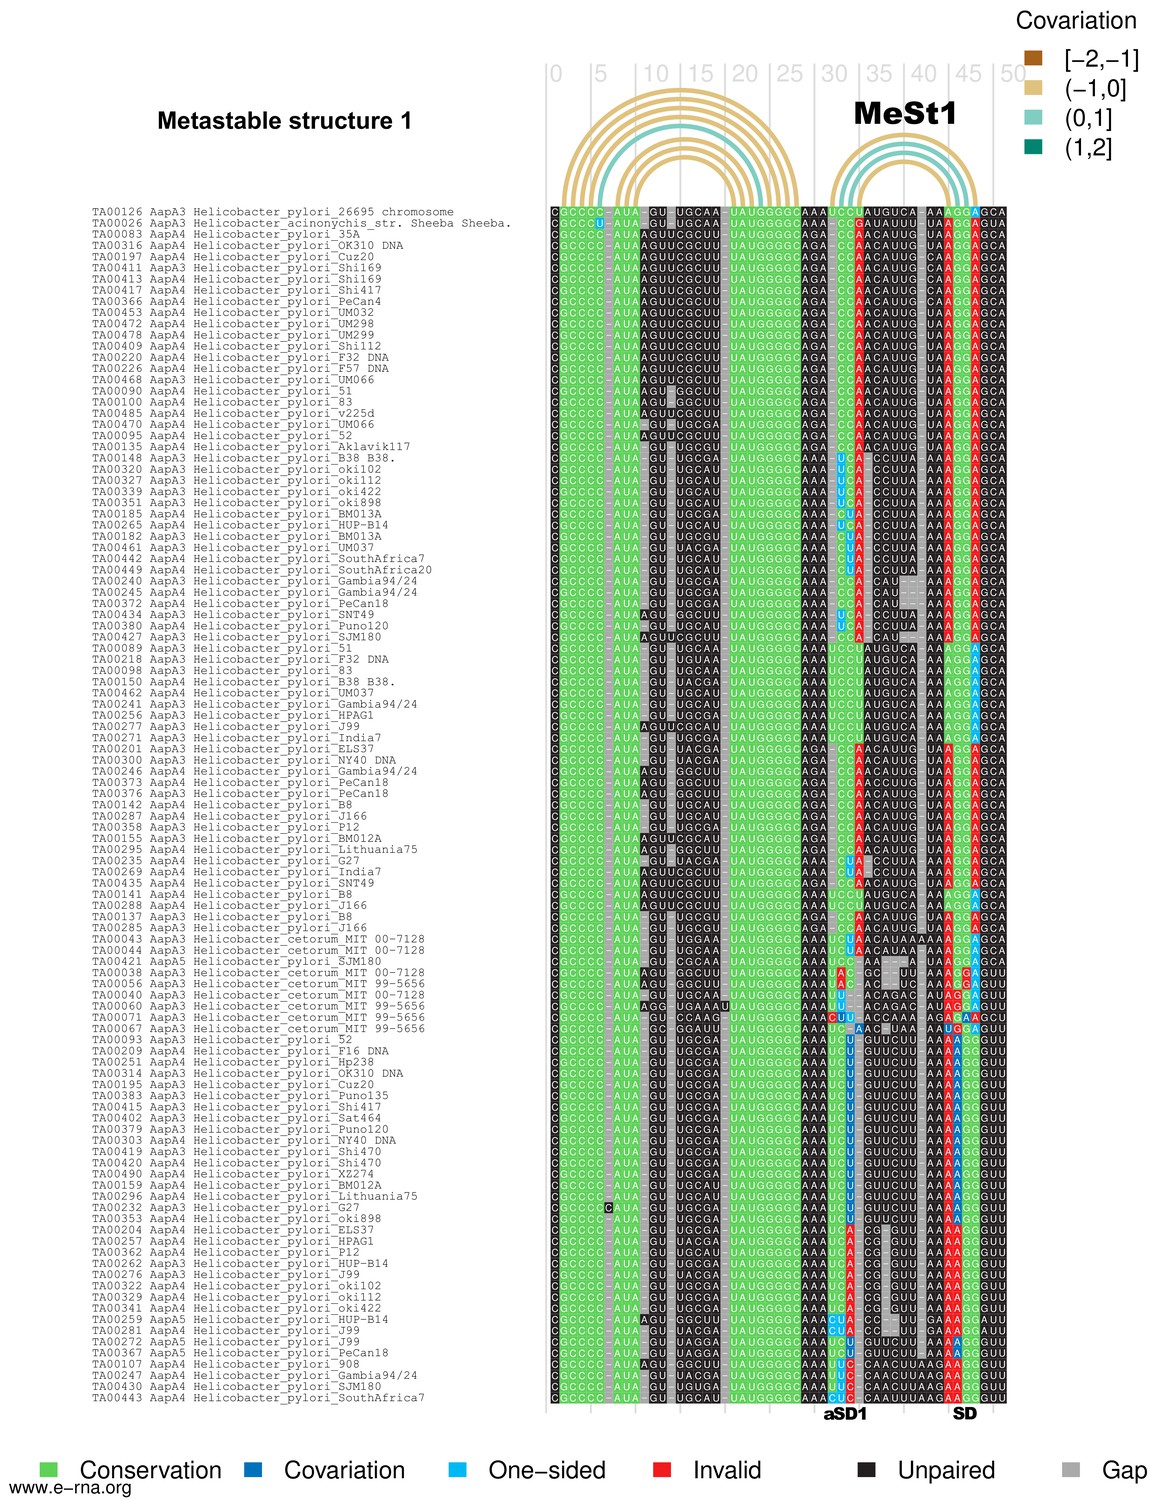
and Figure 8—figure supplement 2: Structural alignment and covariation analysis of aapA3 mRNA nascent transcript of 45 (1) and 80 nucleotides (2).
The metastable structures of the aapA3 mRNA are well supported by the observed nucleotide covariation. Structural alignments were carried out on a set of 107 aapA3 mRNA subsequences from 55 Helicobacter genomes available in the T1TAdb database (https://d-lab.arna.cnrs.fr/t1tadb). An alignment was computed for each of two sequence lengths corresponding to the nascent transcript extending up to the metastable structure 1 (MeSt1,~45 nt) or up to the metastable structure 2 (MeSt2,~80 nt). Alignments were computed using MAFFT (Katoh and Toh, 2008) and manually corrected. Using the secondary structures determined by in vivo DMS probing of two aapA3 mRNA subsequences as references (shown in Figure 8), covariation was revealed by means of R-chie ((Lai et al., 2012); https://e-rna.org). Base-paired nucleotides are linked by arcs colored according to the covariation score (which has a range of [−2, 2], where −2 is a complete lack of pairing potential and of sequence conservation, 0 is complete sequence conservation regardless of pairing potential, and 2 is a complete lack of sequence conservation but maintaining pairing). Nucleotides in the alignment are color-coded according to their base-pairing status: Conservation (green), nucleotide is paired and is the most frequent nucleotide at the given alignment position; Covariation (dark blue), base-pair is supported by compensatory mutations on both sides; One−sided (light blue), base-pair is supported by consistent mutations on one side; Invalid (red), invalid (or non-canonical) base-pair; Unpaired (black), nucleotide is unpaired; Gap (gray), alignment gap. SD, Shine-Dalgarno sequence; aSD1, 2, and 3: anti-Shine-Dalgarno sequence 1, 2, and 3, respectively.
Figure 8—figure supplement 2
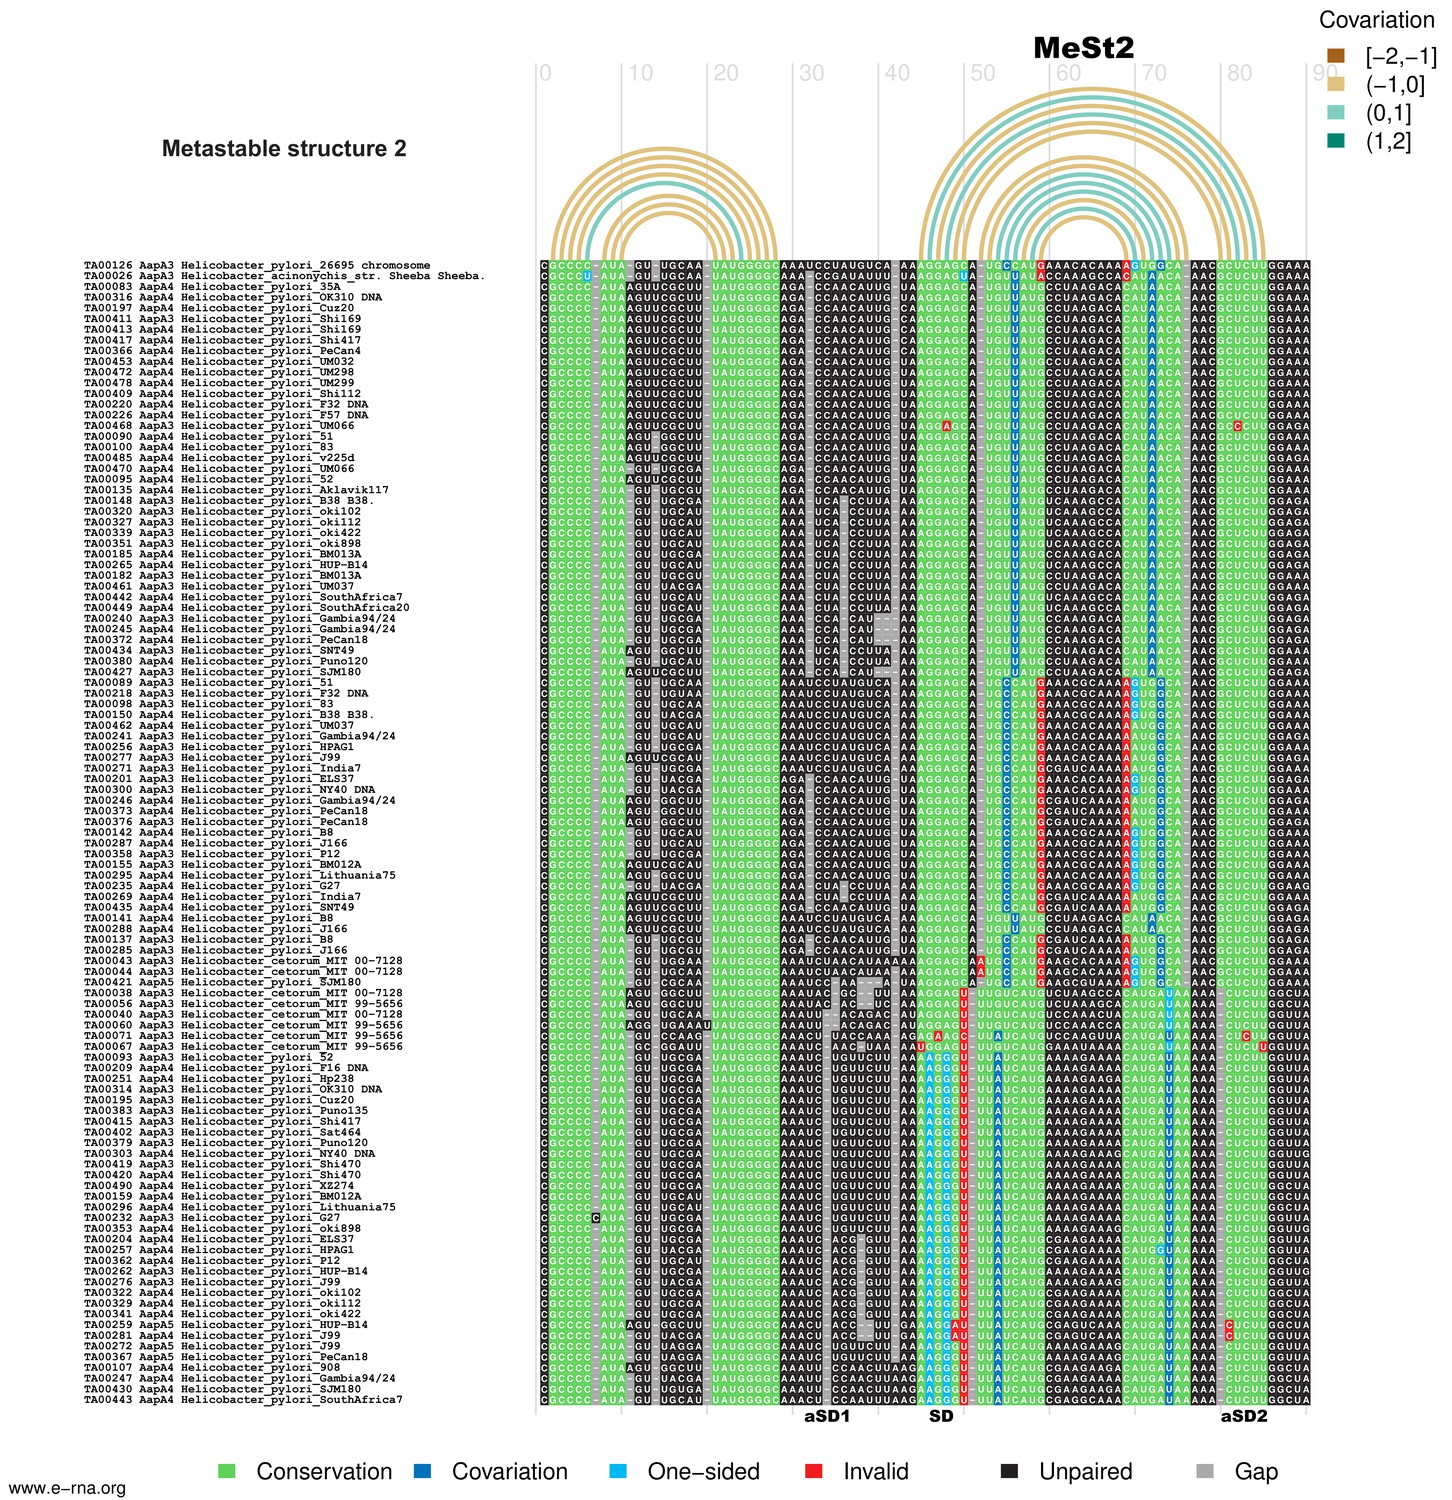
Structural alignment and covariation analysis ofaapA3mRNA nascent transcript of 80 nucleotides.
https://doi.org/10.7554/eLife.47549.030
Figure 8—figure supplement 3
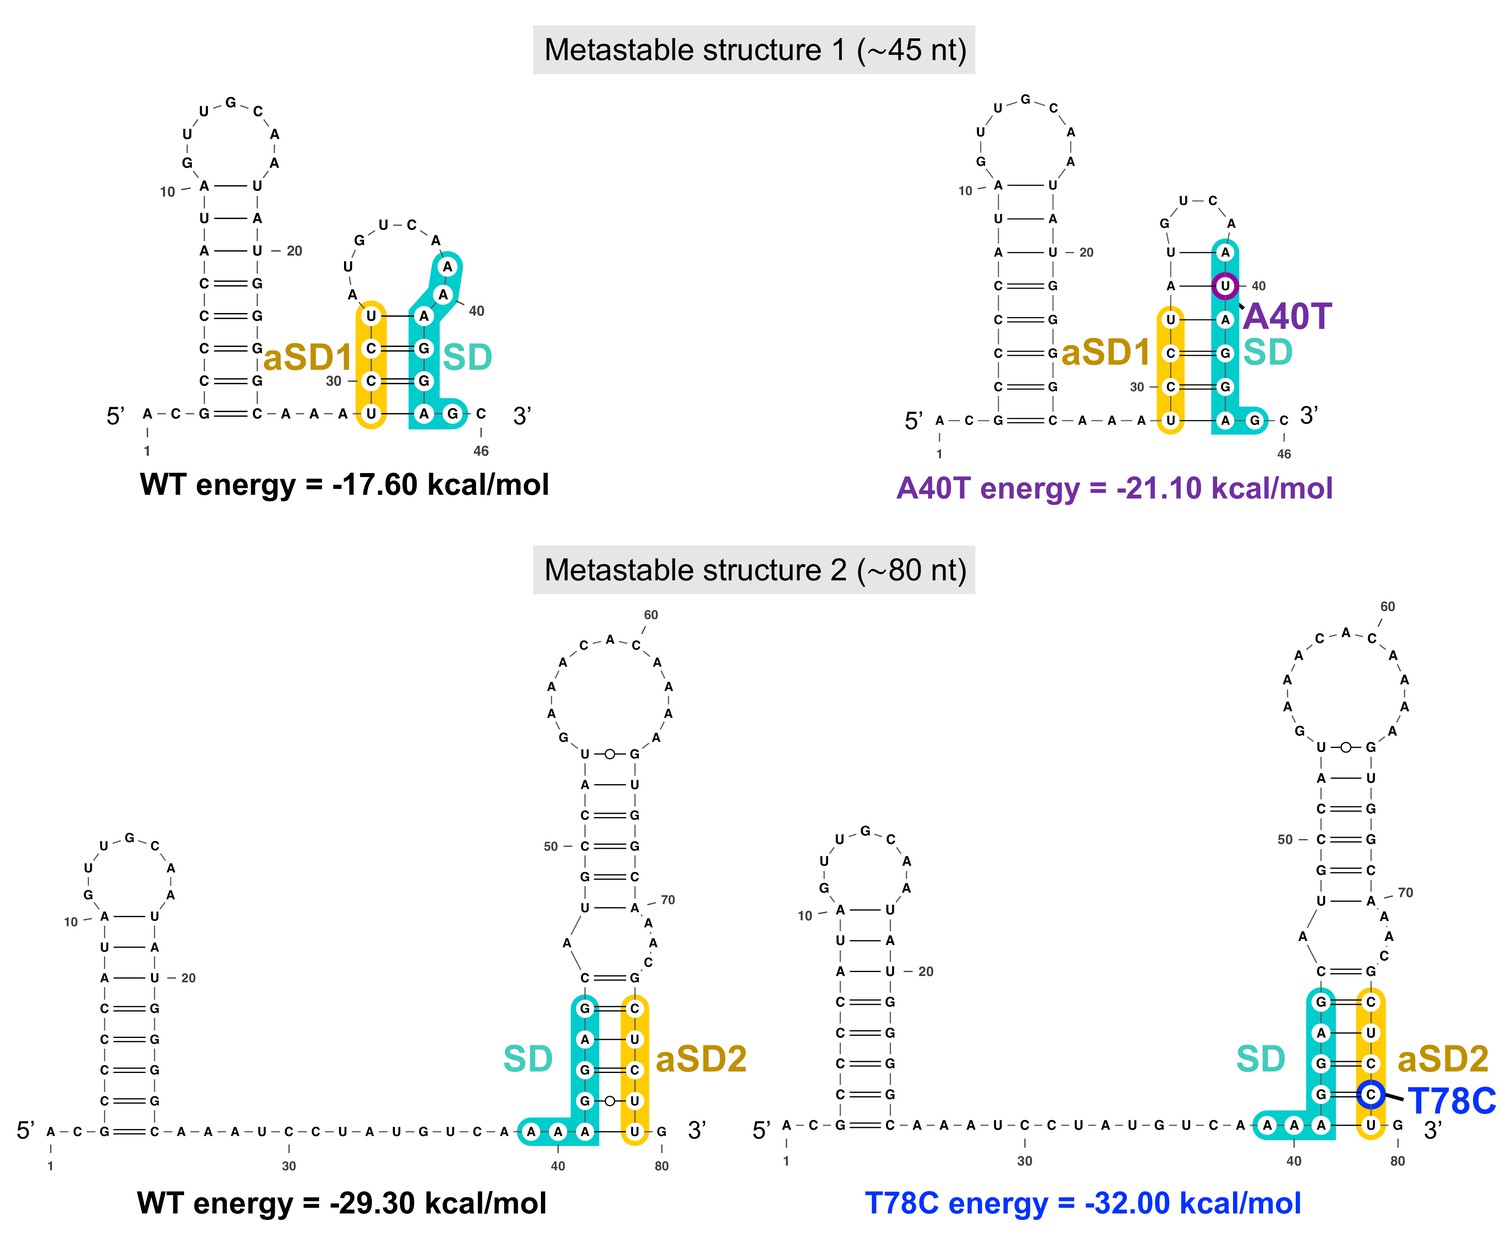
The two successive aapA3 mRNA metastable structures have increasing stability and are stabilized by the A40T and the T78C suppressor mutations.
The two metastable structures (1, ≈46-nt long, upper panel; and 2, ≈80-nt long, lower panel) successively formed during aapA3 mRNA transcription are shown. Shine-Dalgarno (SD) sequence is highlighted in turquoise, anti-SD (aSD) sequences (aSD1 and aSD2) are highlighted in yellow, the suppressor mutation stabilizing SD sequestration by aSD1 in the metastable structure 1 is highlighted in purple (A40T), the suppressor stabilizing the SD sequestration by aSD2 in the metastable structure 2 is highlighted in blue (T78C). RNAfold (Gruber et al., 2008) was used for secondary structure and minimum free energy predictions, and VARNA (Darty et al., 2009) for drawing.
Tables
Key resources table
| Reagent type (species) or resources | Designation | Source or reference | Identifiers | Additional information |
|---|---|---|---|---|
| Chemical compound, drug | DreamTaq DNA Polymerase | ThermoFischer Scientific | Cat#EP1701 | |
| Chemical compound, drug | Phusion High-Fidelity DNA Polymerase | ThermoFischer Scientific | Cat#F530S | |
| Chemical compound, drug | PfuUltra High-Fidelity DNA Polymerase | Agilent | Cat#600380 | |
| Chemical compound, drug | Alkaline Phosphatase, Calf Intestinal (CIP) | New England Biolabs | Cat#M0290S | |
| Chemical compound, drug | T4 Polynucleotide Kinase | New England Biolabs | Cat#M0201S | |
| Chemical compound, drug | RNase T1 | New England Biolabs | Cat#AM2283 | |
| Chemical compound, drug | E. coli RNase H1 | New England Biolabs | Cat#AM2293 | |
| Chemical compound, drug | RNasin Ribonuclease Inhibitors | Promega | Cat#N2511 | |
| Commercial assay or kit | pGEM-T Easy Vector System | Promega | Cat#A1360 | |
| Commercial assay or kit | MEGAScript T7 Kit | ThermoFischer Scientific | Cat#AM1334 | |
| Commercial assay or kit | MAXIScript T7 Transciption Kit | ThermoFischer Scientific | Cat#AM1213 | |
| Commercial assay or kit | High Purity Plasmid Miniprp Kit | Neo Biotech | Cat#NB-03–0002 | |
| Commercial assay or kit | Quick Bacteria Genomic DNA extraction Kit | Neo Biotech | Cat#NB-03–0020 | |
| Commercial assay or kit | E. coli 30S Extract System for Linear Templates Kit | Promega | Cat#L1030 | |
| Commercial assay or kit | One Shot TOP10 chemically competent cells | ThermoFischer Scientific | Cat#C404010 | |
| Recombinant DNA reagent | Plasmids | This paper | N/A | See Table 3 for the full list of plasmids used in this study |
| Sequence-based reagent | Oligonucleotides | This paper | N/A | See Table 1 for the full list of oligonucleotides used in this study |
| Strain, strain background | E. coli strains | This paper | N/A | See Table 4 for the full list of E. coli strains used in this study |
| Strain, strain background | H. pylori strains | This paper | N/A | See Table 2 for the full list of H. pylori strains used in this study |
| Software, algorithm | Cutadapt 1.1 | DOI:10.14806/ej.17.1.200 | https://cutadapt.readthedocs.org/ | |
| Software, algorithm | cmpfastq | NIHR Biomedical Research Centre for Mental Health | http://compbio.brc.iop.kcl.ac.uk/software/cmpfastq.php | |
| Software, algorithm | Prinseq-lite 0.20.4 | (Schmieder and Edwards, 2011) | http://prinseq.sourceforge.net/ | |
| Software, algorithm | PANDAseq 2.9 | (Masella et al., 2012) | https://github.com/neufeld/pandaseq | |
| Software, algorithm | BWA-SW algorithm of BWA 0.7.12 | (Li and Durbin, 2009) | https://sourceforge.net/projects/bio-bwa/ | |
| Software, algorithm | Samtools 1.2 | (Li et al., 2009) | https://sourceforge.net/projects/samtools/ | |
| Software, algorithm | Bamtools 2.3.0 | (Barnett et al., 2011) | https://github.com/pezmaster31/bamtools | |
| Software, algorithm | R 3.2.0 | (R Core Team 2015) | http://www.R-project.org/ | |
| Software, algorithm | Differential analyses and Hierarchical tree clustering: Trinity 2.2.0 | (Haas et al., 2013) | http://trinityrnaseq.github.io | |
| Software, algorithm | Differential analyses: DEseq2 1.10.1 | (Love et al., 2014) | http://www.bioconductor.org/packages/release/bioc/html/DESeq2.html | |
| Software, algorithm | MAFFT 7.407 | (Katoh and Toh, 2008) | https://mafft.cbrc.jp/alignment/software/source.html | |
| Software, algorithm | MXSCARNA 2.0 | (Tabei et al., 2008) | https://www.ncrna.org/softwares/mxscarna/ | |
| Software, algorithm | R-chie | (Lai et al., 2012) | https://www.e-rna.org/r-chie/ | |
| Other | T1TA database | (Tourasse et al, in preparation) | https://d-lab.arna.cnrs.fr/t1tadb | |
| Other | Project and study description | This paper | NCBI BioProject PRJNA497299 | Deposited data |
| Other | Deep-sequencing datasets raw data | This paper | NCBI SRA SRP166021 | Deposited data |
| Other | Single-nucleotidesubstitutions, number of counts | This paper | NCBI GEO GSE121423 | Deposited data |
| Other | Single-nucleotide substitutions, statistical analysis by sequence | This paper | NCBI GEO GSE121423 | Deposited data |
| Other | Single-nucleotide substitutions, statistical analysis by position | This paper | NCBI GEO GSE121423 | Deposited data |
| Other | Single-nucleotide deletions, statistical analysis by position | This paper | NCBI GEO GSE121423 | Deposited data |
| Other | Single-nucleotide insertions, statistical analysis by position | This paper | NCBI GEO GSE121423 | Deposited data |
Table 1
Oligonucleotides used in this work.
https://doi.org/10.7554/eLife.47549.020| Name | Sequence (5’→3’ direction) | Used for |
|---|---|---|
| FD11 | GAAATTAATACGACTCACTATAGCAAGAGCGTTTGCCACTT | Reverse primers carrying a T7 promoter for IsoA3 amplification for in vitro transcription |
| FD17 | ACGCCCCATAGTTGCAATAT | Forward primer for IsoA3 amplification for in vitro transcription |
| FD35 | TCGGAATGGTTAACTGGGTAGTTCCT | Reverse primer for 5S rRNA mRNA detection by Northern Blot |
| FD38 | GCTCCTTTTGACATAGGATT | Reverse primer for aapA3 mRNA detection by Northern Blot |
| FA110 | TGCTTTATAACTATGGATTAAAC | Forward primer for rpsL-erm cassette amplification from pSP60 |
| FA111 | TTACTTATTAAATAATTTATAGC | Revese primer for rpsL-erm cassette amplification from pSP60 |
| FA170 | GAAATTAATACGACTCACTATAGGACGCCCCATAGTTGCAATAT | Forward primer carrying a T7 promoter for aapA3 in vitro transcription |
| FA173 | AGGAAACCCCTAAGCTTAAAAGC | Reverse primer for aapA3-Tr amplification |
| FA175 | GACCAACGCCCCAAAAGTC | Reverse primer for aapA3 full-length amplification |
| FA281 | AGCATGCCATTAAACACAAA | Forward primer for mutagenesis of aapA3 26695 start codon (G54A) |
| FA282 | TTTGTGTTTAATGGCATGCT | Reverse primer for mutagenesis of aapA3 26695 start codon (G54A) |
| FA283 | TGGAAAACCTTGTACTTTGAGT | Forward primer for mutagenesis of IsoA3 −10 box: mutations A87C/A90G |
| FA284 | ACTCAAAGTACAAGGTTTTCCA | Reverse primer for mutagenesis of IsoA3 −10 box: mutations A87C/A90G |
| FA386 | CCAAGAGCGTTTGCCACTTTTG | Reverse primer for aapA3/IsoA3 locus split cloning in pGEMT (upstream fragment) |
| FA387 | CACAAAAGTGGCAAACGCTC | Forward primer for aapA3/IsoA3 locus split cloning in pGEMT (downstream fragment) |
| FA395 | CTTTCCCTACACGACGCTCTTCCGATCTCTATCCAATAAAGATAAGC | Forward primer for aapA3 26695 amplification for Illumina paired-end sequencing |
| FA396 | GGAGTTCAGACGTGTGCTCTTCCGATCTGCACTCTATGAGGGGATTTAG | Reverse primer for aapA3 26695 amplification for Illumina paired-end sequencing |
| FA406 | GCATTATAAAATGAAATCC | Forward primer for the amplification of aapA3 26695 fragment Up from hpn-like |
| FA407 | GTTTAATCCATAGTTATAAAGCACAAAAAGAGGGATTTTAAAAG | Reverse primer for the amplification of aapA3 26695 Up fragment to generate the aapA3/IsoA3 locus deletion designed for deep-seq |
| FA408 | GCTATAAATTATTTAATAAGTAACCGCTTGCTCTAGCTTTTTG | Forward for the amplification of aapA3 26695 Down fragment to generate the aapA3/IsoA3 locus deletion designed for deep-seq |
| FA409 | CTAGCCACGCTCTATTAGAG | Reverse for the amplification of aapA3 26695 Down fragment to generate the aapA3/IsoA3 locus deletion designed for deep-seq |
| FA465 | CAATATGGGGCAAcTCCTATGTC | Forward primer for the introduction of the suppressor A28C |
| FA466 | GACATAGGAgTTGCCCCATATTG | Reverse primer for the introduction of the suppressor A28C |
| FA467 | CCTATGTCAAtAGGAGCATG | Forward primer for the introduction of the suppressor A40T |
| FA468 | CATGCTCCTaTTGACATAGG | Reverse primer for the introduction of the suppressor A40T |
| FA511 | CAAAAGTGGCAAACGCTCcTGGAAAACcTTgTACTTTGAGTTTG | Forward primer for the introduction of the suppressor T78C |
| FA512 | GTTTTCCAgGAGCGTTTGCCACTTTTG | Reverse primer for the introduction of the suppressor T78C |
| FA535 | CCTATGTCAAAAGaAGCATGCCATGAAACAC | Forward primer for the introduction of the SD mutation G43A |
| FA536 | GTGTTTCATGGCATGCTtCTTTTGACATAGG | Reverse primer for the introduction of the SD mutation G43A |
| FA546 | GTTGCAATATGGGGCAAATCCTtTGTCAAAAGGAGCATGCC | Forward primer for the introduction of A33T mutation (complementation of A40T suppressor) |
| FA547 | GGCATGCTCCTTTTGACAaAGGATTTGCCCCATATTGCAAC | Reverse primer for the introduction of A33T mutation (complementation of A40T suppressor) |
| FA548 | GTTGCAATATGGGGCAAATCCTtTGTCAAtAGGAGCATGCC | Forward primer for the introduction of A33T mutation in aapA3 A40T mutant background |
| FA549 | GGCATGCTCCTaTTGACAaAGGATTTGCCCCATATTGCAAC | Reverse primer for the introduction of A33T mutation in aapA3 A40T mutant background |
| FA633 | CATGGCATGCTCCTTT | RNaseH/oligonucleotide accessibility assay on WT-FL, WT-Tr and T78C-Tr aapA3 mRNAs |
| FA644 | CATAGGATTTGCCCCA | RNaseH/oligonucleotide accessibility assay on A40T-Tr aapA3 mRNA |
| FA651 | CAAAGGATTTGCCCCA | RNaseH/oligonucleotide accessibility assay on A33T/A40T-Tr aapA3 mRNA |
| FA652 | CATAGGAGTTGCCCCA | RNaseH/oligonucleotide accessibility assay on A28C-Tr aapA3 mRNA |
| FA786 | CCATAAGGAATGGTTGGACGTGTTTCATGGCATGCTCCTTTTG | Reverse primer to fuse repG*(sequence in italics) downstream nt 1–60 of aapA3. |
| FA787 | CCATAAGGAATGGTTGGACGTGTTTCATGGCATGCTCCTaTTG | Reverse primer to fuse repG*(sequence in italics) downstream nt 1–60 of the A40T mutated aapA3 |
| FA789 | CCATAAGGAATGGTTGGACTAATGTTTTCCAAGAGCGTTTG | Reverse primer to fuse repG*(sequence in italics) downstream nt 1–90 of aapA3. |
| FA790 | CCATAAGGAATGGTTGGACTAATGTTTTCCAgGAGCGTTTG | Reverse primer to fuse repG*(sequence in italics) downstream nt 1–90 of the T78C mutated aapA3 |
| FA791 | CTTGGCGGTTGTTGTTTTTTCCGCTTGCTCTAGCTTTTTG | Forward primer containing the 3’ end of RepG* (sequence in italics) to amplify aapA3 Down fragment |
| FA794 | GTCCAACCATTCCTTATGG | Forward primer to amplify RepGstar# |
| FA795 | AAAAAACAACAACCGCCAAG | Reverse primer to amplify RepGstar# |
-
*Nucleotide positions are indicated relative to the AapA3 transcriptional start site (TSS, +1).
**Sequences highlighted in bold correspond to rpsL-erm 5’-overhang tails used for assembly PCR during the construction of the aapA3/IsoA3 deleted strain.
-
***Underlined sequences correspond to the DNA adaptors used for Illumina paired-end sequencing approach.
****Nucleotides in lowercase correspond to mutations introduced by site-directed mutagenesis PCR.
-
#the sequence of RepGstar used in this study was (underlined nucleotides are indicating the mutations introduced to distinguish RepG from the endogenous copy; Pernitzsch et al., 2014): GTCCAACCATTCCTTATGGTTTGGTTGGAACCGCTTAAGATTGAAGGGTCAACTACCACTCCTTTCCCTTTGTCTTGGCGGTTGTTGTTTTTTGGATCC
Table 2
Helicobacter pylori strains used in this work.
https://doi.org/10.7554/eLife.47549.031| Name | Strain number | Description | Plasmid | Resistance | Reference |
|---|---|---|---|---|---|
| 26695 | JR34 (H5) | Wild type 26695 strain, Institut Pasteur collection, CIP106780 | none | - | (Tomb et al., 1997) |
| 26695 rpsLK43R | H158 | rpsL gene mutated on the Lys at position 43 to Arg (K43R) | none | StrR | This study |
| 26695 ΔaapA3/IsoA3 | H204 | ΔaapA3/IsoA3::rpsLCj-erm/rpsLK43R | none | ErmR | This study |
| 26695 Complemented aapA3/IsoA3 | H170 | ΔaapA3/IsoA3 + aapA3/IsoA3 (CA3) | none | StrR | This study |
| 26695 aapA3 start | H171 | aapA3 start codon mutated to ATT by the single point mutation G54T | none | StrR | This study |
| 26695 aapA3 ΔT109 | H172 | aapA3 carrying a −1 frameshift mutation (deletion of T at position 109) generating a 23 amino acids-long peptide | none | StrR | This study |
| 26695 aapA3 start/pIsoA3* | H173 | aapA3 G54T and IsoA3 promoter inactivated by the double point mutation A87C/A90G | none | StrR | This study |
| 26695 aapA3 G43A/pIsoA3* | H247 | aapA3 SD inactivated by the G43A mutation and IsoA3 promoter A87C/A90G | none | StrR | This study |
| 26695 aapA3 T107C/pIsoA3* | H278 | aapA3 ORF suppressor T107C (Phe 19 Ser) and IsoA3 promoter A87C/A90G | none | StrR | This study |
| 26695 aapA3 A28C/pIsoA3* | H224 | aapA3 A28C suppressor mutation and IsoA3 promoter A87C/A90G | none | StrR | This study |
| 26695 aapA3 A40T/pIsoA3* | H225 | aapA3 A40T and IsoA3 promoter A87C/A90G | none | StrR | This study |
| 26695 aapA3 A33T/A40 T/G54T/ pIsoA3* | H257 | aapA3 A40T/A33T/G54T and IsoA3 promoter A87C/A90G | none | StrR | This study |
| 26695 aapA3 T78C/pIsoA3* | H240 | aapA3 T78C and IsoA3 promoter A87C/A90G | none | StrR | This study |
| 26695 aapA3 T78C | H226 | aapA3 T78C with wild-type IsoA3 expression | none | StrR | This study |
| 26695 aapA3-60_WT | H321 | Nt 1–60 of aapA3 fused to repG* | none | StrR | This study |
| 26695 aapA3-60_A40T | H322 | Nt 1–60 of aapA3 carrying the A40T mutation fused to repG* | none | StrR | This study |
| 26695 aapA3-90_WT | H324 | Nt 1–90 of aapA3 fused to repG* | none | StrR | This study |
| 26695 aapA3-90_T78C | H325 | Nt 1–90 of aapA3 carrying the T78C mutation fused to repG* | none | StrR | This study |
-
*Nucleotide positions are indicated relative to the AapA3 transcriptional start site (TSS, +1).
Table 3
Plasmids used in this work.
https://doi.org/10.7554/eLife.47549.032| Name | Description | Origin/ Marker | Reference |
|---|---|---|---|
| pSP60 −2 | pSP60 carrying the counter selection cassette rpsL-erm | pSC101*/ AmpR | (Dailidiene et al., 2006; Pernitzsch et al., 2014) |
| pA3-Up WT | pGEM-T carrying the upstream fragment of the aapA3/IsoA3 locus amplified with the FA406/FA386 primer pair | ColE1/ AmpR | This study |
| pA3-Down WT | pGEM-T carrying the downstream fragment of the aapA3/IsoA3 locus amplified with the FA409/FA387 primer pair | ColE1/ AmpR | This study |
| pA3-Down pIsoA3* | pGEM-T carrying the downstream fragment of the aapA3/IsoA3 locus containing IsoA3 −10 box inactivated (A87C/A90G) | ColE1/ AmpR | This study |
| pA3-Up start | pGEM-T carrying the upstream fragment of the aapA3/IsoA3 locus containing the AapA3 start codon mutation G54T | ColE1/ AmpR | This study |
| pA3-Up A28C | pGEM-T carrying the upstream fragment of the aapA3/IsoA3 locus containing the suppressor A28C | ColE1/ AmpR | This study |
| pA3-Up A33T | pGEM-T carrying the upstream fragment of the aapA3/IsoA3 locus containing the A33T mutation | ColE1/ AmpR | This study |
| pA3-Up A40T | pGEM-T carrying the upstream fragment of the aapA3/IsoA3 locus containing the suppressor A40T | ColE1/ AmpR | This study |
| pA3-Up A40T/A33T | pGEM-T carrying the upstream fragment of the aapA3/IsoA3 locus containing the A40T and the compensatory mutation A33T | ColE1/ AmpR | This study |
| pA3-Up T78C | pGEM-T carrying the upstream fragment of the aapA3/IsoA3 locus containing the suppressor T78C | ColE1/ AmpR | This study |
| pA3-Down T78C | pGEM-T carrying the downstream fragment of the aapA3/IsoA3 locus containing the suppressor T78C | ColE1/ AmpR | This study |
| pA3-Down T78C/pIsoA3* | pGEM-T carrying the downstream fragment of the aapA3/IsoA3 locus containing the suppressor T78C and IsoA3 −10 box inactivated (A87C/A90G) | ColE1/ AmpR | This study |
| pA3-Up G43A | pGEM-T carrying the upstream fragment of the aapA3/IsoA3 locus containing the SD suppressor G43A | ColE1/ AmpR | This study |
-
*Nucleotide positions are indicated relative to the AapA3 transcriptional start site (TSS, +1).
Table 4
Escherichia coli strains used in this work.
https://doi.org/10.7554/eLife.47549.033| Name | Description/genotype | Plasmid | Resistance | Reference |
|---|---|---|---|---|
| TOP10 | mcrA ∆(mrr-hsdRMS-mcrBC) Φ80lacZ∆M15 ∆lacX74 deoR recA1 araD139 ∆(ara-leu)7697 galU galK rpsL endA1 nupG | none | none | Thermo Fisher Scientific, Invitrogen |
| A3-Up WT | TOP10 | pA3-Up WT | AmpR | This study |
| A3-Down WT | TOP10 | pA3-Do WT | AmpR | This study |
| A3-Down pIsoA3* | TOP10 | pA3-Do pIsoA3* | AmpR | This study |
| A3-Up start | TOP10 | pA3-Up start | AmpR | This study |
| A3-Up A28C | TOP10 | pA3-Up A28C | AmpR | This study |
| A3-Up A33T | TOP10 | pA3-Up A33T | AmpR | This study |
| A3-Up A40T | TOP10 | pA3-Up A40T | AmpR | This study |
| A3-Up A40T/A33T | TOP10 | pA3-Up A40T/A33T | AmpR | This study |
| A3-Up T78C | TOP10 | pA3-Up T78C | AmpR | This study |
| A3-Down T78C | TOP10 | pA3-Do T78C | AmpR | This study |
| A3-Down T78C/pIsoA3* | TOP10 | pA3-Do T78C/pIsoA3* | AmpR | This study |
| A3-Up G43A | TOP10 | pA3-Up G43A | AmpR | This study |
-
*Nucleotide positions are indicated relative to the AapA3 transcriptional start site (TSS, +1).
Additional files
-
Transparent reporting form
- https://doi.org/10.7554/eLife.47549.034
Download links
A two-part list of links to download the article, or parts of the article, in various formats.
Downloads (link to download the article as PDF)
Open citations (links to open the citations from this article in various online reference manager services)
Cite this article (links to download the citations from this article in formats compatible with various reference manager tools)
A genetic selection reveals functional metastable structures embedded in a toxin-encoding mRNA
eLife 8:e47549.
https://doi.org/10.7554/eLife.47549


