High-speed motility originates from cooperatively pushing and pulling flagella bundles in bilophotrichous bacteria
- Max Planck Institute of Colloids and Interfaces, Germany
- Institute for Advanced Studies in Basic Sciences, Islamic Republic of Iran
- University of Göttingen, Germany
- Aix-Marseille Université, CEA, CNRS, BIAM, F-13108, France
Figures
Figure 1 with 3 supplements
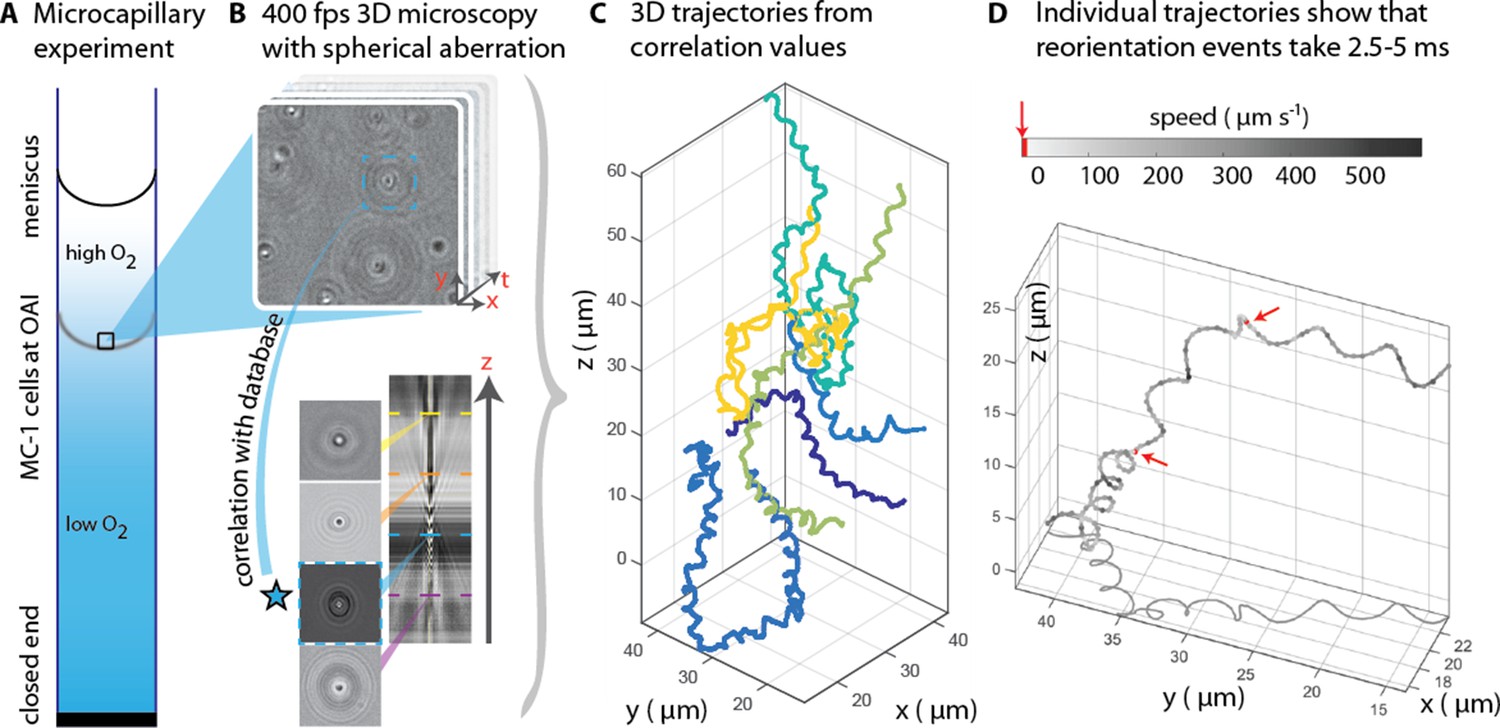
3D tracking in physiochemically controlled conditions.
(A) MC-1 cells were transitioned into agar-free medium, the solution was degassed to remove the oxygen and inserted into a microcapillary. Due to one open and one closed end, an oxygen gradient formed and the cells accumulated near their preferred microoxic conditions (the oxic-anoxic-interface, OAI). (B) The cells were observed near the band using 400 fps phase contrast video microscopy with a spherical aberration, which causes interference patterns around the spherical swimmers. These patterns can be correlated with patterns from silica beads of known height relative to the focal plane. (C) A tracking algorithm enables high-throughput 3D tracking of the microswimmers (Taute et al., 2015). Colors indicate different cells. (D) Individual tracks were analyzed and a clockwise helical travel path with a radius close to the cell diameter was found as well as instantaneous traveling speeds between 100 µm s−1 and 500 µm s−1. Tracks can be interrupted by rapid reorientation events that last only 2.5–5 ms. The helix parameters like pitch and period time do not change before and after an event, but apparently do so in the projected 2D tracks (see projected shadow in D).
Figure 1—figure supplement 1
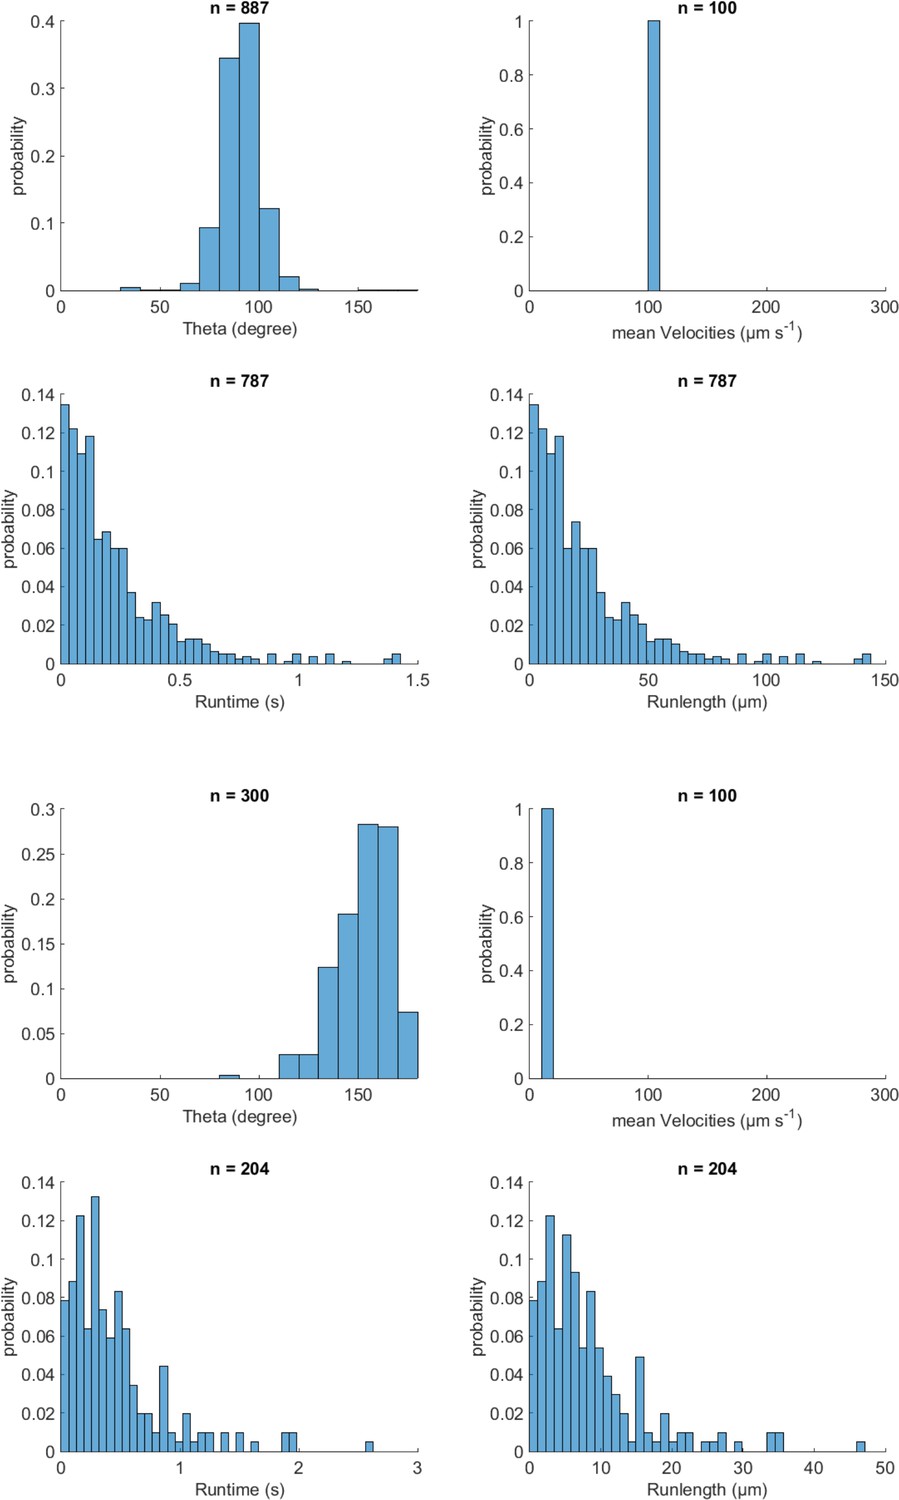
Validation of event identification algorithm for 3D tracking on simulated tracks with known parameters.
Top simulation parameters: Theta (reorientation angle) was 90 °, velocity was 100 µm/s, and runtime was 0.86 s. Bottom parameters: Theta was 170 °, velocity was 14 µm/s and runtime was 0.86 s. The mean time each reorientation lasted was 0.14 s for both cases.
Figure 1—figure supplement 2
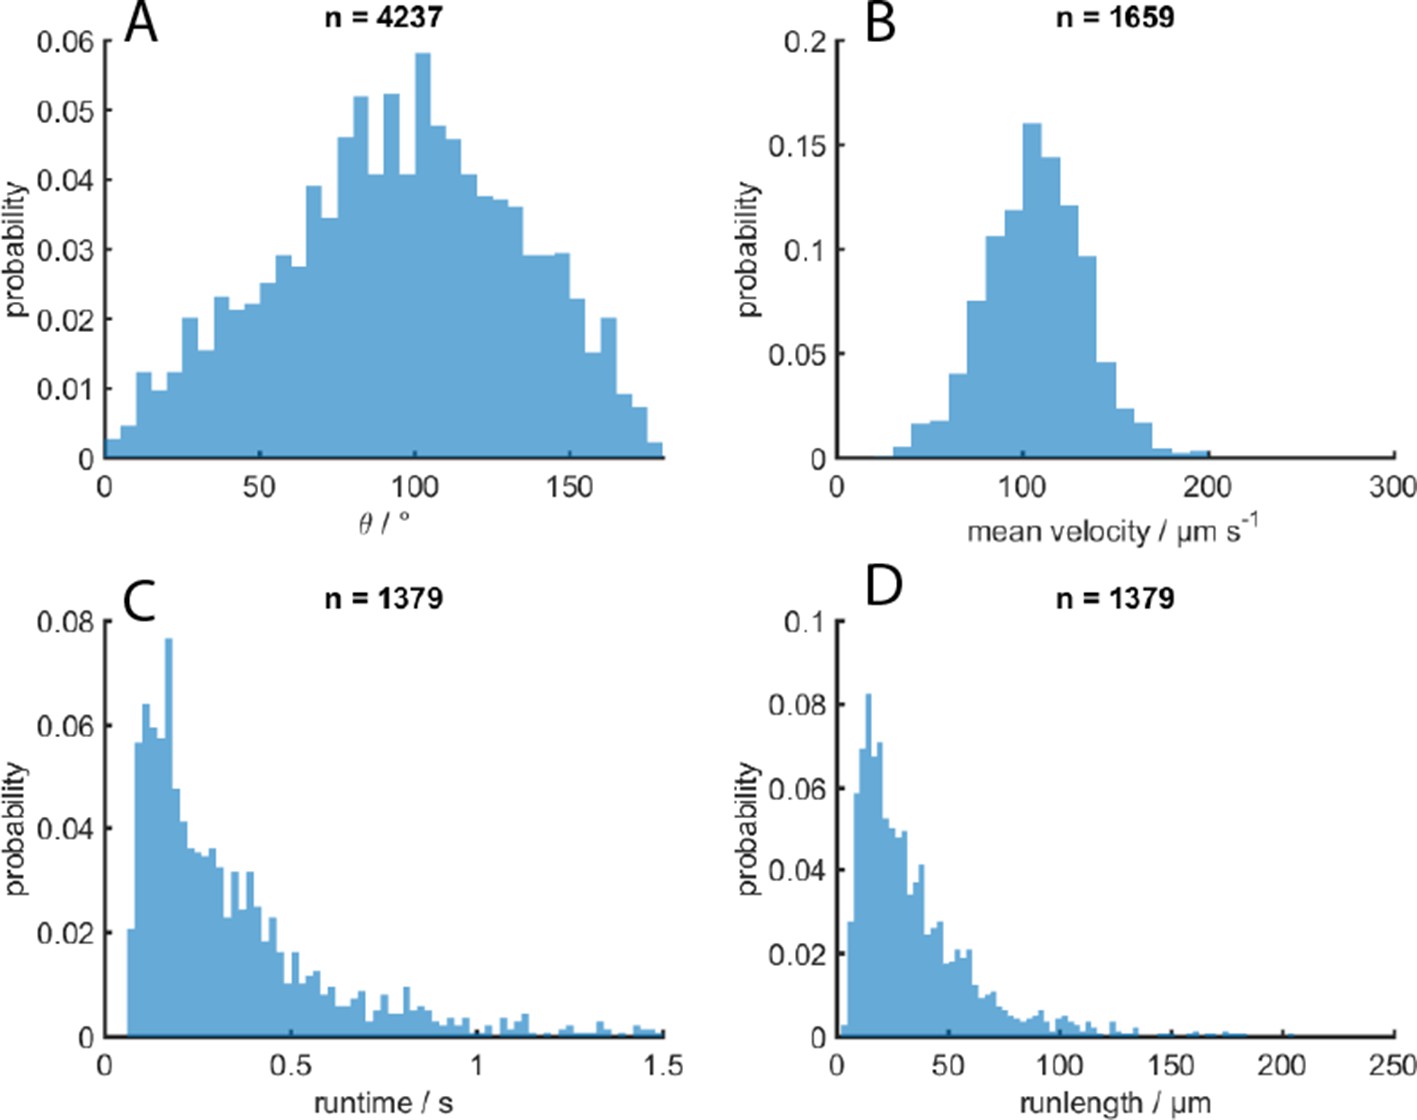
MC-1 swimming statistics.
(A) Turning angle θ after a reorientation event, (B) effective traveling speed, (C) runtimes and D) runlengths in-between events.
Figure 1—figure supplement 3
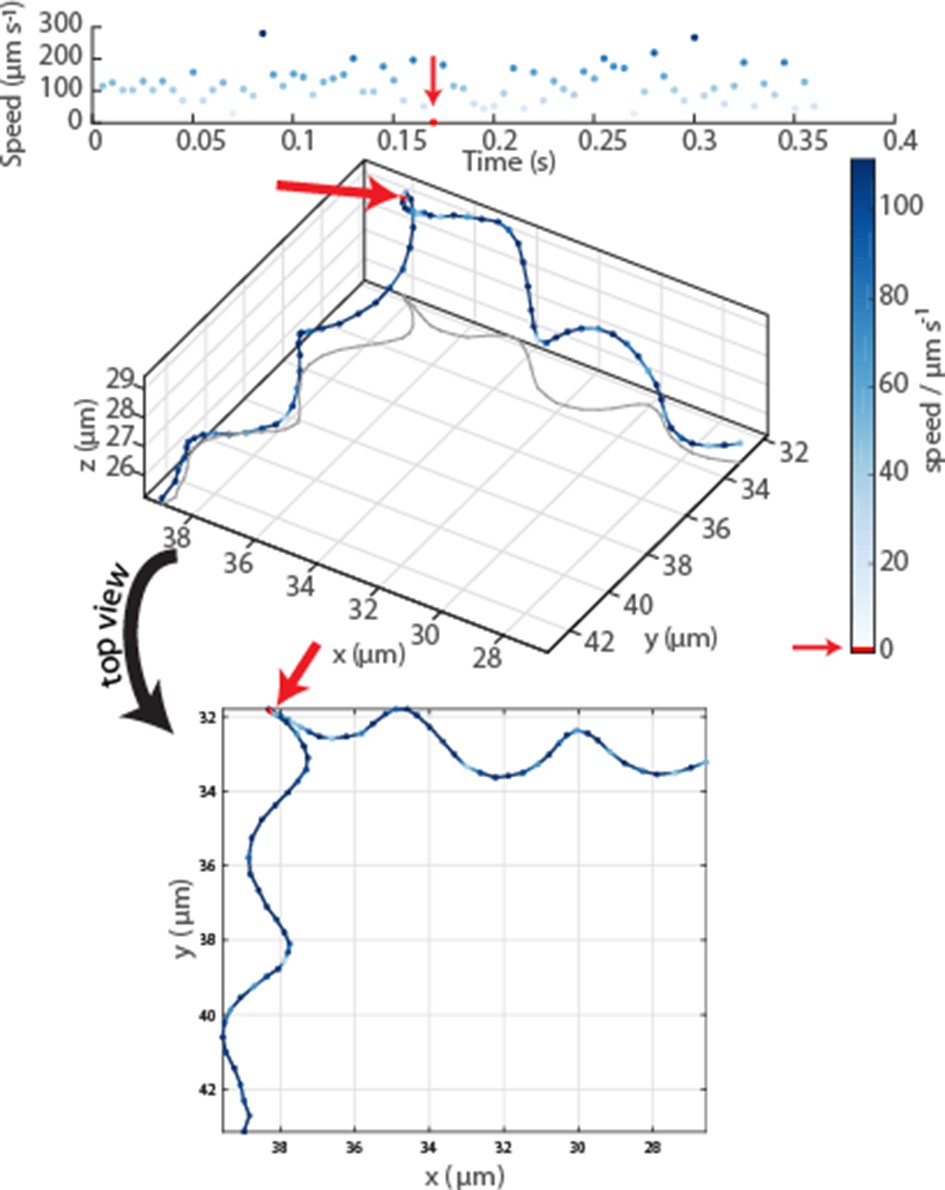
Oblique and top view of a typical event in an MC-1 swimming track.
The radius, pitch and period time of the helix remain constant before and after the event, which is identified as a drop in velocity to 0 and which lasted 3.75 ms ± 1.25 ms (error due to frame rate). While the top view indicates a change in helix parameters, the 3D view reveals no apparent changes.
Figure 2
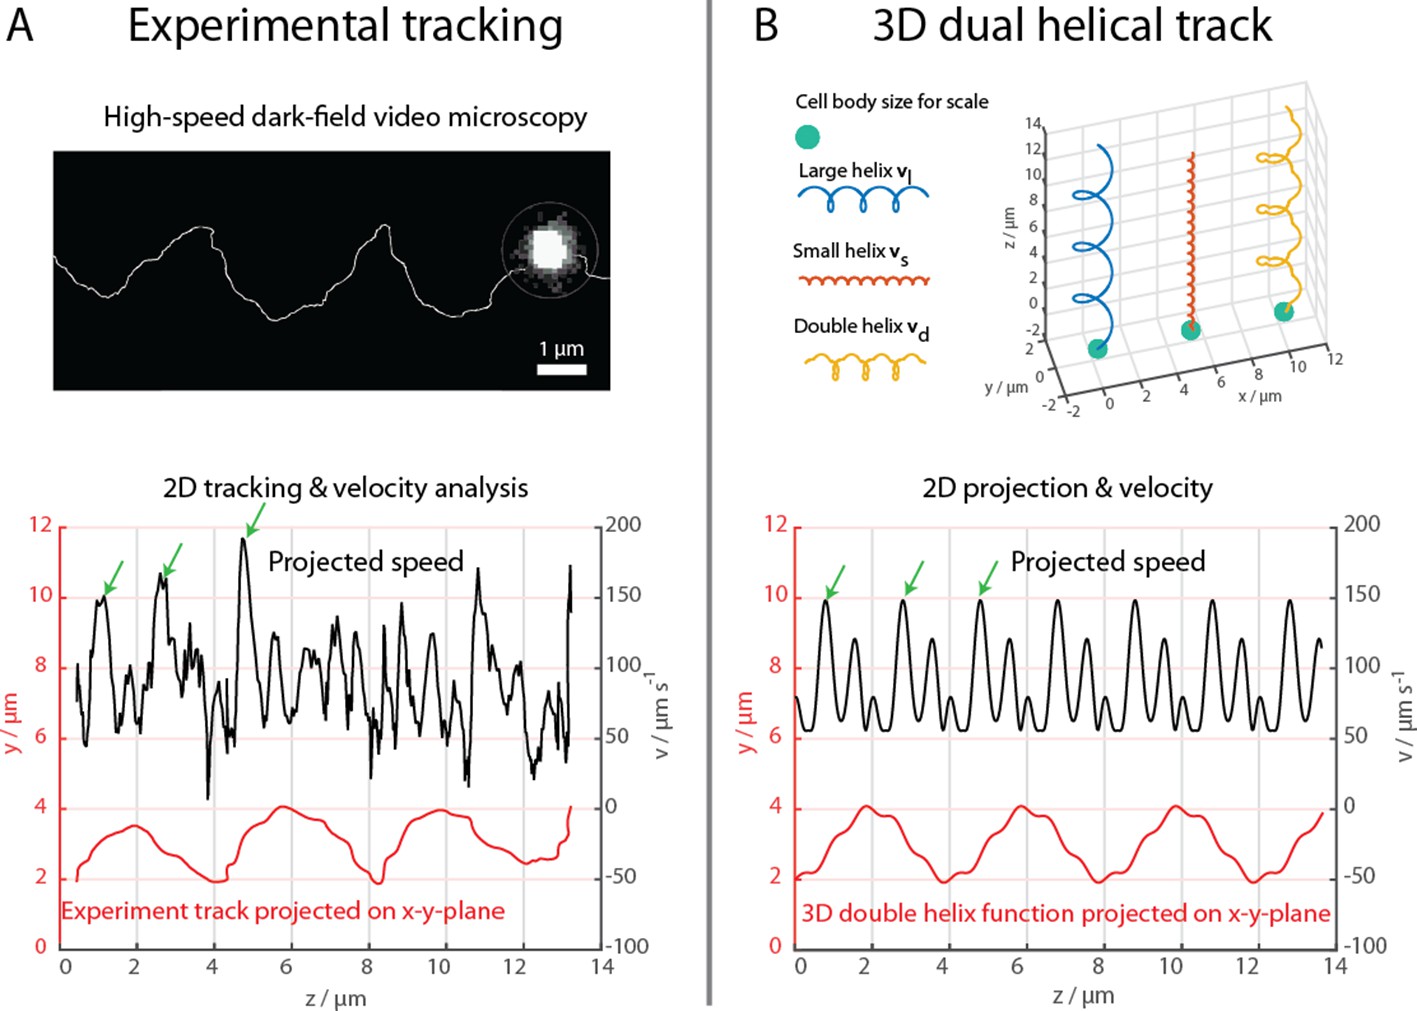
High-speed dark-field video microscopy at 1640 fps reveals a dual helical travel path of a MC-1 cell during free swimming.
In (A) the tracked path is displayed after smoothing by a 5-point moving average filter and then plotted together with the cell velocity. Green arrows indicate velocity maxima. In (B) it is shown that the projected swimming path and projected velocity can be described by a projection of a large 3D double helix .
Figure 3
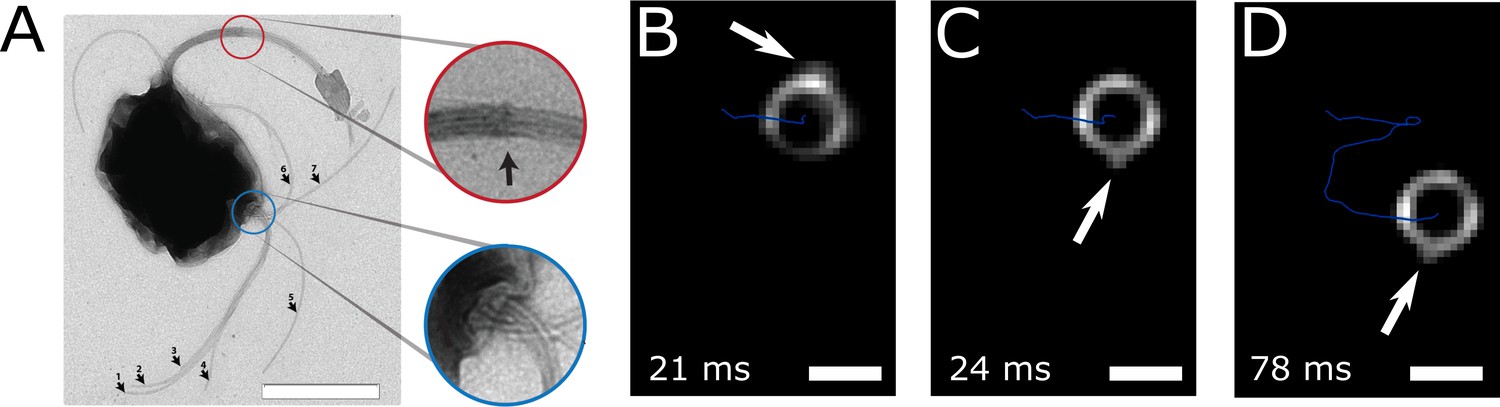
Flagella bundle imaging.
(A) TEM image of an MC-1 cell stained with uranyl acetate. Two flagella bundles emerge from the MC-1 cell body. Each bundle features seven flagella, which emerge from a cavity on the cell surface. The individual flagella are bundled by a sheath (scale bar is 1 µm). (B-D) Individual frames from the high-speed dark-field video microscopy experiment at different points in time (Video 1, scale bars 1 µm). Bright spots appeared on the cell surface and next to the cell, which were identified as the parts of the flagella bundles that were closest to the cell surface. As the cell swam downwards in the image (blue track), the flagella bundle spots appeared in front of and behind the cell (relative to its overall movement direction). When comparing the times of B and C, the abrupt change in position indicates that another flagella bundle moved into focus of the microscope. When comparing C and D, it becomes apparent that the spots appear at nearly the same position on the cell at nearly the same horizontal position in the helical movement pattern, indicating a periodic flagella movement pattern that causes the helical track.
Figure 4

Positions of flagella bundles on the cell over 85 ms at 1424 fps.
(A) The cell swam from top to bottom in the field of view. Moving bright spots were identified as the parts of the flagella bundles that were closes to the cell surface. The cell’s helical traveling path had a period time of 52 ms. (B) The positions were tracked over time and are depicted relative to the center of the cell, represented by different spheres for different time intervals. (C) The schematic of the cell’s large helical track is color-coded according to the different time intervals where the flagella bundle parts were visible to highlight the periodicity of the flagella bundle movement.
Figure 5 with 6 supplements

Simulations of MC-1 swimming dynamics with one pushing and one pulling flagellar bundle.
The principle cell and flagella bundle arrangement is shown in (A) at four distinct time points where the cell body diverges strongly from the helix axis. (B) Shows the projected track of a simulated MC-1 with the flagellar opening angle 60o together with the projected speed. The results are comparable to measured data from Figure 2A. (C) Histogram of turning angles for the reorientation events seen in experiments and in simulations, where reorientation results from periods of synchronous rotation. (D) Validation of the cooperative pushing and pulling model in the presence of a strong magnetic field (3 mT). A third hyper-helix is observed in both experiment and simulation.
Figure 5—figure supplement 1
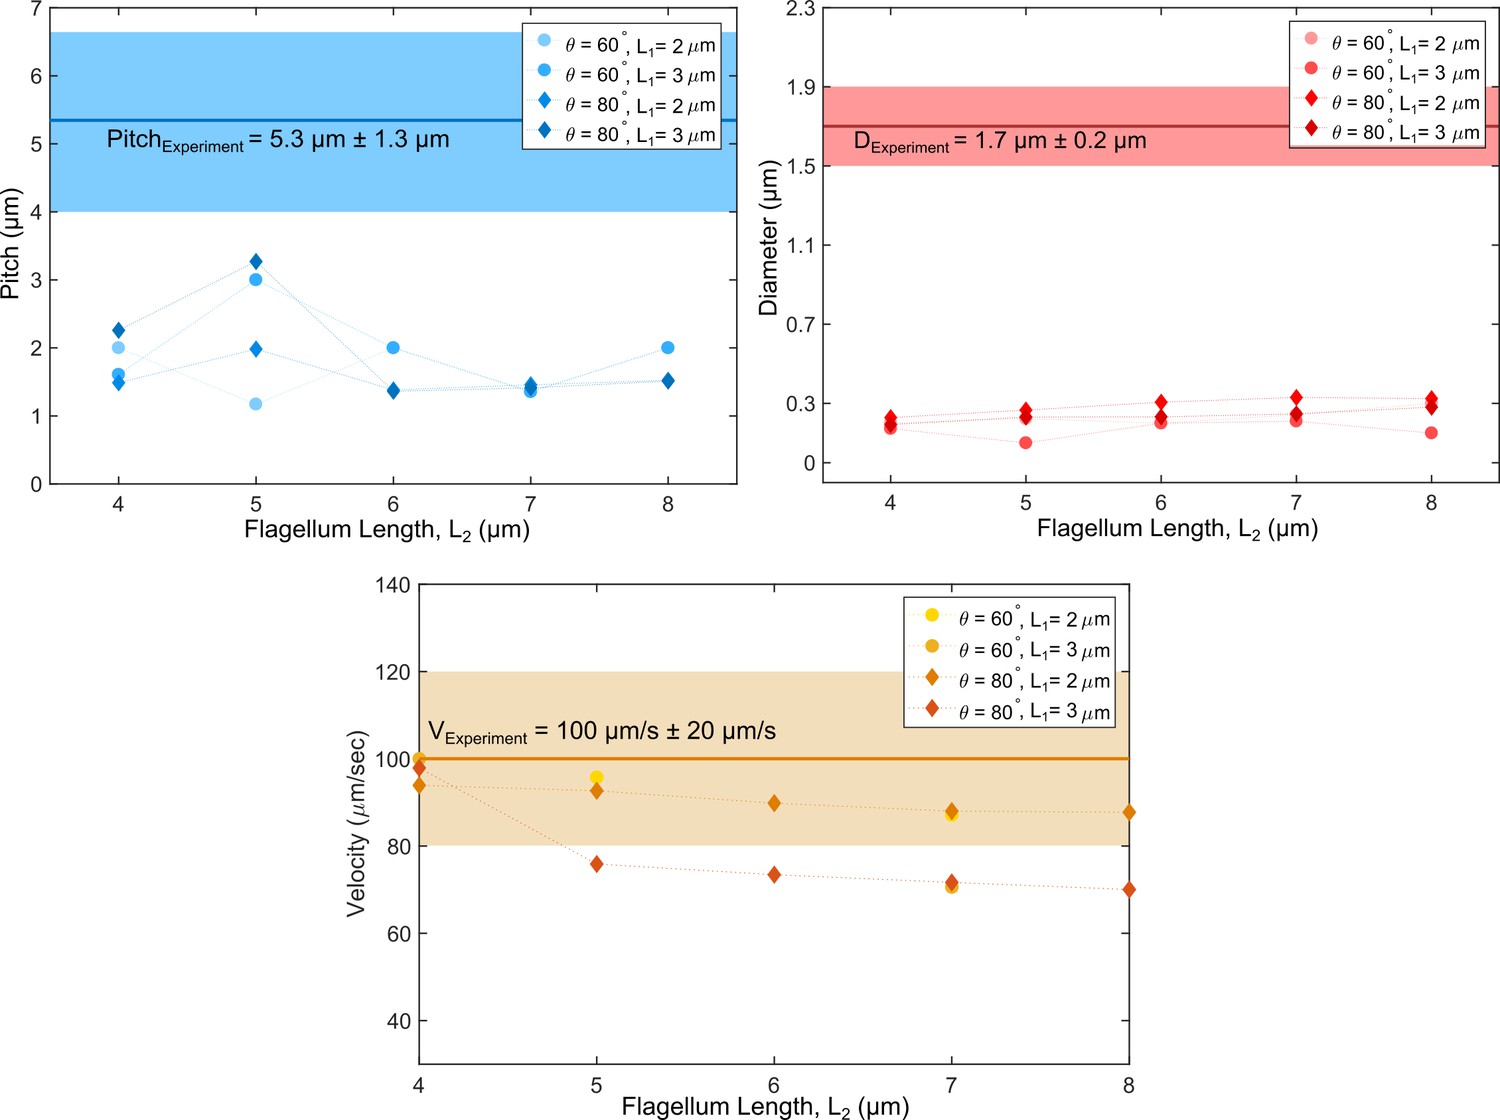
Swimming path parameters from numerical simulations with an asymmetry in flagella lengths compared to experimental values.
No match could be reached for either pitch or diameter in the simulations.
Figure 5—figure supplement 2
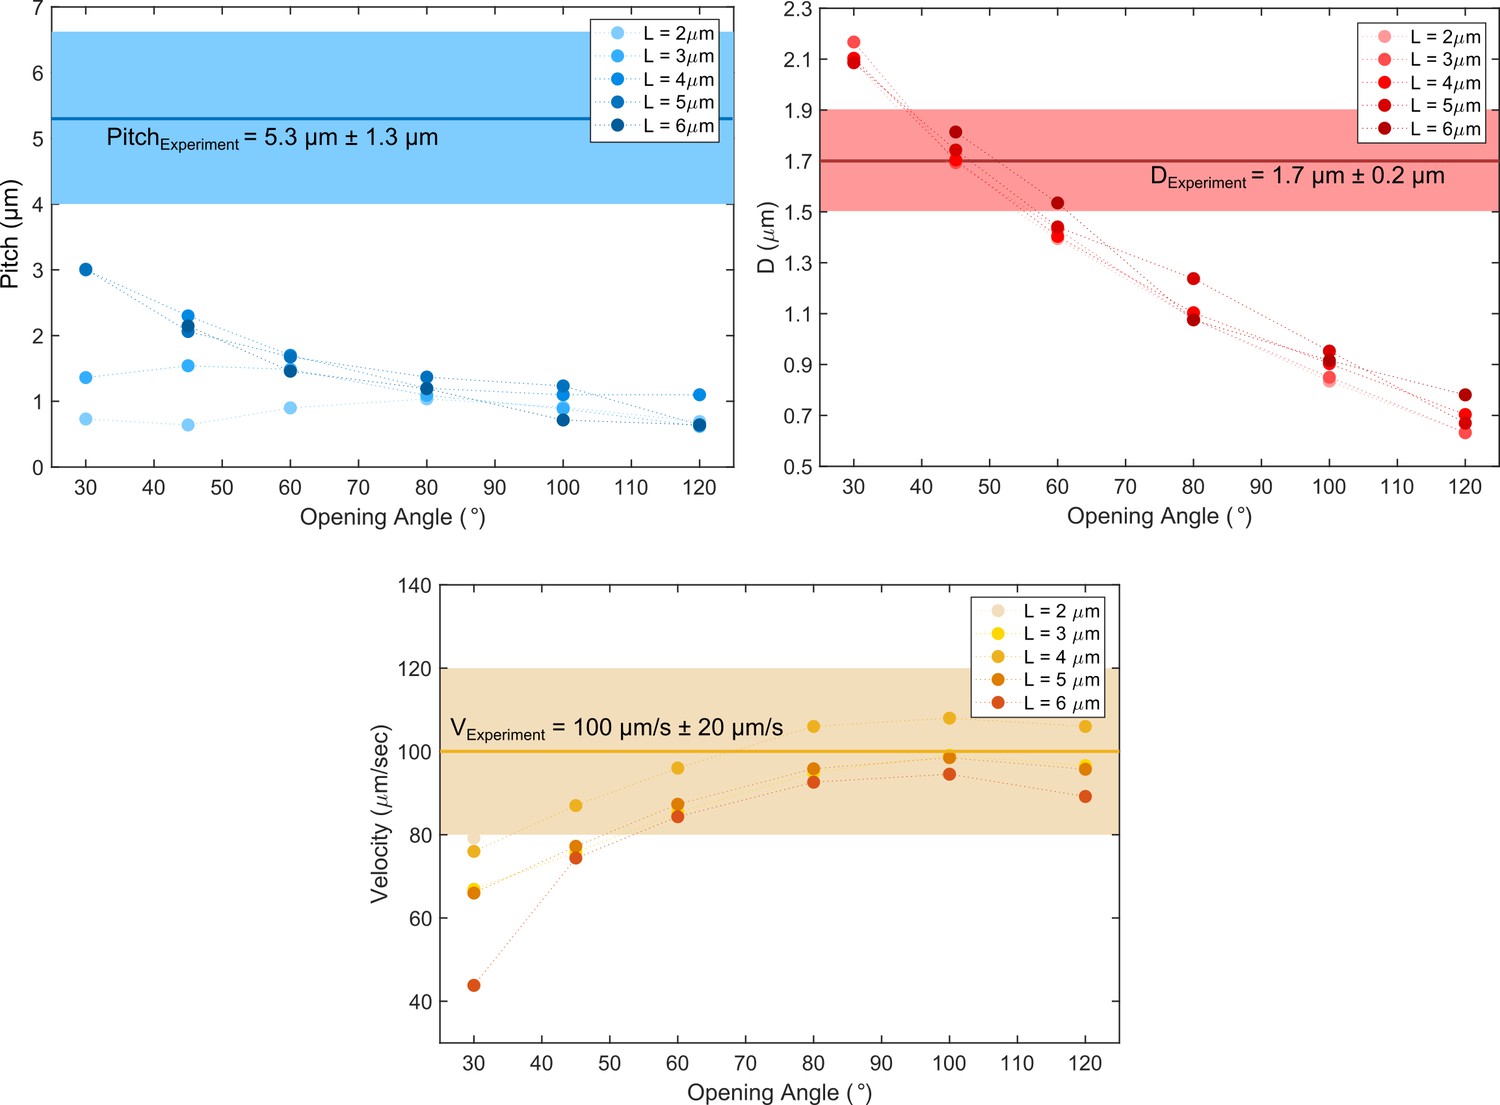
Comparison of cell path parameters from experiments and the pushper-puller simulation scenario.
While the pitch is not fully matched for any opening angles between the two flagella, the helix diameter and cell’s speed could be simulated.
Figure 5—figure supplement 3
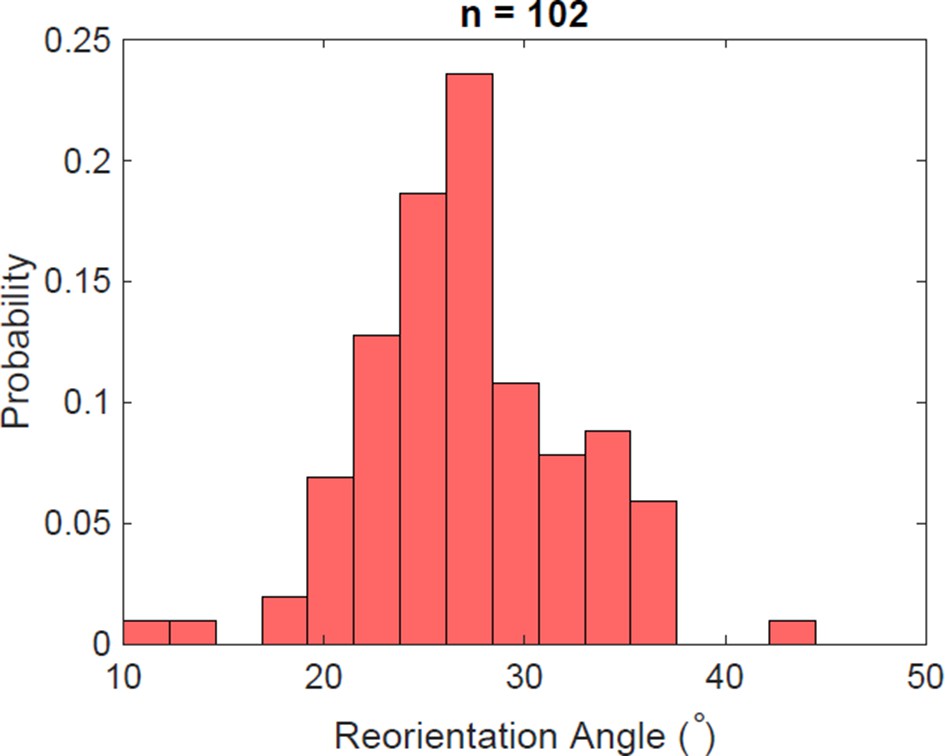
Reorientation angle histogram for the following transient flagella bundle configuration: CCW and CW → CCW and 0 → CCW and CW (the rotation of the puller flagella is stopped during reorientation).
Figure 5—figure supplement 4
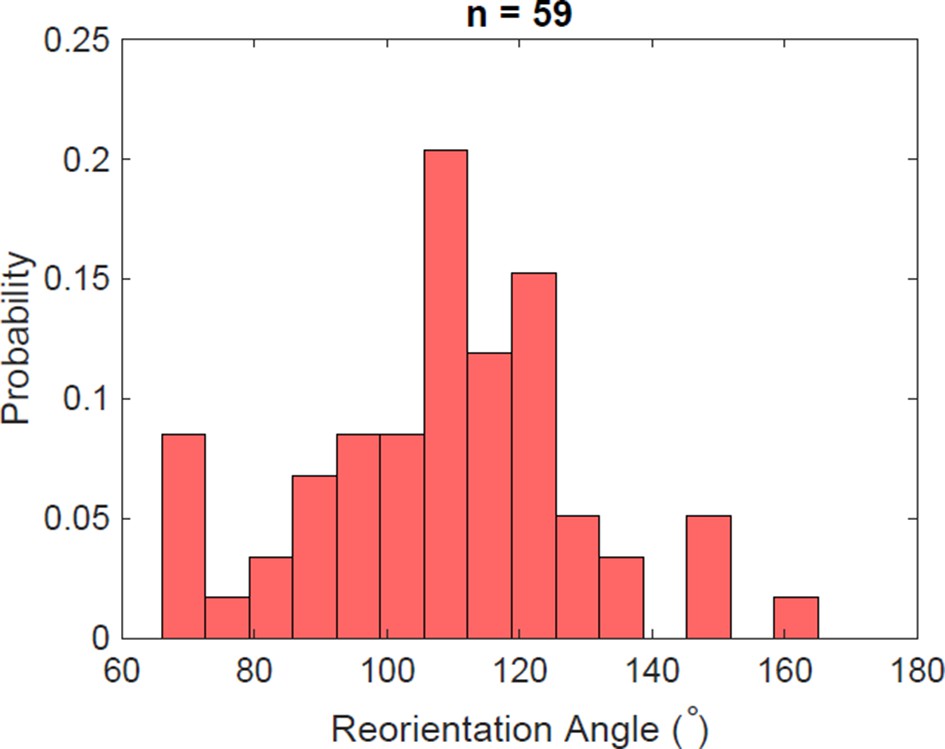
Reorientation angle histogram for the following transient flagella bundle configuration: CCW and CW → CCW and CCW → CW and CCW → CW and CW → CCW and CW.
Figure 5—figure supplement 5
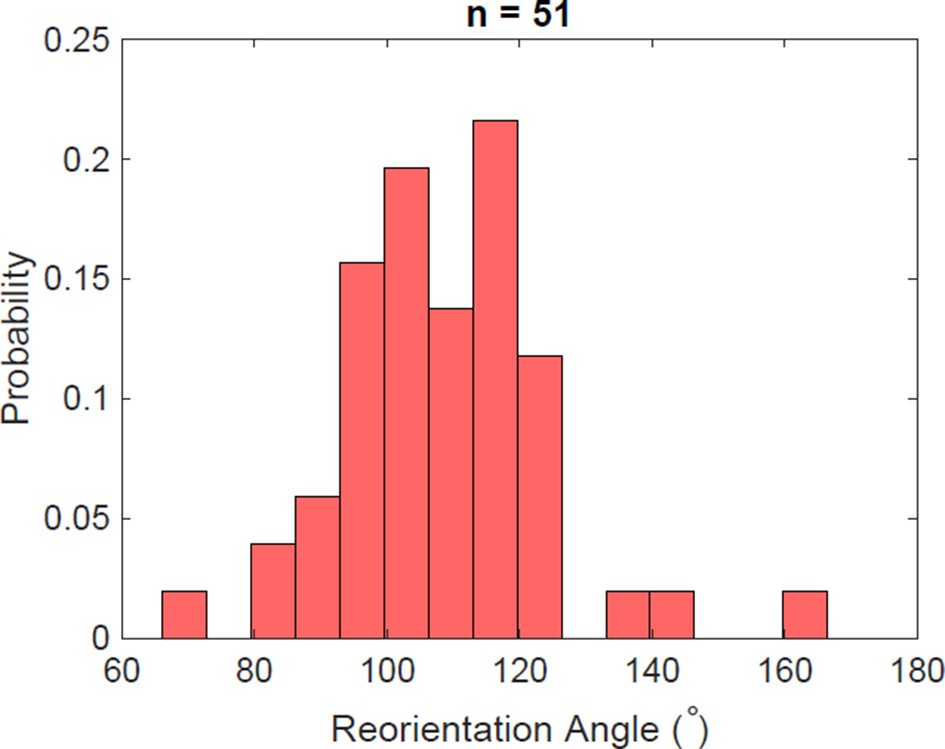
Reorientation angle histogram for the following transient flagella bundle configuration: CCW and CW → CCW and CCW → CW and CCW → CCW and CCW → CCW and CW.
Figure 5—figure supplement 6
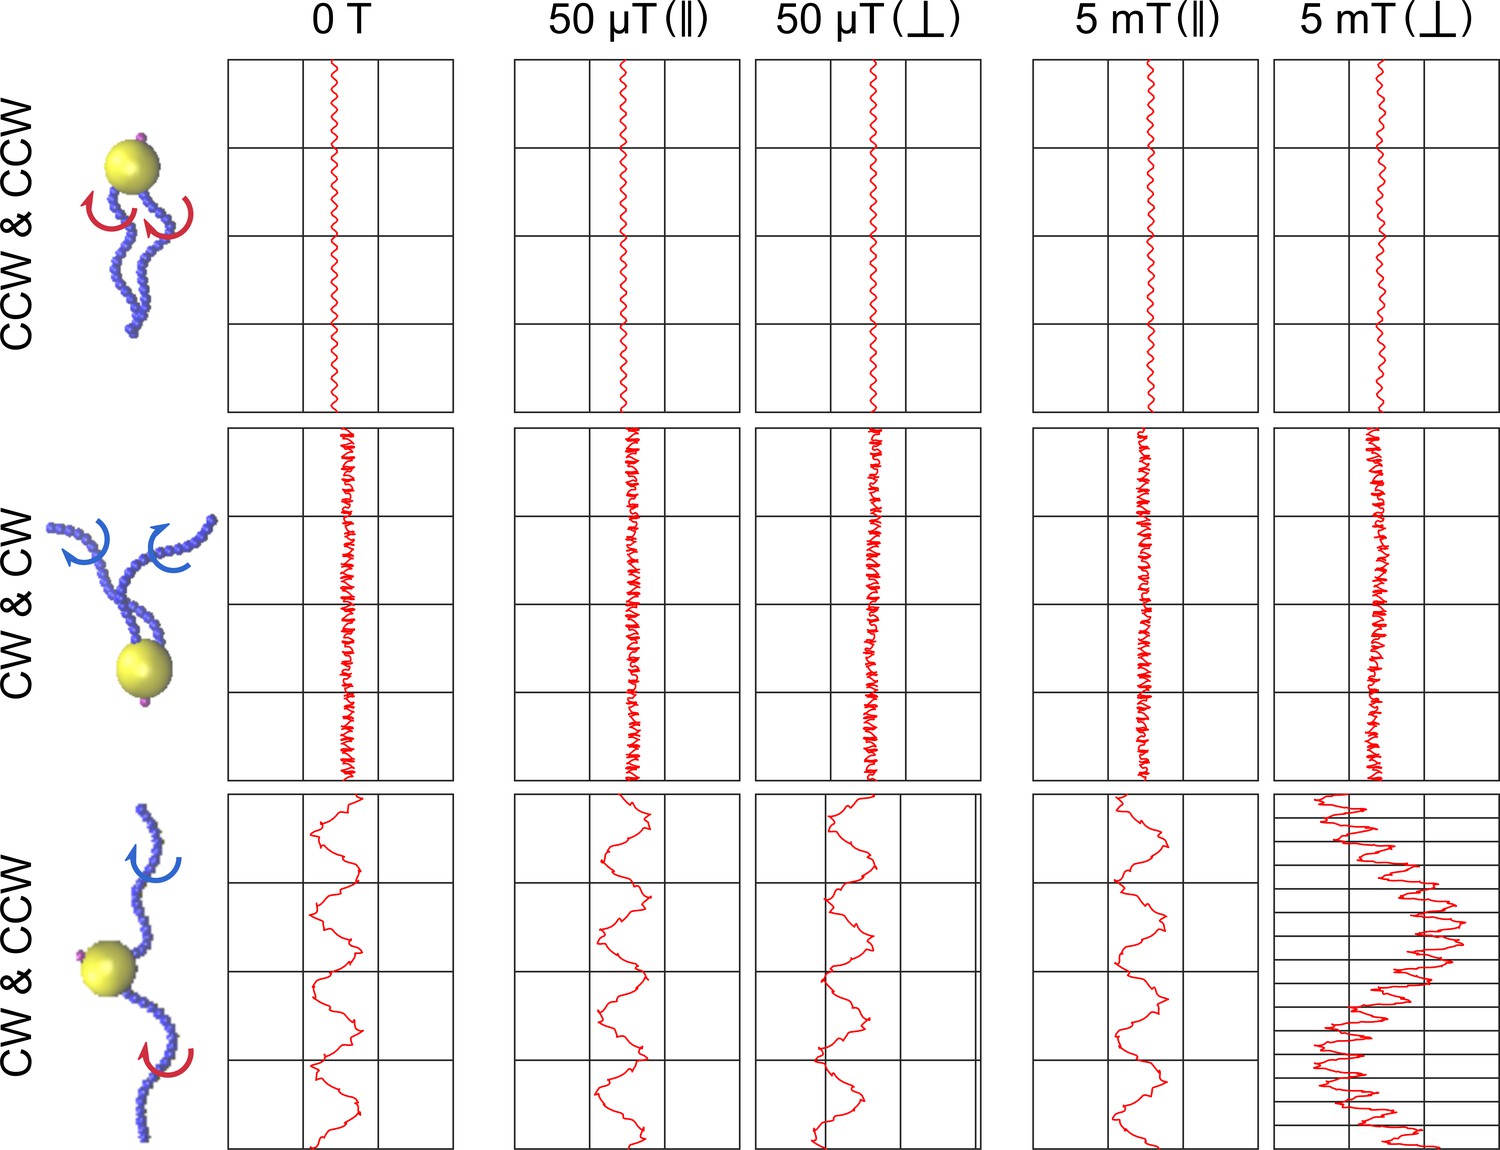
Simulations of different scenarios of MC-1 swimming with varying magnetic fields and magnetic moment orientation.
The tested flagella rotation patterns are shown together with the resulting cell trajectories for five different conditions: no magnetic field, weak magnetic field (50 μT) for a cell with magnetic moment parallel and perpendicular to the flagellar axes, and strong magnetic field (5 mT), again with magnetic moment parallel and perpendicular to the flagellar axes.. In the absence of a magnetic field, two pushing flagella produce small helices, two pulling flagella cause a strongly distorted movement pattern and only a cooperatively pushing and pulling flagella combination reproduces the experimentally observed double helical motion shown in Figure 2A. A strong magnetic field results in the hyper-helical motion shown in Figure 4D, if the magnetic moment is not parallel to the flagellar axes.
Videos
Video 1
Cell observation in a high-intensity dark-field video microscopy experiments at 1424 fps and 60x magnification with cell tracking.
Video 2
Cell observation in a high-intensity dark-field video microscopy experiments at 1424 fps and 60x magnification with cell tracking and tracking of white spots on the cell surface.
Video 3
Simulation of cell swimming with two pushing flagella.
Video 4
Simulation of cell swimming with one pulling and one pushing flagella.
Video 5
Example simulation of reorientation events.
Tables
Table 1
Simulated swim track parameters for an asymmetry in motor torques for MC-1 cells for different opening angles between the two flagella bundles.
The second row gives statistical averages of experimental values for diameter (D), pitch (P), period time (T) and speed (Vt).
| Opening angle | Tm2/Tm1 | D (μm) | P (μm) | T (ms) | Vt (μm/s) |
|---|---|---|---|---|---|
| Experiment | 1.7 | 5.3 | 46.0 | 100.0 | |
| 60 ° | 0.1 | 0.43 | 0.93 | 47.4 | 52.33 |
| 0.5 | 0.29 | 0.73 | 20.2 | 58.85 | |
| 0.9 | 0.18 | 1.58 | 33.4 | 88.42 | |
| 80 ° | 0.1 | 0.54 | 1.08 | 54.4 | 54.76 |
| 0.5 | 0.39 | 1.09 | 32 | 60.44 | |
| 0.9 | 0.20 | 1.61 | 34.8 | 84.14 |
Table 2
Swimming features of MC-1 cells using CCW and CW swimming mechanism for simulations with different flagellar opening angles.
The given output parameters are the helix diameter, its pitch, the period time (period), the effective velocity (Vz) and the instantaneous velocity (Vt).
| Flagellar opening angle | Diameter (μm) | Pitch (μm) | Period (ms) | Vz (μm/s) | Vt (μm/s) |
|---|---|---|---|---|---|
| 30° | 2.1 | 3.0 | 144 | 21 | 76 |
| 45° | 1.7 | 2.3 | 88 | 27 | 87 |
| 60° | 1.4 | 1.7 | 59 | 30 | 96 |
| 80° | 1.1 | 1.2 | 39 | 32 | 106 |
| 100° | 0.9 | 1.1 | 34 | 32 | 108 |
| 120° | 0.7 | 1.1 | 34 | 33 | 106 |
Table 3
Swimming features of MC-1 cells for different motor torques.
The 3.5 times increase of motor torque compared to E-coli cells was chosen for the simulations described in the main text due to the best fits of swimming track parameters.
| Motor torque (Tm/Tm-Ecoli) | D (μm) | P (μm) | T (ms) | Vt (μm/s) |
|---|---|---|---|---|
| 3.5 | 1.4 | 1.7 | 59 | 96 |
| 3 | 1.44 | 1.56 | 74.4 | 80.84 |
| 2.5 | 1.43 | 1.64 | 84.2 | 69.41 |
| 2 | 1.49 | 1.39 | 101.2 | 53.27 |
Key resources table
| Reagent type (species) or resource | Designation | Source or reference | Identifiers | Additional information |
|---|---|---|---|---|
| Cell line (Magnetococcus marinus) | MC-1 | CEA | NCBI:txid156889 | Dr. Christopher Lefèvre, CNRS |
| Software, algorithm | ImageJ | NIH | RRID:SCR_003070 | |
| Software, algorithm | MatLab | The MathWorks | RRID:SCR_001622 |
Additional files
Download links
A two-part list of links to download the article, or parts of the article, in various formats.
Downloads (link to download the article as PDF)
Open citations (links to open the citations from this article in various online reference manager services)
Cite this article (links to download the citations from this article in formats compatible with various reference manager tools)
High-speed motility originates from cooperatively pushing and pulling flagella bundles in bilophotrichous bacteria
eLife 9:e47551.
https://doi.org/10.7554/eLife.47551


