The adhesion-GPCR BAI1 shapes dendritic arbors via Bcr-mediated RhoA activation causing late growth arrest
- Baylor College of Medicine, United States
- Rice University, United States
Figures
Figure 1 with 2 supplements

BAI1 restricts dendrite growth in the developing hippocampus and hippocampal cultures.
(a) Representative in vivo images showing optical sections through the centers of neuronal somata from mice transfected with EGFP and shRNA against Adgrb1 and stained for BAI1. Note that the transfected neuron expressing EGFP and shRNA has substantially lower BAI1 staining that the neighboring untransfected neuron, indicating successful BAI1 knockdown. (b) 100 µm thick slices of dorsolateral CA1 from mice transfected with EGFP (Control) or EGFP and shRNA against BAI1 (BAI1 Kd). Bar is 50 µm. c and d Reconstructions of representative control (c) and BAI1 Kd (d) dendritic arbors from slices like those in b. (e) Summary data for dendrite length. (f) Summary data for dendrite number. (g) Summary data for branch points. (h) Summary data for dendrite penetration. Total number of neurons: 21 (N = 3) for control and 41 (N = 4) for BAI1 Kd. (i) Representative images of neurons expressing EGFP alone (control) or with shRNA against Adgrb1 (BAI1 Kd) or with shRNA against BAI1 and RNAi-resistant BAI1 (Rescue). Images are masked to remove axons and dendrites from other neurons. Bar is 20 µm. (j) Summary data for total length of cultured neurons. (k) Summary data for total dendrite number in cultured neurons. Total number of neurons in j and k: 118 for control neurons, 106 for BAI1 Kd neurons, and 65 for rescue neurons (N = 7). Data are represented as mean ± s.e.m. (***p<0.001) Detailed statistics are found in Figure 1—source data 1.
-
Figure 1—source data 1
Statistical summary for Figure 1: ANOVA and key Tukey post-hoc tests and N and n values for Figure 1e–h,j–k.
- https://doi.org/10.7554/eLife.47566.010
-
Figure 1—source data 2
Individual values for in vivo and cultured neurons demonstrating the effects of BAI1 loss on arbor growth (Figure 1e–h,j–k).
- https://doi.org/10.7554/eLife.47566.007
-
Figure 1—source data 3
Quantification of Western bands showing expression levels of BAI1, BAI2, and BAI3 (Figure 1—figure supplement 1d).
- https://doi.org/10.7554/eLife.47566.008
-
Figure 1—source data 4
Extended individual values for in vivo and cultured neurons showing the effects of BAI1 loss on arbor growth (Figure 1—figure supplement 1a,b,e,g,h,i,j).
- https://doi.org/10.7554/eLife.47566.009
Figure 1—figure supplement 1
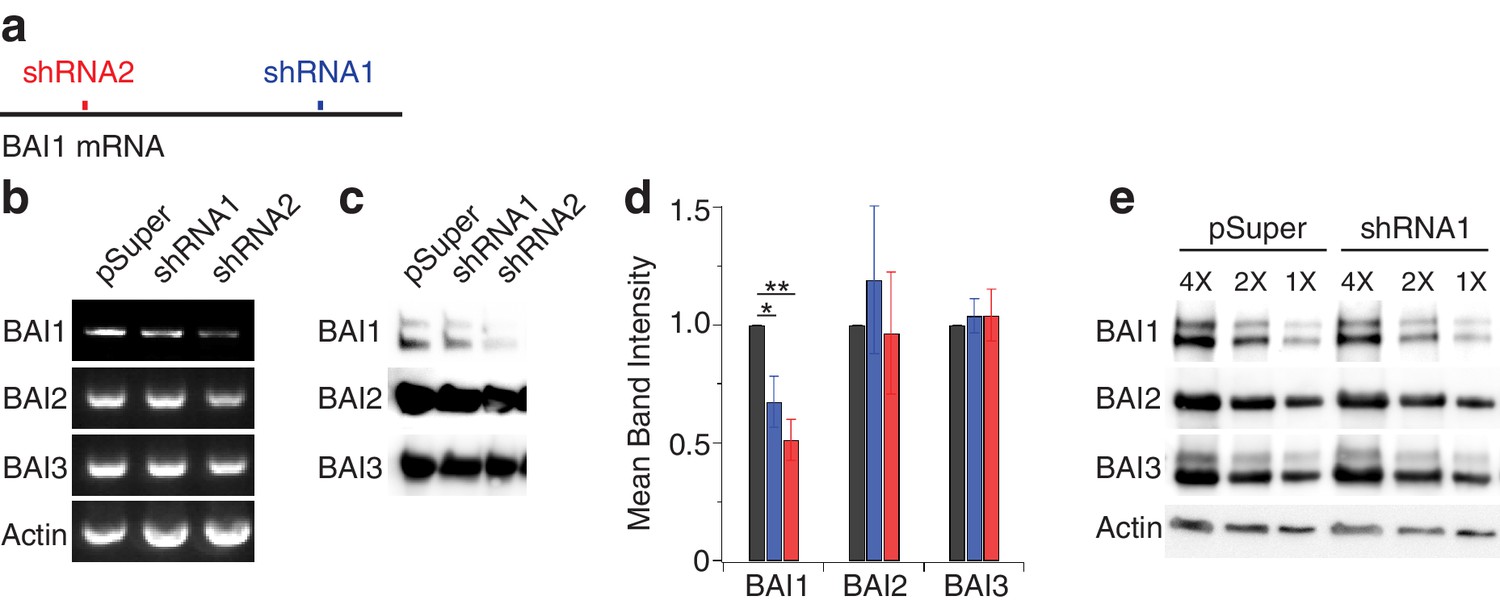
shRNA-mediated BAI1 Kd and effects on other BAIs.
(a) Schematic representation of Adgrb1 mRNA showing the sites targeted by shRNA1 (blue) and shRNA2 (red). (b) Results of rtPCR of the indicated targets on RNA isolated from 16 DIV hippocampal neurons to which EGFP and pSuper, shRNA1, or shRNA2 had been introduced on DIV three via calcium chloride transfection. Based on EGFP expression, we estimate that 40–50% of the neurons were transfected. (c) Representative Western blots of the indicated proteins in post-nuclear supernatants of hippocampal neurons like those used for RNA isolation in panel b. (d) Quantification of BAI1-3 band density from repeats of the experiments shown in panel c. Black bars indicate pSuper-expressing samples, blue indicates shRNA1-expressing samples, and red indicates shRNA2-expressing samples. *p<0.05; **p<0.01, N = 4. (e) Serial dilutions of pSuper- and shRNA1-expressing samples indicate a linear relationship between band intensity and protein levels. These samples also show actin as a loading control. Taken together with the immunofluorescence data in Figure 1a, Figure 5a–e, and (Duman et al., 2013; Tu et al., 2018), these data indicate a strong knockdown of BAI1 in transfected neurons. Detailed statistics are found in Figure 1—figure supplement 1—source data 1.
-
Figure 1—figure supplement 1—source data 1
Statistical summary for Figure 1—figure supplement 1: ANOVA and key Tukey post-hoc tests and N and n values for Figure 1—figure supplement 1d.
- https://doi.org/10.7554/eLife.47566.004
Figure 1—figure supplement 2
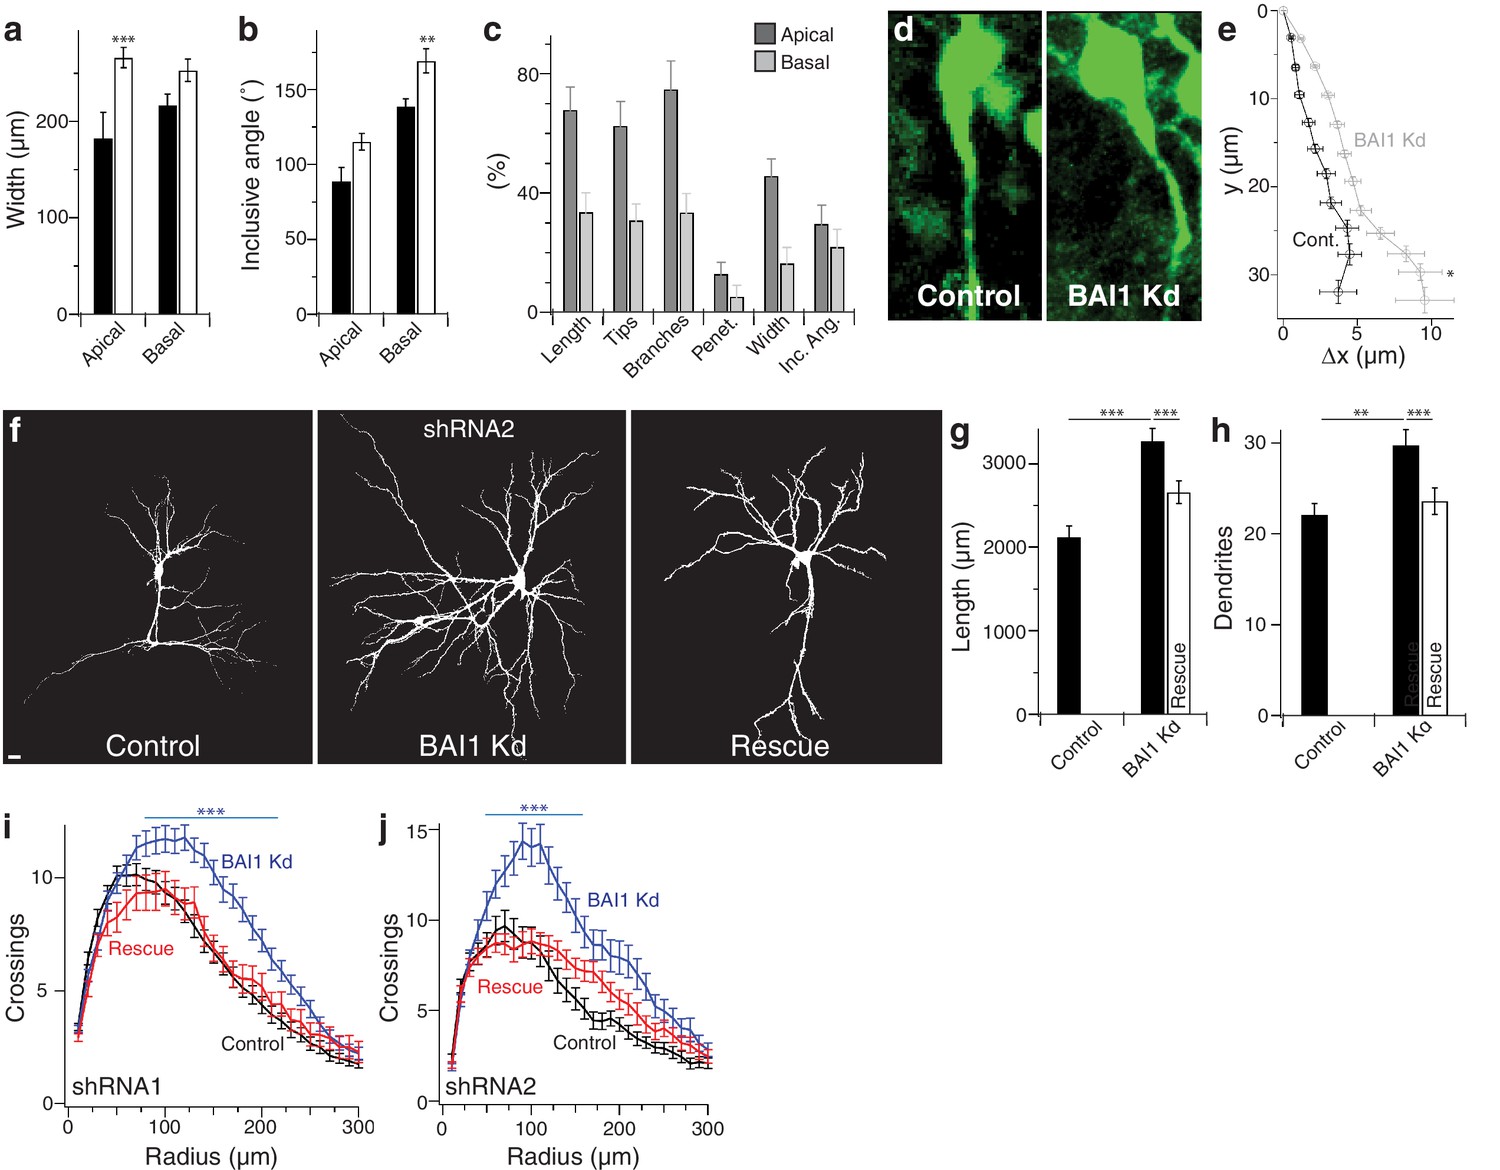
BAI1 restricts dendrite growth in developing hippocampus.
(a) Summary data of the maximal lateral width of dendritic arbors. (b) Summary data of minimum angle centered on the cell body that includes the entire indicated dendritic domain. (c) % change in each of the indicated parameters for apical and basal dendrites. Note that the apical dendrites are more affected than basal dendrites by BAI1 Kd. (d) Representative images of neurons aligned so that the hippocampal cell layer was parallel to the page. (e) Summary data of the position of the primary apical dendrite. Total number of neurons: 19 for control neurons (N = 3) and 38 for BAI1 Kd neurons (N = 4). (f) Representative images of hippocampal neurons expressing EGFP and empty vectors (control), shRNA against Adgrb1 (BAI1 Kd) or shRNA against BAI1 and RNAi-resistant BAI1 (Rescue) fixed at 21 DIV. Images are masked to remove all axons and dendrites from other neurons. (g) Summary data for dendrite length. (h) Summary data for dendrite number. (i) Summary data for Sholl crossings with shRNA1. (j) Summary data for Sholl crossings with shRNA2. Total number of neurons for shRNA1 experiments: 118 for control neurons, 106 for BAI1 Kd neurons, and 65 for rescue neurons (N = 7). Total number of neurons for shRNA2 experiments: 39 for control neurons, 34 for BAI1 Kd neurons, and 35 rescue neurons (N = 4). Data are represented ± s.e.m. (***p<0.0001, **p<0.01, *p<0.05) Detailed statistics are found in Figure 1—figure supplement 2—source data 1.
-
Figure 1—figure supplement 2—source data 1
Statistical summary for Figure 1—figure supplement 2: ANOVA and key Tukey post-hoc tests and N and n values for Figure 1—figure supplement 2a,b,e,g–j.
- https://doi.org/10.7554/eLife.47566.006
Figure 2 with 1 supplement
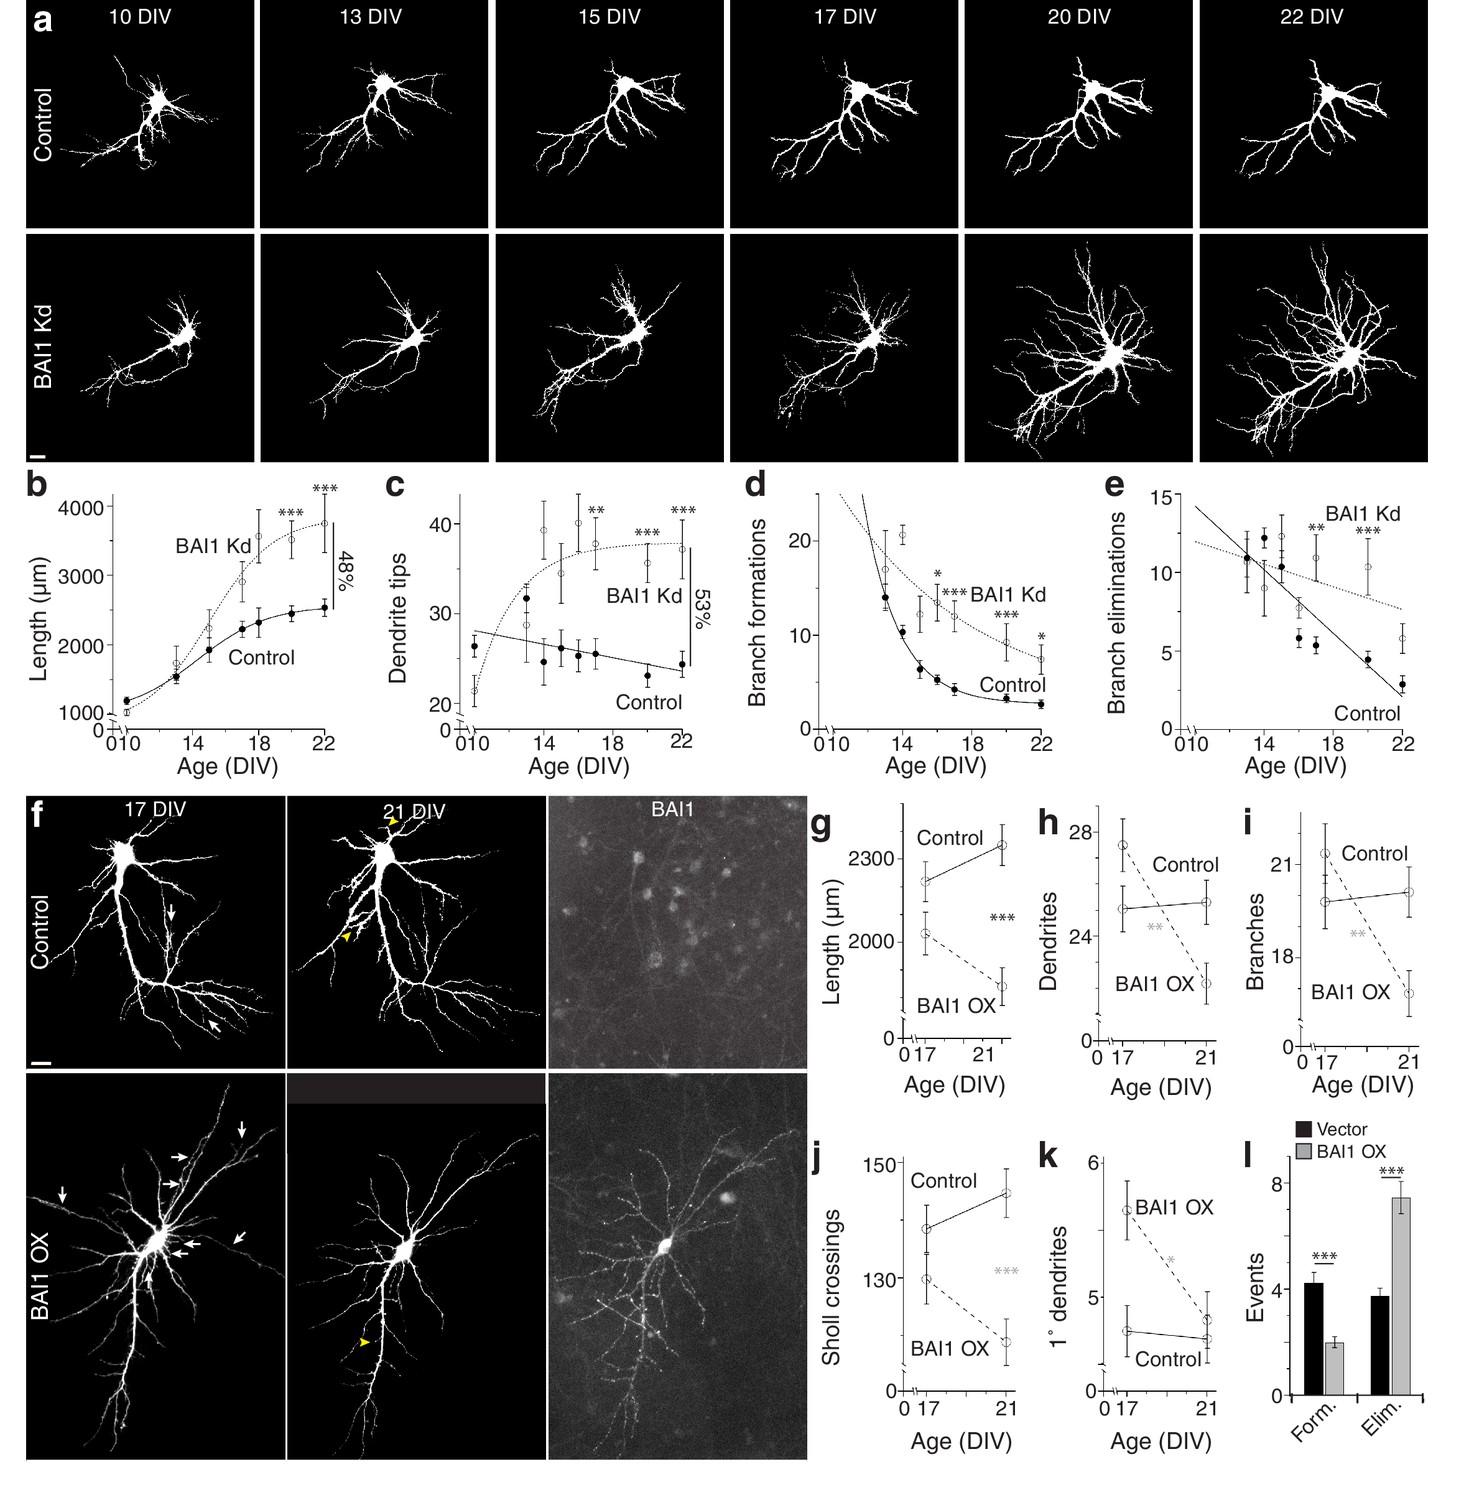
BAI1 exercises its effects on dendritic growth arrest late in development.
(a) Representative longitudinal series from neurons transfected on 6 DIV with EGFP (Control) or EGFP and shRNA against Adgrb1 (BAI1 Kd) imaged at the indicated times. Images are masked to remove axons and dendrites from other neurons. Bar is 10 µm. (b) Summary data of total dendrite length. (c) Summary data of total dendrite number. (d) Summary data of branch formations. (e) Summary data of branch eliminations. Total number of neurons represented in panels a–e): 61 for control neurons and 22 for BAI1 Kd neurons (N = 5). Data are represented as mean ± s.e.m. with mathematical fits. (f) Representative longitudinal images of neurons expressing EGFP alone (Control) or with overexpression of Adgrb1 (BAI1 OX). Neurons were fixed on 21 DIV and immunostained for BAI1. White arrows in the 17 DIV panels indicate dendrites eliminated by 21 DIV, while yellow arrowheads in 21 DIV panels indicate dendrites formed since 17 DIV. Images are masked to remove axons and dendrites from other neurons. Bar is 10 µm. (g) Summary data for dendrite length. (h) Summary data for dendrite number. (i) Summary data for branch number. (j) Summary data for integrated Sholl crossings. (k) Summary data for primary dendrites. (l) Summary data for dendrite dynamics. Total number of neurons represented in panels (f–l): 105 neurons (N = 3). Symbols positioned between points indicate differences between populations at the different time points. Data are represented as mean ± s.e.m. (***p<0.0001, **p<0.01, *p<0.05) Detailed statistics are found in Figure 2—source data 1.
-
Figure 2—source data 1
Statistical summary for Figure 2: ANOVA and key Tukey post-hoc tests and N and n values for Figure 2c–e,g–l.
- https://doi.org/10.7554/eLife.47566.016
-
Figure 2—source data 2
Individual values for BAI1 Kd and OX time course experiments (Figure 2b–e,g–l).
- https://doi.org/10.7554/eLife.47566.014
-
Figure 2—source data 3
Individual values for arbor growth in fixed time courses and BAI1 subcellular staining levels (Figure 2—figure supplement 1c,h).
- https://doi.org/10.7554/eLife.47566.015
Figure 2—figure supplement 1
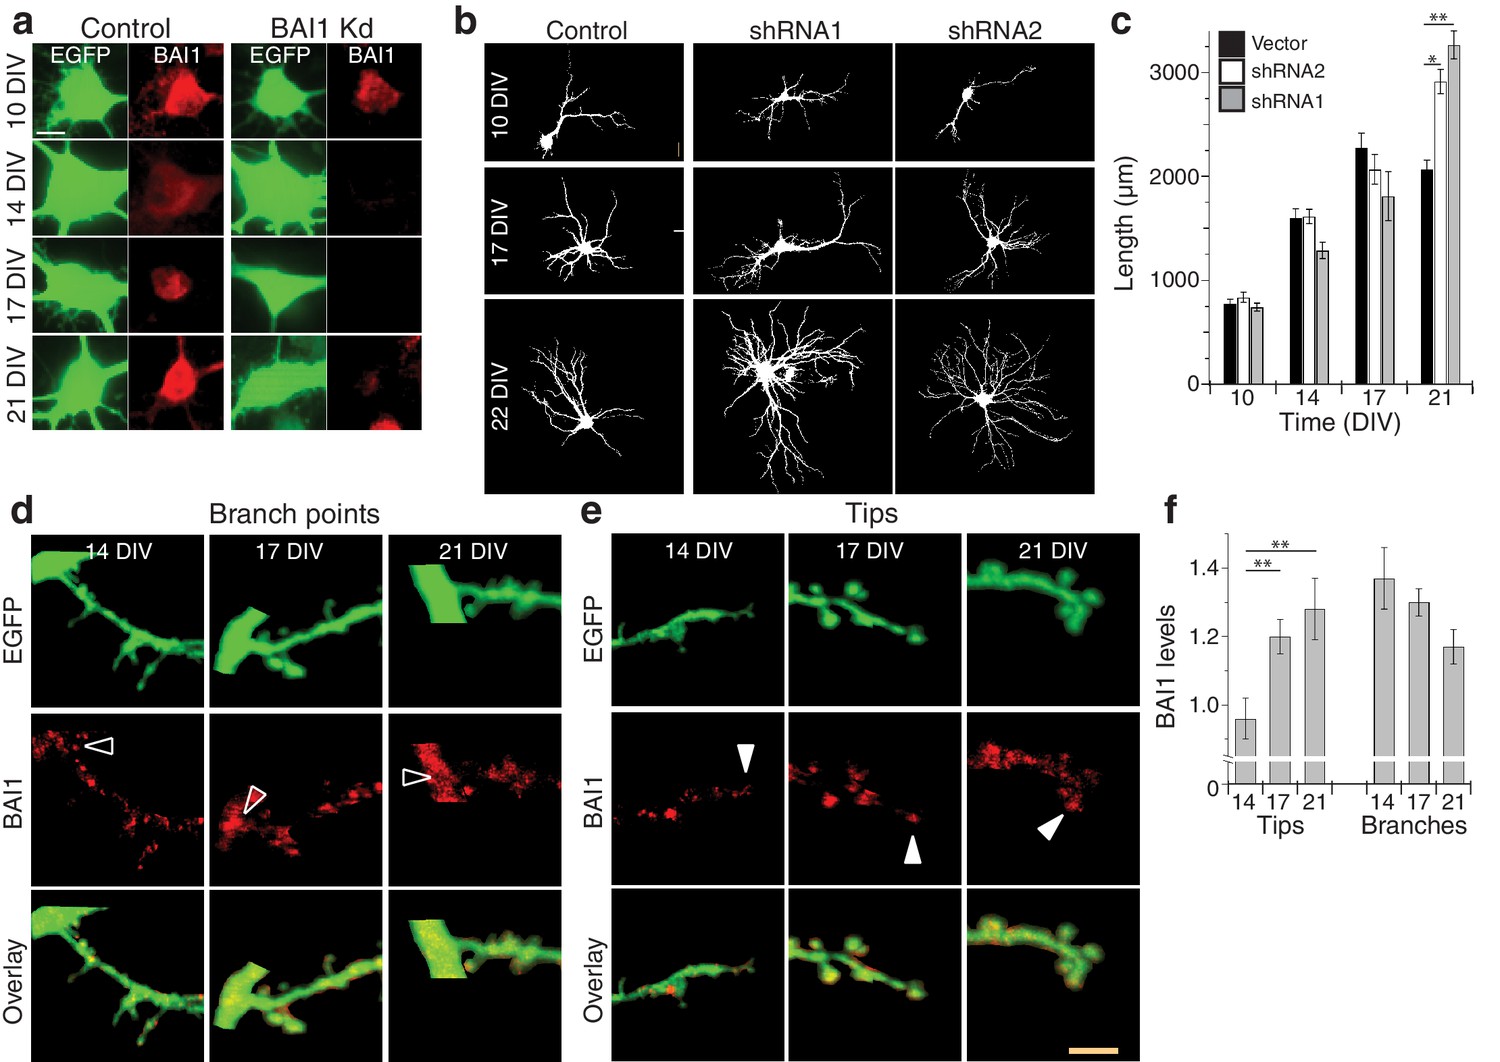
Manipulation of BAI1 leads to altered dendrite growth in fixed populations of neurons; BAI1 localizes to dendritic tips later in development.
(a) Representative images of hippocampal neuronal somata from control and BAI1 Kd neurons fixed at the indicated times and stained for BAI1. Bar is 5 µm. (b) Representative somatodendritic domains from EGFP-expressing hippocampal neurons from control conditions or neurons transfected with either of the shRNAs against BAI1 from Figure 1 and Figure 1—figure supplement 1 on 7 DIV and fixed at the indicated times. Images are masked to remove axons and dendrites from other neurons. Bar is 10 µm. (c) Summary data of dendrite length. Total number of neurons: 40 for all conditions on 10 DIV; 48, 50, and 46 neurons for vector, shRNA1, and shRNA2 on 14 DIV; 28, 26, 24 for these conditions on 17 DIV; and 79, 61, and 26 for these conditions on 21 DIV (N = 4). (d and e) Representative images of EGFP, immunostaining of endogenous BAI1, and colocalization of these two. Shown are regions of branch points between primary and secondary dendrites (d) and dendrite tips (e). White arrowheads show the location of tips on the BAI1 channel, while black arrowheads show the branch points. Images are masked to remove axons and dendrites from other neurons. Bar is 5 µm. (h) BAI1 levels at dendrite tips and branch points were quantified relative to average neuronal BAI1 staining (assigned a value of 1.0) at the indicated times. Total number of neurons is the same as reported in panel c. Data are represented ± s.e.m. (***p<0.0001, **p<0.01, *p<0.05) Detailed statistics are found in Figure 2—figure supplement 1—source data 1.
-
Figure 2—figure supplement 1—source data 1
Statistical summary for Figure 2—figure supplement 1: ANOVA and key Tukey post-hoc tests and N and n values for Figure 2—figure supplement 1 c, f.
- https://doi.org/10.7554/eLife.47566.013
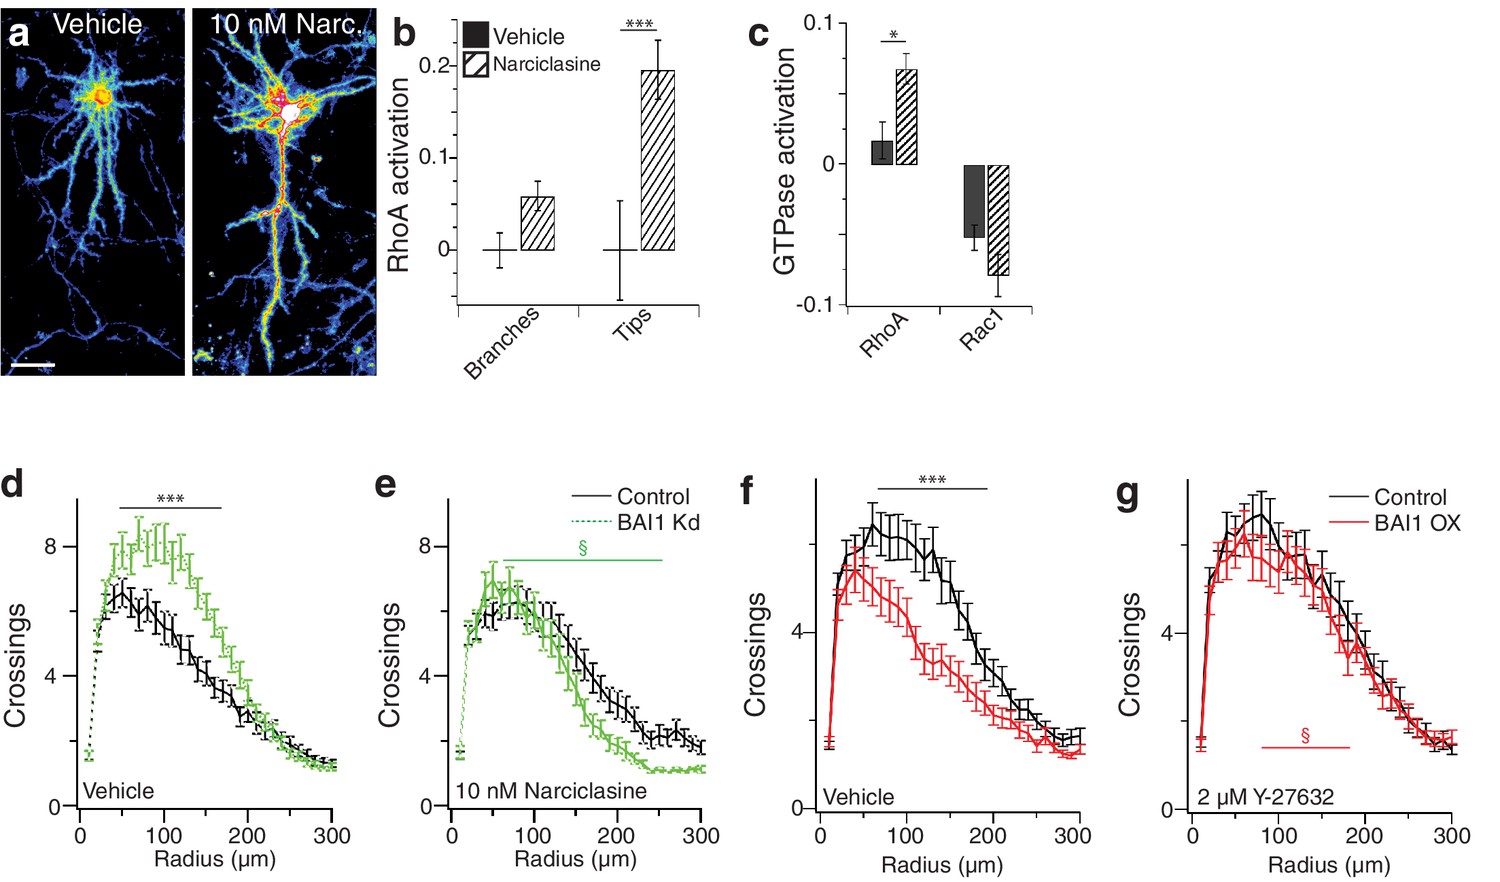
Figure 3 with 3 supplements
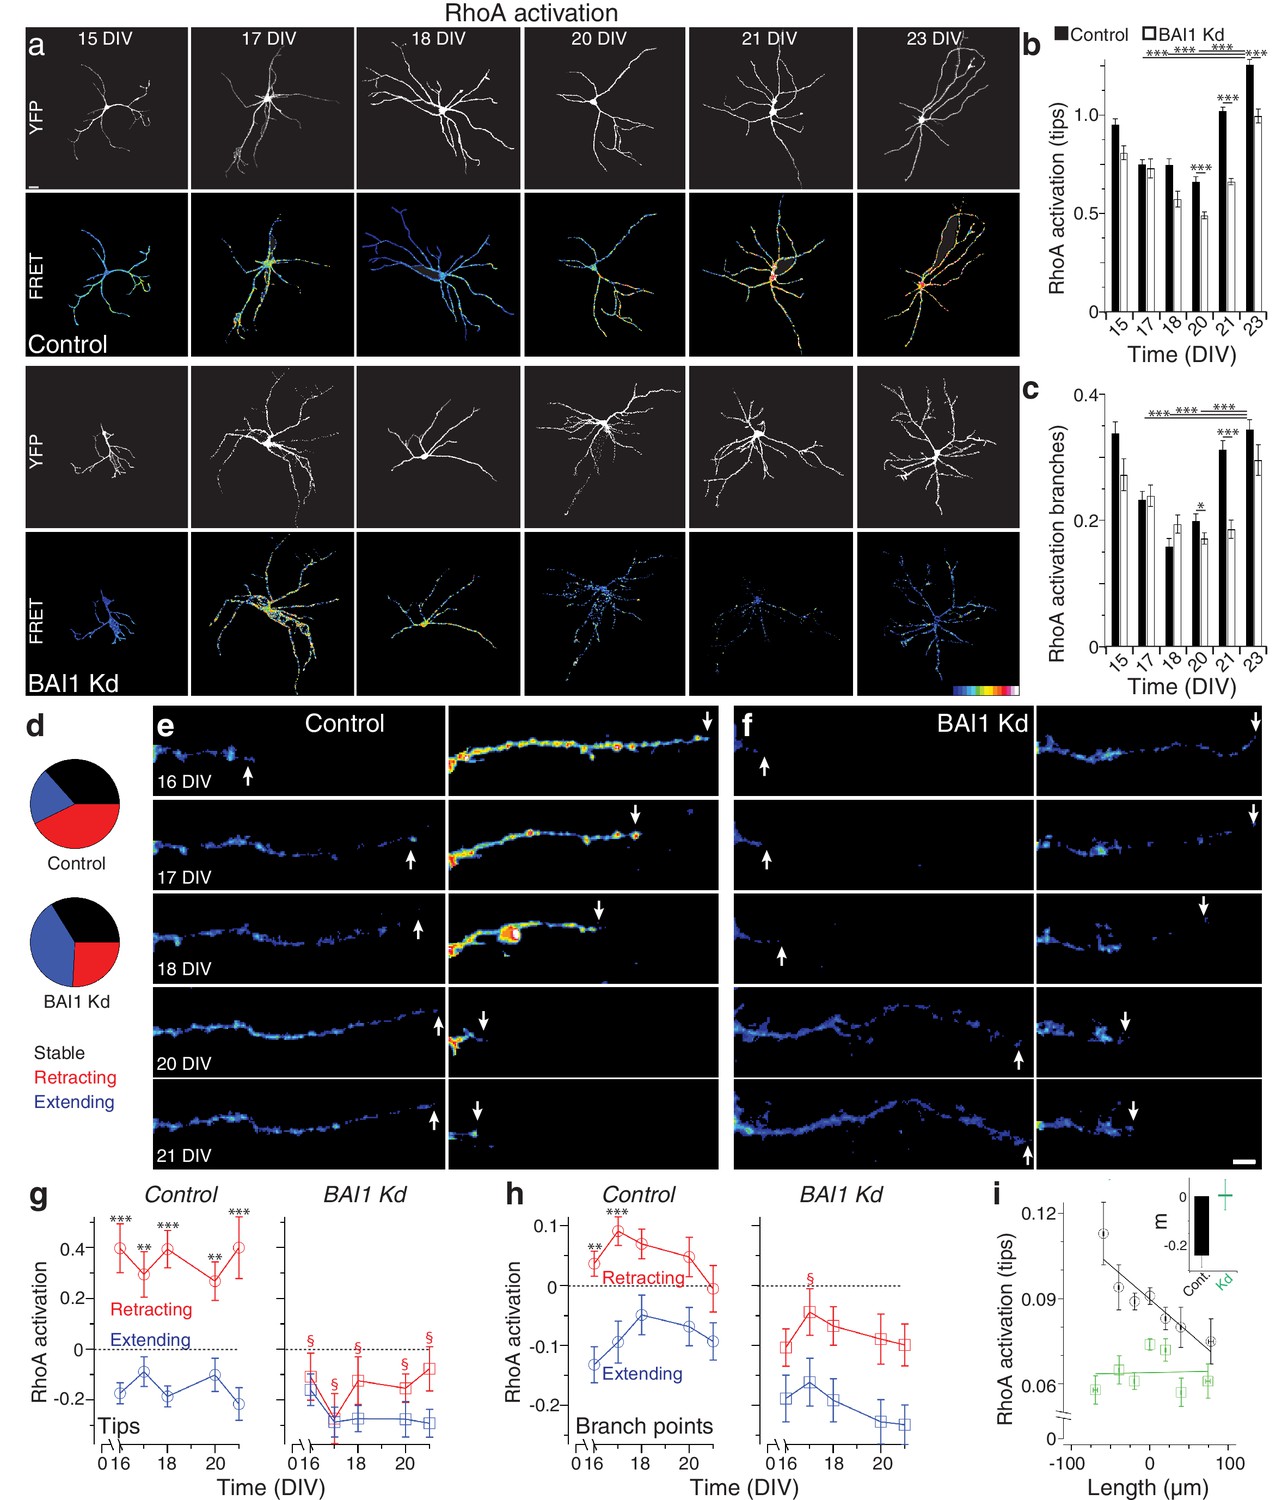
BAI1 drives a late dendritic RhoA activation peak and ties RhoA activation to dendrite behavior.
(a) Representative images of hippocampal neurons expressing Raichu-RhoA alone (control) or with shRNAs against Adgrb1 (BAI1 Kd) measured at the indicated times. Overall dendrite structure was ascertained by directly exciting the FRET acceptor (YFP images), while relative RhoA activation is shown in the FRET images according to the color code in the lower right corner (low values on the left, high on the right). Images are masked to remove axons and dendrites from other neurons. Bar is 20 µm. (b) Summary data of RhoA activation at dendrite tips. (c) Summary data of RhoA activation at dendrite branch points. Total number of neurons: 49 (15 DIV, control), 27 (15 DIV, BAI1 Kd), 34 (17 DIV, control), 20 (17 DIV, BAI1 Kd), 35 (18 DIV, control), 34 (18 DIV, BAI1 Kd), 36 (20 DIV, control), 38 (20 DIV, BAI1 Kd), 37 (21 DIV, control), 32 (21 DIV, BAI1 Kd), 53 (23 DIV, control), and 31 (23 DIV, BAI1 Kd) (N = 5). (d) Pie charts showing the behavior of hippocampal dendrites persistent from 16 to 21 DIV in Control and BAI1 Kd neurons. Throughout this figure, stable dendrites are shown in black, retracting dendrites in red, and extending dendrites in blue. e and f Representative longitudinal images of extending (left) and retracting (right) dendrites in Control (e) and BAI1 Kd (f) neurons expressing the RhoA-FLARE reporter. The color scale for RhoA activation is the same as in panel A. Arrows track dendrite tip location. Images are masked to remove axons and dendrites from other neurons. Bar is 10 µm. (g) Summary of RhoA activation levels at dendrite tips in control (left) and BAI1 Kd (right) neurons through time. RhoA activation levels in stable neurons were also stable and assigned a value of 0 throughout the time course. All data were scaled to the average value of FRET in control somata on 16 DIV for the appropriate repeat of the experiment. (h) Same as panel g, but for dendrite branch points. (i) RhoA activation levels from all dendrites (stable, retracting, and extending) were pooled and plotted against day-long changes in dendritic length in control (black) and BAI1 Kd (green) neurons and linear fits were applied as shown. The inset to this panel shows the slopes extracted from these linear fits. Total number of dendrites represented in panels e-h, 922 for control (from 50 neurons) and 821 for BAI1 Kd (from 38 neurons) (N = 5). Data are represented as mean ± s.e.m., except for the inset to panel i, which is shown ± 95% confidence intervals. (***p<0.0001, **p<0.01, *p<0.05; §p<1e-6 vs. control retracting) Detailed statistics are found in Figure 3—source data 1.
-
Figure 3—source data 1
Statistical summary for Figure 3: ANOVA and key Tukey post-hoc tests and N and n values for Figure 3b,c,g,h.
- https://doi.org/10.7554/eLife.47566.028
-
Figure 3—source data 2
Individual values for RhoA activation and related values over fixed and longitudinal time courses (Figure 3b,c,g–i).
- https://doi.org/10.7554/eLife.47566.024
-
Figure 3—source data 3
Individual measurements for long-term Rho-GTPase measurements in Cos-7 cells (Figure 3—figure supplement 1b,d,f,h,j,k).
- https://doi.org/10.7554/eLife.47566.025
-
Figure 3—source data 4
Individual measurements of Rac1 and correlations between RhoA activation and growth (Figure 3—figure supplement 2b,c,e–g).
- https://doi.org/10.7554/eLife.47566.026
-
Figure 3—source data 5
Individual measurements of arbor parameters in control and RhoA KO mouse neurons (Figure 3—figure supplement 3b–e).
- https://doi.org/10.7554/eLife.47566.027
Figure 3—figure supplement 1
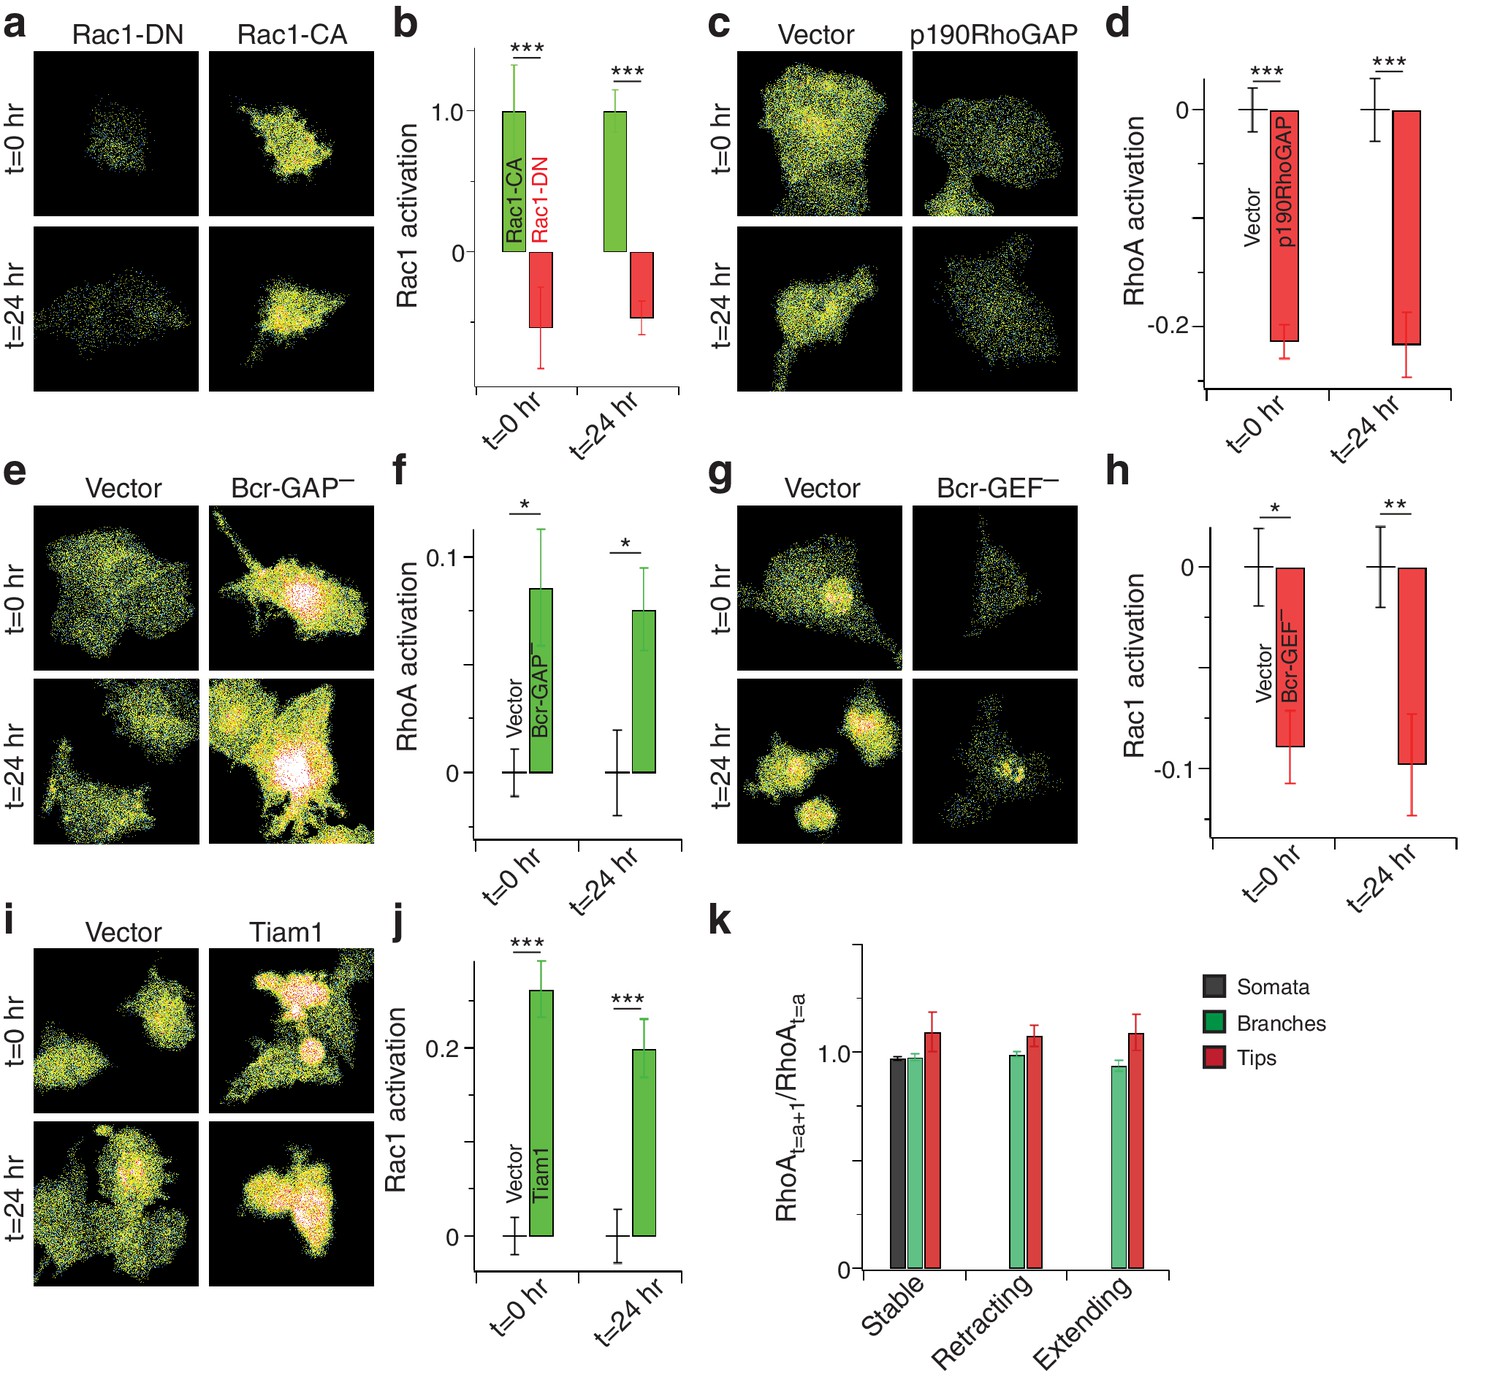
Long-term measurements of Rho-GTPase activation.
Raichu probes and RhoA-FLARE are generally used for short-term measurements, though they are in principle able to be calibrated (e.g., Palmer et al., 2004) and measurements from 10 hr up to 8 days have been reported (Kim et al., 2014; Konopka et al., 2016; Timpson et al., 2011). (a) Representative images of Cos-7 cells expressing Raichu-RhoA with the RhoA moiety mutated such that it is dominant negative (DN) or constitutively active (CA) taken from the same pool of cells 24 hr apart. (b) Summary data for this experiment. (N = 3, n = 30). (c) Representative images of Cos-7 cells expressing Raichu-RhoA and empty vector or the RhoA-GAP p190RhoGAP taken from the same pool 24 hr apart. (d) Summary data for this experiment. (N = 3, n = 80 for t = 0 hr and 60 for t = 24 hr) (e) Representative images of Cos-7 cells expressing Raichu-RhoA and empty vector or a Rac1-GAP-dead mutant of Bcr (i.e., a functional RhoA-GEF only) taken from the same pool of cells 24 hr apart. (f) Summary data for this experiment. (N = 3, n = 60 for t = 0 hr and 80 for t = 24 hr) (g) Representative images of Cos-7 cells expressing Raichu-Rac1 and empty vector or a RhoA-GEF-dead mutant of Bcr (i.e., a functional Rac1-GAP only) taken from the same pool of cells 24 hr apart. (h) Summary data for this experiment. (N = 3, n = 80) (i) Representative images of Cos-7 cells expressing Raichu-Rac1 and empty vector or the Rac1-GEF Tiam1 taken from the same pool of cells 24 hr apart. (j) Summary data for this experiment. (N = 3, n = 80 for t = 0 hr, 60 for vector t = 24 hr and 50 for Tiam1 t = 24 hr) (k) Summary data showing the quotient between measurements separated by 1 hr, taken from the experiments shown in Figure 3d–i at 18 DIV. These data show stability on a shorter time course that is comparable to the longer-term data that is presented in Figure 3. This is preserved across stable, retracting, and extending pools of dendrites and somata. (N = 5, n = 74 for somata, 115 for stable branches, 106 for stable tips, 134 for retracting branches, 131 for retracting tips, 96 for extending branches, and 94 or extending tips) Together, these data show that measurements are reasonably stable over 24 hr. Data are represented ± s.e.m. (***p<0.0001, **p<0.01, *p<0.05) Detailed statistics are found in Figure 3—figure supplement 1—source data 1.
-
Figure 3—figure supplement 1—source data 1
Statistical summary for Figure 3—figure supplement 1: ANOVA and key Tukey post-hoc tests and N and n values for Figure 3—figure supplement 1b,d,f,h,j.
- https://doi.org/10.7554/eLife.47566.019
Figure 3—figure supplement 2
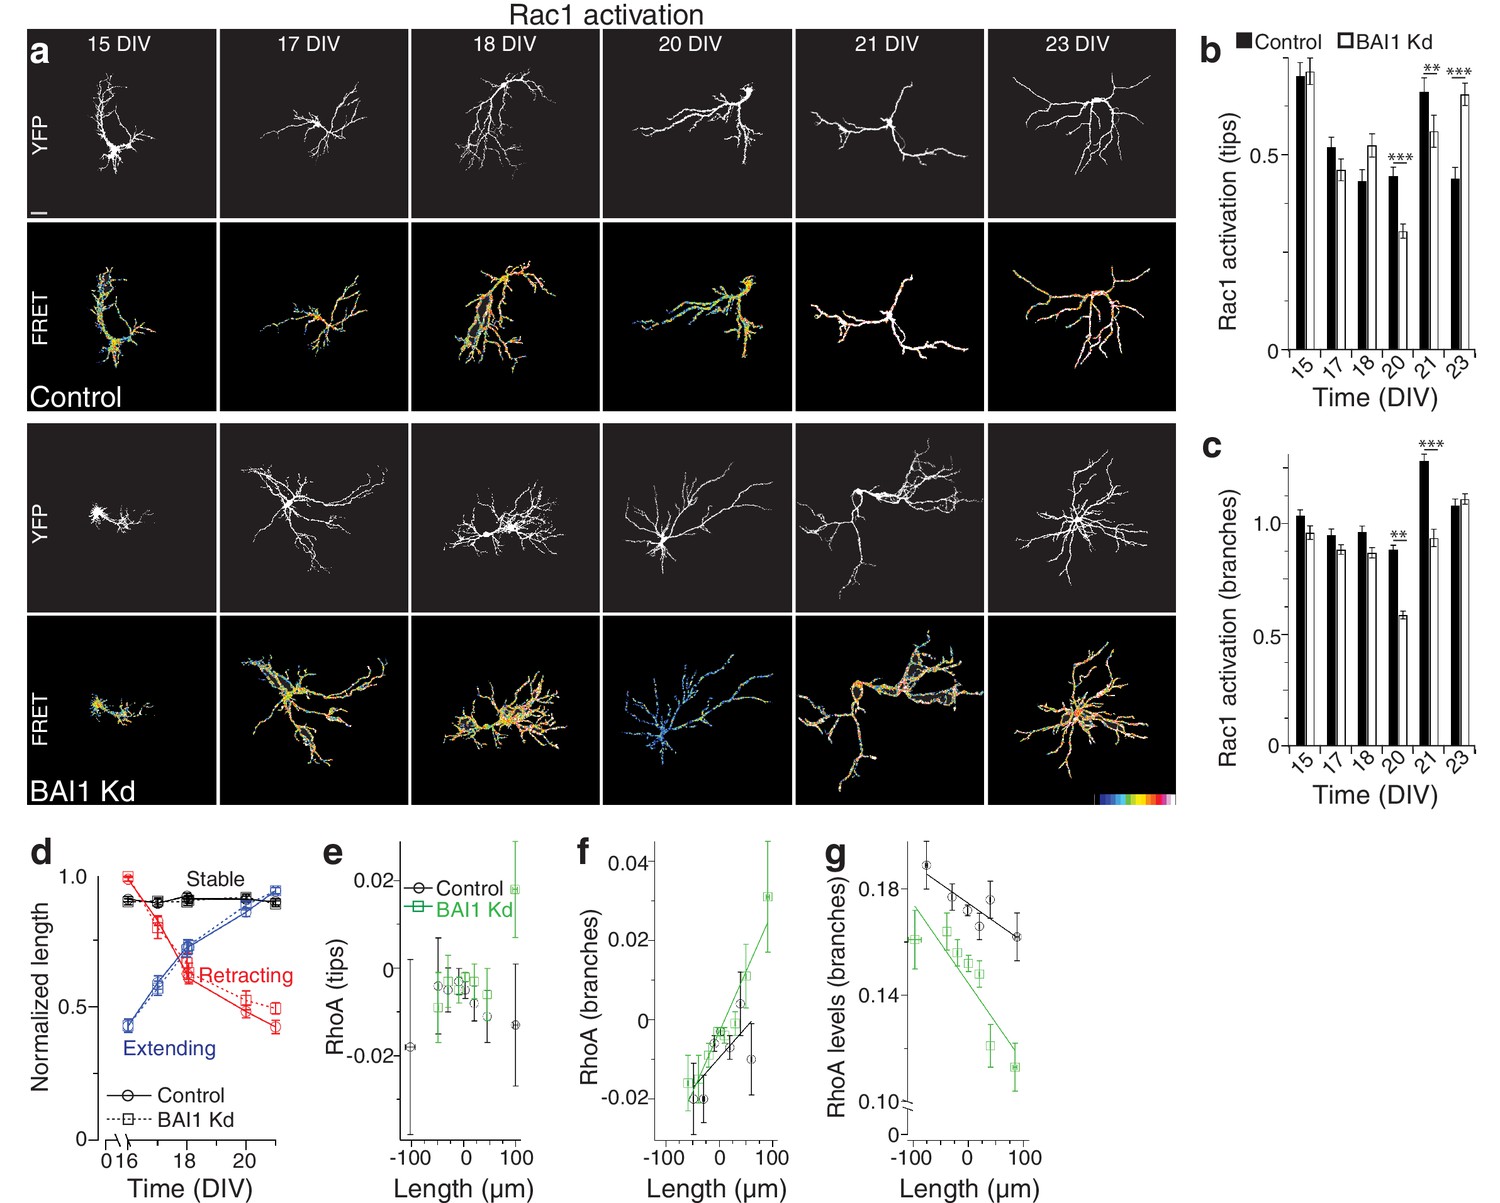
Effect of BAI1 Kd on dendritic Rac1 activation through development and lack of robust correlation of some RhoA parameters with dendrite growth.
(a) Representative images of hippocampal neurons expressing RaichuEV-Rac1 alone (control) or with shRNAs against Adgrb1 (BAI1 Kd) measured at the indicated times. Overall dendrite structure was ascertained by directly exciting the FRET acceptor (YFP images), while relative Rac1 activation is shown in the FRET images according to the color code in the lower right corner (low values on the left, high on the right, see Methods). Note that population growth trajectories in the RaichuEV-Rac1 expressing were similar to those observed in Figure 2. Images are masked to remove axons and dendrites from other neurons. Bar is 20 µm. (b) Summary data for Rac1 activation at dendrite tips. Total number of neurons: 51 and 52 for control and BAI1 Kd at 15 DIV, 54 and 41 at 17 DIV, 53 and 47 at 18 DIV, 41 and 36 at 20 DIV, 47 and 34 at 21 DIV, and 52 and 46 at 23 DIV (N = 5). There were no differences in Rac1 activation in control vs. BAI1 Kd neurons at dendrite tips (panels a,b), dendrite branch points (panels a,c), or whole dendrites (data not shown) until 20 DIV, when arborization differences in BAI1 Kd were already readily apparent (Panels d-f, Figure 2). Moreover, Rac1 was lower in BAI1 Kd neurons than in control neurons at 20 and 21 DIV, which would be expected to stunt dendritic growth. Thus, BAI1 signaling to Rac1 does not explain the phenomena exhibited in Figures 1–2. The elevation of Rac1 activation at dendrite tips at 23 DIV does indicate that Rac1 overactivation may drive dendrite overgrowth in BAI1 Kd neurons at or after the time frame of normal dendrite growth arrest on which we concentrate in this study. (d) Relative length trajectories for stable, retracting, and extending dendrites in control (circles, solid lines) and BAI1 Kd (squares, dashed lines). Maximum length of individuals throughout the time course was assigned a value of 1.0 and all other values calculated relative to this. Note that while the proportion of extending and retracting dendrites is different in control vs. BAI1 Kd neurons (Figure 3d), the extent to which individual dendrites extend or retract relative to their maximum length is the same in control and BAI1 Kd neurons. Total number of neurons is the same as in Figure 3i. e through g Correlation of different RhoA activation parameters in dendrites with dendrite growth behavior. All of the individual events between days in the time course shown in Figure 3e–f were pooled and arrayed as shown. Unlike the robust negative correlation between RhoA activation at dendrite tips shown in Figure 3i, the following correlations were not informative. Panel (e) shows the relationship between the change in RhoA activation at dendrite tips between time points and the accompanying changes in dendrite length. These changes were relatively small on average and the apparently positive correlation in the BAI1 Kd neurons is due to an outlier on the right whose ordinate is not significantly different from those of the other points in the BAI1 Kd series. Panel (f) shows the relationship between the change in RhoA activation at dendritic branch points and accompanying changes in dendrite length in control an BAI1 Kd neurons. The ordinates in the control pool have no significant differences, indicating that there is no relationship between the two. There is a positive correlation between the changes in RhoA activation at dendritic branch points and dendrite growth, indicating that these changes in RhoA activation may drive dendrite behavior in BAI1 Kd neurons, though they do not in wild type neurons. Panel (g) shows the correlation between the levels of RhoA at dendritic branch points and dendrite growth. There is negative correlation between these parameters in control neurons, and an even more robust negative correlation in BAI1 Kd neurons. These data further support the notion that RhoA activation levels at branch points drives dendrite growth in BAI1 Kd neurons, and this relationship is more compelling than that in Panel E. Data are represented ± s.e.m. (***p<0.0001, **p<0.01, *p<0.05) Detailed statistics are found in Figure 3—figure supplement 2—source data 1.
-
Figure 3—figure supplement 2—source data 1
Statistical summary for Figure 3—figure supplement 2: ANOVA and key Tukey post-hoc tests and N and n values for Figure 3—figure supplement 2b,c.
- https://doi.org/10.7554/eLife.47566.021
Figure 3—figure supplement 3
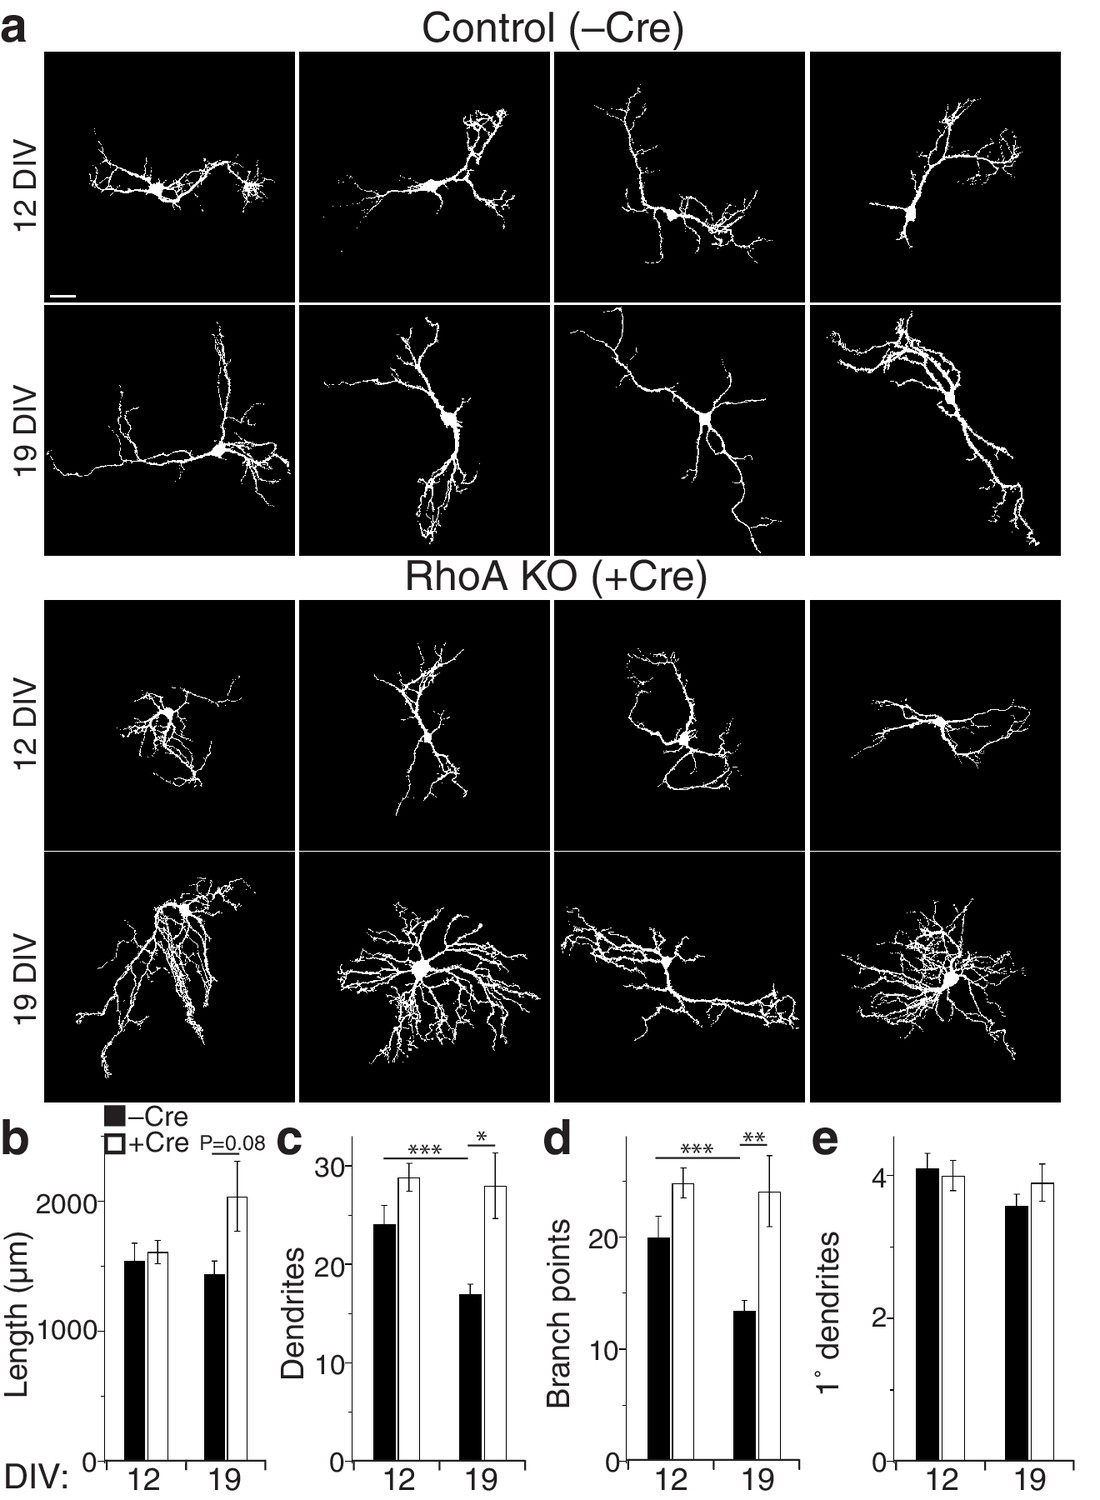
Loss of RhoA leads to late overgrowth of dendrites in mouse hippocampal neurons.
(a) Representative images of hippocampal cultures from RhoAflox/flox mice transfected with EGFP alone (Control) or EGFP plus Cre recombinase in order to remove RhoA (RhoA KO) and fixed at the indicated time points. Quadruplicate exemplars are shown. Images are masked to remove axons and dendrites from other neurons. Bar is 20 µm. (b) Summary data for dendrite length. (c) Summary data for dendrite number. (d) Summary data for braanch number. (e) Summary data for 1° dendrite number. Control mouse cultures achieved stable arbor length by 12 DIV, exhibiting no further growth at 19 DIV (Panels A,B). In contrast, RhoA KO neurons were the same length as control neurons at 12 DIV, but grew between 12 and 19 DIV (panels a,b). Interestingly, control neurons exhibited decreases in both dendrite number (panels a,c) and branch points (panels a,d) from 12 to 19 DIV, but RhoA KO neurons did not (panels a,c,d). RhoA KO had no effect on the number of primary dendrites (panels a,e). These data confirm that RhoA limits dendrite growth, primarily later in development. Data are represented ± s.e.m. (***p<0.0001, **p<0.01, *p<0.05) Detailed statistics are found in Figure 3—figure supplement 3—source data 1.
-
Figure 3—figure supplement 3—source data 1
Statistical summary for Figure 3—figure supplement 3: ANOVA and key Tukey post-hoc tests and N and n values for Figure 3—figure supplement 3b–e.
- https://doi.org/10.7554/eLife.47566.023
Figure 4 with 2 supplements
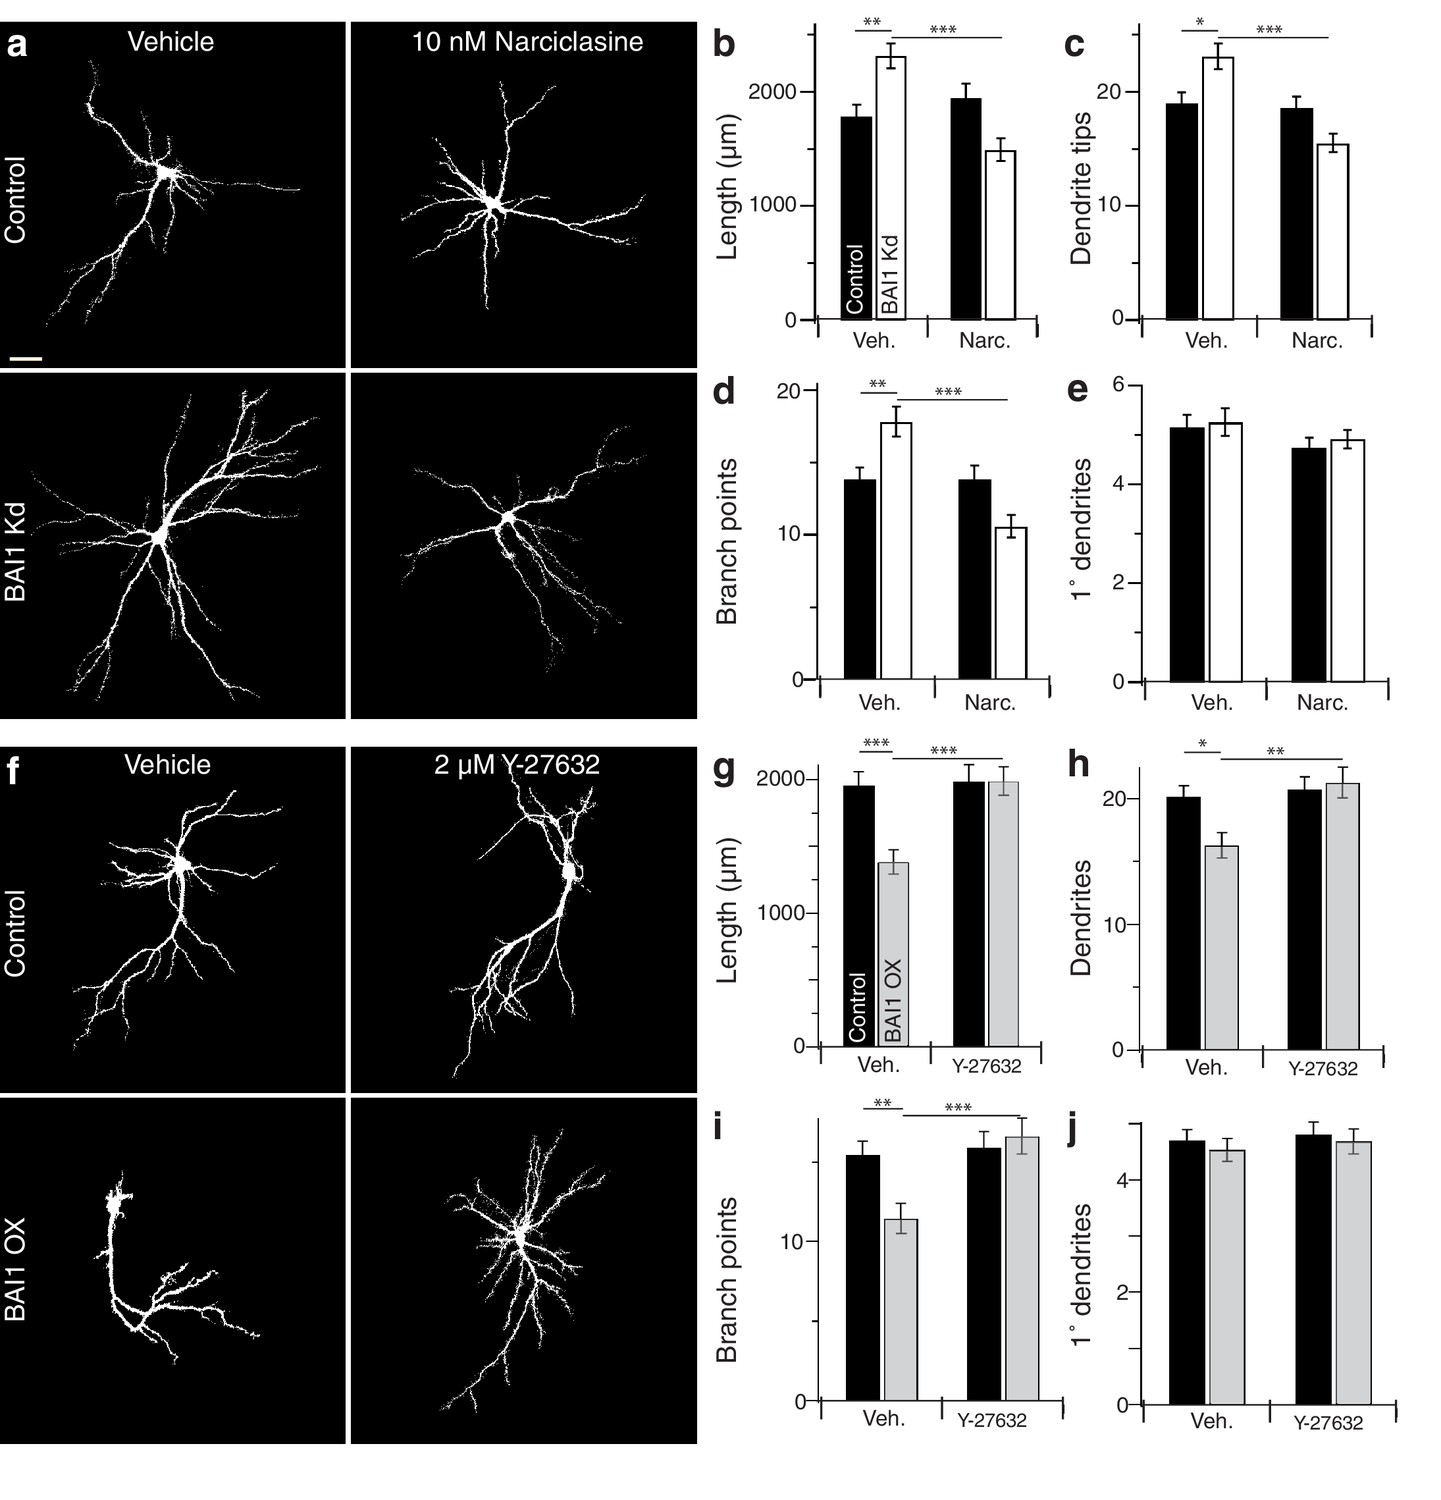
BAI1 manipulations are rescued by compensatory changes in RhoA signaling.
(a) Representative somatodendritic images of hippocampal neurons transfected with EGFP alone (control) or with shRNA against Adgrb1 (BAI1 Kd) treated with vehicle or 10 nM narciclasine at 17 DIV and fixed at 21 DIV. Images are masked to remove axons and dendrites from other neurons. Bar is 20 µm. (b) Summary data for dendrite length. (c) Summary data for dendrite number. (d) Summary data for branches. (e) Summary data for primary dendrites. Total number of neurons: 105 per condition (N = 3). (f) Representative somatodendritic images of hippocampal neurons transfected with EGFP alone (control) or with BAI1 (BAI1 OX) treated with vehicle or 2 µM Y-26732 at 17 DIV, fixed at 21 DIV and masked as in panel a. g) Summary data for dendrite length. (h) Summary data for dendrite number. (i) Summary data for branch number. (j) Summary data for primary dendrite number. Total number of neurons: 47 per condition (N = 4). Data are represented ± s.e.m. (***p<0.0001, **p<0.01, *p<0.05) Detailed statistics are found in Figure 4—source data 1.
-
Figure 4—source data 1
Statistical summary for Figure 4: ANOVA and key Tukey post-hoc tests and N and n values for Figure 4b–e,g–j.
- https://doi.org/10.7554/eLife.47566.037
-
Figure 4—source data 2
Individual measurements of arbor parameters for neurons treated with narciclasine and Y-27632 (Figure 4b–e,g–j).
- https://doi.org/10.7554/eLife.47566.034
-
Figure 4—source data 3
Individual measurements of narciclasine controls and Sholl analyses in narciclasine- and Y-27632-treated neurons (Figure 4—figure supplement 1b–g).
- https://doi.org/10.7554/eLife.47566.035
-
Figure 4—source data 4
Individual measurements of spine parameters in neurons treated with narciclasine (Figure 4—figure supplement 1b–e).
- https://doi.org/10.7554/eLife.47566.036
Figure 4—figure supplement 1
Verification of narciclasine function in neurons and Sholl analyses with RhoA manipulation.
(a) Representative image of hippocampal neurons expressing Raichu RhoA and treated with DMSO (Vehicle) or 10 nM narciclasine (10 nM Narc.) 1 hr after treatment. (b) Summary data for changes in RhoA activation during the 1 hr. incubation. (c) Summary data for Cos-7 cells expressing Raichu-RhoA or Raichu-Rac1 before (solid bars) or 20 min after (hatched bars) after treatment with 20 nM narciclasine. (N = 3, n = 20–40) d) and e) Summary data of Sholl analyses in vehicle-treated (c) and narciclasine-treated (d) control (black) and BAI1 Kd (green) neurons. Total number of neurons is the same as for Figure 4a–e. (f) and g) Summary data of Sholl analyses in vehicle-treated (e) and Y-27632-treated (f) control (black) and BAI1 OX (red) neurons. Total number of neurons is the same as for Figure 4f–j. (***p<0.001, §p<0.001 (green) between the two BAI1 Kd curves (green) in panels d and e, §p<0.01 (red) between the two BAI1 OX curves (red) in panels f and g) Detailed statistics are found in Figure 4—figure supplement 1—source data 1.
-
Figure 4—figure supplement 1—source data 1
Statistical summary for Figure 4—figure supplement 1: ANOVA and key Tukey post-hoc tests and N and n values for Figure 4—figure supplement 1b–g.
- https://doi.org/10.7554/eLife.47566.031
Figure 4—figure supplement 2

Effect of narciclasine on dendritic spines.
(a) Representative segments of secondary dendrites reconstructed from 3D stacks of hippocampal neurons transfected with EGFP and vector (pSuper) or shRNA against Adgrb1 (BAI1 Kd), treated with DMSO or 10 nM narciclasine at 17 DIV, and fixed at 21 DIV. Dendrite morphology is shown by EGFP (green), and neurons were also stained for BAI1 (red). (b) Summary data for spine density. (c) Summary data for filopod density. (d) Summary data for spine length. (e) Summary data for spine maximum diameter. Total number of neurons 30 for each condition (N = 3). Data are represented ± s.e.m. (***p<0.0001, **p<0.01, *p<0.05) Detailed statistics are found in Figure 4—figure supplement 2—source data 1.
-
Figure 4—figure supplement 2—source data 1
Statistical summary for Figure 4—figure supplement 2: ANOVA and key Tukey post-hoc tests and N and n values for Figure 4—figure supplement 2b–e.
- https://doi.org/10.7554/eLife.47566.033
Figure 5 with 2 supplements

BAI1 requires its extracellular segment to inhibit dendrite growth, but does not employ any known intracellular signaling modality to do so.
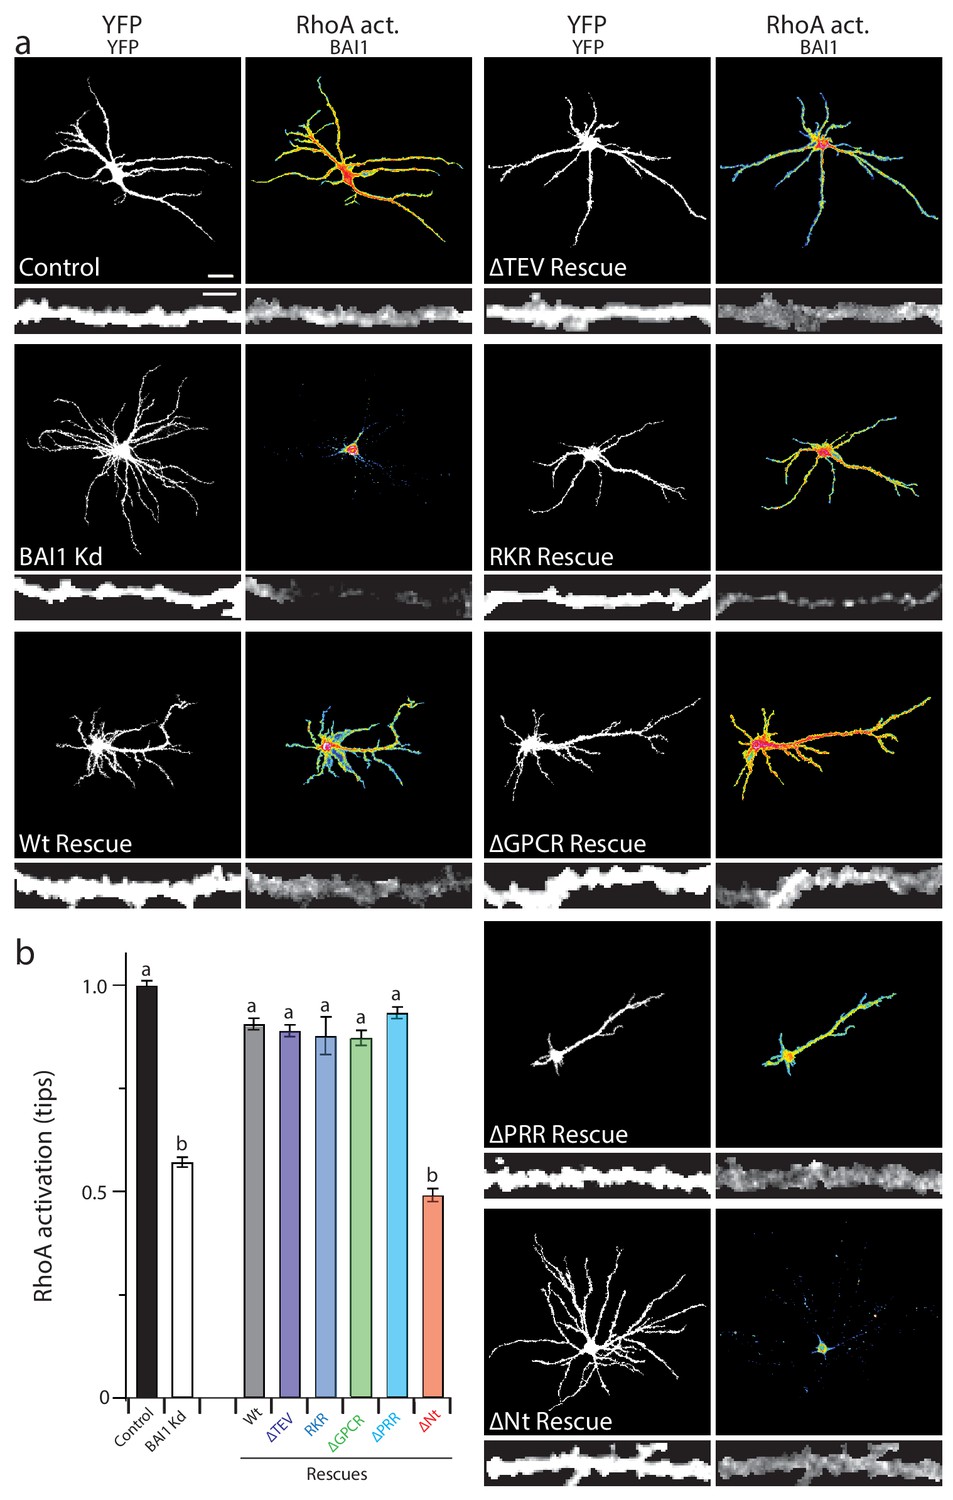
a through e Representative images of neurons expressing EGFP and control vector (Control), shRNA against Adgrb1 (BAI1 Kd), or shRNAs against BAI1 plus RNAi-resistant BAI1 (Wt rescue) or an RNAi-resistant BAI1 mutant (Mut. rescue). All images are masked to remove axons and dendrites from other neurons. The mutant used for rescue in each series is shown in cartoon form on the left. Mutants used included a deletion of the PDZ-binding core sequence (a), an RKR→AAA mutation in the helical domain that prevents ELMO1 binding (b), deletion of all but the first transmembrane domain of the GPCR domain (c), deletion of the proline-rich region (d), and deletion of the entire N-terminal extracellular segment between the signal sequence and the native autoproteolysis site (e). Representative EGFP images of the entire arbor are on top (bar is 20 µm), while EGFP and BAI1 immunochemistry images reconstructed from 3D confocal stacks of secondary dendrites taken from the same experiments are shown immediately under these (bar is 2.5 µm). (f) Summary data for dendrite length. (g) Summary data for dendrite number. (h) Summary data for branch number. Total number of neurons: 314 for control neurons (N = 24), 288 for BAI1 Kd neurons (N = 24), 235 for wt rescue neurons (N = 24), 29 for ∆TEV rescue neurons (N = 3), 86 for RKR rescue neurons (N = 9), 39 for ∆GPCR neurons (N = 3), 72 for ∆PRR neurons (N = 3), and 37 for (N = 3) for ∆Nterm. rescues. Data are represented ± s.e.m. (aP >0.05 within group a, but p<0.05 vs. group b; bP >0.05 within group b, but p<0.05 vs. group a.) Detailed statistics are found in Figure 5—source data 1.
-
Figure 5—source data 1
Statistical summary for Figure 5: ANOVA and key Tukey post-hoc tests and N and n values for Figure 5f–h.
- https://doi.org/10.7554/eLife.47566.044
-
Figure 5—source data 2
Individual measurements of dendritic parameters in control neurons and those with molecular replacements with BAI1 mutants (Figure 5).
- https://doi.org/10.7554/eLife.47566.042
-
Figure 5—source data 3
Individual measurements of primary dendrites in molecular replacement experiments and dendrite arbor lengths when neuronal activity is modulated (Figure 5—figure supplement 1b,i).
- https://doi.org/10.7554/eLife.47566.043
Figure 5—figure supplement 1
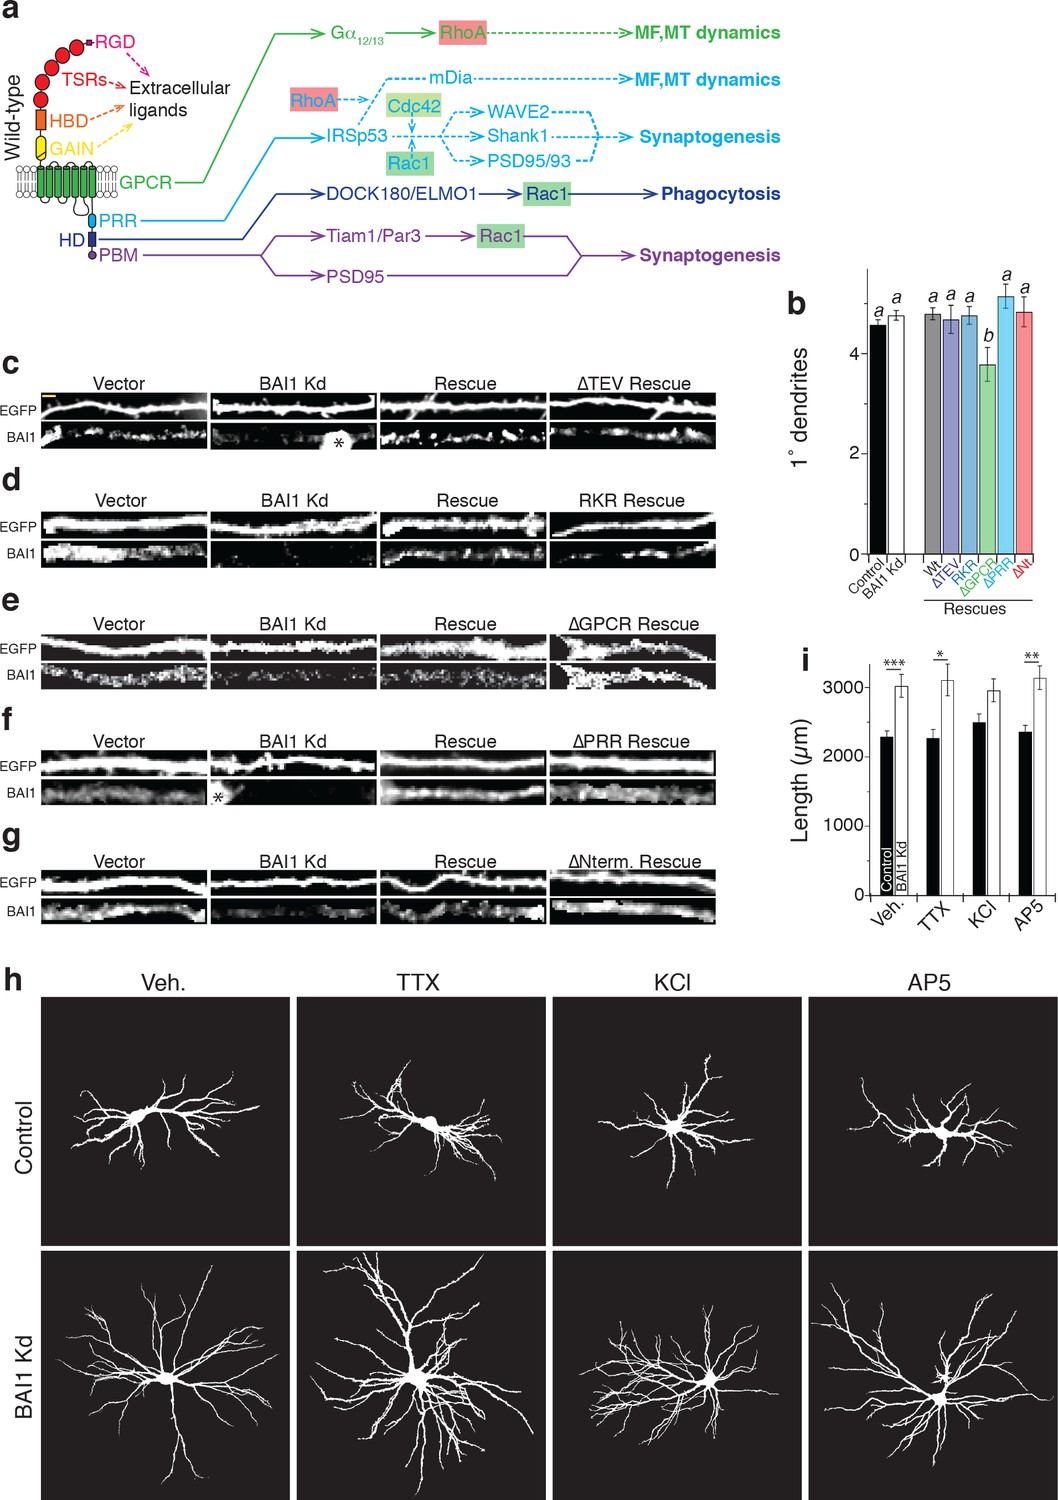
Signaling pathways downstream of BAI1; 1° dendrites in molecular replacement studies; and effect of activity on arbor form.
(a) Cartoon showing the domain structure of BAI1 (left), along with functions traced to different intracellular domains of BAI1. Connections depicted in solid lines indicate published connections to BAI1, while dotted lines show published relationships between downstream effectors of BAI1 and other signaling components that have not (yet) been definitively linked to BAI1. Abbreviations: RGD: arginine-glycine-aspartate integrin-binding motif; TSRs: thrombospondin repeats; HBD: hormone-binding domain; GAIN: G-protein autoproteolysis inducing domain; GPCR: G-protein coupled receptor domain; PRR: proline-rich region; HD: helical domain; and PBM: TEV-based PDZ-binding motif (Park et al., 2007; Duman et al., 2013; Zhu et al., 2015; Duman et al., 2016; Stephenson et al., 2013; Ridley, 2006; Kang et al., 2016). (b) Summary data for 1° dendrite number in the molecular replacement studies shown in Figure 6. aP >0.05 within group a, but p<0.05 vs. group b; bP >0.05 within group b, but p<0.05 vs. group a. Total number of neurons is the same as in Figure 5. c through g Representative images of sections of dendrites from the neurons in Figure 6 with BAI1 staining. These images are digital enlargements of the neurons shown in the figure to indicate relative BAI1 levels. Panel c shows the experiment with the ∆TEV mutant, panel d with the RKR mutant, panel e with the ∆GPCR mutant, panel f with the ∆PRR mutant, and panel g with the ∆Nterm. mutant. In panels c and f, the dendrite segment impinges on the cell body of an untransfected neuron, indicated by a *. These images show that the neurons shown in Figure 5 express the appropriate levels of BAI1 for their respective conditions. (h) Representative images of hippocampal neurons transfected pSuper or shRNA against Adgrb1 (BAI1 Kd) and treated with the indicated drugs at 17 DIV and imaged at 21 DIV. Treatments included a vehicle control (Veh.), tetrodotoxin to silence neurons (TTX), potassium chloride to increase neuronal excitability (KCl), and AP5 to block NMDA receptors (AP5). All images were masked to exclude axons and dendrites from other neurons. (i) Summary data of arbor length. Total number of neurons: 95 for control vehicle, 81 for BAI1 Kd vehicle, 41 for control TTX, 49 for BAI1 Kd TTX, 69 for control KCl, 54 for BAI1 Kd KCl, 75 for control AP5, and 63 BAI1 Kd AP5 (N = 5). Data are represented ± s.e.m. . (***p<0.0001, **p<0.01, *p<0.05) Detailed statistics are found in Figure 5—figure supplement 1—source data 1.
-
Figure 5—figure supplement 1—source data 1
Statistical summary for Figure 5—figure supplement 1 and summary of ANOVA and key Tukey post-hoc tests and N and n values for Figure 5—figure supplement 1b, i.
- https://doi.org/10.7554/eLife.47566.040
Figure 5—figure supplement 2
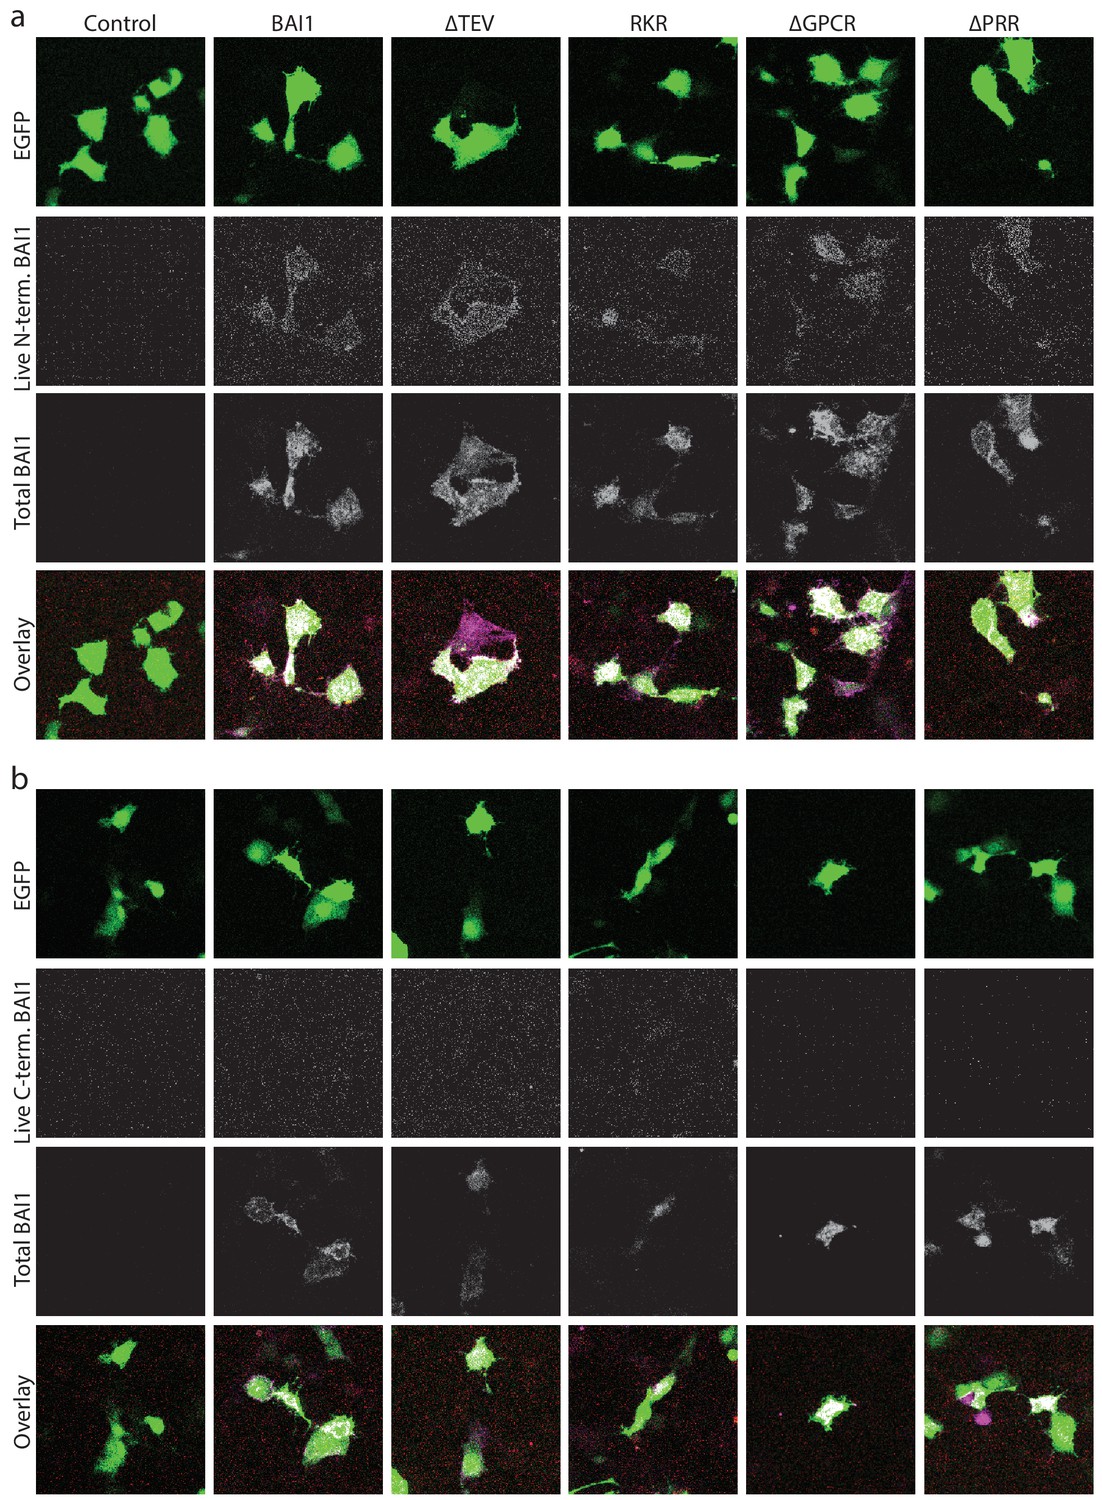
Surface labeling of BAI1 and mutants.
(a) Representative images of Cos-7 cells expressing EGFP and empty vector (Control), wild-type BAI1 (BAI1) or the indicated BAI1 mutants live surface labeled using a polyclonal antibody against an extracellular N-terminal epitope on BAI1, then washed, fixed, permeabilized and labeled with an antibody against the intracellular C-terminal tail of BAI1. Shown are the EGFP expression, N-terminal labeling (live, N-terminal), total BAI1 labeling (permeabilized, C-terminal), and an overlay of all of these signals. (b) Representative images of an experiment identical to that in panel a, but live labeled with the C-terminal antibody instead of the N-terminal antibody. The ∆N-term. mutant was not amenable to this analysis because it does not contain the N-terminal epitope. However, we previously demonstrated that this mutant is surface localized using an N-terminal flag-tag (Tu et al., 2018). All experiments were repeated three independent times with similar results.
Figure 6
Proper RhoA activation is required for rescue of the BAI1 Kd-mediated dendrite overgrowth.
(a) Representative images of hippocampal neurons expressing the RhoA activation reporter RhoA-FLARE, along with control vector (control), shRNA against Adgrb1 (BAI1 Kd), or shRNA against BAI1 and RNAi-resistant BAI1 (Wt rescue) or the indicated RNAi-resistant mutants (see Figure 6). The 4-panel cluster for each condition consists of an image of the complete somatodendritic domain obtained by direct excitation of the acceptor (YFP images, upper left; bar is 20 µm), a map of RhoA activation color-coded according the scale in Figure 3 (RhoA Act., upper right), and digitally magnified stretches of dendrite showing morphology obtained by direct excitation of the acceptor (YFP, lower left; bar is 5 µm), and BAI1 immunostaining (BAI1, lower right). Images are masked to remove axons and dendrites from other neurons. (b) Summary data of RhoA activation at dendritic tips. Total number of dendrite tips: 670 for controls, 495 for BAI1 Kd, 630 for wt rescues, 640 for ∆TEV rescues, 60 for RKR rescues, 40 for ∆GPCR rescues, 635 for ∆PRR rescues, and 55 for ∆Nterm. rescues (N = 5). Data are represented ± s.e.m. (aP >0.05 within group a, but p<0.05 vs. group b; bP >0.05 within group b, but p<0.05 vs. group a.) Detailed statistics are found in Figure 6—source data 1.
-
Figure 6—source data 1
Statistical summary for Figure 6: ANOVA and key Tukey post-hoc tests and N and n values for (Figure 6b).
- https://doi.org/10.7554/eLife.47566.047
-
Figure 6—source data 2
Individual measurements of RhoA activation at dendrite tips in molecular replacement experiments (Figure 6b).
- https://doi.org/10.7554/eLife.47566.046
Figure 7 with 1 supplement
BAI1 signals to RhoA via Bcr.
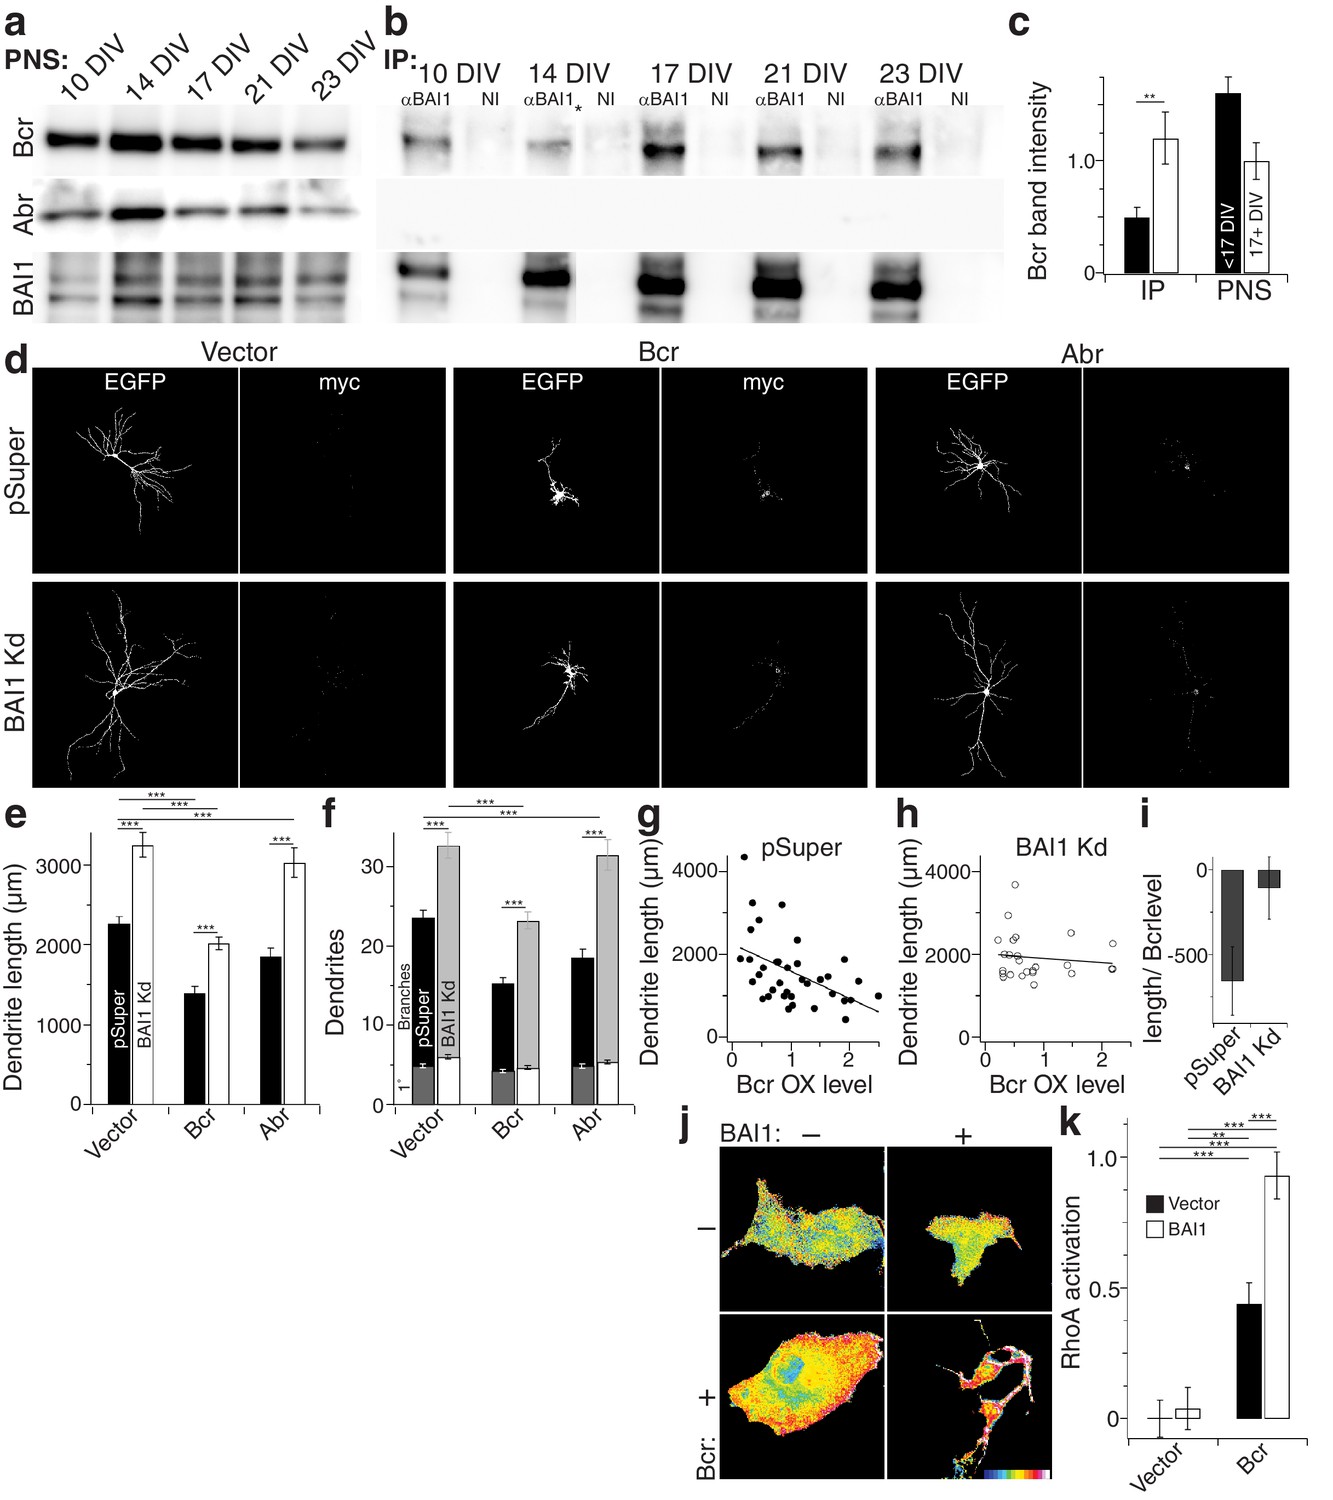
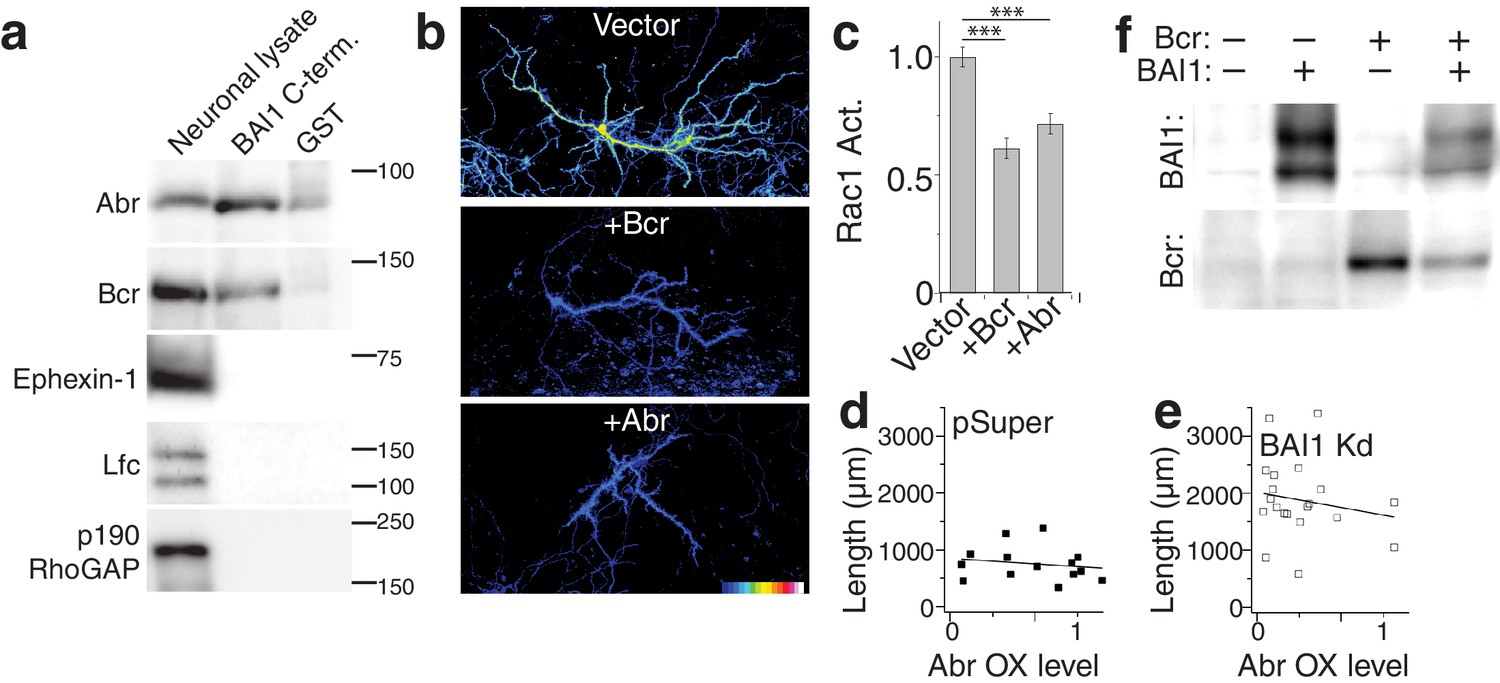
(a) Representative Western blots of Bcr, Abr, and BAI1 from primary hippocampal postnuclear supernatants (PNS) prepared at the indicated times from the same preparation. (b) Representative immunoprecipitations from the PNSs in panel a using an antibody against the C-terminus of BAI1 or non-immune serum (NI). A lane was removed from this blot due to a loading irregularity, and this is marked by an asterisk (*). (c) Summary data of Bcr band intensity from the experiment in panels a and b. Total number of preparations: N = 5. (d) Representative images of hippocampal neurons expressing EGFP and control shRNA vector (pSuper) or shRNA against Adgrb1 (BAI1 Kd) and control myc-vector (vector), myc-tagged Bcr, or myc-tagged Abr. (e) Summary data of dendrite length in the experiment in panel d. (f) Summary data of dendrite and branch number in the experiment in panel d. (g) Scatter plot of dendrite length vs. quantified myc level in Vector pSuper neurons including a linear fit of the data. (h) Same as panel g, except for Bcr BAI1 Kd neurons. (i) Slopes of the lines in panels g and h, shown with 95% confidence intervals. (j) Representative images of Cos-7 cells expressing Raichu-RhoA and the indicated combinations of BAI1 and Bcr. RhoA activation is shown in the FRET images according to the color code in the lower right corner (low values on the left, high on the right). (k) Summary data of RhoA activation at the plasma membrane. Total number of cells: 452 for all conditions (N = 10). Data are represented ± s.e.m. except for panel i. (***p<0.0001, **p<0.01, *p<0.05) Detailed statistics are found in Figure 7—source data 1.
-
Figure 7—source data 1
Statistical summary for Figure 7: ANOVA and key Tukey post-hoc tests and N and n values for Figure 7c,e,f,k.
- https://doi.org/10.7554/eLife.47566.053
-
Figure 7—source data 2
Individual measurements of Western blot bands, arbor parameters with Bcr and Abr, and Cos-7 RhoA activation (Figure 7c,e,f,k).
- https://doi.org/10.7554/eLife.47566.051
-
Figure 7—source data 3
Individual measurements of Rac1 activation in control, Abr-, and Bcr-expressing neurons (Figure 7—figure supplement 1c).
- https://doi.org/10.7554/eLife.47566.052
Figure 7—figure supplement 1
Bcr functionally interacts with BAI1, while Abr does not.
(a) Representative blot of an experiment in which the intracellular C-terminus of BAI1 was immobilized on GST-agarose and incubated with adult rat brain lysate. After washing, samples were separated on SDS-PAGE and subjected to Western blotting for various RhoA regulatory proteins. Neuronal lysates are shown as a positive control, and GST-agarose as a negative control. This experiment was repeated three times. (b) Representative images of neurons expressing the Rac1 activity reporter RaichuEV and empty vector, Bcr, or Abr at 21 DIV. The scale for Rac1 activation is located in the lower right corner of the Abr image. (c) Summary data of Rac1 activation. Total number of neurons: 33 for control neurons, 33 for Bcr neurons, and 29 for Abr neurons. Data are represented ± s.e.m. (d) Scatter plot of dendrite length vs. quantified myc level in Vector pSuper neurons including a linear fit of the data. (e) Same as panel d, except for Abr BAI1 Kd neurons. Note the similarity of the slopes (axes are the same) in the two panels. (f) Western blot of Cos-7 extracts from the experiment shown in Figure 7k. (***p<0.0001, **p<0.01, *p<0.05) Detailed statistics are found in Figure 7—figure supplement 1—source data 1.
-
Figure 7—figure supplement 1—source data 1
Statistical summary for Figure 7—figure supplement 1: ANOVA and key Tukey post-hoc tests and N and n values for Figure 7—figure supplement 1c.
- https://doi.org/10.7554/eLife.47566.050
Figure 8
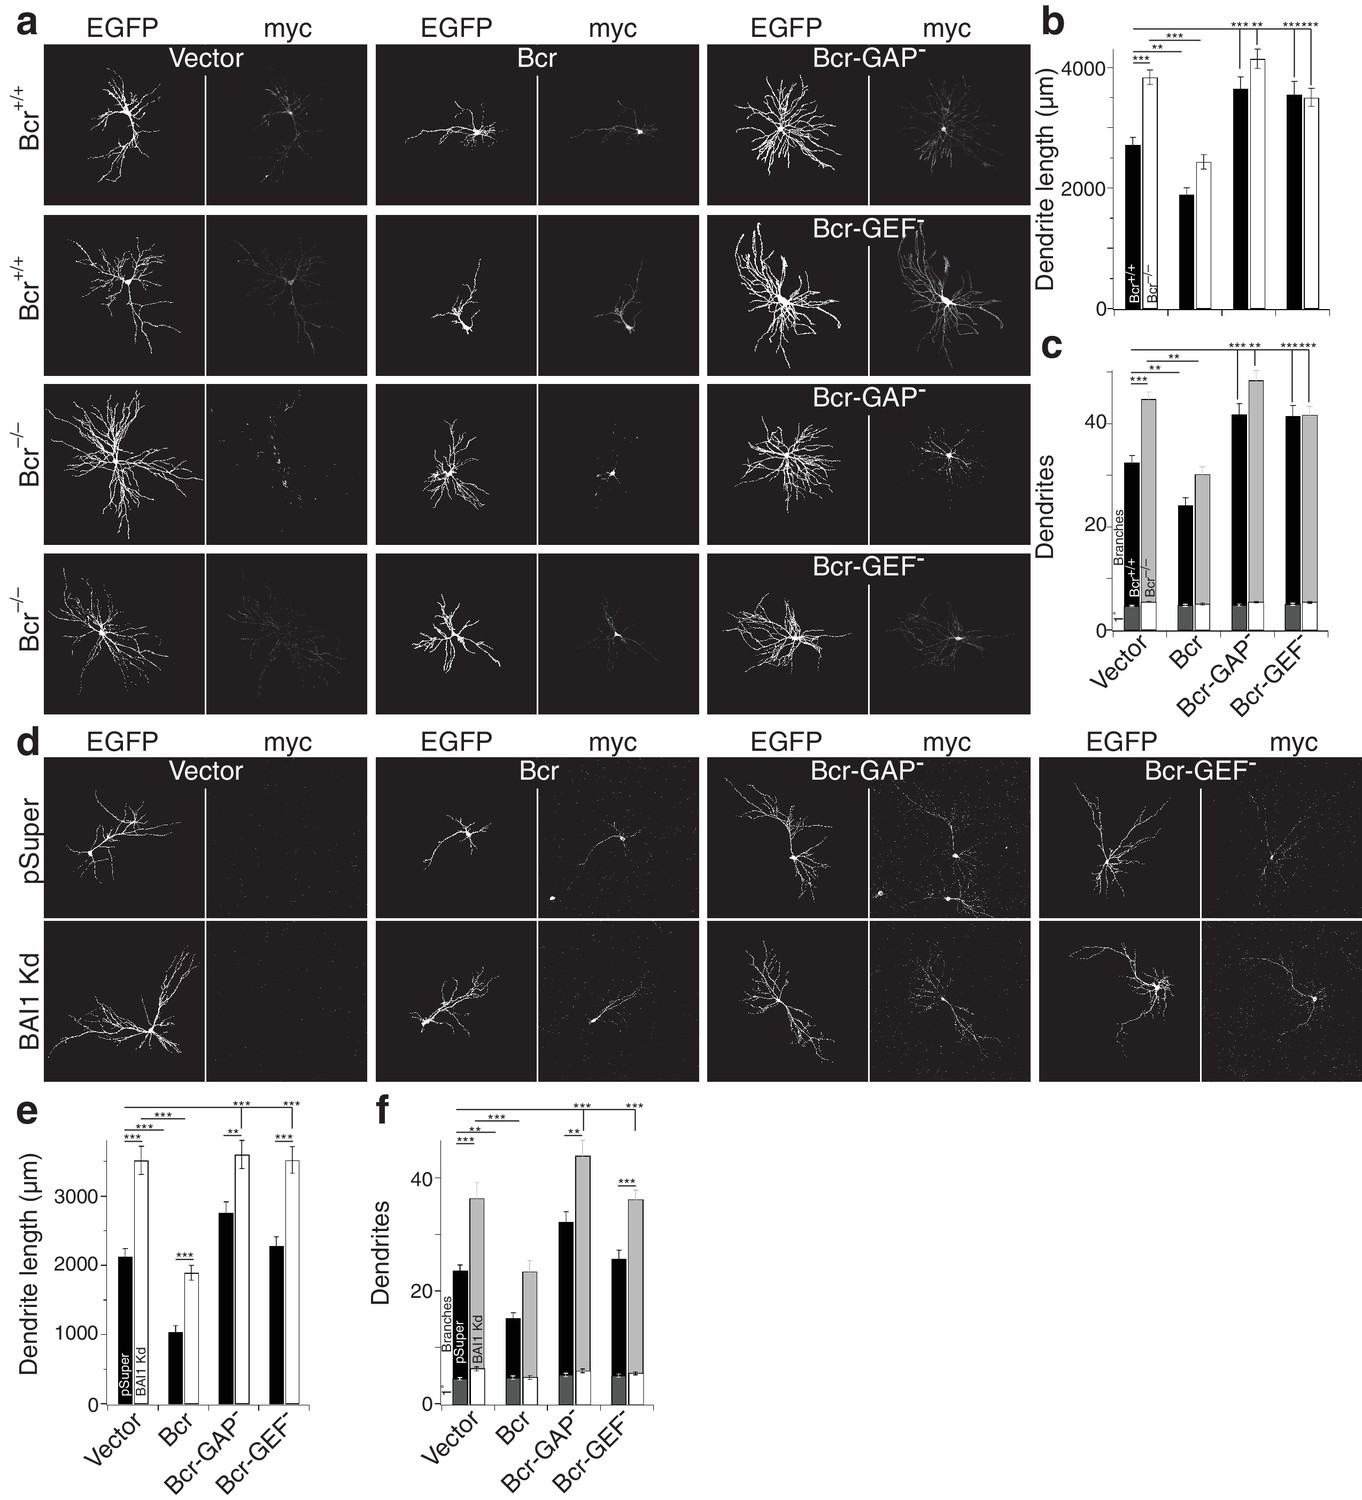
Both the RhoA-GEF and Rac1-GAP functions of Bcr are required for dendrite growth arrest.
(a) Representative images of mouse neurons with the indicated genotype expressing EGFP, pSuper or shRNA against Adgrb1, and empty vector (Vector), wild-type Bcr (Bcr), GAP-dead Bcr (Bcr-GAP–), or GEF-dead Bcr (Bcr-GEF–). All cells within a row were cultured from the same individual mouse. (b) Summary data of dendrite length. (c) Summary data for dendrite numbers and branches. Total number of neurons: 147 for Bcr+/+ Vector, 82 for Bcr+/+ Bcr, 69 Bcr+/+ Bcr-GAP–, 69 Bcr+/+-GEF–, 177 for Bcr–/– Vector, 99 for Bcr–/– Bcr, 75 Bcr–/– Bcr-GAP–, and 109 for Bcr–/– Bcr-GEF– (N = 6–12). (d) Representative images of rat neurons expressing EGFP and pSuper or BAI1 Kd and the vectors as described in panel a. (e) Summary data of dendrite length. (f) Summary data of dendrite number and branches. Total number of neurons: 52 for pSuper Vector, 52 for pSuper Bcr, 37 pSuper Bcr-GAP–, 60 for pSuper Bcr-GEF–, 34 for BAI1 Kd Vector, 43 BAI1 Kd Bcr, 33 BAI1 Kd Bcr-GAP–, and 47 BAI1 Kd Bcr-GEF– (N = 5). Data are represented ± s.e.m. (***p<0.0001, **p<0.01, *p<0.05) Detailed statistics are found sin Figure 8—source data 1.
-
Figure 8—source data 1
Statistical summary for Figure 8: ANOVA and key Tukey post-hoc tests and N and n values for Figure 8b,c,e,f.
- https://doi.org/10.7554/eLife.47566.056
-
Figure 8—source data 2
Individual arbor parameters for mouse and rat neurons expressing different forms of Bcr Figure 8B,C,E,F.
- https://doi.org/10.7554/eLife.47566.055
Figure 9

Mechanisms for BAI1’s action promoting axo-dendritic contacts yet inhibiting dendro-dendritic contacts.
Previous work revealed that BAI1 interacts with PSD95 (Zhu et al., 2015) and Tiam1/Par3 by which it activates Rac1, promoting synaptogenesis and spinogenesis (Duman et al., 2013). Moreover, BAI1 interacts with the synaptic organizer neuroligin 1 (NRLN1) and is required for NRLN1’s ability to promote synaptogenesis (Tu et al., 2018) and directs presynaptic differentiation through an unknown mechanism (Tu et al., 2018). NRLN1 also interacts with neurexin-1 (NRXN1) and with NMDA receptors via PSD95 (Mondin et al., 2011). This study reveals an interaction between BAI1 and Bcr that promotes RhoA activation and restricts overall dendrite growth. Bcr also inhibits Rac1, which opposes RhoA activation in promoting dendrite growth.
Tables
Key resources table
| Reagent type (species) or resource | Designation | Source or reference | Identifiers | Additional information |
|---|---|---|---|---|
| Gene (Homo sapiens) | ADGRB1 | NA | Gene ID:575 | |
| Gene (Rattus norvegicus) | ADGRB1 | NA | Gene ID:362931 | |
| Gene (H. sapiens) | BCR | NA | Gene ID:613 | |
| Gene (Mus musculus) | BCR | NA | Gene ID:110279 | |
| Gene (M. musculus) | RHOA | NA | Gene ID:11848 | |
| Strain (M. musculus) | RhoAflox/flox | PMID:23825607 | ||
| Strain (M. musculus) | Bcr KO | Jackson Labs | Stock no. 026396 | |
| Strain (R. norvegicus) | Long-Evans | Envigo, Charles River | HsdBlu:LE (E); Strain 006 (CR); RRID:RGD_2308852 | Timed pregnant females |
| Cell line (Cercopithecus aethiops) | Cos-7 | ATCC | CRL-1651; RRID:CVCL_0224 | |
| Antibody | anti-BAI1 (C-terminal) (rabbit polyclonal) | PMID:23595754 | 2525 | 0.001 mg/ml for WB, IHC, ICC; 1 µg/1.3E6 neurons for IP |
| Antibody | anti-BAI1 (N-terminal) (rabbit polyclonal) (H-270) | Santa Cruz Biotechnology | Santa Cruz:sc-66815; RRID:AB_2062912 | (1:500) |
| Antibody | anti-Bcr (rabbit polyclonal) (N-20) | Santa Cruz Biotechnology | Santa Cruz:sc-885; RRID:AB_2274682 | (1:500) |
| Antibody | anti-Abr (mouse monoclonal) (Lin et al., 2013) | Santa Cruz Biotechnology | Santa Cruz:sc-135821; RRID:AB_2221350 | (1:1000) |
| Antibody | anti-c-myc (mouse monoclonal) (9E10) | Santa Cruz Biotechnology | Santa Cruz:sc-40;RRID:AB_627268 | (1:1000) |
| Antibody | anti-BAI2 (extracellular) (rabbit polyclonal) | Alomone Labs | Alomone:ABR-022; RRID:AB_2756544 | (1:1000) |
| Antibody | anti-BAI3 (rabbit polyclonal) | Sigma-Aldrich | Sigma-Aldrich:HPA015963; RRID:AB_1845263 | (1:500) |
| Antibody | anti-actin (clone C4) (mouse monoclonal) | Millipore | Millipore:MAB1501; RRID:AB_2223041 | (1:10,000) |
| Antibody | Cy3-anti-rabbit secondary | Jackson ImmunoResearch Laboratories | Jackson ImmunoResearch:115165003; RRID: AB_2338000 | (1:500) |
| Antibody | Cy3-anti-mouse secondary | Jackson ImmunoResearch Laboratories | Jackson ImmunoResearch:115165146; RRID:AB_2338690 | (1:500) |
| Antibody | HRP-anti-rabbit secondary | Millipore | Millipore:401393; RRID:AB_437797 | (1:20,000) |
| Antibody | HRP-anti-mouse secondary | Millipore | Millipore:401215; RRID:AB_10682749 | (1:20,000) |
| Recombinant DNA reagent | pCMV-EGFP | Connie Cepko | RRID:Addgene_11153 | |
| Recombinant DNA reagent | pcDNA3.1-mRuby2 | Michael Lin | RRID:Addgene_40260 | |
| Recombinant DNA reagent | pCx-EGFP | PMID:23595754 | ||
| Recombinant DNA reagent | pRaichu-Raichu-Rac1 | PMID:16472667 | 1034X | |
| Recombinant DNA reagent | pRaichu-Raichu-RhoA | PMID:16472667 | 1298X | |
| Recombinant DNA reagent | pRaichu-Raichu-Rac1-DN | PMID:16472667 | 1013X | |
| Recombinant DNA reagent | pRaichu-Raichu-Rac1-CA | PMID:16472667 | 1012X | |
| Recombinant DNA reagent | pSuper | Oligoengine | Oligoengine: VEC-pBS-0002 | PMID:11910072 |
| Recombinant DNA reagent | pSuper-shRNA1 | PMID:23595754 | 5’-GCCCAAATACAGCATCAACA-3’ | |
| Recombinant DNA reagent | pSuper-shRNA2 | PMID:23595754 | 5’-CCCGGACCCTCGTCGTTAC-3’ | |
| Recombinant DNA reagent | pcDNA3.1-BAI1 | PMID:9533023 | ||
| Recombinant DNA reagent | pcDNA3.1-BAI1•∆TEV | PMID:23595754 | ||
| Recombinant DNA reagent | pcDNA3.1-BAI1•∆N-term. | PMID:30120207 | ||
| Recombinant DNA reagent | pcDNA3.1-BAI1•RKR | PMID:17960134 | K. Ravichandran (University of Virginia) | |
| Recombinant DNA reagent | pcDNA3.1-BAI1•∆GPCR | this paper | available upon request from K. Tolias | |
| Recombinant DNA reagent | pcDNA3.1-BAI1•∆PRR | this paper | available upon request from K. Tolias | |
| Recombinant DNA reagent | pcDNA3.1 (+) | ThermoFisher Scientific | ThermoFisher Scientific:V790-20 | |
| Recombinant DNA reagent | pCMVmyc-Bcr | PMID:24960694 | ||
| Recombinant DNA reagent | pCMVmyc-Abr | PMID:24960694 | ||
| Recombinant DNA reagent | pCMVmyc-Bcr-GAP-dead | PMID:24960694 | myc-Bcr-GAP-dead | (R1090A) |
| Recombinant DNA reagent | pCMVmyc-Bcr-GEF-dead | this paper | Myc-Bcr-GEF-dead | (N689A/E690A) available upon request |
| Recombinant DNA reagent | pCMV-myc | Clontech | Clontech:635689 | |
| Recombinant DNA reagent | pGEX-4T1 | Amersham | Amersham:27458001 | |
| Recombinant DNA reagent | pGEX-4T1-BAI1-C-term. | this paper | available upon request from K. Tolias | |
| Sequence-based reagent | 5'-GGAGGGCAGAGGCTGTGAG-3' | this paper | BAI1 forward primer | available upon request from K. Tolias |
| Sequence-based reagent | 5'-GCAGAGGCTCCAGGGTGAC-3' | this paper | BAI1 reverse primer | available upon request from K. Tolias |
| Sequence-based reagent | 5’-ATGACCGACTTCGAGAAGGACG-3’ | PMID:15225653 | BAI2 forward primer | |
| Sequence-based reagent | 5’-CTGCACGTCATCAGCGGAAG-3’ | this paper | BAI2 reverse primer | available upon request from K. Tolias |
| Sequence- based reagent | 5’-TAACCGGCCAGCAGTGTGAAG-3’ | PMID:24567399 | BAI3 forward primer | |
| Sequence- based reagent | 5’-CATTCCATCACCTGCCAGCAT C-3’ | this paper | BAI3 reverse primer | available upon request from K. Tolias |
| Sequence-based reagent | 5’-GATGATATCGCCGCGCTCGTC-3’ | PMID:15225653 | actin forward primer | |
| Sequence-based reagent | 5’-AGCCAGGTCCAGACGCAGGAT-3’ | PMID:15225653 | actin reverse primer | |
| Commercial assay or kit | UltraLink BioSupport | ThermoFisher Scientific | ThermoFisher Scientific:53110 | |
| Chemical compound, drug | tetradotoxin | Tocris | Tocris:1078 | |
| Chemical compound, drug | narciclasine | Tocris | Tocris:3715/1 | |
| Chemical compound, drug | D-AP5 | Tocris | Tocris:0106/1 | |
| Chemical compound, drug | Y-27632 dihydrochloride | Tocris | Tocris:TB1254-GMP/10 | |
| Chemical compound, drug | Potassium chloride | ThermoFisher Scientific | ThermoFisher Scientific:p217 | |
| Software, algorithm | Imaris | Oxford Instruments | RRID:SCR_007370; RRID:SCR_007366 | Version 9.2.1 |
| Software, algorithm | Fiji | PMID:22743772 | RRID:SCR_002285 | |
| Software, algorithm | Sholl analysis plugin | PMID:25264773 | ||
| Software, algorithm | PIXFRET | PMID:16208719 | ||
| Software, algorithm | riFRET | PMID:19591240 | ||
| Software, algorithm | Zen | Carl Zeiss. Jena, Germany | RRID:SCR_013672 | Version 2.3 |
| Software, algorithm | Prism | Graph Pad | RRID:SCR_002798 | Version 8 |
Additional files
-
Transparent reporting form
- https://doi.org/10.7554/eLife.47566.058
Download links
A two-part list of links to download the article, or parts of the article, in various formats.
Downloads (link to download the article as PDF)
Open citations (links to open the citations from this article in various online reference manager services)
Cite this article (links to download the citations from this article in formats compatible with various reference manager tools)
The adhesion-GPCR BAI1 shapes dendritic arbors via Bcr-mediated RhoA activation causing late growth arrest
eLife 8:e47566.
https://doi.org/10.7554/eLife.47566


