Toxoplasma gondii infection drives conversion of NK cells into ILC1-like cells
- Washington University School of Medicine, United States
- ITMO University, Russia
- Ohio State University Wexner School of Medicine, United States
Figures
Figure 1 with 1 supplement
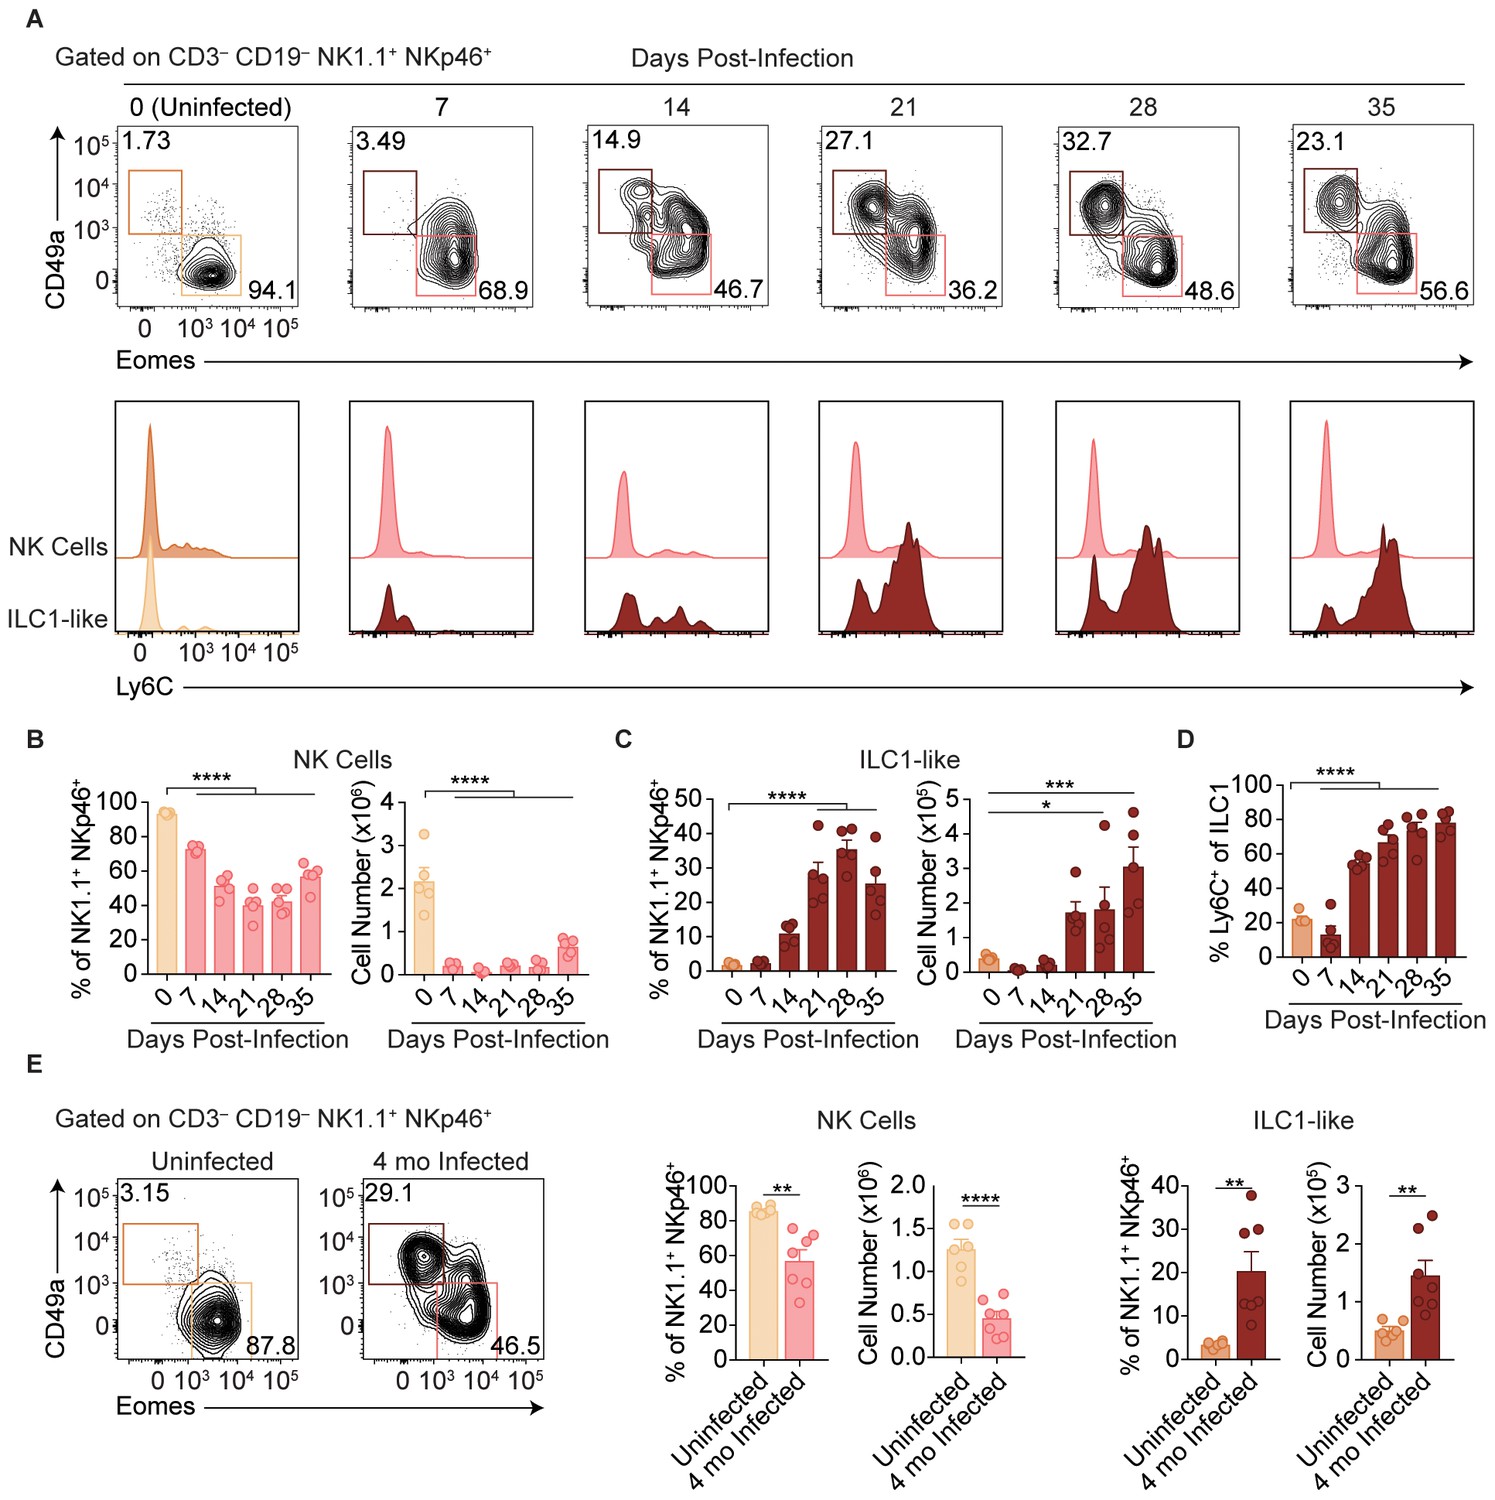
T. gondii infection results in expansion of ILC1-like cells.
(A–E) Wild-type mice were infected by i.p. injection of 200 tachyzoites of the Prugniaud (Pru) strain of T. gondii. Splenocytes were analyzed at indicated time points p.i. (A) Representative flow cytometry plots for the analysis of NK cells (Eomes+ CD49a–) and ILC1-like cells (Eomes– CD49a+), and Ly6C expression by NK cells and ILC1-like cells, at indicated time points p.i., among CD3– CD19– NK1.1+ NKp46+ cells. (B,C) Frequency and absolute number of NK cells (B) and ILC1-like cells (C) from spleens of uninfected mice and mice at indicated time points p.i. Numbers derived from gates indicated in (A), n = 5 mice. (D) Frequency of ILC1s that express Ly6C at indicated time points p.i., n = 5 mice. (E) Representative flow cytometry plots for the analysis of NK cells and ILC1-like cells, and their frequency and absolute number four mo p.i., n = 6 mice (uninfected) or n = 7 mice (infected). Mean + s.e.m (B–E); one-way ANOVA with Bonferroni correction (B–D); unpaired t-test (E); *p≤0.05, **p≤0.01, ***p≤0.001, ****p≤0.0001. Data are representative of 5 independent experiments.
Figure 1—figure supplement 1
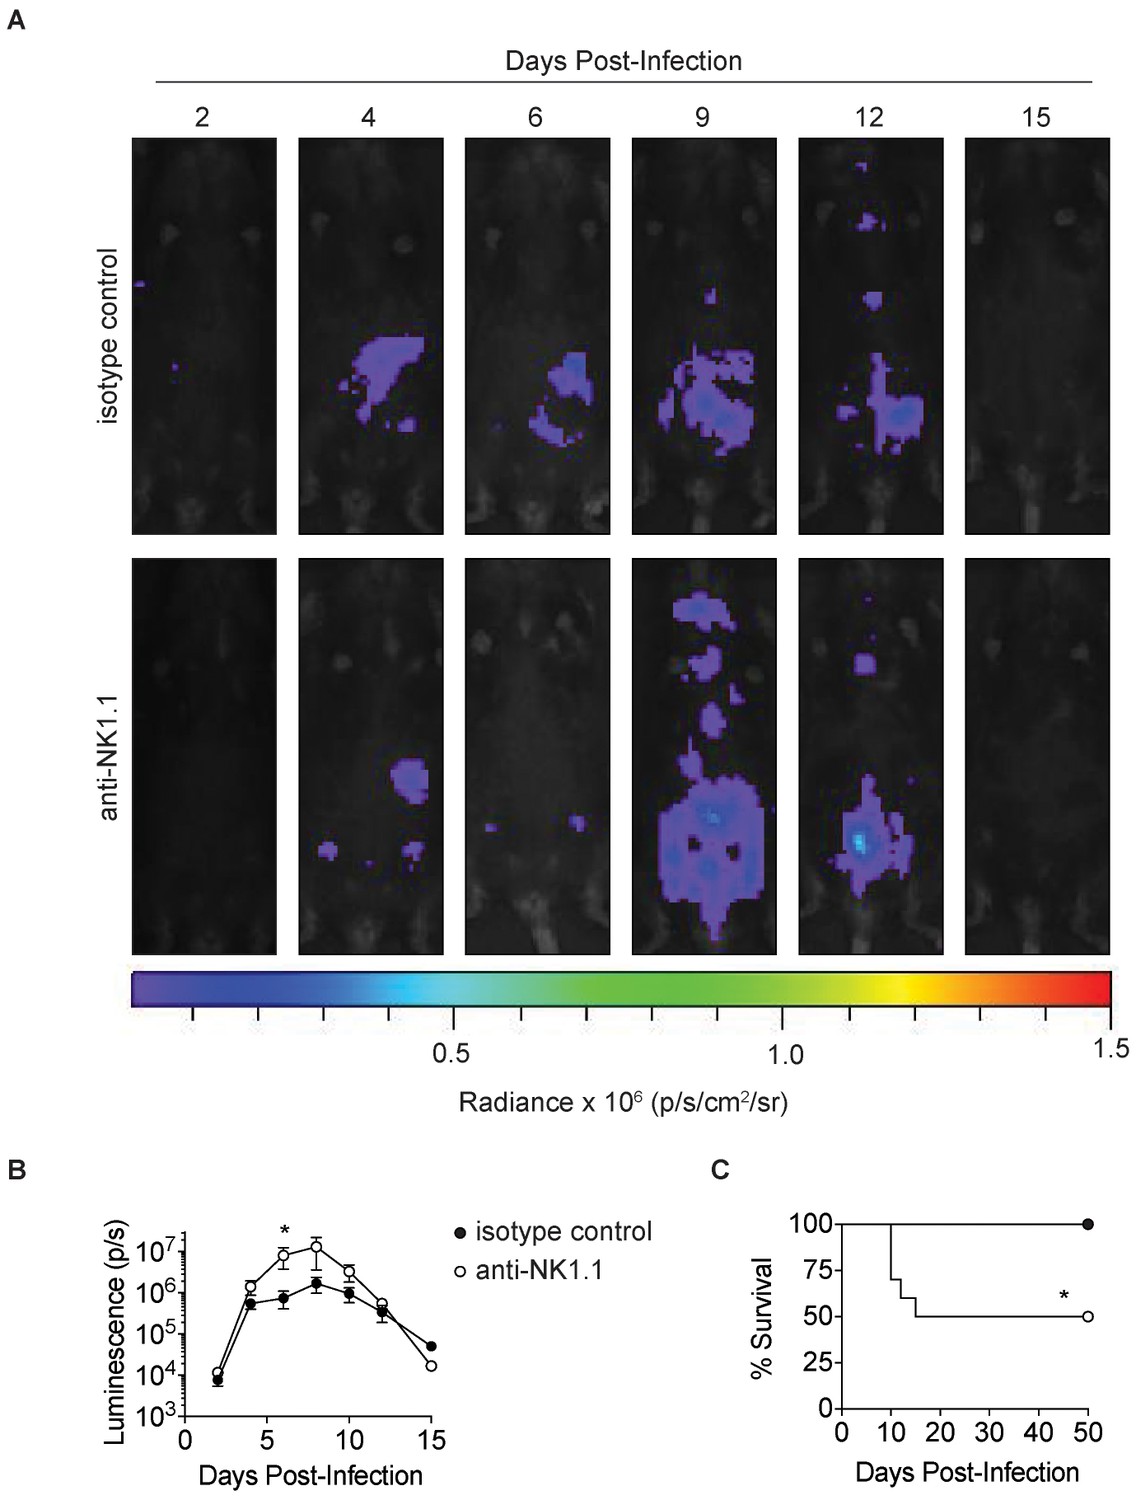
Anti-NK1.1 depletion increases parasite burden and mortality in T.gondii infection.
(A) Representative luciferase images of undepleted mice and NK1.1-depleted mice lying supine, at indicated time points after infection with 200 Pru.Luc T. gondii parasites. Isotype control and NK1.1-depleted mice were injected with 100 µg of mouse IgG2a control antibody or anti-NK1.1, respectively, i.p. 2 day prior to infection and the day of infection. (B) Total photon flux measured in undepleted mice and NK1.1-depleted mice, at indicated time points after infection, n = 5. (C) Percentage of mice surviving at indicated time points after infection, n = 10. Mean + s.e.m. unpaired t-test, *p≤0.05 (B) Mantel-Cox test, *p≤0.01 (C). Data are representative of three independent experiments.
Figure 2
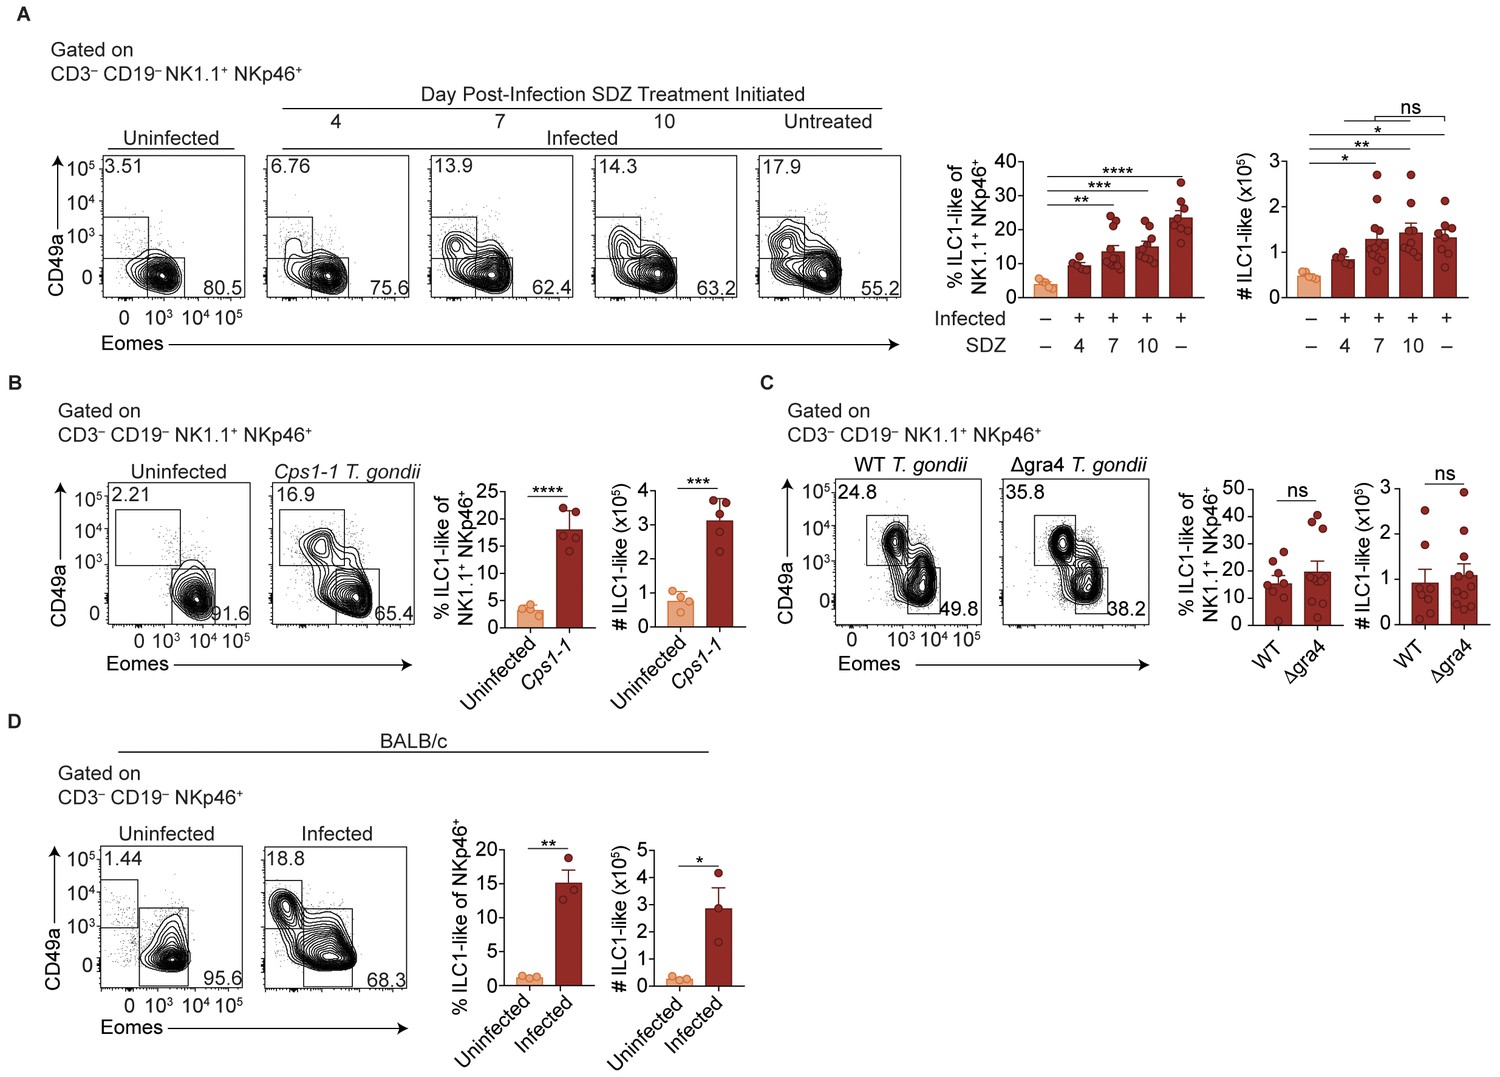
ILC1-like cell expansion persists in the absence of ongoing infection.
(A–D) Representative flow cytometry plots for the analysis of NK cells (Eomes+ CD49a–) and ILC1-like cells (Eomes– CD49a+), and frequency and absolute number of ILC1-like cells in the spleen following (A) treatment with sulfadiazine (SDZ) beginning at indicated time points p.i. and maintained on sulfadiazine until 35 d p.i. when they were analyzed, n = 5–11 mice; (B) injection with 1 × 10⁵ tachyzoites three times, two wk apart, and analyzed 42 d after initial injection, n = 4 mice (uninfected) or n = 5 mice (Cps1-1); (C) infection with PruΔku80 (WT) and PruΔku80Δgra4 (Δgra4) T. gondii analyzed 35 d.p.i., n = 8 mice (WT) or n = 10 mice (Δgra4); (D) infection of BALB/c mice 35 d.p.i., n = 3 mice. Mean + s.e.m (A–D); one-way ANOVA with Bonferroni correction (B); unpaired t-test (B–D); ns not significant, *p≤0.05, **p≤0.01, ***p≤0.001, ****p≤0.0001. Data are representative of three independent experiments.
Figure 3 with 1 supplement
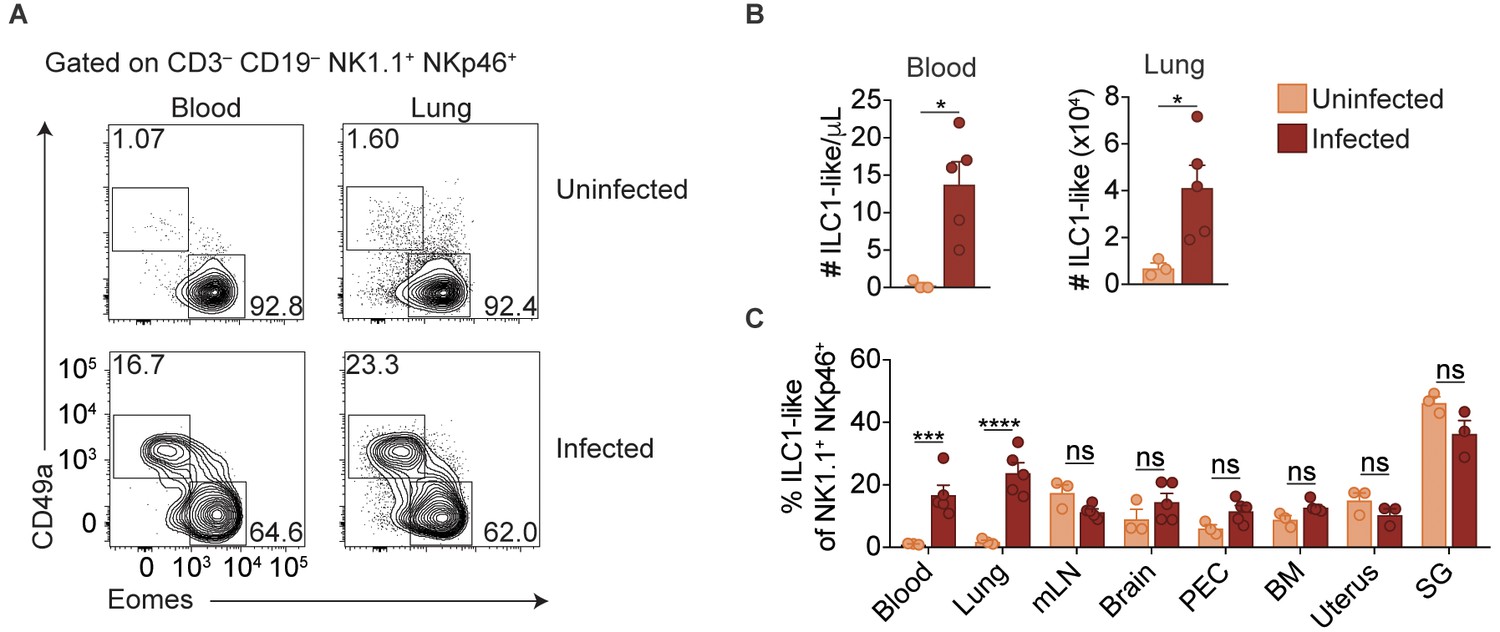
Expansion of ILC1-like cells among circulating cells.
(A) Representative flow cytometry plots for the analysis of NK cells and ILC1-like cells in the blood and lung of uninfected and d35-infected mice. (B) Absolute number of ILC1-like cells in the blood and lung of uninfected and d35 infected mice. (C) Frequency of ILC1-like cells among NK1.1+ NKp46+ cells in indicated organ at 35 d.p.i., n = 3 mice (uninfected) or n = 5 mice (infected). Mean + s.e.m (A,C); unpaired t-test; ns not significant, *p≤0.05, ***p≤0.001, ****p≤0.0001. Data are representative of three independent experiments.
Figure 3—figure supplement 1
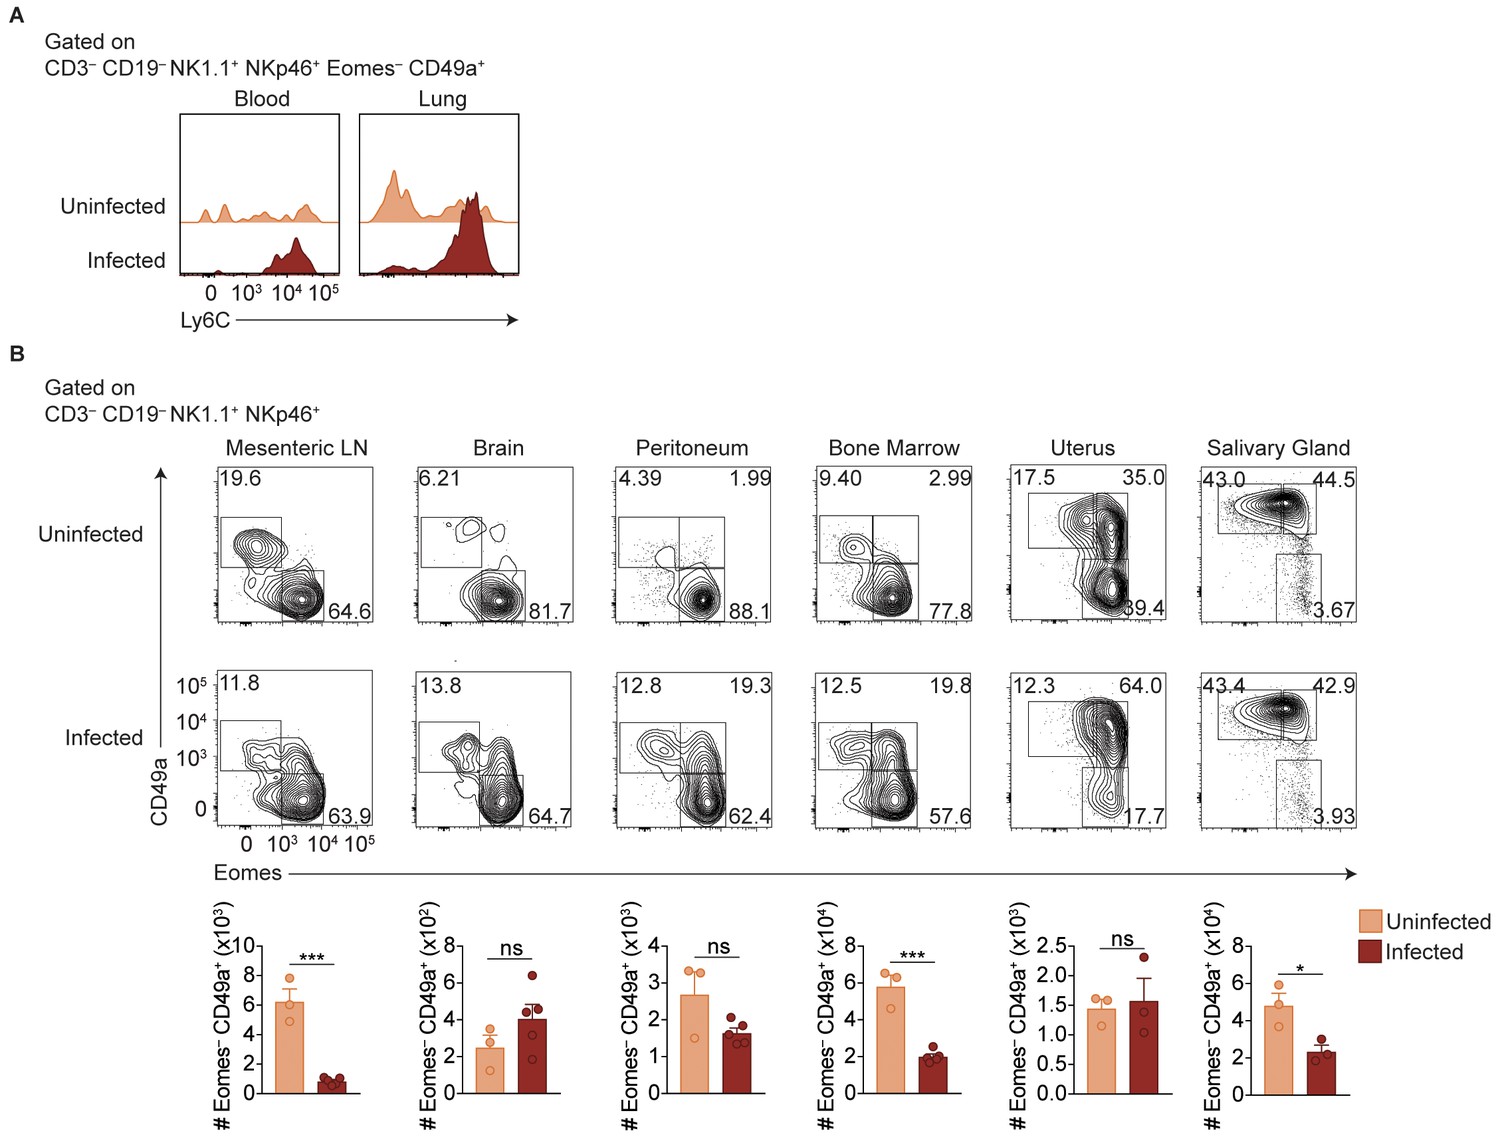
ILC1s expand at additional sites beyond the spleen.
(A) Representative flow cytometry plots showing Ly6C expression by cells with ILC1 phenotype in the blood and lungs of uninfected mice or at 35 d.p.i. (B) Representative flow cytometry plots for the assessment of NK cells and ILC1s in the indicated organs of uninfected mice or at 35 d.p.i. Data are representative of three independent experiments.
Figure 4

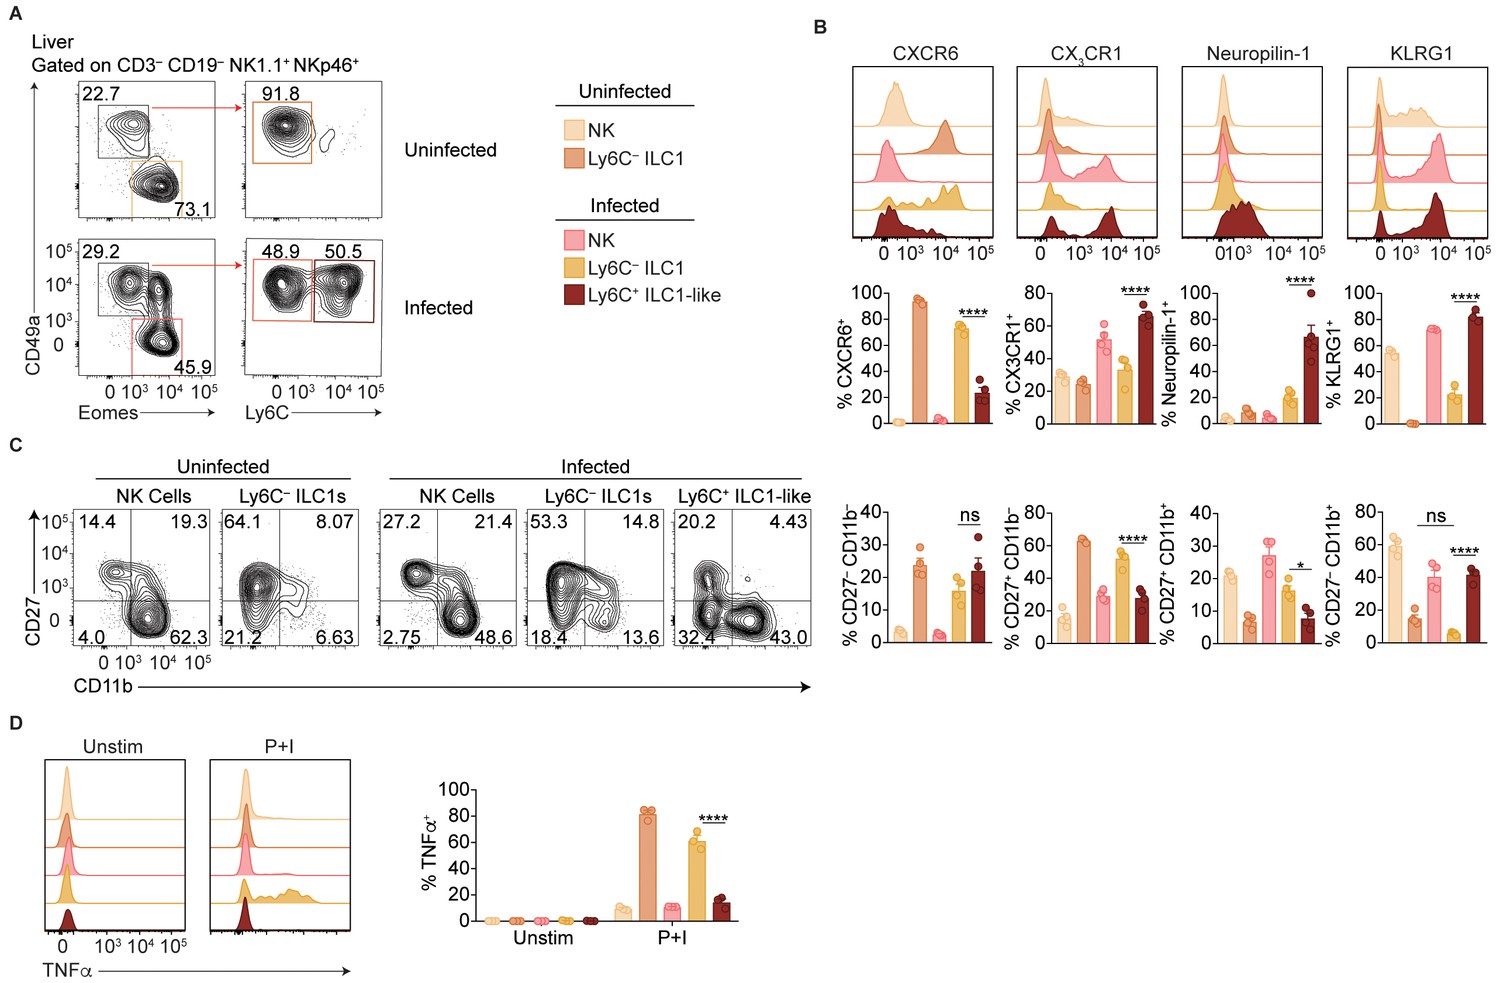
Delineation of NK cells, ILC1s, and ILC1-like cells in the liver.
(A) Overview of competitive transfer experiment. At 35 d.p.i., Eomes-GFP+ CD49a– and Eomes-GFP– CD49a+ cells were sorted from the spleens of CD45.2 and CD45.1 x CD45.2 Eomes-GFP reporter mice, respectively. Cells were combined in a 1:1 ratio and intravenously injected into Rag2-/-Il2rg-/- mice. 24 days later, spleens and livers of recipients were assessed for transferred cells. (B) Representative flow cytometry plots of CD45.1 and CD45.2 expression by transferred cells in the spleen and liver of Rag2-/-Il2rg-/- mice, and frequency of transferred NK cells (CD45.2+) and ILC1s (CD45.1+ CD45.2+) 24 days post-transfer, as described in (A), n = 5 mice. (C) Representative flow cytometry plots of Eomes-GFP and CD49a expression by transferred NK cells and ILC1-like cells in the spleen (top) and liver (bottom) of Rag2-/-Il2rg-/- mice, and frequency of Eomes– CD49a+ 24 days post-transfer, as described in (A) n = 5 mice. (D) Representative flow cytometry plots for the analysis of CD49a and Eomes among CD3– CD19– NK1.1+ NKp46+ cells, and Ly6C expression by Eomes+ CD49a–, Eomes+ CD49a+, and Eomes– CD49a+ cells in the liver at indicated time points p.i. (E,F) Frequency and absolute number of CD3– CD19– NK1.1+ NKp46+ cells that are Eomes+ CD49a–, Eomes+ CD49a+, and Eomes– CD49a+ in the livers of uninfected and d35-infected mice, n = 3 mice (uninfected) or n = 5 mice (infected). (G) Frequency of Ly6C+ cells among CD3– CD19– NK1.1+ NKp46+ Eomes+ CD49a–, Eomes+ CD49a+, and Eomes– CD49a+ cells in the livers of d35-infected mice, n = 3 mice. (H) Frequency of CD3– CD19– NK1.1+ NKp46+ cells that are Eomes– CD49a+ (ILC1 and ILC1-like) and express Ly6C, and absolute number of Ly6C+ ILC1-like cells and Ly6C– ILC1s from livers of uninfected and d35-infected mice, n = 3 mice (uninfected) or n = 5 (infected). Mean + s.e.m. (B,C,E–H) unpaired t-test (B,C,E,F,H) one-way ANOVA with Bonferroni correction (G); ns not significant, *p≤0.05, **p≤0.01, ***p≤0.001, ****p≤0.0001. Data are representative of 3 independent experiments.
Figure 5 with 2 supplements

ILC1-like cells are distinct from NK cells and ILC1s.
(A,B) Representative flow cytometry plots showing expression of indicated markers by indicated cells from spleens of uninfected and d35-infected mice, and frequency of each cell population that expresses each marker, n = 3 mice (A) uninfected) or n = 5 mice (A) infected and B). (C,D) Representative flow cytometry plots and frequency of indicated cells in uninfected and d35-infected mice after 4 hr culture with indicated stimulus that contain intracellular IFNγ (C) or TNFα (D), n = 5. Mean + s.e.m. (A–D) one-way ANOVA with Bonferroni correction (A–D); *p≤0.05, **p≤0.01, ***p≤0.001, ****p≤0.0001, in comparisons of ILC1-like cells from infected mice with the NK cells in infected mice, and the ILC1s in uninfected mice. When these comparisons were not significant, the comparison is not shown. Data are representative of three independent experiments.
Figure 5—figure supplement 1
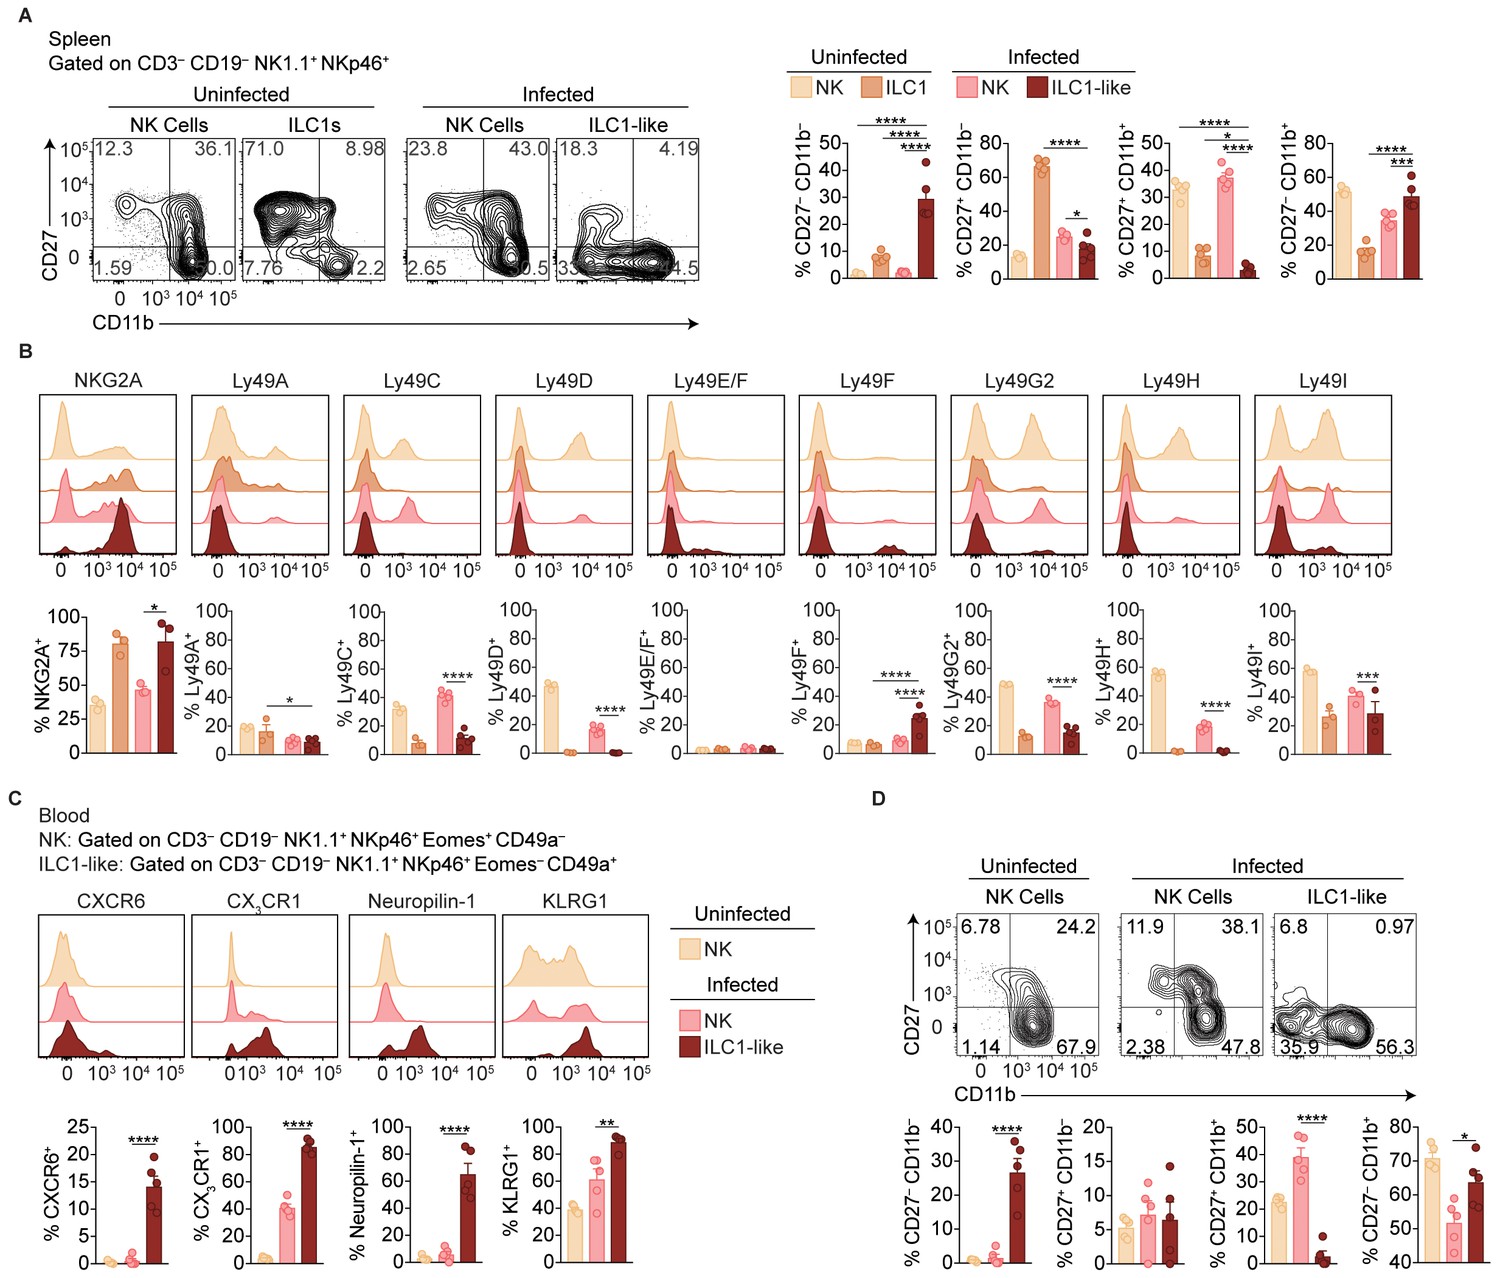
Phenotypic comparison of NK cells, ILC1s, and ILC1-like cells in the spleen and blood.
(A–B) Representative flow cytometry plots showing expression of indicated markers by NK cells (CD3– CD19– NK1.1+ NKp46+ Eomes+ CD49a–), and ILC1s and ILC1-like cells (CD3– CD19– NK1.1+ NKp46+ Eomes– CD49a+ Ly6C–), from spleens of uninfected and d35-infected mice, and frequency of each cell population that expresses each marker, n = 5 mice (A), n = 3 mice (B) uninfected), or n = 5 (B) infected). (C) Representative flow cytometry plots for the analysis of blood NK cells from uninfected mice and at 35 d.p.i. and blood ILC1-like cells at 35 d.p.i. (D) Frequency of each cell population that expresses indicated markers from panel c), n = 5. Mean + s.e.m. (A–D); one-way ANOVA with Bonferroni correction (A–D); *p≤0.05, **p≤0.01, ***p≤0.001, ****p≤0.0001.
Figure 5—figure supplement 2
Ly6C expression distinguishes between ILC1 subpopulations in the liver.
(A) Representative flow cytometry plots for the analysis of NK cells (Eomes+ CD49a–), Ly6C– ILC1s (Eomes– CD49a+ Ly6C–), and Ly6C+ ILC1-like cells (Eomes– CD49a+ Ly6C+) in the livers of uninfected mice and at 35 d.p.i. (B) Representative flow cytometry plots and frequency of each cell population in the liver that expresses indicated markers, n = 4 mice (uninfected) or n = 5 mice (infected). (C) Representative flow cytometry plots showing the expression of CD27 and CD11b by NK cells (CD3– CD19– NK1.1+ NKp46+ Eomes+ CD49a–), Ly6C– ILC1s (CD3– CD19– NK1.1+ NKp46+ Eomes– CD49a+ Ly6C–), and Ly6C+ ILC1s (CD3– CD19– NK1.1+ NKp46+ Eomes– CD49a+ Ly6C+) in the livers of uninfected and infected mice, and frequency of each cell population in the liver that expresses indicated markers, n = 4 mice (uninfected) or n = 5 mice (infected). (D) Representative flow cytometry plots and frequency of each population in the liver that produced TNFα after 4 hr culture with indicated stimulus, n = 3. Mean + s.e.m. (A,B,D–F); one-way ANOVA with Bonferroni correction (A,B,D–F); ns not significant *p≤0.05, **p≤0.01, ****p≤0.0001. Data are representative of 3 independent experiments.
Figure 6 with 1 supplement
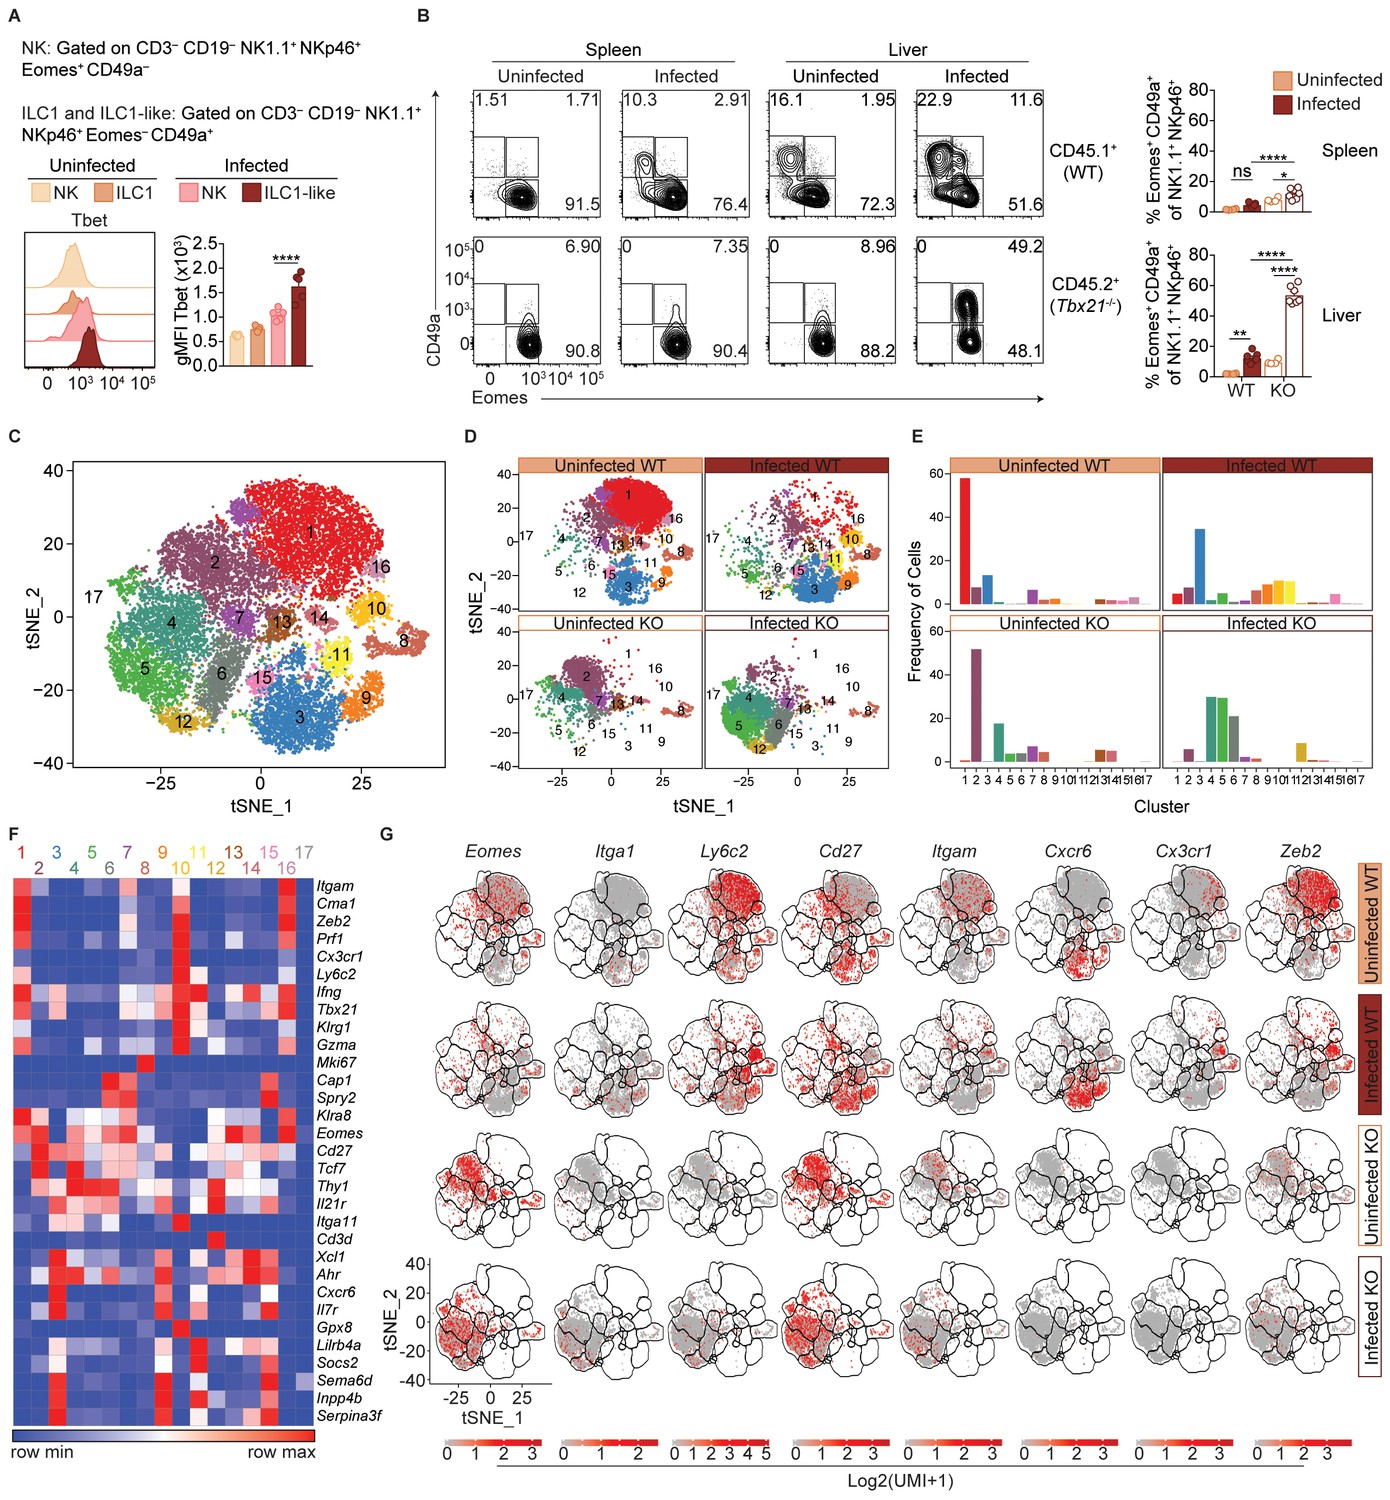
T.gondii infection induces heterogeneity of NK cells and ILC1s.
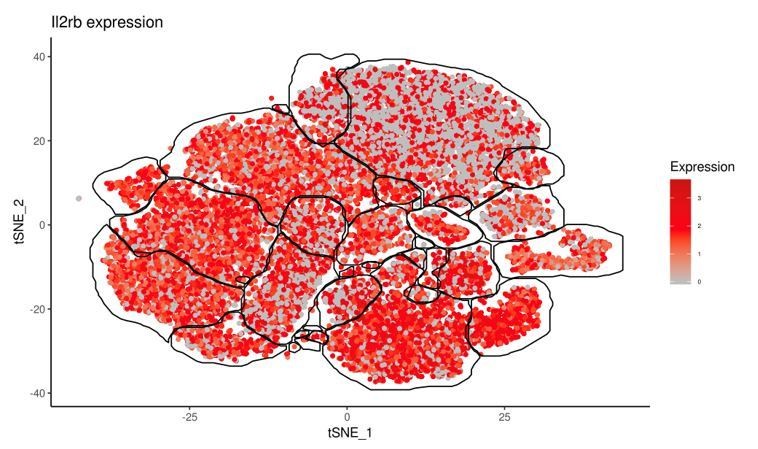
(A) Representative flow cytometry plots showing Tbet expression by indicated cells from spleens of uninfected and d35-infected mice, and gMFI of Tbet expression by each population, n = 3 mice (uninfected) or n = 5 mice (infected). (B) Representative flow cytometry plots for the CD49a and Eomes expression among CD3– CD19– NK1.1+ NKp46+ cells of CD45.1-derived (WT) or CD45.2-derived (Tbx21-/-) cells from spleens and livers of uninfected and d35-infected WT:Tbx21-/- bone marrow chimeras, and frequency of Eomes+ CD49a+ cells from spleen and liver, n = 4 mice (uninfected) or n = 7 mice (infected). In right panel, KO cells indicated by open bars. (C) Biaxial t-SNE analysis of cells pooled across all samples. Points represent individual cells, colors denote different clusters. (D) Biaxial t-SNE analysis of cells in individual samples. (E) Fraction of cells in C1-C17 within each sample. (F) Heatmap of average expression of select genes that are characteristic of C1-C17. (G) Expression of indicated genes by cells in each sample. Mean + s.e.m. (A,B); one-way ANOVA with Bonferroni correction (A,B); ns not significant *p≤0.05, **p≤0.01, ****p≤0.0001; data are representative of three independent experiments (A–C).
Figure 6—figure supplement 1
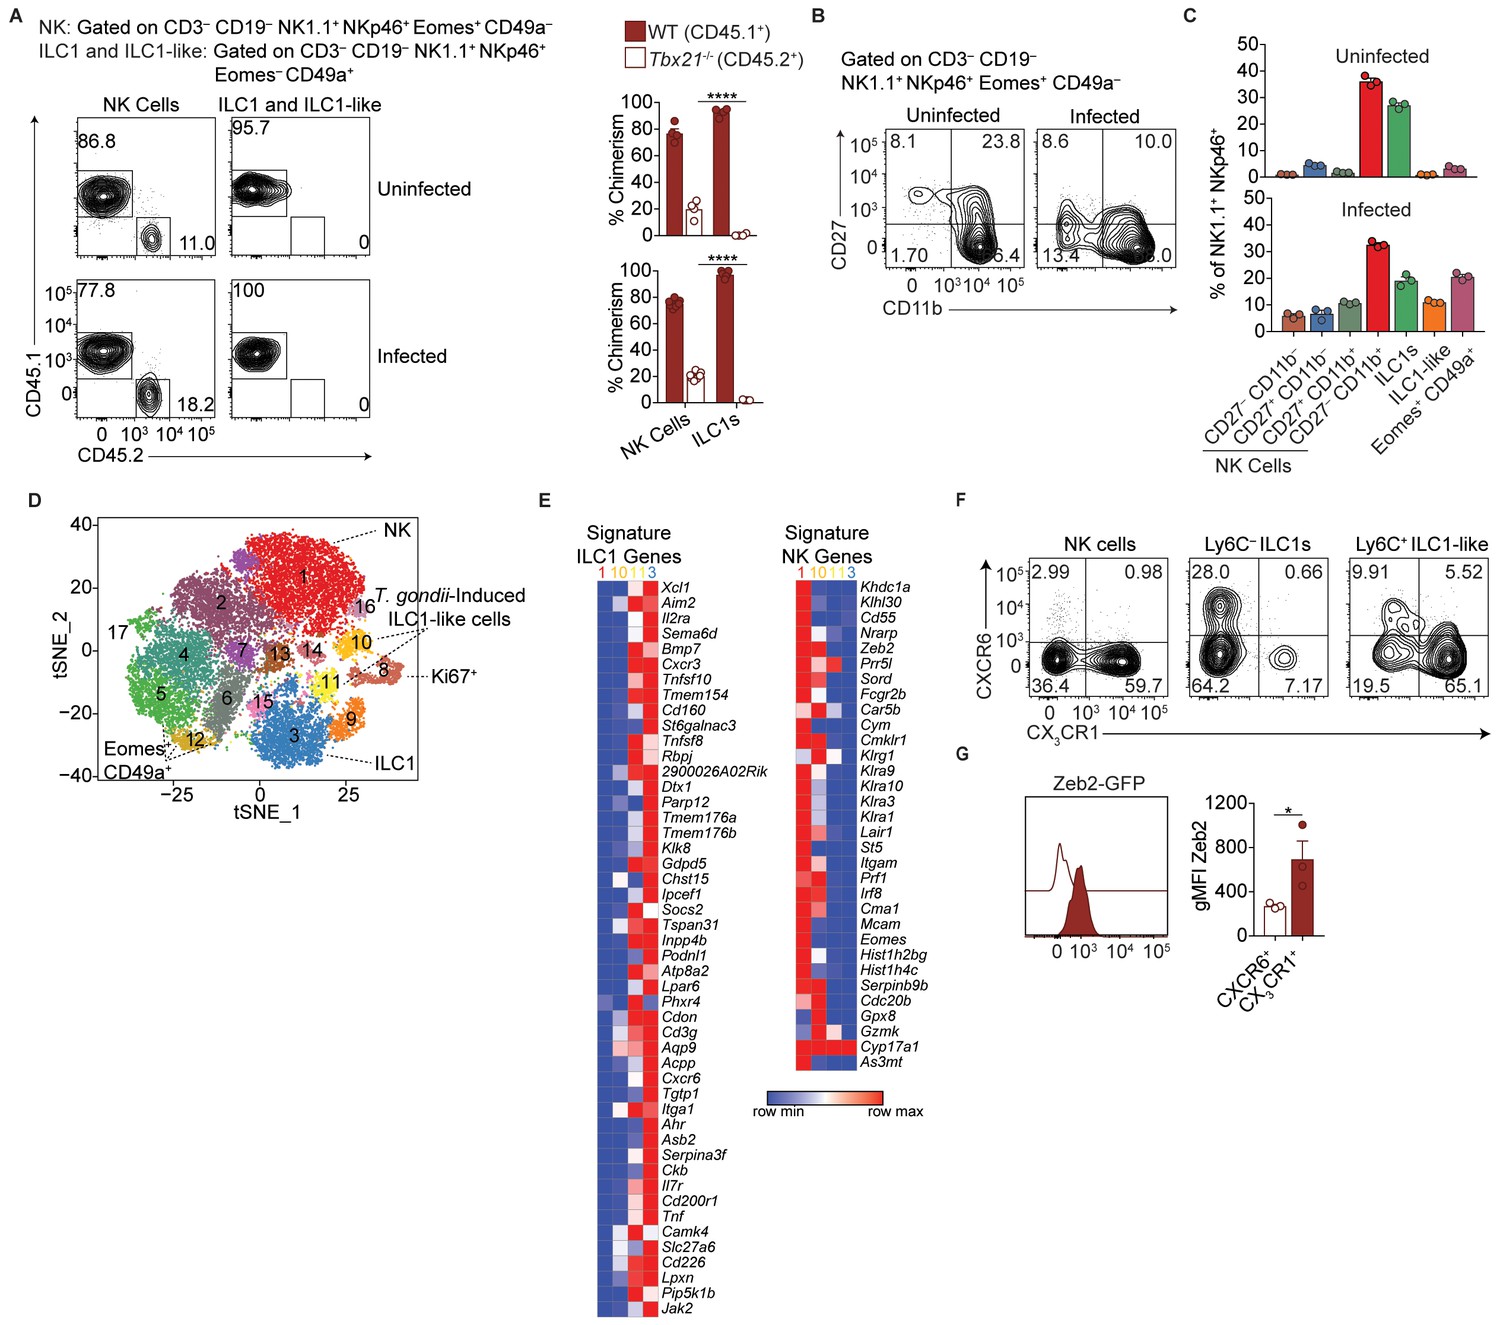
Single-cell RNA-seq reveals extensive NK cell and ILC1 heterogeneity in the liver.
(A) Representative flow cytometry plots for the analysis of NK cell and ILC1-like cell chimerism in the spleens of uninfected and d35-infected WT:Tbx21-/- bone marrow chimeras, and frequency of NK cells and ILC1-like cells that are derived from WT or Tbx21-/- bone marrow, n = 4 mice (uninfected) or n = 7 mice (infected). (B) Representative flow cytometry plots for the expression of CD27 and CD11b by NK cells from the livers of uninfected and d35-infected mice. (C) Frequency of indicated cell types in uninfected and d35-infected mice, n = 3. (D), t-SNE plot labeled with putative cluster identities. (E) Heatmap of average expression of signature ILC1 and NK cell genes by cells in Clusters 1, 3, 10, and 11 (Robinette et al., 2015). (F) Representative flow cytometry plots showing the expression of CX3CR1 and CXCR6 by NK cells (CD3– CD19– NK1.1+ NKp46+ Eomes+ CD49a–), Ly6C– ILC1s (CD3– CD19– NK1.1+ NKp46+ Eomes– CD49a+ Ly6C–), and Ly6C+ ILC1-like cells (CD3– CD19– NK1.1+ NKp46+ Eomes– CD49a+ Ly6C+). (G) Expression of Zeb2 by CXCR6+ Ly6C+ ILC1-like cells and CX3CR1+ Ly6C+ ILC1-like cells from the liver of d35-infected Zeb2-GFP mice, n = 3. Mean + s.e.m. (A,B,G); one-way ANOVA with Bonferroni correction (A); paired t-test (G); *p≤0.05, ****p≤0.0001. Data are representative of 3 independent experiments (A,B,C,F,G).
Figure 7 with 1 supplement

Most ILC1-like cells are derived from NK cells during T.gondii infection.
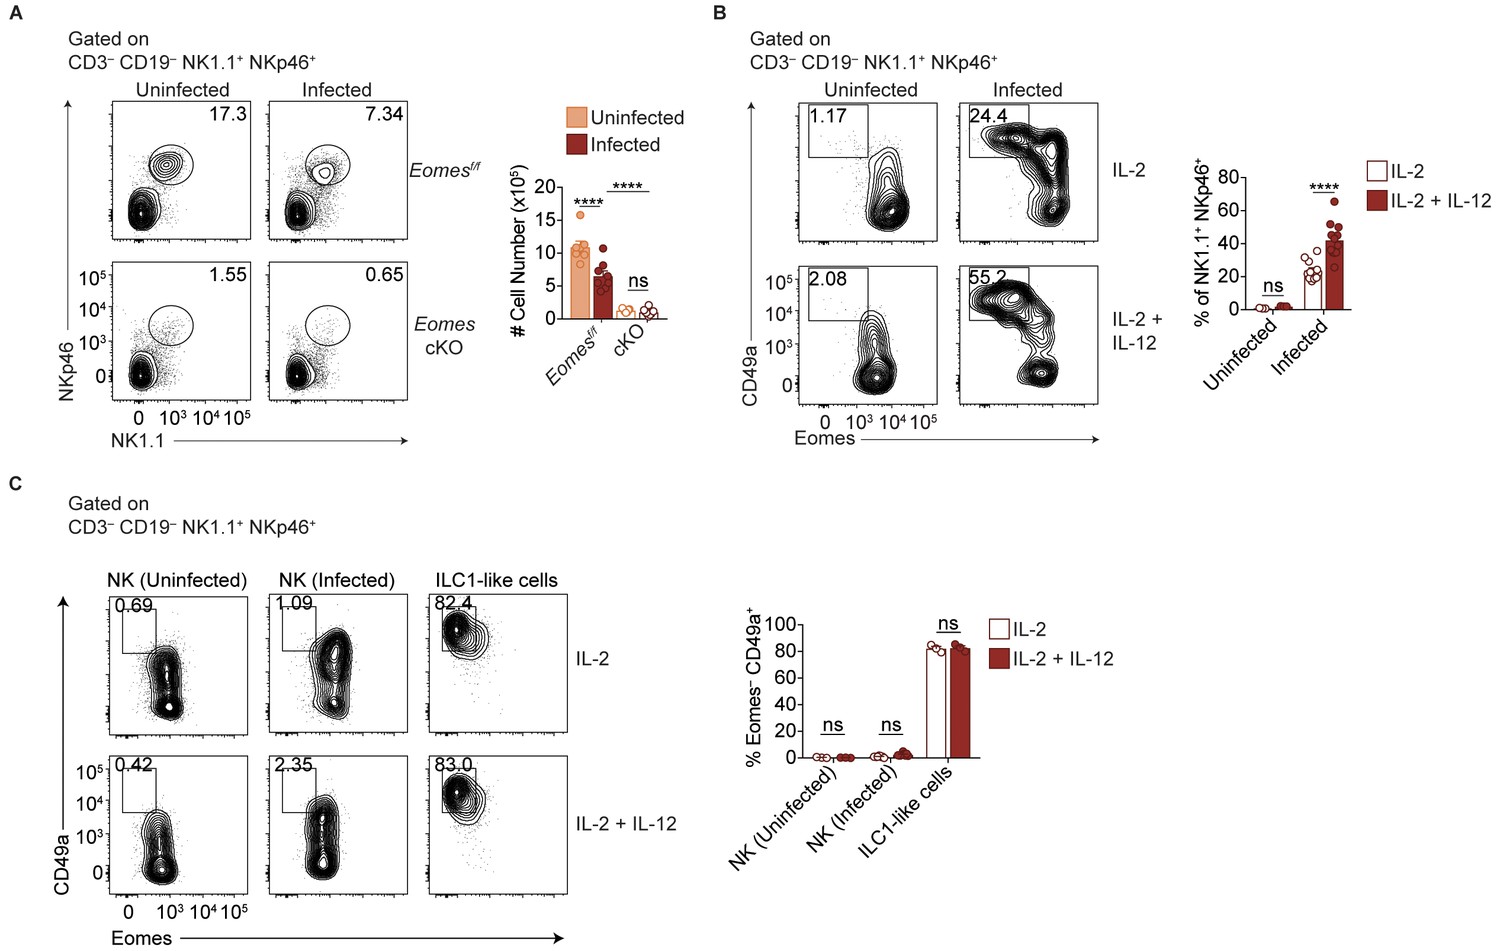
(A) Representative flow cytometry plots for the analysis of ILC1s (CD3– CD19– NK1.1+ NKp46+ CD49a+) or ILC1-like cells (CD3– CD19– NK1.1+ NKp46+ CD49a+ Ly6C+), and (B) absolute number of these cells in the spleens of Eomesf/f and Eomes cKO mice that are uninfected and at 35 d.p.i., n = 7 mice (uninfected Eomesf/f), n = 8 mice (infected Eomesf/f), n = 7 mice (uninfected cKO), or n = 9 mice (infected cKO). The increased number of CD49a+ Ly6C+ cells in infected versus uninfected Eomesf/f mice represent both NK cells and ILC1 origin, whereas in cKO mice, the increased number represents ILC1 origin only, as indicated by the brackets. (C) Representative flow cytometry plot showing expression of Ly6C and frequency of ILC1s that express Ly6C, n = 7 mice (uninfected Eomesf/f), n = 8 mice (infected Eomesf/f), n = 7 mice (uninfected cKO), or n = 9 mice (infected cKO). (D) Representative flow cytometry plots for the analysis of chimerism in the spleens of uninfected and d35-infected WT:Eomesf/f and WT:Eomes cKO bone marrow chimeras, and frequency of ILC1s that are derived from WT, Eomesf/f, or Eomes cKO bone marrow, n = 4 mice (uninfected) or n = 5 (infected). (E) Representative flow cytometry plots for the analysis of chimerism in the spleens of uninfected and d35-infected WT:Stat4-/- bone marrow chimeras, and frequency of NK cells and ILC1-like cells that are derived from WT or Stat4-/- bone marrow, n = 3 mice. Mean + s.e.m. (B–D); one-way ANOVA with Bonferroni correction (B–D); ns not significant *p≤0.05, **p≤0.01, ****p≤0.0001. Data are representative of three independent experiments.
Figure 7—figure supplement 1
IL-12 contributes to Eomes downregulation.
(A) Representative flow cytometry plots for the quantification of NK1.1+ NKp46+ cells from spleens of uninfected and d35-infected Eomesf/f and Eomes cKO mice, and absolute number of cells, n = 7 mice (uninfected Eomesf/f), n = 8 mice (infected Eomesf/f), n = 7 mice (uninfected cKO), or n = 9 mice (infected cKO). (B) Representative flow cytometry plots for the quantification of ILC1-like cells (Eomes– CD49a+) after culture of splenocytes from uninfected and d35-infected mice in IL-2, or IL-2 + IL-12, and frequency of ILC1-like cells, n = 3 mice (uninfected) or n = 12 mice (infected). (C) Representative flow cytometry plots for the assessment of Eomes and CD49a expression of sorted NK cells or ILC1-like cells from uninfected or d35-infected mice after culture in IL-2, or IL-2 + IL-12, and frequency of cells that are Eomes– CD49a+ cells, n = 3 wells (NK-uninfected and ILC1-like cells) or n = 7 wells (NK-infected). Mean + s.e.m. (A–C); one-way ANOVA with Bonferroni correction (A–C); ns not significant, *p≤0.01, ****p≤0.0001. Data are representative of three independent experiments.
Figure 8 with 1 supplement
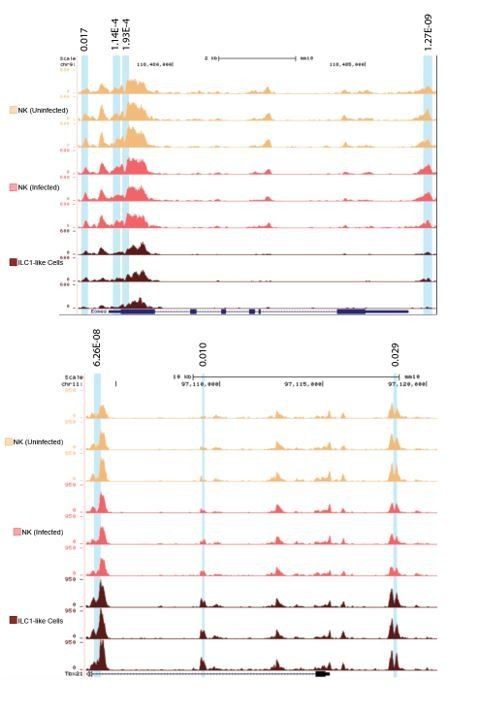
Eomes downregulation within NK cells accompanies extensive transcriptional and epigenomic changes.
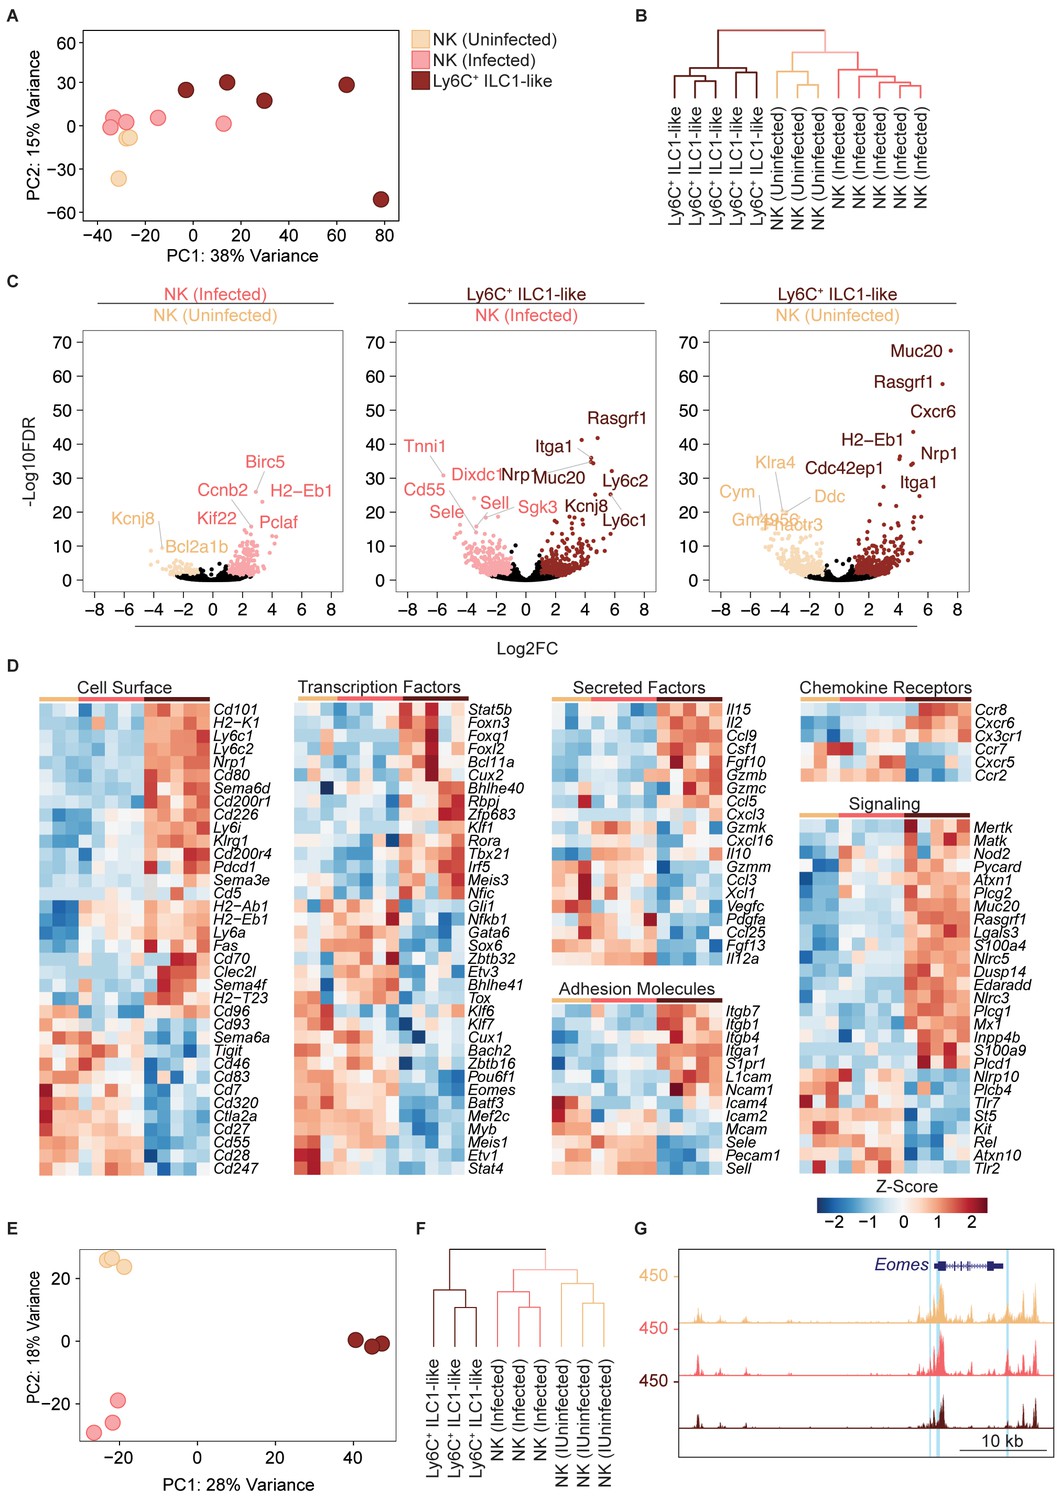
(A) Principal component analysis using top 2000 most variable genes from RNA-seq analysis comparing NK cells from spleens of uninfected and infected mice and Ly6C+ ILC1s (ILC1-like cells) from d35-infected mice, each dot represents a sample from different mice, n = 3 mice (NK cells-uninfected) or n = 5 mice (NK cells-infected and Ly6C+ ILC1-like). Color legend shown applies to all panels. (B) Unsupervised hierarchical clustering of each sample in (A). (C) Volcano plots showing Log2(Fold Change) differences versus –Log10(False Discovery Rate) for indicated comparisons, using pooled data from each indicated sample type. Genes exhibiting Log2FC > 1 and FDR < 0.1 are colored. (D) Heatmaps showing centered DESeq2 variance-stabilized expression values of select genes exhibiting Log2FC > 1 and FDR < 0.1, n = 3 mice (NK cells-uninfected) or n = 5 mice (NK cells-infected and Ly6C+ ILC1-like). Each column represents a different mouse sample of a given cell type, indicated by color code shown in (A). (E) Principal component analysis from ATAC-seq analysis comparing NK cells from spleens of uninfected and infected mice and Ly6C+ ILC1s (ILC1-like cells) from d35-infected mice, n = 3 mice. (F) Unsupervised hierarchical clustering of samples in (E). (G) Representative UCSC genome browser tracks showing ATAC-seq peaks in NK cells from uninfected mice, and NK cells and Ly6C+ ILC1s from d35-infected mice, at the Eomes locus. Differentially accessible REs are highlighted in blue.
Figure 8—figure supplement 1

ATAC-seq analysis reveals widespread changes in chromatin accessibility in T.
gondii-induced ILC1-like cells. (A) Representative flow cytometry plots for sorting NK cells (CD49a– Ly6C–) and ILC1s (CD49a+ Ly6C+) from the spleens of uninfected and infected mice, and expression of Eomes by each population. (B) Quantification of regulatory elements with log2FC > 1 and FDR < 0.05 within indicated genomic regions in pairwise comparison of NK cells from infected mice versus NK cells from uninfected mice (left), T. gondii-induced ILC1s and NK cells from infected mice (middle), and T. gondii-induced ILC1s and NK cells from uninfected mice (right). (C) Heatmap of reads displaying differentially accessible REs, centered on peaks and showing 3 kb upstream and downstream of peak center. Six groups of REs are apparent. Groups 1, 3, and 5 contain REs that are uniquely more accessible in uninfected NK cells, NK cells from infected mice, and ILC1-like cells, respectively. Groups 2, 4, and 6 contained REs that are shared between two groups. Group 2 encompassed REs that are more accessible in both NK cell groups relative to ILC1-like cells. Group 4 contains REs that are more accessible in both NK cells and ILC1-like cells from infected mice relative to uninfected NK cells. Group 6 contains REs that are more accessible in both NK cells from uninfected mice and ILC1-like cells relative to NK cells from infected mice. (D) Representative schematics depicting relative peak size of individual differentially accessible REs in both NK cell groups and ILC1-like cells for the six groups shown in (C). (E) De novo transcription factor binding motifs found enriched in groups 3 and 5, and p-values for enrichment compared to background regions. (F) Comparison of gene expression by RNA-seq and accessibility of individual REs in NK cells and ILC1-like cells from infected mice. For each gene listed, Log2FC of gene expression from RNA-seq is indicated by position of bottom point along the y-axis. Discrete loci are plotted along the x-axis, with each differentially accessible RE depicted as a point, with Log2FC of peak size in ILC1-like cells relative to NK cells indicated by fill color of each point. Depiction based on analysis of MCMV-induced memory NK cells (Lau et al., 2018), to allow comparison. (G) Representative UCSC genome browser tracks showing ATAC-seq peaks in NK cells from uninfected mice, and NK cells and Ly6C+ ILC1-like cells from d35-infected mice, at the Tbx21 locus. Differentially accessible REs are highlighted in blue.
Author response image 1
Author response image 2
Tables
Key resources table
| Reagent type (species) or resource | Designation | Source or reference | Identifiers | Additional information |
|---|---|---|---|---|
| Chemical compound, drug | D-Luciferin, Potassium Salt | Gold Biotechnology | Cat#LUCK-1G; CAS 115144-35-9 | |
| Chemical compound, drug | Sulfadiazine | Sigma | Cat#S8626-25G | |
| Chemical compound, drug | Uracil | Sigma | Cat#U1128 | |
| Chemical compound, drug | Percoll | Sigma | Cat#P1644 | |
| Chemical compound, drug | Recombinant murine IL-12 | Pepro Tech | Cat#210–12 | |
| Chemical compound, drug | Recombinant mouse IL-18 | MBL | Cat#B002-5 | |
| Chemical compound, drug | Recombinant murine IL-15 | Peptro Tech | Cat#210–15 | |
| Chemical compound, drug | DNase I | Sigma | Cat#10104159001 | |
| Chemical compound, drug | Collagenase Type IV | Sigma | Cat#C5138-100mg | |
| Commercial assay or kit | Foxp3/Transcription Factor Staining Buffer Set | eBioscience | Cat#00-5523-00 | |
| Commercial assay or kit | EasySep Magnet | BD Biosciences | Cat#1800 | |
| Commercial assay or kit | EasySep Mouse Streptavidin Rapidspheres Isolation Kit | BD Biosciences | Cat#19860 | |
| Commercial assay or kit | Nextera Index Kit | Illumina | Cat#FC-121–1011 | |
| Commercial assay or kit | SMARTer PCR cDNA Synthesis Kit | Clontech | Cat#634926 | |
| Genetic reagent (Homo sapiens) | Human: HFF | John C. Boothroyd | ||
| Cell line (Rattus norvegicus, Mus musculus) | 2.4G2 hybridoma | ATCC | ATCC HB-197 | |
| Cell line (Rattus norvegicus, Mus musculus) | PK136 hybridoma | ATCC | ATCC HB-191 | |
| Genetic reagent (Mus musculus) | wild-type; C57BL/6NCr | Charles River | Cat#556 | |
| Genetic reagent (Mus musculus) | CD45.1+;B6.SJL-PtprcaPepcb/BoyCrCrl | Charles River | Cat#564 | |
| Genetic reagent (Mus musculus) | Balb/c; BALB/cAnNCr | Charles River | Cat#555 | |
| Genetic reagent (Mus musculus) | NKp46iCre; Ncr1tm1.1(icre)Viv/J | Eric Vivier | MGI:5308410 | |
| Genetic reagent (Mus musculus) | Eomesf/f; B6.129S1(Cg)-Eomestm1.1Bflu/J | The Jackson Laboratory | MGI:4830338, Cat#017293 | |
| Genetic reagent (Mus musculus) | Stat4-/-; C.129S2-Stat4tm1Gru/J | The Jackson Laboratory | MGI: 1857248, Cat#002826 | |
| Genetic reagent (Mus musculus) | Tbx21-/-; B129.S6-Tbx21tm1Glm/J | The Jackson Laboratory | MGI: 2180194, Cat#004648 | |
| Genetic reagent (Mus musculus) | Tgfbr2f/f; B6;129-Tgfbr22tm1Karl/J | The Jackson Laboratory | Cat#012603, MGI: 98729 | |
| Genetic reagent (Mus musculus) | Zeb2-GFP; Zfhxlbtm2.1Yhi | Kenneth Murphy | ||
| Genetic reagent (Toxoplasma gondii) | Prugniaud; Pru; PRU-FLuc-GFP | John C. Boothroyd | ||
| Genetic reagent (Toxoplasma gondii) | WT T. gondii; Pru∆ku80 ∆hx | L. David Sibley | ||
| Genetic reagent (Toxoplasma gondii) | Δgra4 T. gondii; Pru∆ku80 ∆hx ∆gra4::HX/mcherry | L David Sibley | ||
| Software, algorithm | Flowjo 10 | Treestar | https://www.flowjo.com/ ; RRID: SCR_008520 | |
| Software, algorithm | Prism 7 | Graphpad | https://www.graphpad.com/ ; RRID: SCR_002798 | |
| Software, algorithm | Bowtie2 version 2.4.3.2b | Langmead and Salzberg, 2012 | http://bowtie-bio.sourceforge.net/bowtie2/manual.shtml | |
| Software, algorithm | Samtools version 1.4 | Li et al., 2009 | http://samtools.sourceforge.net/ | |
| Software, algorithm | Picard Tools version 2.18.14 | Broad Institute | http://broadinstitute.github.io/picard/ | |
| Software, algorithm | BEDTools version 2.27.0 | Quinlan and Hall, 2010 | https://bedtools.readthedocs.io/en/latest/ | |
| Software, algorithm | MACS2 version 2.1.0 | Zhang et al., 2008 | https://github.com/taoliu/MACS | |
| Software, algorithm | deepTools version 3.1.2 | Ramírez et al., 2014 | https://deeptools.readthedocs.io/en/develop/ | |
| Software, algorithm | Homer version 4.10 | Heinz et al., 2010 | http://homer.ucsd.edu/homer/ | |
| Software, algorithm | RStudio version 3.5.1 | R Core Team 2014 | https://www.r-project.org/ | |
| Software, algorithm | Bioconductor package DESeq2 version 1.21.22 | Love et al., 2014 | http://bioconductor.org/packages/release/bioc/html/DESeq2.html | |
| Software, algorithm | Kallisto version 0.44.0 | Bray et al., 2016 | https://pachterlab.github.io/kallisto/download | |
| Software, algorithm | GSEA | Mootha et al., 2003; Subramanian et al., 2005 | http://software.broadinstitute.org/gsea/index.jsp | |
| Software, algorithm | Seurat | Butler et al., 2018 | https://cran.r-project.org/web/packages/Seurat/index.html |
Additional files
-
Transparent reporting form
- https://doi.org/10.7554/eLife.47605.017
Download links
A two-part list of links to download the article, or parts of the article, in various formats.
Downloads (link to download the article as PDF)
Open citations (links to open the citations from this article in various online reference manager services)
Cite this article (links to download the citations from this article in formats compatible with various reference manager tools)
Toxoplasma gondii infection drives conversion of NK cells into ILC1-like cells
eLife 8:e47605.
https://doi.org/10.7554/eLife.47605


