Structured inhibitory activity dynamics in new virtual environments
- Washington University School of Medicine, United States
Figures
Figure 1 with 2 supplements
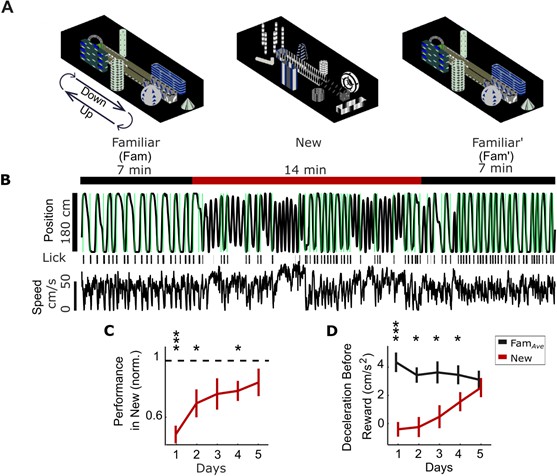
Behavior in new visual virtual reality (VR) environments.
(A) Head-fixed mice run to alternating ends of the VR track by controlling the movement of a floating spherical treadmill (Styrofoam ball). Mice run forward on the ball to traverse the track and rotate the ball to turn around in VR. Animals spend 7 min in a familiar environment (Fam), which is instantaneously replaced with a new environment (New) for 14 min, before returning to the same familiar environment (Fam’). The task is the same but the visual scene differs in the two environments. (B) Example mouse position in VR shows running to alternating ends of track with water rewards (green) in Fam, with worse performance in New. Lick bouts (black bars) are tracked with an electronic sensor on the lick tube. Ball speed shows similar magnitude in New and Fam environments. (C) Behavioral performance is initially impaired in New (rewards/min in New normalized to FamAve, the average performance in flanking Fam and Fam′ epochs) but improves over time. (D) Mice slow down prior to reward in the familiar environments, measured as deceleration in the 3 s window before reward. Deceleration before reward is initially lower in New but increases over days, suggesting anticipation of reward sites (N = 14 mice, *p<0.05, **p<0.01, ***p<0.001 by one-sample t-test with Bonferroni-Holm Correction (C) or paired sample t-test (D)).
-
Figure 1—source data 1
Statistical tests and results for Figure 1.
- https://doi.org/10.7554/eLife.47611.005
Figure 1—figure supplement 1
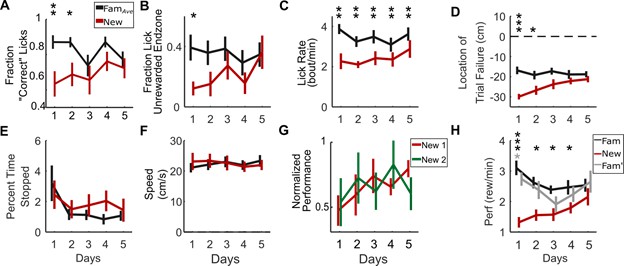
Behavior metrics in New world.
(A) Most licks in FamAve are within a 1 s window centered on reward delivery (defined as ‘correct’ licks). The fraction of ‘correct’ licks is initially lower in New relative to Fam but increases over days. (B) The fraction of incorrect, unrewarded, entries into a track endzone which coincide with a bout of licking across five days of remapping. Mice are significantly more likely to lick in expectation of a reward upon incorrectly entering an endzone in the familiar environment (when they return to the same reward zone twice in a row), suggesting that they know the reward locations in Fam but not New. This difference decreases over the course of exposure to the New world. (C) Mice lick at lower rates in New. (D) Mean distance from endzone of missed trial, identified as the location of a premature turn in the track. Failed trials (when animals turn around too early in the track and return to the same end zone, resulting in no reward) in the New world occur further from the correct end zones than they do in the familiar environment. This difference decreases over 5 days of remapping. (E) Mice spend a similar amount of time stopped in both environments over 5 days, indicating that stopped periods do not significantly contribute to decreased behavioral performance. (F) Running speed in New across five days of remapping, normalized to mean speed in FamAve. Average running speed is the same in FamAve and New, suggesting slower running does not contribute to decreased behavioral performance. (G) Recovery of behavioral performance does not accelerate when animals undergo a second sequence of remapping into another distinct new world (New 2). Performance in New 1 (original new environment) normalized to flanking FamAve was compared to performance in New 2 (second distinct new environment) across 5 days (N = 6, a subset of animals used in other panels, p>0.99 by paired sample t-test with Bonferroni-Holm Corrections). (H) Mice were initially impaired in behavioral performance in the new environment relative to both Fam and Fam′, but the data show return to high performance in Fam′, suggesting that satiation or fatigue do not contribute to impaired behavioral performance in New. Mean performance was measured in terms of rewards per minute in the New world over 5 days of remapping. Black asterisks represent Fam vs New, Gray asterisks represent Fam′ vs New. All Fam vs Fam′ comparisons are not significantly different. (N = 14 for all panels except (G); *p<0.05, **p<0.01, ***p<0.001 by paired sample t-test or one-sample t-test with Bonferroni-Holm corrections).
Figure 1—figure supplement 2

No track location preference in New.
Occupancy time along the length of the track was used to determine whether mice developed a new preference for a region of the track in New as compared to Fam. (A) Mouse residency in Fam over 5 days. Animals spend far more time in end zones than in the middle of the track. (B) Mouse residency in New over 5 days. Animals spend more time in the middle of the track upon initial exposure to New, but still spend more time in the end zones than in the middle of the track, with no sign of preferred areas on the track. (C) Mouse residency in Fam′ over 5 days. Animals spend far more time in the end zones than in the middle of the track (paired t-test between endzones and track p<0.001 for all days, all environments). (D) Average time animals spend in the endzone in each environment over 5 days of exposure to New. (N = 14, Paired t-test between environment endzone residency, *p<0.05 paired sample t-test with Bonferroni-Holm corrections).
Figure 2 with 4 supplements
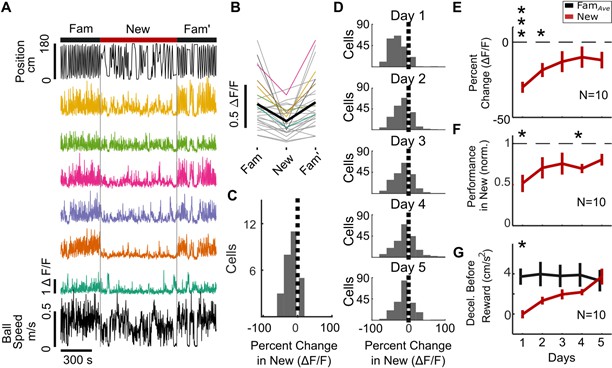
SOM+ interneuron (SOM-int) activity suppression in new environments.
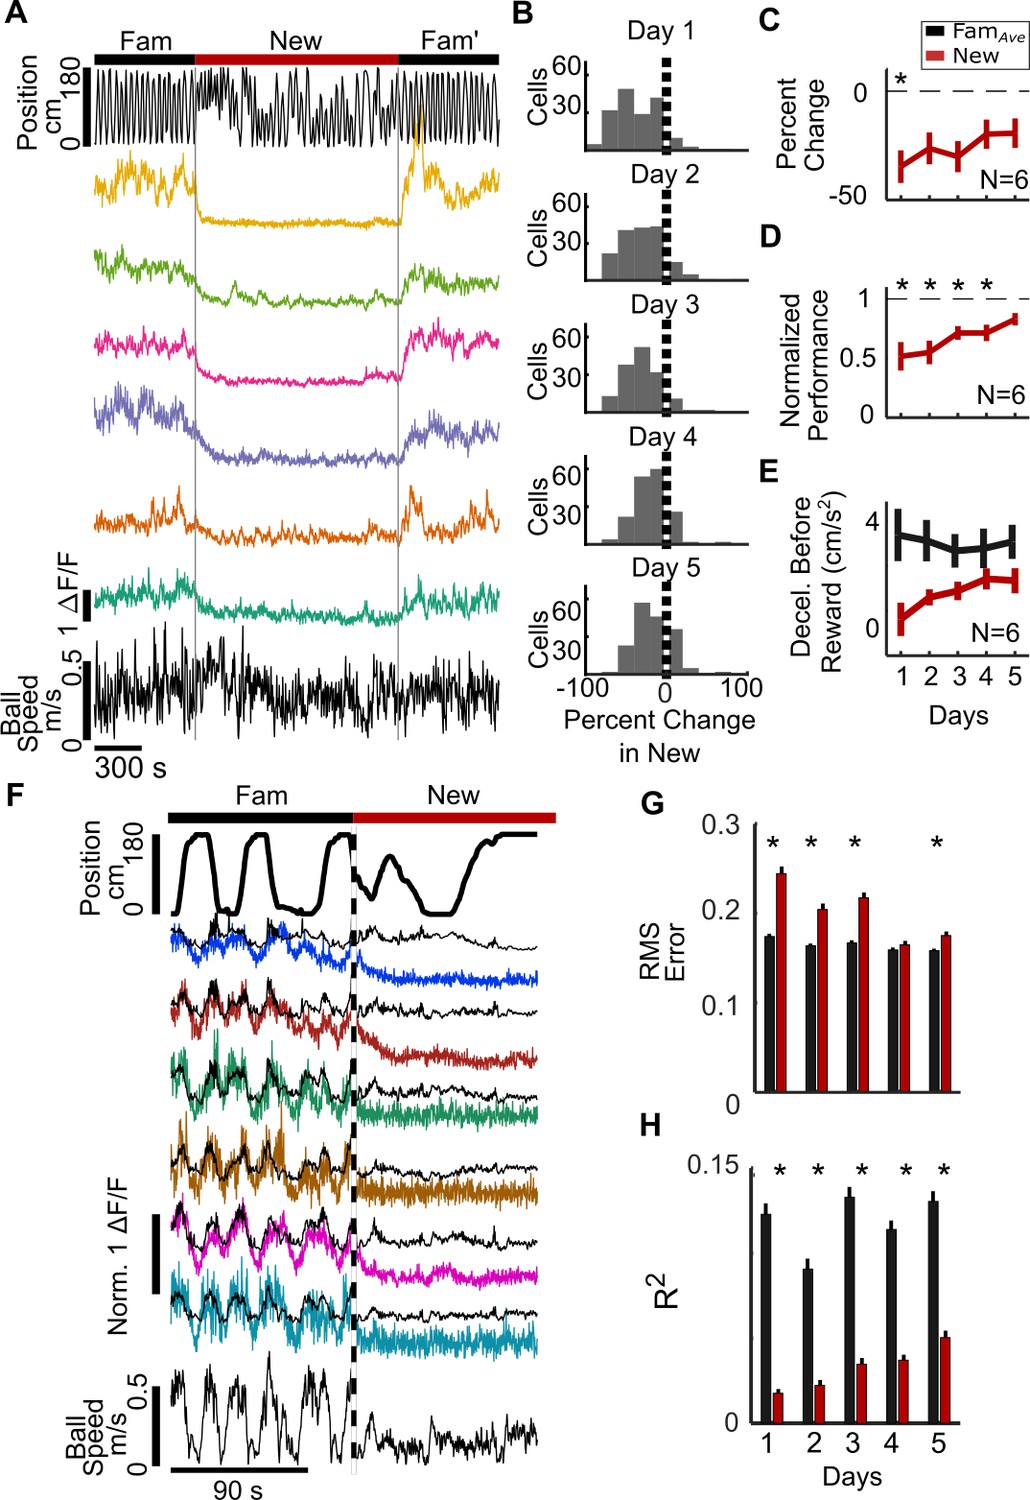
(A–C) Example data from individual mouse (SOM 1). (A) Top, position in VR track of example mouse. Middle, ΔF/F of sample SOM-ints showing activity suppression in New. (B) Mean ΔF/F of all cells from example mouse on Day 1 of New exposure in each environment (gray), mean ΔF/F of example cells from (A) in corresponding colors, with mean of all cells (black). (C) Histogram of percent change in ΔF/F of SOM-ints shown in panel (B) in New relative to FamAve on Day 1. (D) Activity suppression in New decreases with exposure over days (cells from all mice). (E) SOM-int activity is initially suppressed but recovers over days of exposure to New. (F) Performance in New world increases over days. (G) Mice increasingly slow down prior to reward in New. (N = 10, n = 209 cells; n.s. p>0.05, *p<0.05, **p<0.01, ***p<0.001 by paired sample t-test or one-sample t-test with Bonferroni-Holm corrections).
-
Figure 2—source data 1
Statistical tests and results for Figure 2.
- https://doi.org/10.7554/eLife.47611.011
Figure 2—figure supplement 1
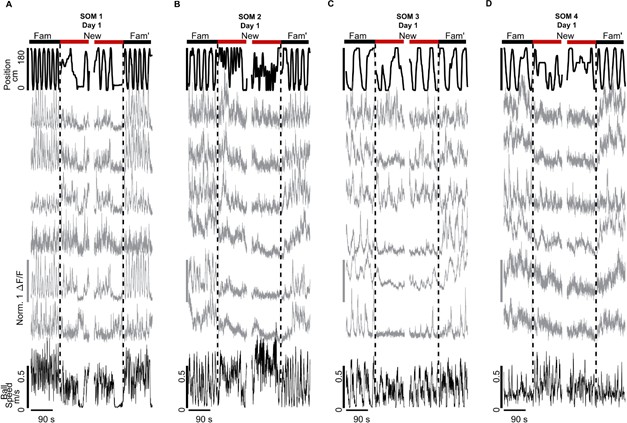
SOM-int activity suppression in multiple example animals.
Example cell activity on a smaller time scale for four example SOM mice on Day 1 of New environment. Top, position in VR track, middle, ΔF/F of sample cells, bottom, ball speed. (A) Example cells from mouse SOM 1, seen in Figure 2. (B) Example cells from mouse SOM 2, seen in Figure 2—figure supplement 2. (C) Example cells from mouse SOM 3, not otherwise shown. (D) Example cells from mouse SOM 4, not otherwise shown.
Figure 2—figure supplement 2

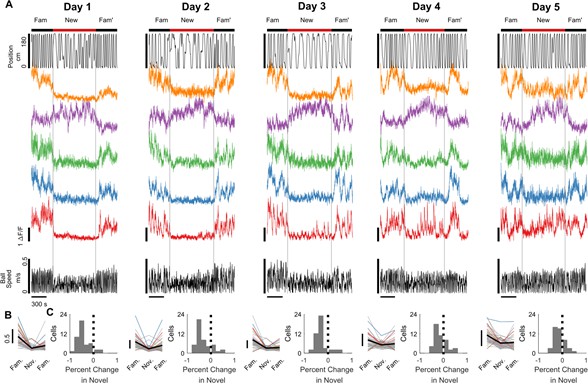
SOM-int activity suppression over 5 days of remapping into New.
(A) Cellular activity is initially strongly suppressed but recovers over multiple exposures to New. Top, position in VR track, middle, ΔF/F of sample cells, and bottom, ball speed (SOM 2). (B) Mean ΔF/F of all cells from an example mouse on Day 1 of remapping (colors) and mean (black). (C) Histogram of percent change in ΔF/F of SOM-ints in New world relative to FamAve across 5 days of remapping. (n = 25, mouse SOM 2.)
Figure 2—figure supplement 3
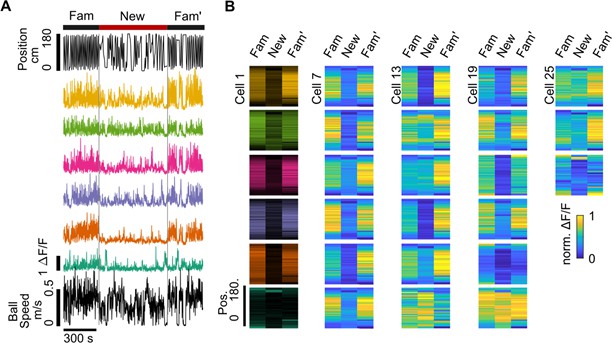
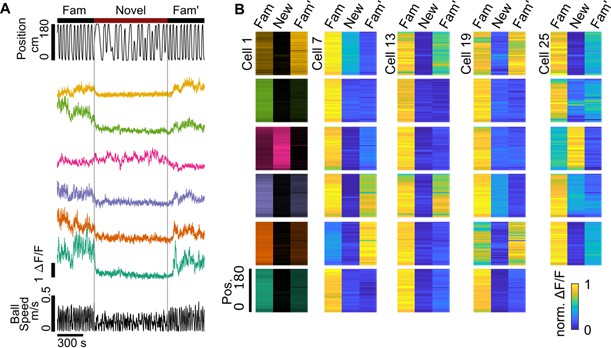
Broad SOM-int firing fields in Fam and New on Day 1.
Data from the same sample mouse for which data are shown in Figure 2A – C (SOM 1). (A) Top, position in VR track, middle, ΔF/F of sample cells, and bottom, ball speed. (B) SOM-int firing is broadly tuned in Fam and suppressed in New. Heatmaps of neuronal activity in the VR track on Day 1 of remapping for the 27 cells in this example mouse. Cells 1–6 are the cells shown in panel (A), with the same heatmap colors.
Figure 2—figure supplement 4
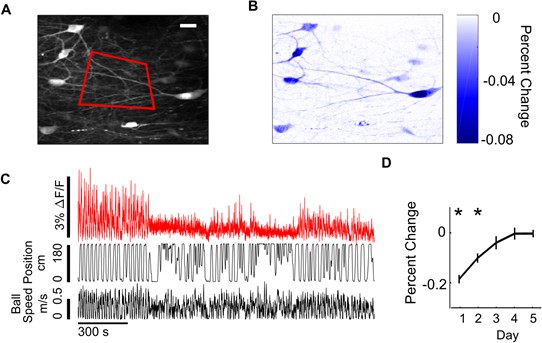
Suppression of SOM-int neurite activity.
(A) Sample plane of imaging from SOM-ints. The red box indicates the neuropil region of interest (ROI), consisting of putative SOM-int axon and dendrites, avoiding cell somata. (B) Pixel-wise percent change in a sample plane of imaging, showing broadly distributed suppression of activity in both soma and neurites. (C) ΔF/F trace of example plane (red), shown with position (middle) and running speed (bottom). (D) Average percent change in New over 5 days of exposure (N = 10, *p<0.05 by one-sample t-test with Bonferroni-Holm correction).
Figure 3 with 4 supplements
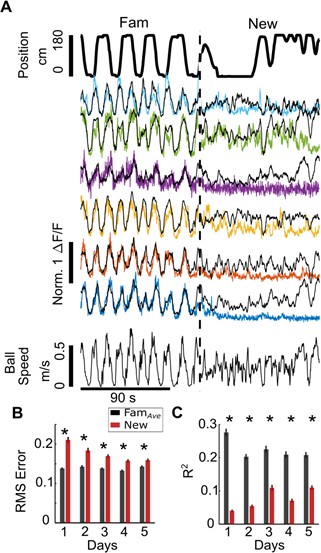
Decreased SOM-int activity in New is not explained by altered behavior.
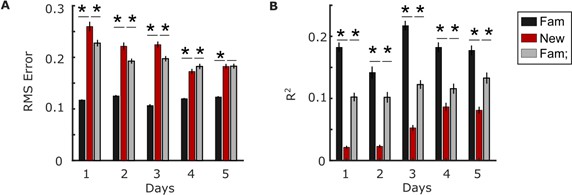
(A) Gaussian general linear models (GLMs) for individual SOM-ints were trained to predict calcium activity as a function of locomotion, VR movement, and rewards in Fam. In New, modeled ΔF/F (black) is larger than actual ΔF/F (colored traces), indicating that the suppression of activity is greater than that predicted from the model (using example mouse [SOM 5]). Note that mice can move on the ball but not change their VR position, as seen here shortly after transition into New. This occurs when animals ‘run’ directly into a VR wall so that they are stationary in VR but still moving. (B) Model fits are significantly worse in New versus FamAve based on average Root Mean Square (RMS) error (lower errors mean better model fit). (C) The average amount of variance (R2) capturedby model also shows worse model fit in New (greater R2 means better model fit) (*p<0.001 by paired sample t-test Bonferroni-Holm corrections, N = 10, n = 209).
-
Figure 3—source data 1
Statistical tests and results for Figure 3.
- https://doi.org/10.7554/eLife.47611.018
Figure 3—figure supplement 1

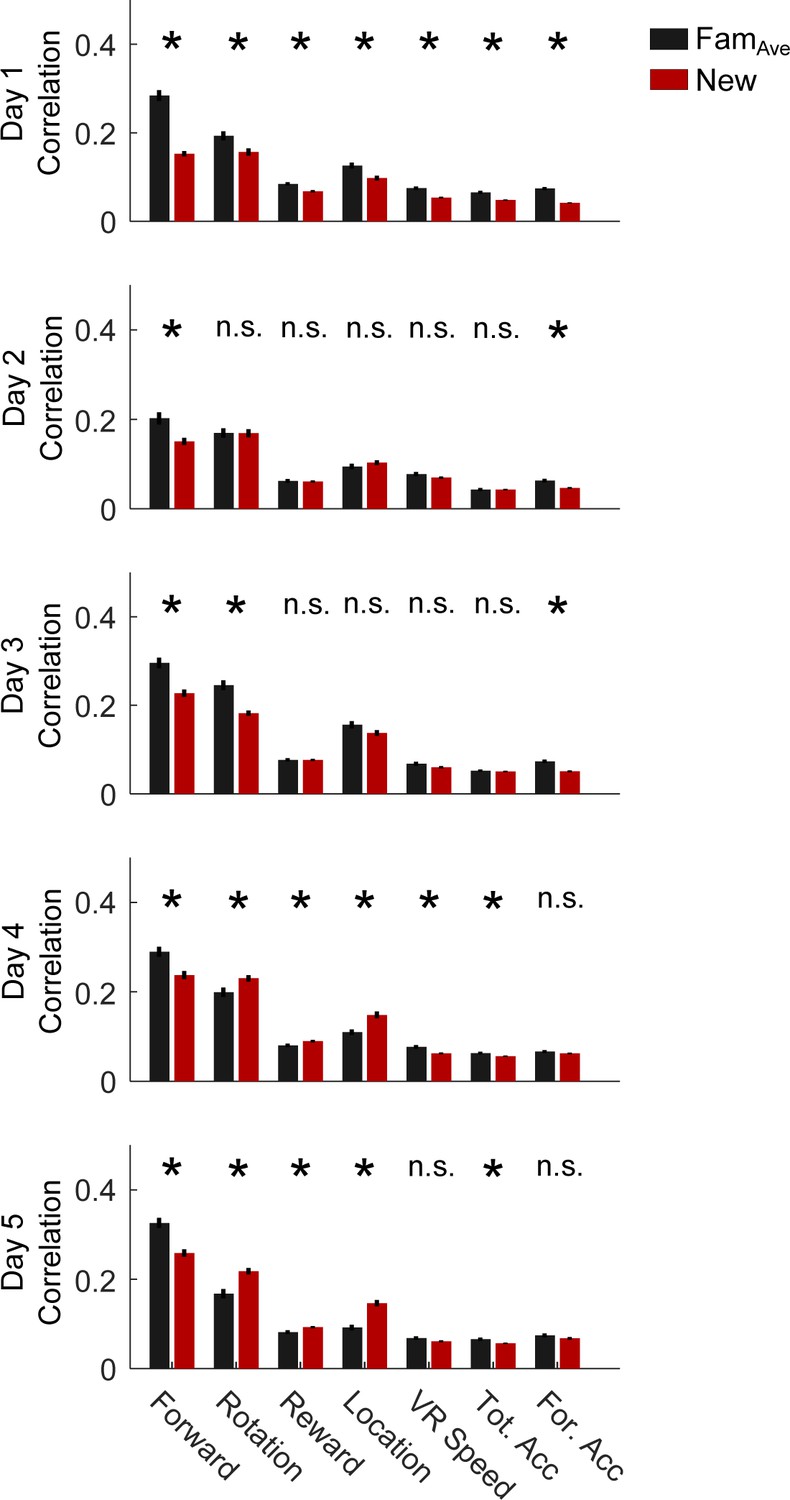
Behavioral variables are poorly correlated with SOM-int activity in New.
Correlation between cell activity and behavioral variables in FamAve and New (measured as the peak cross-correlation within a 2 s window). Activity correlations with behavior in New are decreased initially, and recover over days of exposure to New. Forward: forward component of running speed; Rotation: rotation component of running speed; Reward: timing of rewards; Location: position in VR track; VR Speed: speed in virtual reality environment; Tot. Acc.: total acceleration from mouse running speed; For. Acc: forward component of acceleration from mouse running speed. (N = 10, n = 209, *p<0.05, by paired sample t-test with Bonferroni-Holm corrections).
Figure 3—figure supplement 2
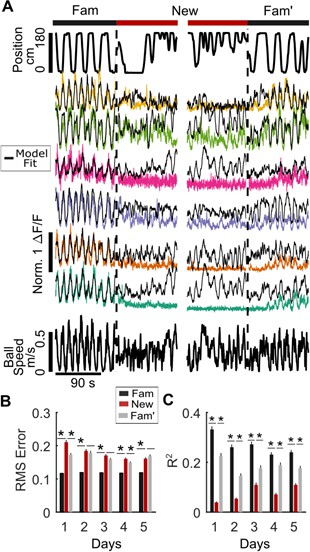
SOM-int GLM performance in different environments.
(A) On Day 1 in New, modeled ΔF/F (black) is larger than actual ΔF/F (colored traces), while in Fam′, modeled fit improves relative to New (in example mouse (SOM 5)). (B) RMS error of model fit is significantly different in Fam versus New on all days, while New is different from Fam′ on Day 1 and 4. (C) Average R2 between modeled fluorescence and cell fluorescence across environments and days. (*p<0.05, **p<0.01, ***p<0.001 by paired sample t-test with Bonferroni-Holm corrections, N = 10, n = 209).
Figure 3—figure supplement 3
Locomotion variables strongly contribute to SOM-int model fits.
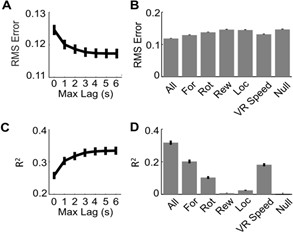
(A) Using behavioral data at increasing possible maximum lag values for behavioral variables improves model performance. Linear models were trained on behavioral data with a varying amount of time permitted in the range used to identify the peak of the cross correlation between cell activity and behavioral parameters. Model error (root mean square) decreases with amount of lag included in the model. (B) Linear models were trained using only one of the parameters used to train the full model to examine the relative importance of different parameters to model performance. Model error (2 s lag used) is lowest when including all of the features used to train model. Relative performance of model trained on only one feature varies. For: forward component of running speed; Rot: rotation component of running speed; Rew: timing of rewards; Loc: position in VR track; VR Speed: speed in virtual reality environment; Null: constant model at mean firing rate. (C) Fraction of variance explained by model (R2) increases with amount of lag included in the model. (D) Fraction of variance (R2) explained by model (2 s lag used) is highest when including all of the features used to train the model. (N = 10, n = 209).
Figure 3—figure supplement 4
Behavioral variables poorly estimate SOM-int activity in New on Day 1.
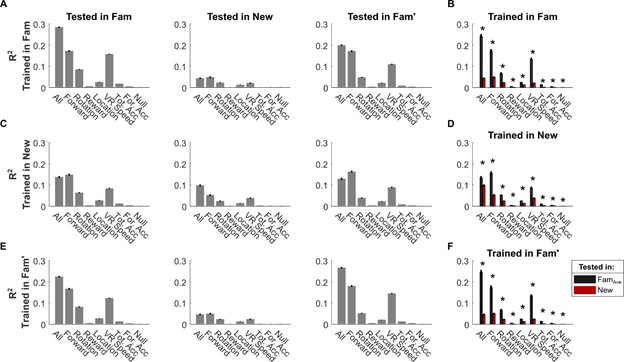
(A) Performance of versions of linear model (R2) trained in Fam using all behavioral variables, as well as each parameter individually, and tested in each of the three environments. Models trained in Fam accurately estimate cell activity when using locomotion variables in Fam and Fam′. Model accuracy is much worse in New. (B) Performance in FamAve and New compared for each model type. (C) Performance of models trained in New, tested in each of the three environments. Even when trained in New, the model performs poorly in New. (D) Models trained in New actually perform better in FamAve, indicating an unpredictable relationship between behavior and activity in New. (E) Performance of models trained in Fam′ using all behavioral variables, as well as each parameter individually, and tested in each of the three environments. Models trained in Fam′ perform well in Fam and Fam′, but not in New. (F) Performance in FamAve and New compared for each model type. All: model trained using all variables; Forward: forward component of running speed; Rotation: rotation component of running speed; Reward: timing of rewards; Location: position in VR track; VR Speed: speed in virtual reality environment; Tot Acc: total acceleration; For Acc: forward component of acceleration; Null: constant model at mean ΔF/F (N = 10, n = 209,*p<0.05, by paired sample t-test with Bonferroni-Holm corrections).
Figure 4 with 6 supplements
PV+ interneuron (PV-int) activity suppression in new environments.
(A) Example data from an individual mouse (PV 1). Top, position in the VR track of an example mouse. Middle, ΔF/F of sample PV-ints showing activity suppression in New. (B) Histogram of percent change in ΔF/F of PV-ints from all mice in New relative to FamAve on Day 1, showing initial activity suppression in New that decreases with exposure over days. (C) PV-int activity is initially suppressed but recovers over days of exposure to New. (D) Performance in a New world increases over days. (E) Mice show a non-significant trend toward decreased deceleration before reward in New. (F) Gaussian general linear models (GLMs) for individual PV-ints were trained as a function of locomotion, VR movement, and rewards in Fam to predict calcium activity. In New, modeled ΔF/F (black) is larger than actual ΔF/F (colored traces), indicating that suppression of activity is greater than that predicted by the model (in example mouse (PV 2)). (G) Model fits are significantly worse in New versus FamAve based on average Root Mean Square (RMS) error (lower errors mean better model fit). (H) Average amount of variance (R2) predicted by model also shows worse model fit in New (greater R2 means better model fit) (*p<0.001 by paired sample t-test Bonferroni-Holm corrections, N = 6, n = 172).
-
Figure 4—source data 1
Statistical tests and results for Figure 4.
- https://doi.org/10.7554/eLife.47611.026
Figure 4—figure supplement 1
PV-int activity suppression over 5 days of remapping into New.
(A) Cellular activity is initially strongly suppressed but recovers over multiple exposures to New in an example mouse (PV 3). Top, position in VR track, middle, ΔF/F of sample cells, and bottom, ball speed. (B) Mean ΔF/F of all cells from an example mouse on Day 1 of remapping (colors) and mean (black). (C) Histogram of percent change in ΔF/F of SOM-ints in New world relative to FamAve across 5 days of remapping (n = 46).
Figure 4—figure supplement 2
Broad PV-int firing fields in Fam and New on Day 1.
Data from the same sample mouse as that shown in Figure 4—figure supplement 1 panels (A–C). (A) Top, position in VR track, middle, ΔF/F of sample cells (PV 1), and bottom, ball speed. (B) PV-int firing is broadly tuned in Fam and suppressed in New. Heatmaps of neuronal activity in the VR track on day 1 of remapping 28 cells from this example mouse. Cells 1–6 are the cells shown in panel (A), with the same color of heatmap.
Figure 4—figure supplement 3

Suppression of PV-int neurite activity.
(A) Sample plane of imaging from PV-expressing interneurons. The red box indicates the neuropil region of interest (ROI), consisting of putative PV-int axon and dendrites, avoiding cell soma. (B) Pixel-wise percent change in the sample plane of imaging, showing broadly distributed suppression of activity in both soma and neurites. (C) ΔF/F trace of example plane (red), shown with position (middle) and running speed (bottom). (D) Average percent change in New over 5 days of exposure (N = 6, *p<0.05 by one-sample t-test with Bonferroni-Holm correction).
Figure 4—figure supplement 4
Behavioral variables are poorly correlated with PV-int activity in New.
Correlation between PV-int activity and behavioral variables in Famave and New (measured as peak cross-correlation within a 2 s window). Activity correlations with behavior in New are decreased initially, and recover over days of exposure to New. Forward: forward component of running speed; Rotation: rotation component of running speed; Reward: timing of rewards; Location: position in VR track; VR Speed: speed in virtual reality environment; Tot. Acc: total acceleration from mouse running speed; For. Acc: forward component of acceleration from mouse running speed (N = 6, n = 172, *p<0.05, by paired sample t-test with Bonferroni-Holm corrections).
Figure 4—figure supplement 5
PV-int GLM performance in different environments.
(A) RMS error of model fit is significantly different in Fam versus New on all days, while New is different from Fam′ on Days 1 and 4. (B) Average R2 between modeled fluorescence and cell fluorescence across environments and days. (*p<0.05 by paired sample t-test with Bonferroni-Holm corrections N = 6, n = 172).
Figure 4—figure supplement 6

Behavioral variables poorly estimate PV-int activity in New on Day 1.
(A) Performance of versions of linear model (R2) trained in Fam using all behavioral variables, as well as each parameter individually, and tested in each of the three environments. Models trained in Fam accurately estimate cell activity when using locomotion variables in Fam and Fam′. Model accuracy is much worse in New. (B) Performance in FamAve and New compared for each model type. (C) Performance of models (R2) trained in New, tested in each of the three environments. Even when trained in New, the model performs poorly in New. (D) Models trained in New often perform better in FamAve, indicating an unpredictable relationship between behavior and activity in New. (E) Performance of models trained in Fam′ using all behavioral variables, as well as each parameter individually, and tested in each of the three environments. Models trained in Fam′ perform well in Fam and Fam′, but not in New. (F) Performance in FamAve and New compared for each model type. All: model trained using all variables; Forward: forward component of running speed; Rotation: rotation component of running speed; Reward: timing of rewards; Location: position in VR track; VR Speed: speed in virtual reality environment; Tot Acc: total acceleration; For Acc: forward component of acceleration; Null: constant model at mean ΔF/F (N = 6, n = 172, *p<0.05, by paired sample t-test with Bonferroni-Holm corrections).
Figure 5 with 2 supplements

SOM-int activity suppression remains high when performance recovery is blocked in a ‘No Task’ environment.
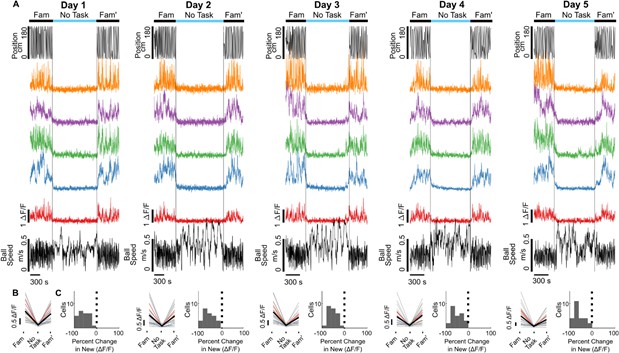
(A–C) Example data from an individual mouse (SOM 6). (A) Cells from the sample mouse are strongly suppressed during the ‘No Task’ epoch (static black screen, no rewards). Top, position in VR track, middle, ΔF/F of sample cells, and bottom, ball speed. (B) ΔF/F of all cells from an example mouse on Day 1 of ‘No Task’ exposure showing activity suppression (mean of all cells in black). (C) Histogram of percent change in ΔF/F of SOM-ints from the example mouse on Day 1 of ‘No Task’ showing strong suppression. (n = 18). (D) Interneurons remain suppressed over several days of ‘No Task’ exposure. Histogram of percent change of all cells. (E) In ‘No Task’ exposure, SOM-ints remain suppressed in contrast to recovery during exposure to New. ( The same six mice, which are a subset of the ten mice used in Figure 2E, were exposed to No Task and New). (F) Average speed in ‘No Task’ environment increases relative to Familiar, in contrast to New. (n.s. p>0.05, *p<0.05, **p<0.01, ***p<0.001 by paired sample t-test or one-sample t-test with Bonferroni-Holm corrections, N = 6, n = 116).
-
Figure 5—source data 1
Statistical tests and results for Figure 5.
- https://doi.org/10.7554/eLife.47611.030
Figure 5—figure supplement 1
SOM-int activity suppression in the No Task environment.
Cellular activity remains strongly suppressed over multiple exposures to the No Task environment. (A) Top, position in VR track, middle, ΔF/F of sample cells (SOM 7), and bottom, ball speed. (B) Mean ΔF/F of all cells from an example mouse on Day 1 of the No Task environment. (C) Histogram of percent change in ΔF/F of SOM-ints in No Task relative to FamAve environments across 5 days of exposure. (n = 24).
Figure 5—figure supplement 2
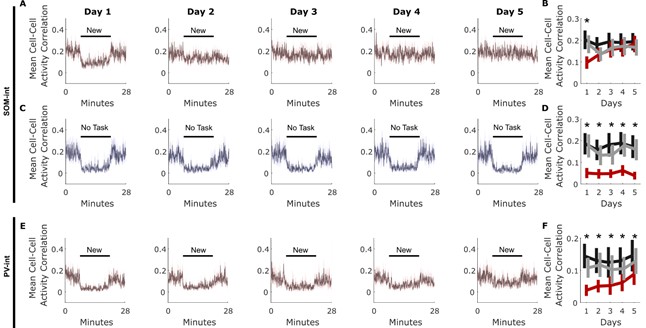
Short-time correlation declines in new environments.
Short-time correlation, measured as the overall mean of all pairwise activity correlations within a time bin, decreases in new environments. (A) SOM-int short-time (5 s non-overlapping bins) cell-cell activity correlation across time for each of 5 days of exposure to New. (B) SOM-int mean activity correlation decrease during New in comparison to Fam on the first day. (C) SOM-int short-time cell-cell correlation across time for each of 5 days of exposure to No Task. (D) SOM-int mean activity correlation decreased on all days in No Task compared to Fam. (E) PV-int short-time cell-cell activity correlation across time for each of 5 days of exposure to New. F, PV-int mean activity correlation decreased on all days in Ne compared to Fam. (SOM-int: New, N = 10; No Task, N = 6; PV-int: New, N = 6; *p<0.05 comparing either Fam and New, or Fam and No Task, by paired sample t-test with Bonferroni-Holm corrections).
Figure 6 with 3 supplements
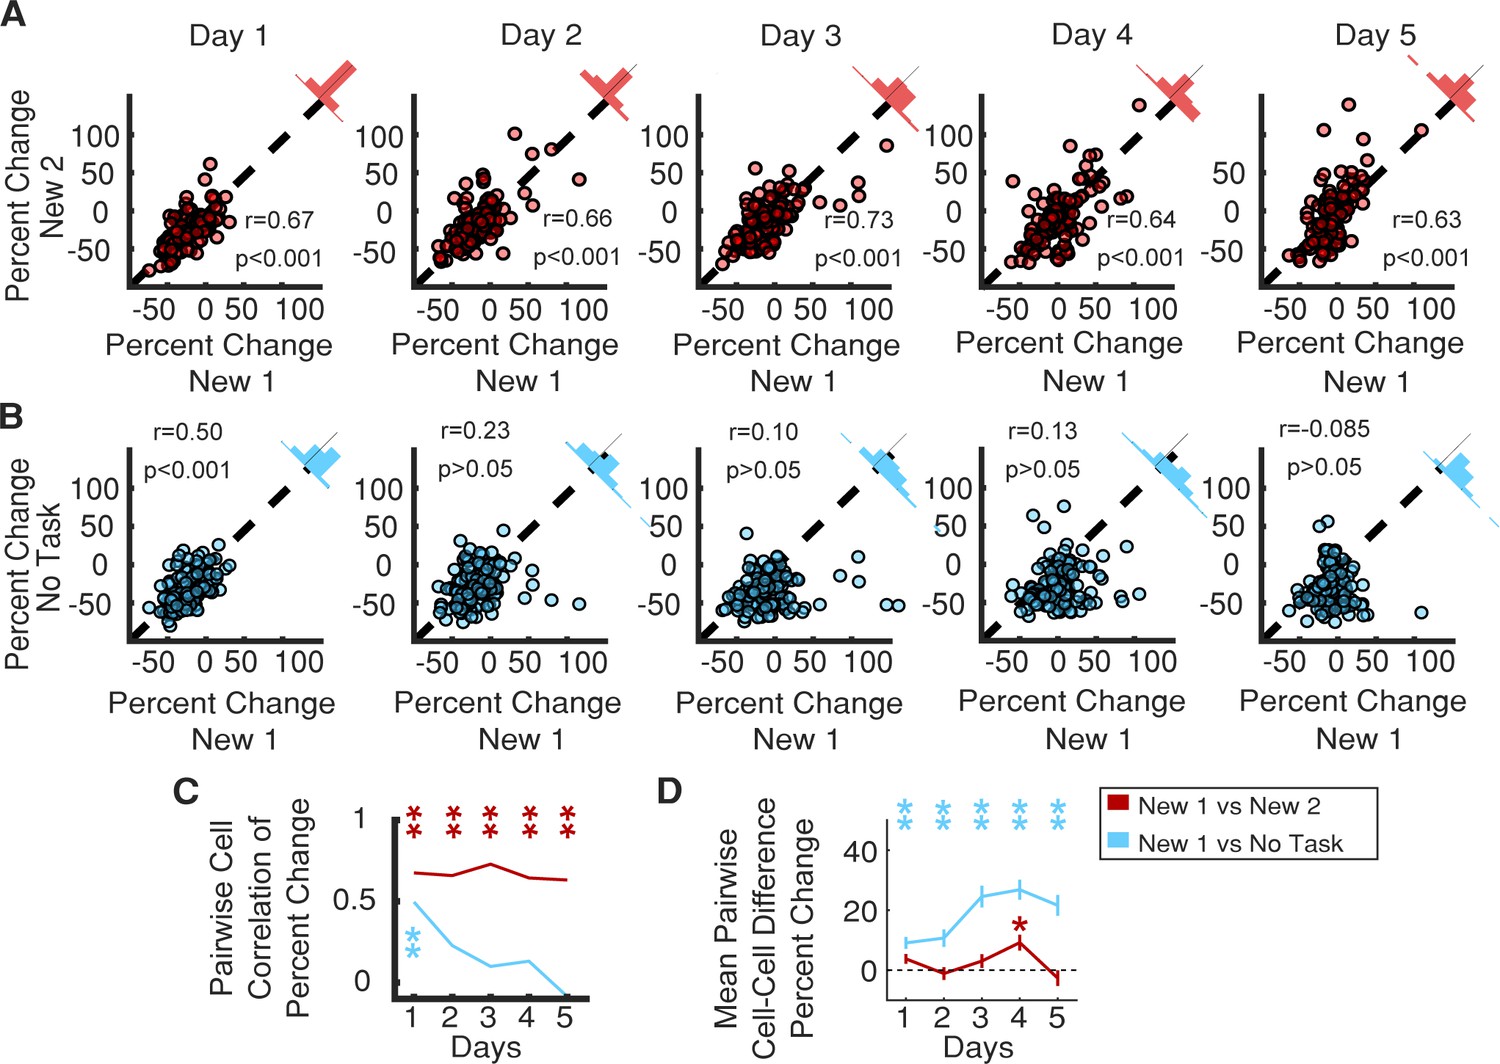
Consistent SOM-int activity responses across different new environments and in ‘No Task’ epoch.
(A) Individual SOM-ints show correlation in activity modulation in two distinct New environments. (B) Similar correlation of activity modulation is seen between New 1 and ‘No Task’ exposures for Day 1. On subsequent days, correlation disappears as SOM-int activity begins to return in New 1 while remaining suppressed in ‘No Task’. (C) Summary of correlation data from (A) and (B). Correlation between percent change of cells between two remapping sessions or between remapping session one and the ‘No Task’ exposure session. (D) Mean difference in percent change in activity in cells between remapping and ‘No Task’ exposure settings (*p<0.01, **p<0.001, one-sample t-test with Bonferroni-Holm correction N = 6, n = 116).
-
Figure 6—source data 1
Statistical tests and results for Figure 6.
- https://doi.org/10.7554/eLife.47611.035
Figure 6—figure supplement 1
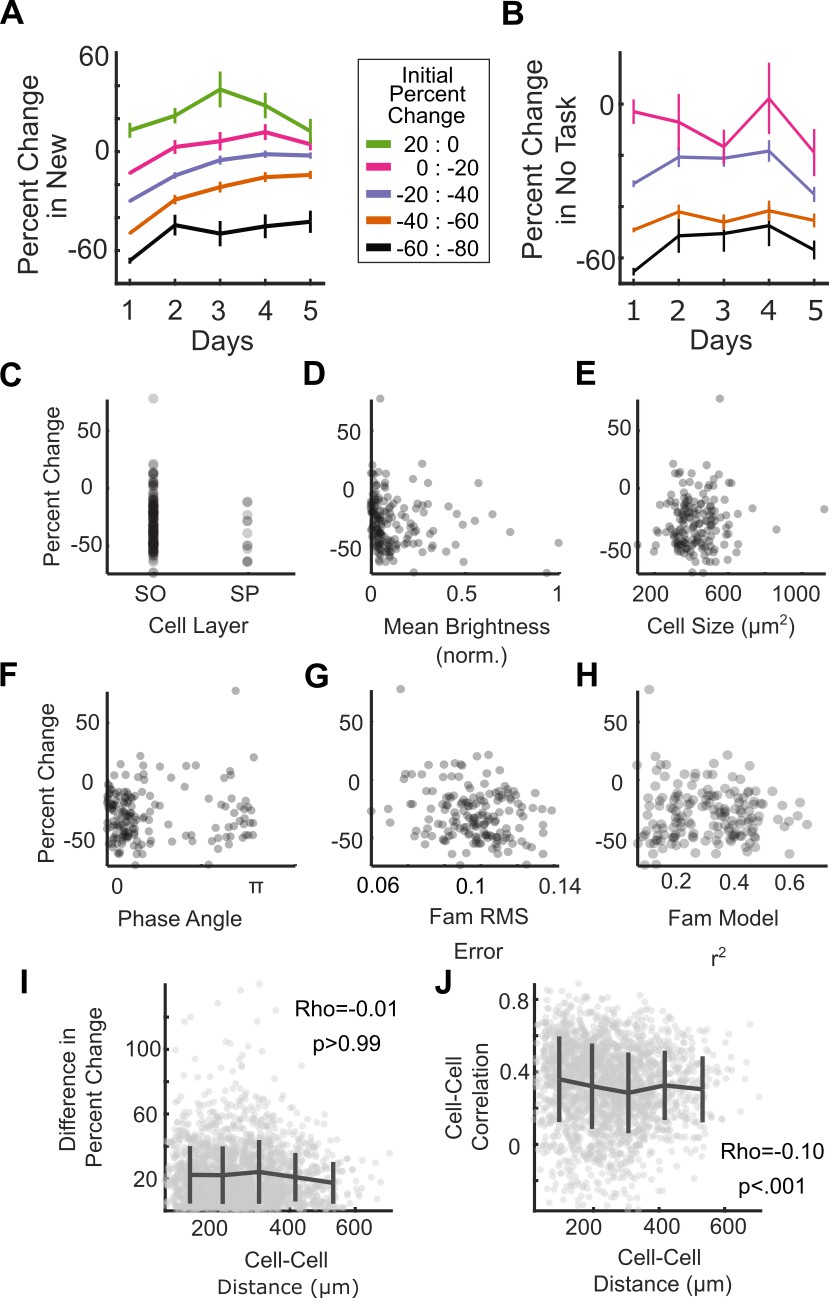
Characterization of suppressed SOM-ints.
(A) SOM-ints most inhibited on Day 1 in New remain the most suppressed over the course of the experiment. Percent change in activity in New relative to FamAve, across 5 days, stratified by degree of suppression on Day 1. (B) Percent change in activity in ‘No Task’ session, stratified by degree of suppression on Day 1. (C) Soma location was not associated with activity suppression in New. Percent change of activity on Day 1 in New based on soma location, either stratum oriens (SO) or stratum pyramidale (SP). Most SOM-expressing bistratified interneurons have somas in SP, whereas most Oriens-lacunosum moleculare (OLM) interneurons have somas in SO. (D) Mean cell brightness was not associated with activity suppression in New. Percent change of activity on Day 1 in New versus mean cell brightness. (E) Soma cell size was not associated with activity suppression in New. Percent change of activity on Day 1 of New versus cell size. (F) SOM-int activity correlation with locomotion was not associated with activity suppression in New. Percent change of activity on Day 1 in New versus phase angle of the Hilbert transform for the correlation between stop-triggered mean activity and running speed for each cell. Cells with a positive activity correlation with locomotion have a phase angle near 0, whereas those that are anti-correlated (activated by immobility) are shifted ~180° or π radians. (G) GLM model fit was not associated with activity suppression in New. Percent change of activity on Day 1 in New versus RMS error of model fit to actual cellular ΔF/F in Fam. (H) Percent change of activity on Day 1 in New versus R2 of model fit to actual cellular ΔF/F in Fam. (I) There is no association between cell proximity and strength of response to New (p>0.99). (J) Closer cells have more correlated activity (Spearman Rho −0.1, p<0.001). (A–H: N = 10, n = 209. A, B: vertical bars are binned mean with s.e.m., horizonal is connecting line. I, J: N = 10, n = 1793 cell pairs, vertical bars are binned mean with s.d., horizonal is connecting line.)
Figure 6—figure supplement 2
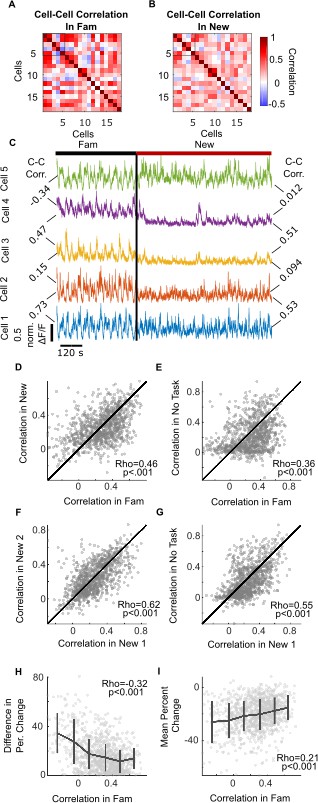
SOM-int network activity structure is stable across environments.
(A) Correlation matrix of pairwise comparisons of SOM-int ΔF/F of cells from a single imaging plane in Fam. The color of each square represents the Pearson correlation between cell-activity traces. (B) Correlation matrix for same cells in a subsequent New epoch. Cell-cell activity relationships are generally maintained, although the magnitude of activity correlation changes in New. (C) Colored traces, ΔF/F of cells 1–5 from panels (A) and (B) at the transition from Fam to New. Cell-cell correlation values between traces are shown to the left for Fam epoch and to the right for New. Cell pairs have similar activity correlation in Fam and New. (D) Scatter plot of cell pair activity correlation in New vs. Fam. (E) Scatter plot of cell pair activity correlation in No Task vs. Fam. (F) Scatter plot of cell pair activity correlation in New1 vs. New2. (G) Scatter plot of each pair activity correlation in No Task vs. New. (H) Scatter plot of cell pair activity correlation vs. absolute difference in percent change in activity in New between each cell pair. Cell pairs with more dissimilar activity in Fam show larger differences in activity suppression in New. (I) Scatter plot of cell pair activity correlation vs. mean percent change of activity in New for each cell pair. (N = 6, n = 1036 cell pairs. In panels (D–E), the line is unity, tests are Spearman Rank Correlation. In (H, I), vertical bars are binned mean with s.d.; Spearman rho).
Figure 6—figure supplement 3

SOM-int network activity structure is stable across days in the same environment.
(A) Scatter plot of cell pair activity correlation in Fam across 5 days. (B) Scatter plot of cell pair activity correlation in New across 5 days. (C) Scatter plot of cell pair activity correlation in No Task across 5 days. (N = 6, n = 1036 cell pairs, line is unity, test by Spearman Rank Correlation).
Videos
Video 1
Activity suppression of SOM-ints in New world.
GCaMP6f fluorescence in SOM-ints in mouse running in Fam, New (marked ‘New World’ in movie, 1st day of exposure), and Fam′. Field of view is ~170 µm x ~ 90 µm. Movie is binned into 2 s frames and played at 57.9X speed (original movie is 29.8 min long).
Additional files
-
Transparent reporting form
- https://doi.org/10.7554/eLife.47611.036
Download links
A two-part list of links to download the article, or parts of the article, in various formats.
Downloads (link to download the article as PDF)
Open citations (links to open the citations from this article in various online reference manager services)
Cite this article (links to download the citations from this article in formats compatible with various reference manager tools)
Structured inhibitory activity dynamics in new virtual environments
eLife 8:e47611.
https://doi.org/10.7554/eLife.47611


