Spatiotemporal control of mitotic exit during anaphase by an aurora B-Cdk1 crosstalk
- Universidade do Porto, Portugal
- University of Massachusetts, United States
Figures
Figure 1 with 3 supplements
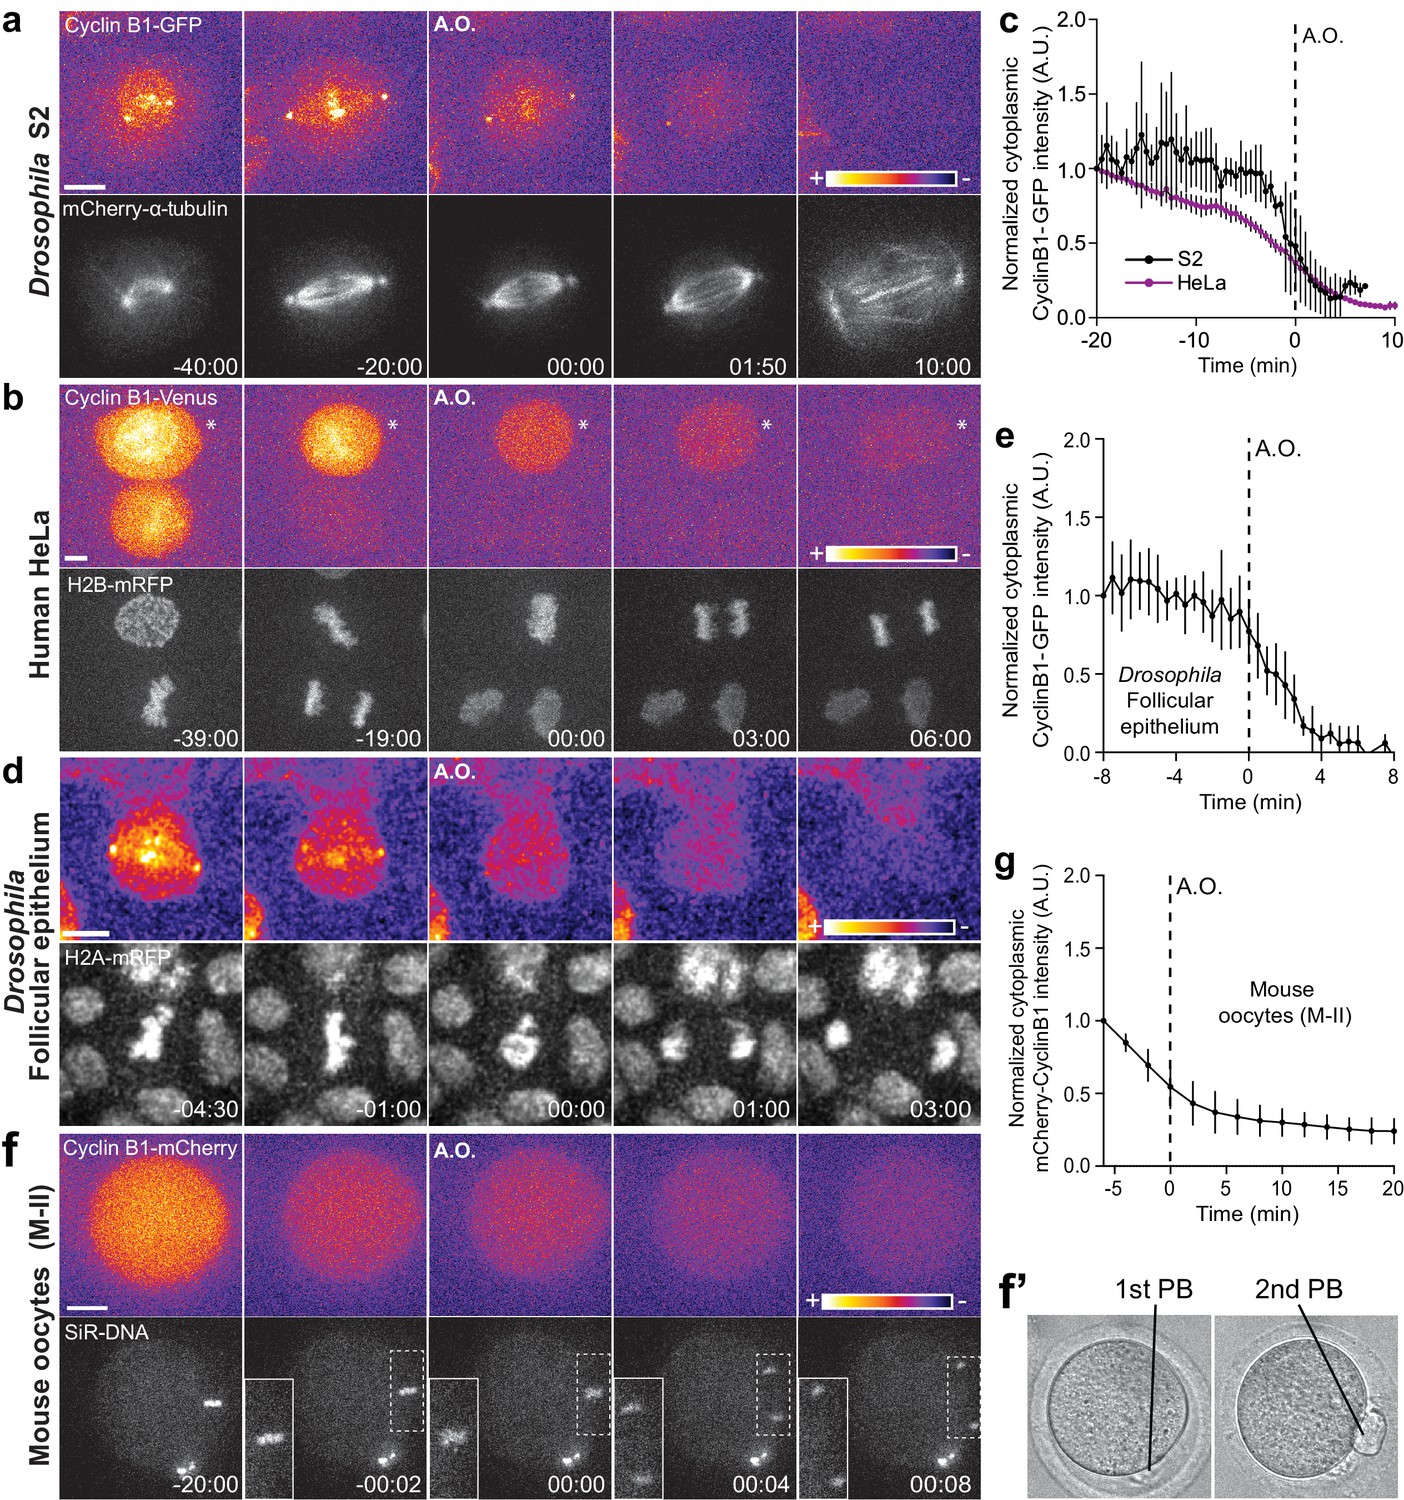
Cyclin B1 continues to be degraded during anaphase.
(a) Drosophila S2 cell from nuclear envelope breakdown to NER showing the different pools of Cyclin B1 in the mitotic apparatus. Scale bar is 5 μm. (b) Two neighbor HeLa cells (* indicates a cell that is slightly delayed relative to its neighbor; compare relative Cyclin B1 levels between neighbors as they exit mitosis) expressing exogenous H2B-mRFP and showing continuous degradation of endogenous Cyclin B1-Venus during anaphase. Scale bar is 5 μm. (c) Cyclin B1 degradation profile in Drosophila S2 cells (n = 4 cells) and in HeLa cells with endogenously tagged Cyclin B1-Venus (n = 3 cells). Fluorescence intensity values were normalized to 20 min before anaphase onset (A.O.). (d) Time-lapse images of dividing Drosophila follicle cells expressing endogenously tagged Cyclin B1-GFP and His2Av-mRFP. Scale bar is 5 μm. (e) Quantification of Cyclin B1-GFP fluorescence intensity in the cytoplasm (n = 8 cells, five ovaries). Fluorescence intensity values were normalized to 8 min before A.O. (f) Time-lapse images of a metaphase II oocyte expressing Cyclin B1-mCherry and stained with SiR-DNA undergoing anaphase II after parthenogenic activation. Inset is 1.5x magnification of separating chromosomes. (f’) Images of transmission light microscopy showing the same oocyte prior to and after imaging. Note the presence of the first and second polar bodies. Scale bar is 20 μm. (g) Quantification of Cyclin B1-mCherry fluorescence intensity in the cytoplasm (n = 20 oocytes, two independent experiments). Fluorescence intensity values were normalized to 6 min before anaphase onset. The LUT ‘fire’ is used to highlight Cyclin B1 localization in the different systems. Time in all panels is in min:sec.
Figure 1—figure supplement 1
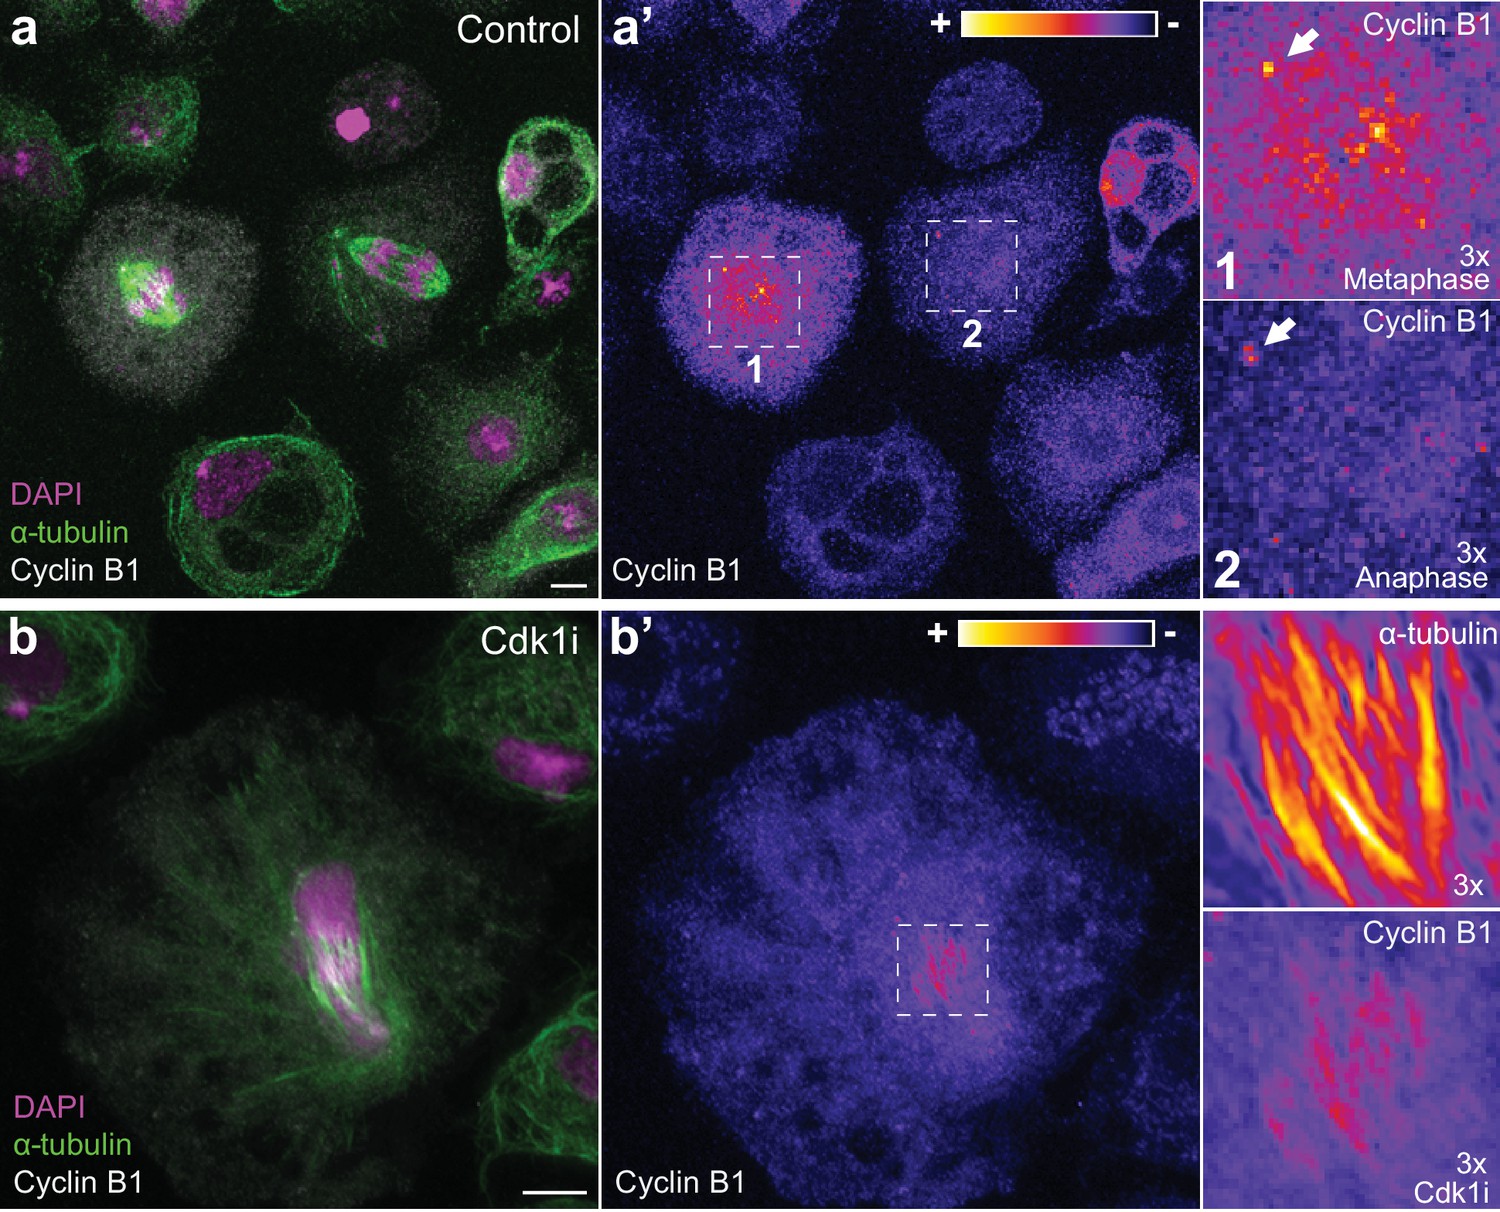
Endogenous Cyclin B1 is detectable on centrosomes in metaphase and anaphase and can localize to spindle midzone microtubules in Drosophila S2 cells.
(a) Images of fixed Drosophila S2 cells co-stained for endogenous Cyclin B1 and α-tubulin. (a’) Highlight of Cyclin B1 levels with the LUT ‘fire’. Note the global decrease in endogenous Cyclin B1 levels from metaphase (1) to anaphase (2) (compare cytoplasmic pools). Nevertheless, early anaphase cells maintain a centrosome-associated pool of Cyclin B1 (white arrows in the magnifications). (b) Fixed Drosophila S2 cell co-stained for endogenous Cyclin B1 and α-tubulin and induced to exit mitosis through Cdk1 inhibition 10 min before fixation. (b’) Highlight of Cyclin B1 and α-tubulin staining with the LUT ‘fire’. Co-localization of endogenous Cyclin B1 and microtubules can be observed in cells exiting mitosis. Scale bar is 5 μm.
Figure 1—figure supplement 2
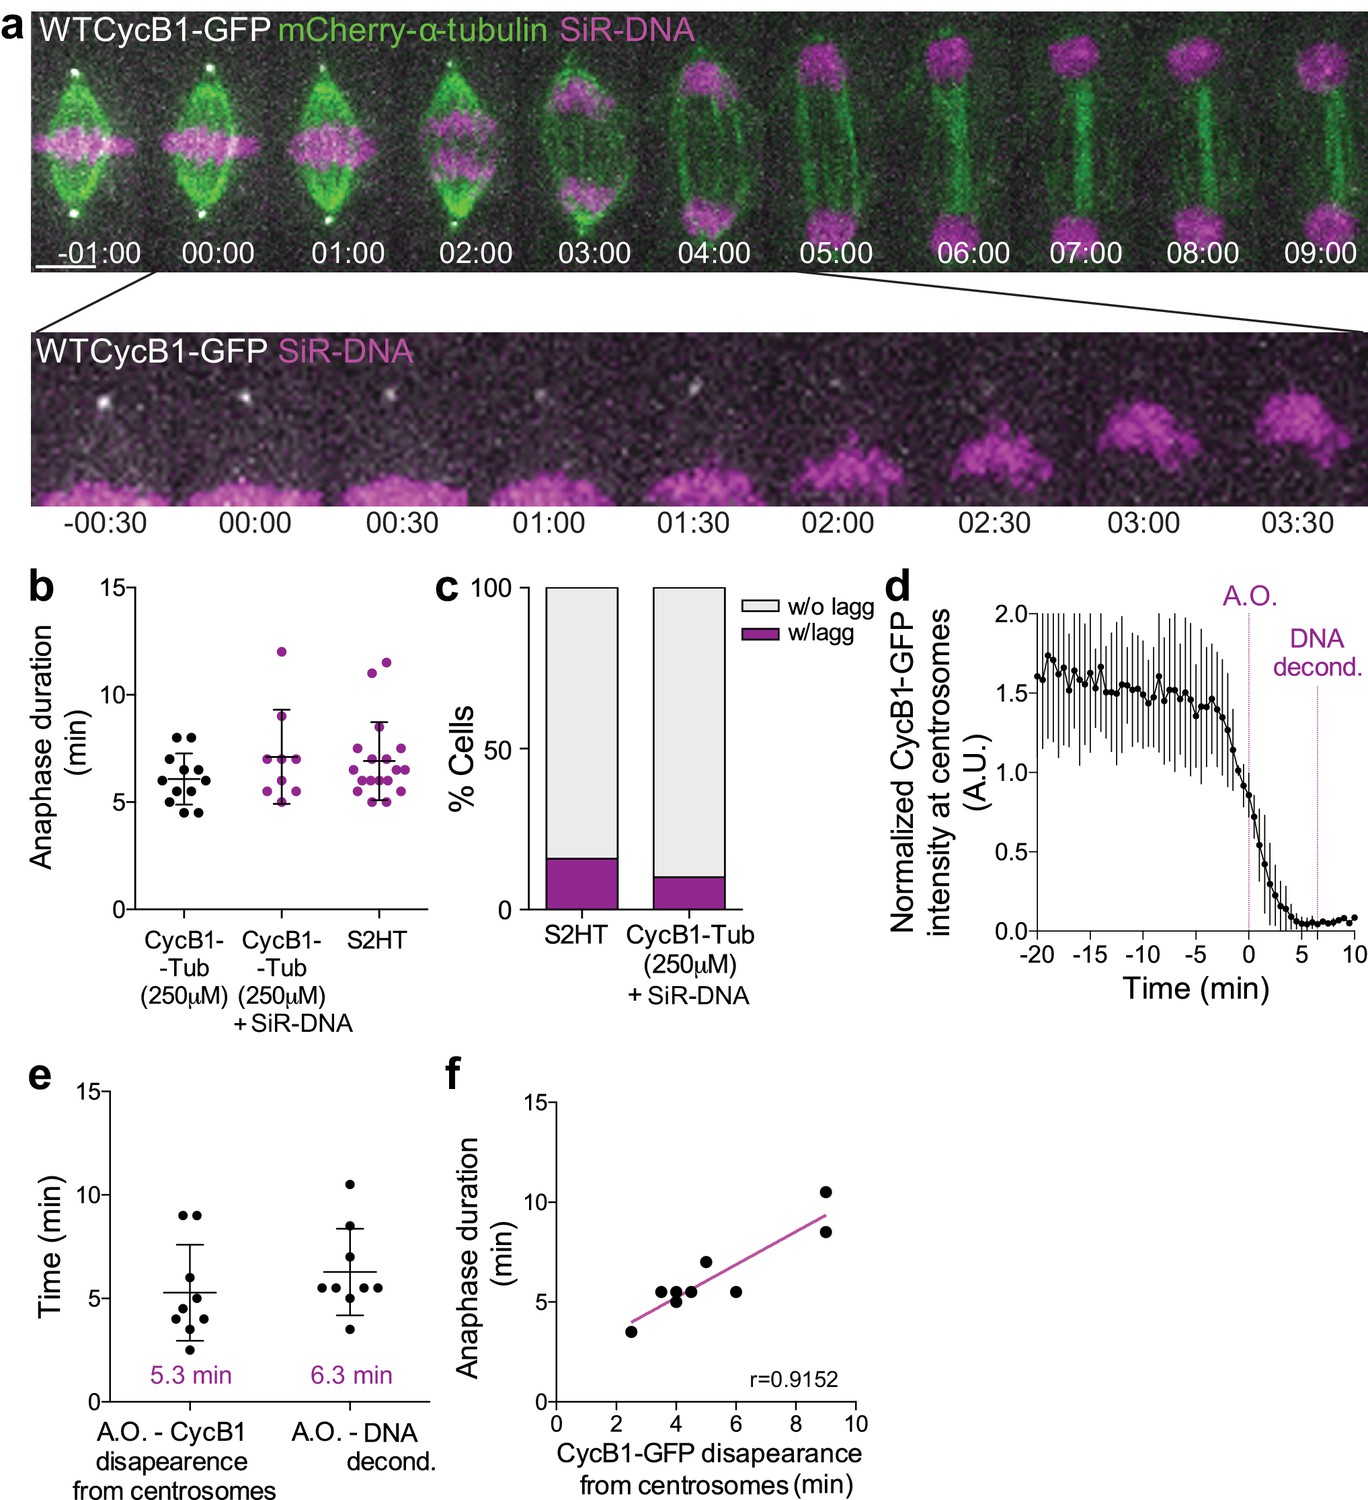
Cyclin B1 degradation during anaphase correlates with DNA decondensation.
(a) Control Drosophila S2 cell stably expressing Cyclin B1-GFP/mCherry-α-tubulin and stained with SiR-DNA to follow mitotic chromosomes. Cyclin B1-GFP localization and degradation on centrosomes during anaphase is highlighted. Scale bar is 5 μm. Time is in min:sec. (b) Comparison of anaphase duration between Drosophila S2 cells expressing Cyclin B1-GFP/mCherry-α-tubulin, the same cells with SiR-DNA or cells expressing H2B-GFP/mCherry-α-tubulin. Differences between experiments are not significant, as tested with a nonparametric Mann-Whitney test. (c) Frequency of Drosophila S2 cells with lagging chromosomes in the same samples as in (b). In both (b) and (c) SiR-DNA had no impact on anaphase progression or chromosome segregation fidelity. (d) Quantification of Cyclin B1-GFP fluorescence intensity at centrosomes (n = 6 cells). Fluorescence intensity values were normalized to metaphase (−20 min). A.O. = Anaphase onset. (e) Quantification of the time from A.O. to Cyclin B1-GFP disappearance from centrosomes and respective anaphase duration (anaphase onset to DNA decondensation) (n = 9 cells). (f) Correlation between Cyclin B1-GFP disappearance from centrosomes and anaphase duration (p=0.0011). A parametric Pearson correlation was computed for this analysis.
Figure 1—figure supplement 3
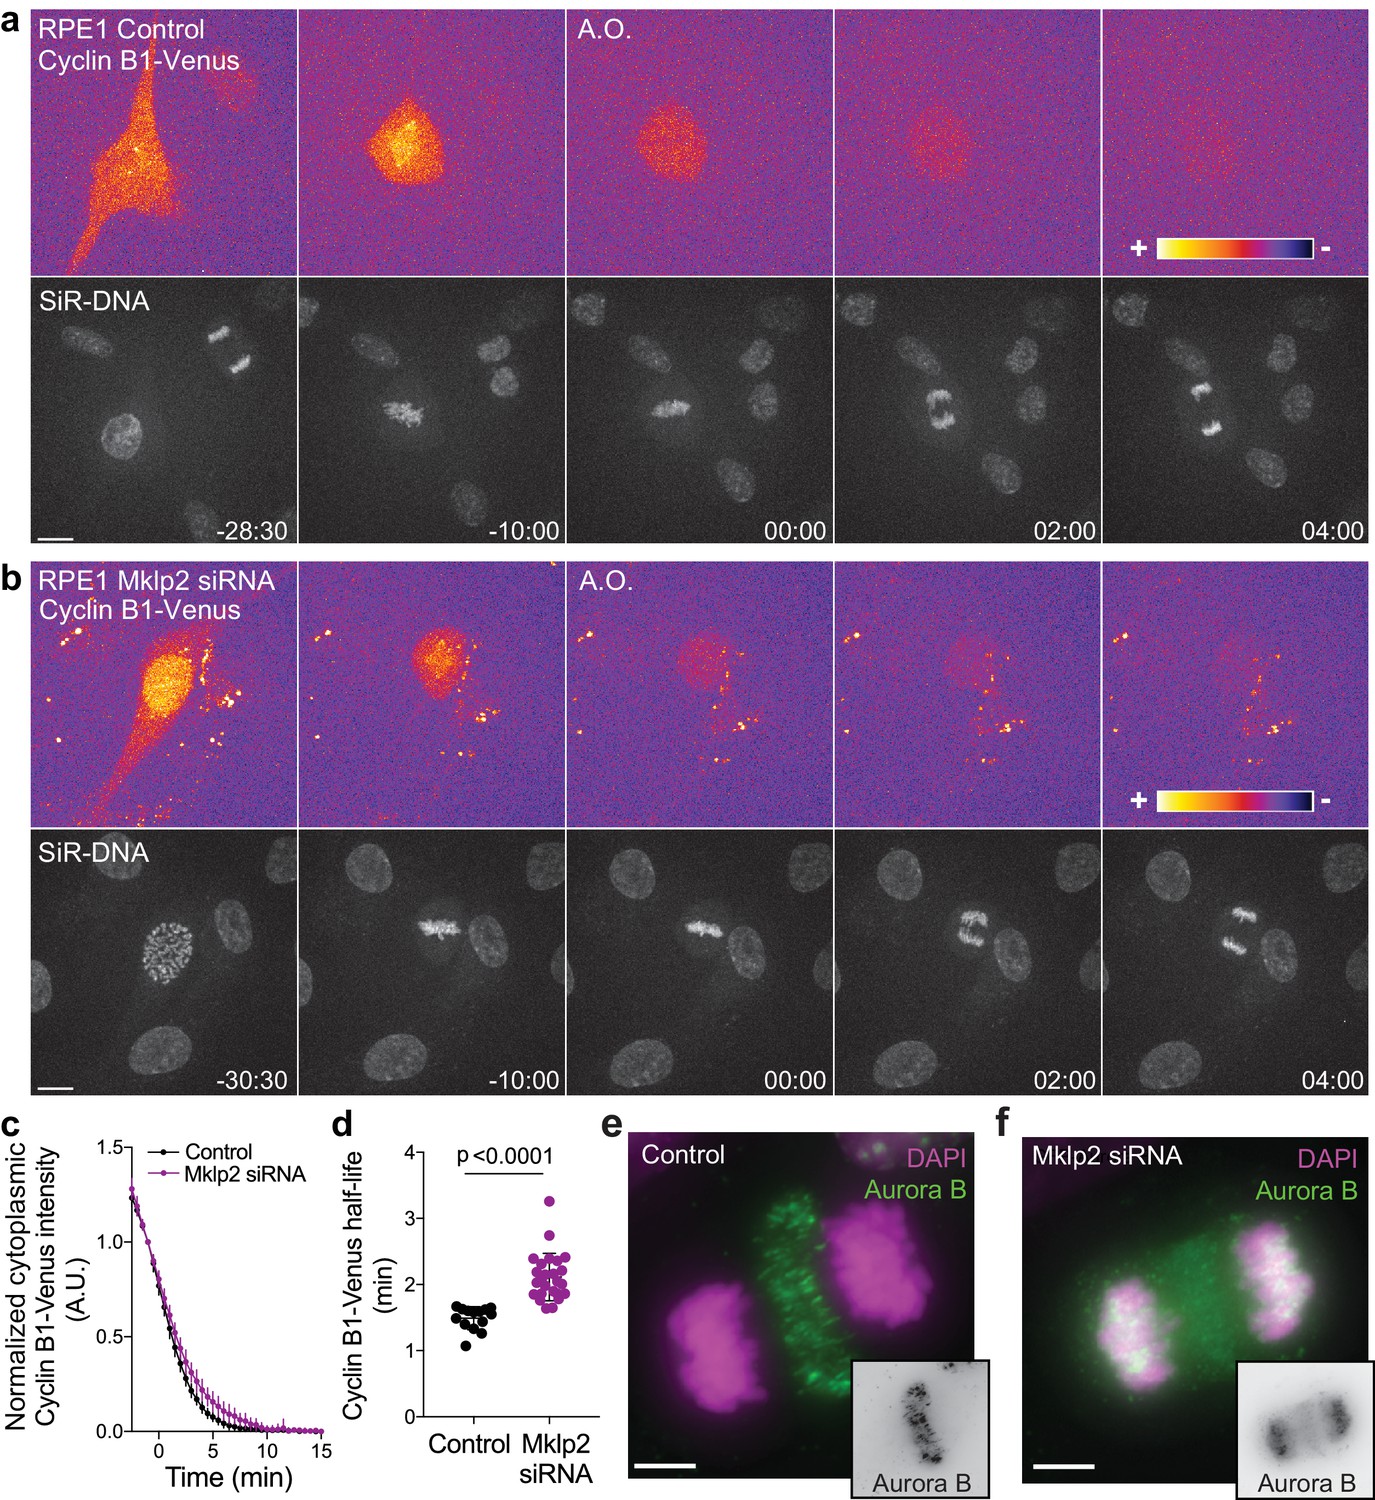
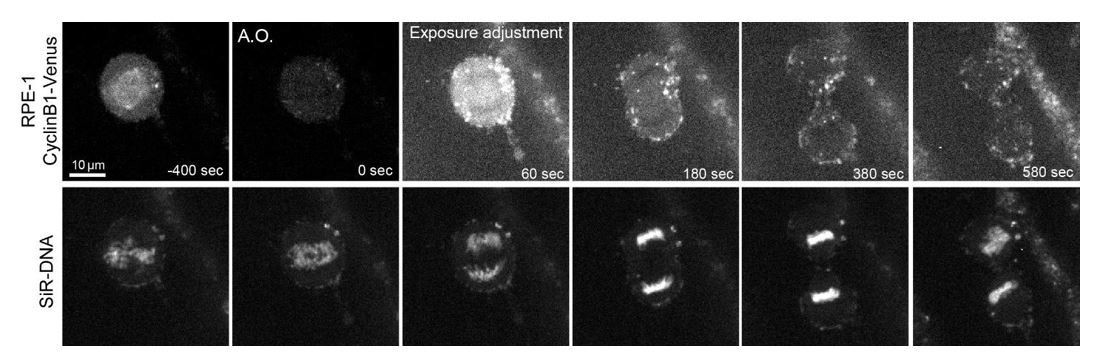
Aurora B localization at the spindle midzone impacts Cyclin B1 degradation during anaphase in hTERT-RPE1 cells.
(a) and (b) Representative examples of a control and Mklp2-depleted hTERT-RPE1 cells expressing endogenous Cyclin B1-Venus and co-stained with SiR-DNA. Cyclin B1-Venus localization and levels are highlighted with the LUT ‘fire’, showing detectable levels of Cyclin B1 during anaphase. Time is in min:sec (c) Degradation profile of Cyclin B1-Venus in control (n = 14 cells) and Mklp2 siRNA (n = 25 cells, pooled from two independent experiments). Anaphase onset = 0 min. (d) Calculated Cyclin B1-Venus half-life (0–4.5 min after anaphase onset). Statistical significance was tested with a nonparametric Mann-Whitney test. (e) and (f) Aurora B staining in control and Mklp2-depleted hTERT-RPE1 cells from the same experiment shown in the live imaging in (b). Mklp2 siRNA shows a strong impairment of Aurora B translocation from chromosomes to the spindle midzone. Scale bars are 5 μm.
-
Figure 1—figure supplement 3—source data 1
Cyclin B1-Venus half-life in control and Mklp2-depleted cells.
- https://doi.org/10.7554/eLife.47646.006
Figure 2 with 1 supplement
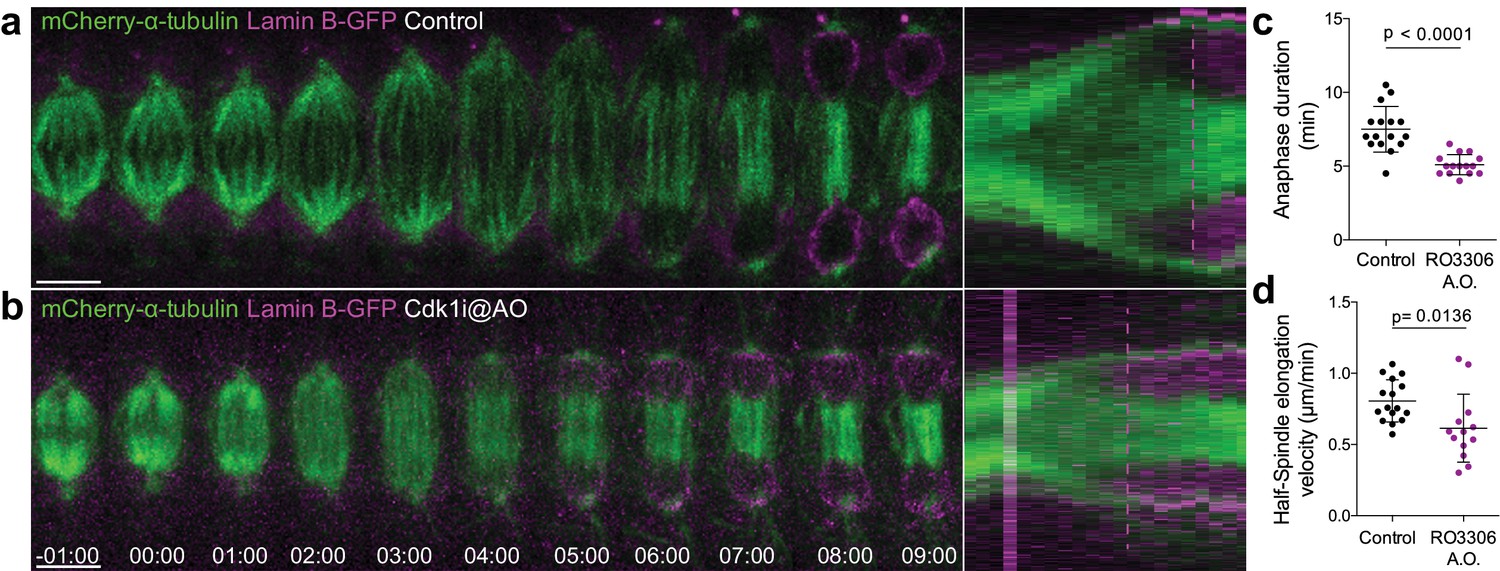
Cdk1 inhibition at anaphase onset accelerates NER.
(a) and (b) Control and Cdk1-inhibited Drosophila S2 cells at anaphase onset (A.O.) stably expressing Lamin B-GFP/mCherry-α-tubulin. Scale bars are 5 μm. Time is in min:sec. Panels on the right side show the corresponding collapsed kymographs. Dashed lines indicate the moment of NER. (c) and (d) Quantification of anaphase duration (control n=16 cells; Cdk1i n=15 cells) and half-spindle elongation velocity (control n=16 cells; Cdk1i, n=13 cells), respectively, in the conditions shown in (a) and (b). Statistical significance was tested with an unpaired t-test.
-
Figure 2—source data 1
Calculation of anaphase duration after Cdk1 inhibition at anaphase onset.
- https://doi.org/10.7554/eLife.47646.014
Figure 2—figure supplement 1
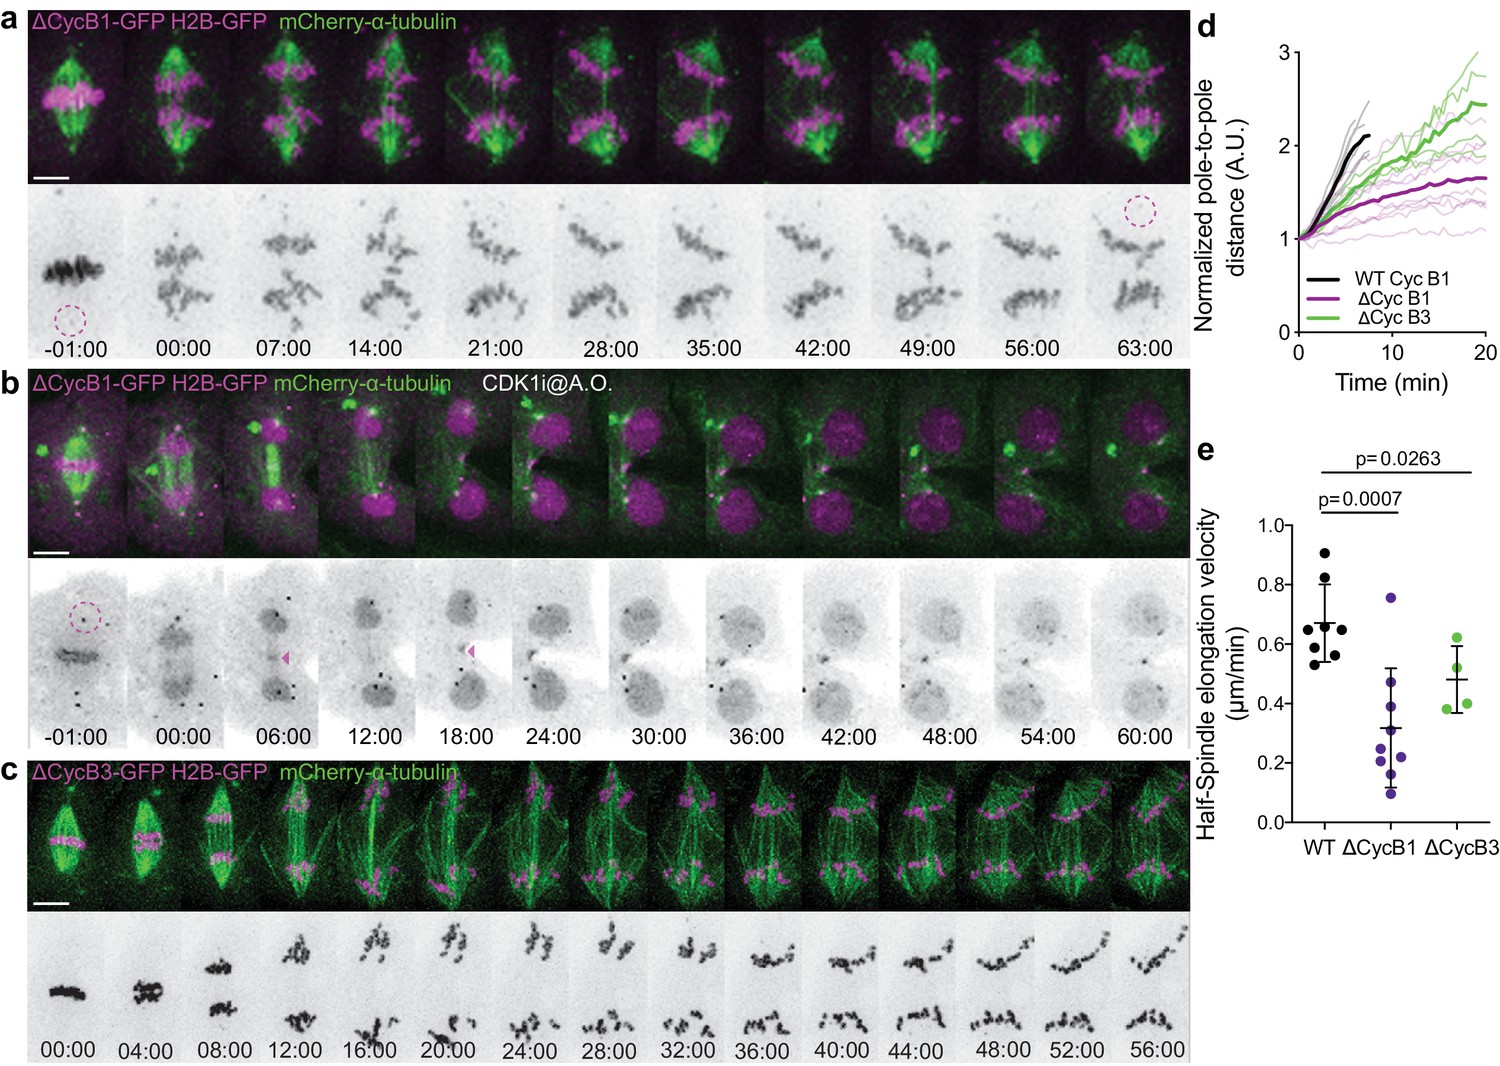
Cdk1 inhibition during anaphase is required for mitotic exit.
(a) Control Drosophila S2 cell stably expressing H2B-GFP/mCherry-α-tubulin transiently expressing ΔCycB1-GFP, showing the expected anaphase arrest. (b) The same experimental set-up was used for Cdk1 inhibition at anaphase onset (A.O.). Cyclin B1-GFP localization and H2B-GFP are highlighted in inverted grayscale. Note the centrosomal pool (magenta dashed circles) that remains during the anaphase arrest and the midzone localization of Cyclin B1-GFP after Cdk1 inhibition (magenta arrowheads). (c) Drosophila S2 cell stably expressing H2B-GFP/mCherry-α-tubulin transiently expressing ΔCycB3-GFP where a strong anaphase arrest can be observed. Time is in min:sec. Scale bars are 5 μm. (e) and (f) Normalized pole-to-pole distance and half-spindle elongation velocity in WT (n=8 cells), ΔCycB1 (n=9 cells) and ΔCycB3 (n=4 cells), showing impaired spindle elongation after expression of non-degradable Cyclin B1 or Cyclin B3. Statistical significance of (e) and (f) was tested with a t-test and a nonparametric Mann-Whitney test, respectively.
-
Figure 2—figure supplement 1—source data 1
Calculation of half-spindle elongation velocity in non-degradable Cyclins.
- https://doi.org/10.7554/eLife.47646.013
Figure 3
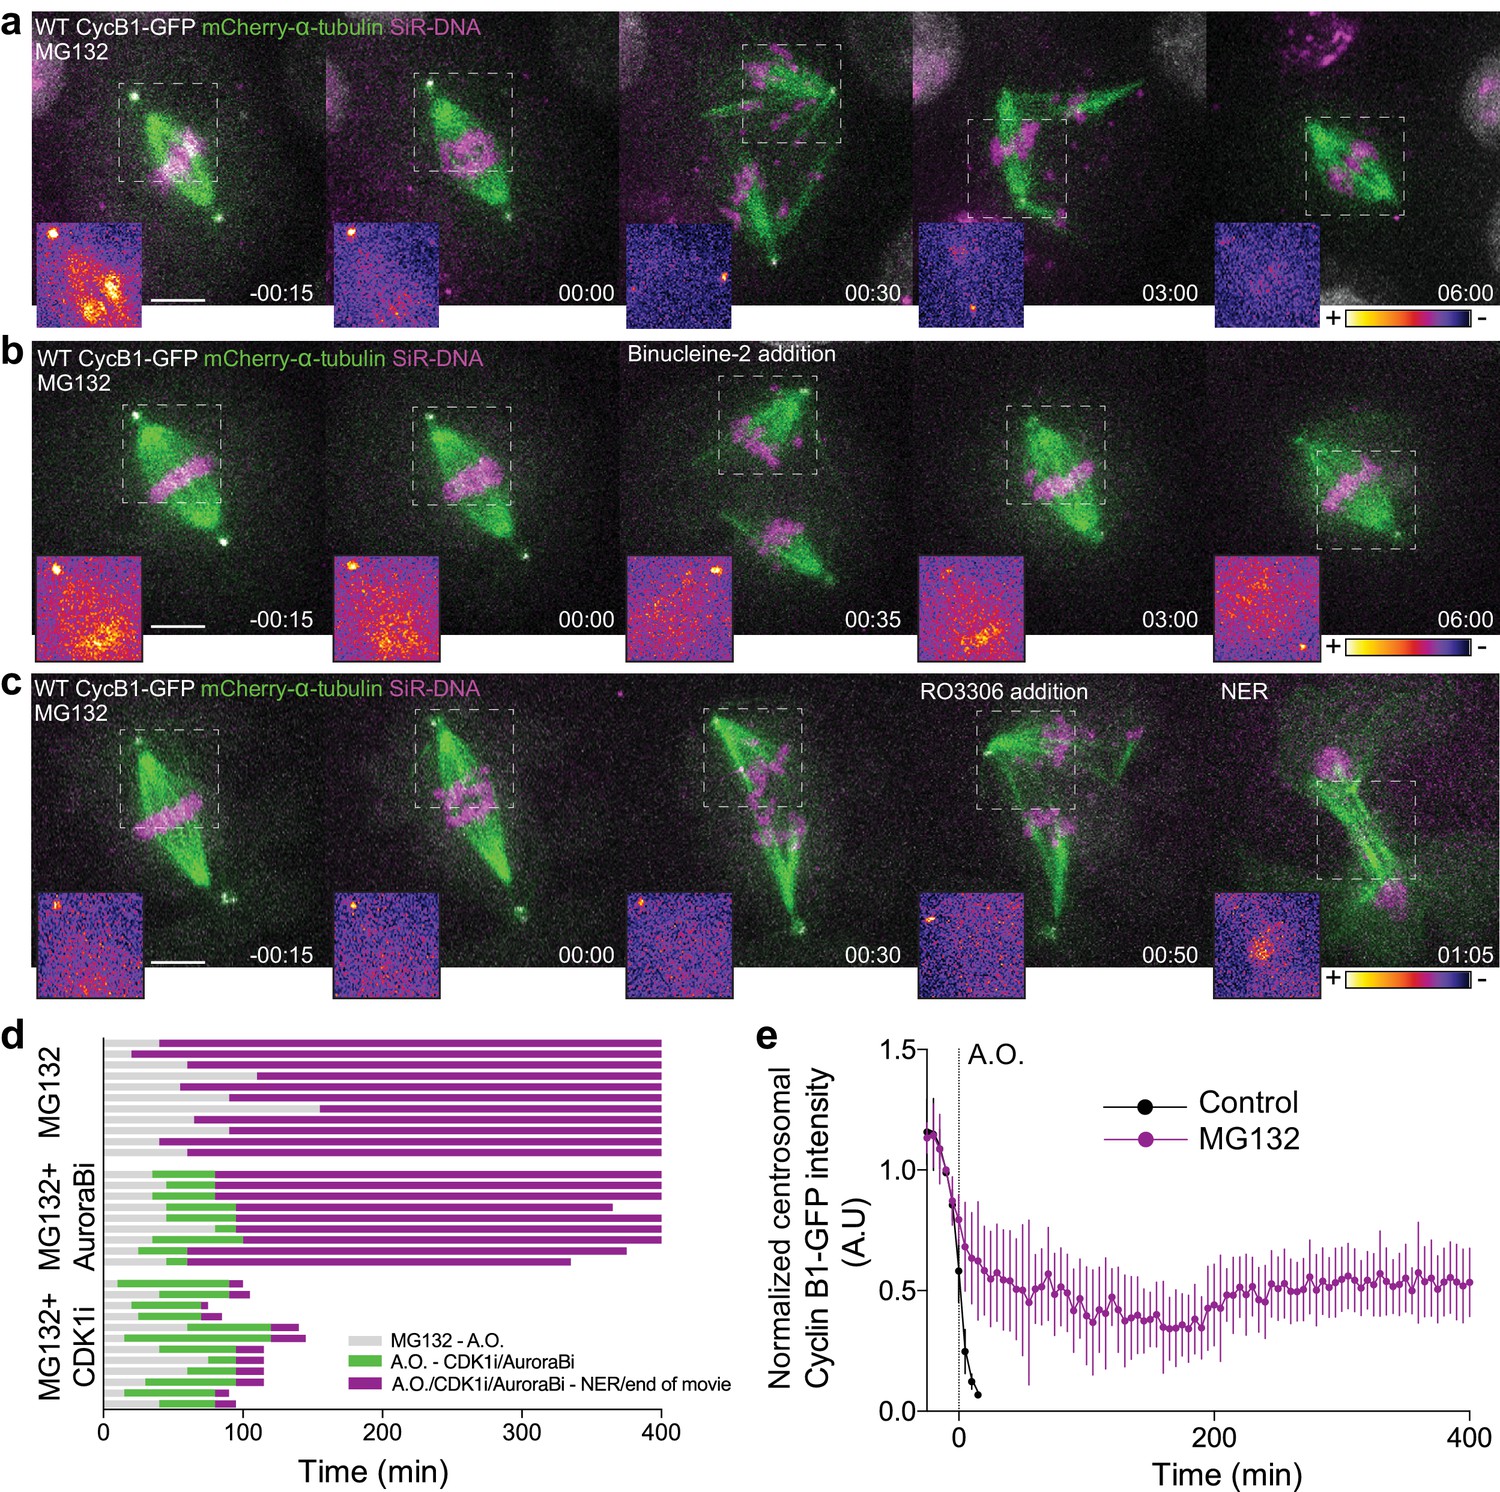
Cdk1 inactivation during anaphase licenses mitotic exit and requires proteasome-mediated proteolysis.
(a) Representative Drosophila S2 cell stably expressing Cyclin B1-GFP/mCherry-α-tubulin and stained with SiR-DNA to follow mitotic chromosomes, showing a strong anaphase arrest after treatment with MG132 (20 μM). Importantly, cells entered anaphase with Cyclin B1 levels compared to untreated control cells, despite the presence of MG132. (b) and (c) Drosophila S2 cells arrested in anaphase with MG132, and treated with Aurora B inhibitor (Binucleine-2) or Cdk1 inhibitor (RO3306), respectively, 30–60 min after the anaphase arrest. In (a), (b) and (c) a half-spindle region is highlighted with the LUT ‘fire’ to reveal Cyclin B1-GFP fluorescence during the anaphase arrest. Scale bars in all panels are 5 μm. Time in all panels is in h:min. (d) Timeline of the experiments shown in (a), (b) and (c) with quantification of total anaphase duration. A.O. = Anaphase onset. Gray color represents the time from MG132 addition to anaphase onset in cases where cells entered anaphase in the presence of MG132. Green color represents the time spent in anaphase until Aurora B or Cdk1 inhibition and purple color represents the time spent in anaphase in the presence of MG132 or MG312+Aurora B inhibition or MG132+Cdk1 inhibition. (e) Cyclin B1-GFP degradation profile in untreated (n = 12 cells) and MG132-treated cells arrested in anaphase (n = 6 cells). A.O. = Anaphase onset.
Figure 4

Proteasome inhibition at anaphase onset arrests human cells in anaphase in a Cdk1-dependent manner.
(a) Representative U2OS cell stably expressing H2B-GFP/mCherry-α-tubulin treated with MG132 at anaphase onset (time 00:00). The cell became arrested in anaphase, after full chromosome separation and formation of a spindle midzone. Typically, two new spindles assembled around individual chromatids that erratically attempted to establish new ‘metaphase’ plates. (b) and (c) Anaphase arrested U2OS cells obtained by the addition of MG132 were treated with the Aurora B inhibitor (ZM447439) or Cdk1 inhibitor (RO3306), respectively, 30–60 min after anaphase arrest. Time in all panels is in h:min. Scale bars are 5 μm. (d) Timeline of the experiments shown in (a), (b) and (c). A.O. = Anaphase onset. Gray color represents the time from MG132 addition to anaphase onset, green color represents the time spent in anaphase until Aurora B or Cdk1 inhibition and purple color represents the time spent in anaphase in the presence of MG132 or MG312+Aurora B inhibition or MG132+Cdk1 inhibition. (e) Quantification of total anaphase duration in MG132, MG132+Aurora B inhibition and MG132+Cdk1 inhibition in Drosophila S2 cells and human U2OS cells. Note that for MG132 and MG132+Aurora B inhibition anaphase duration corresponds to the total duration of the movie as most cells do not exit mitosis until the end of acquisition. Statistical significance was tested with a nonparametric Mann-Whitney test.
Figure 5 with 1 supplement
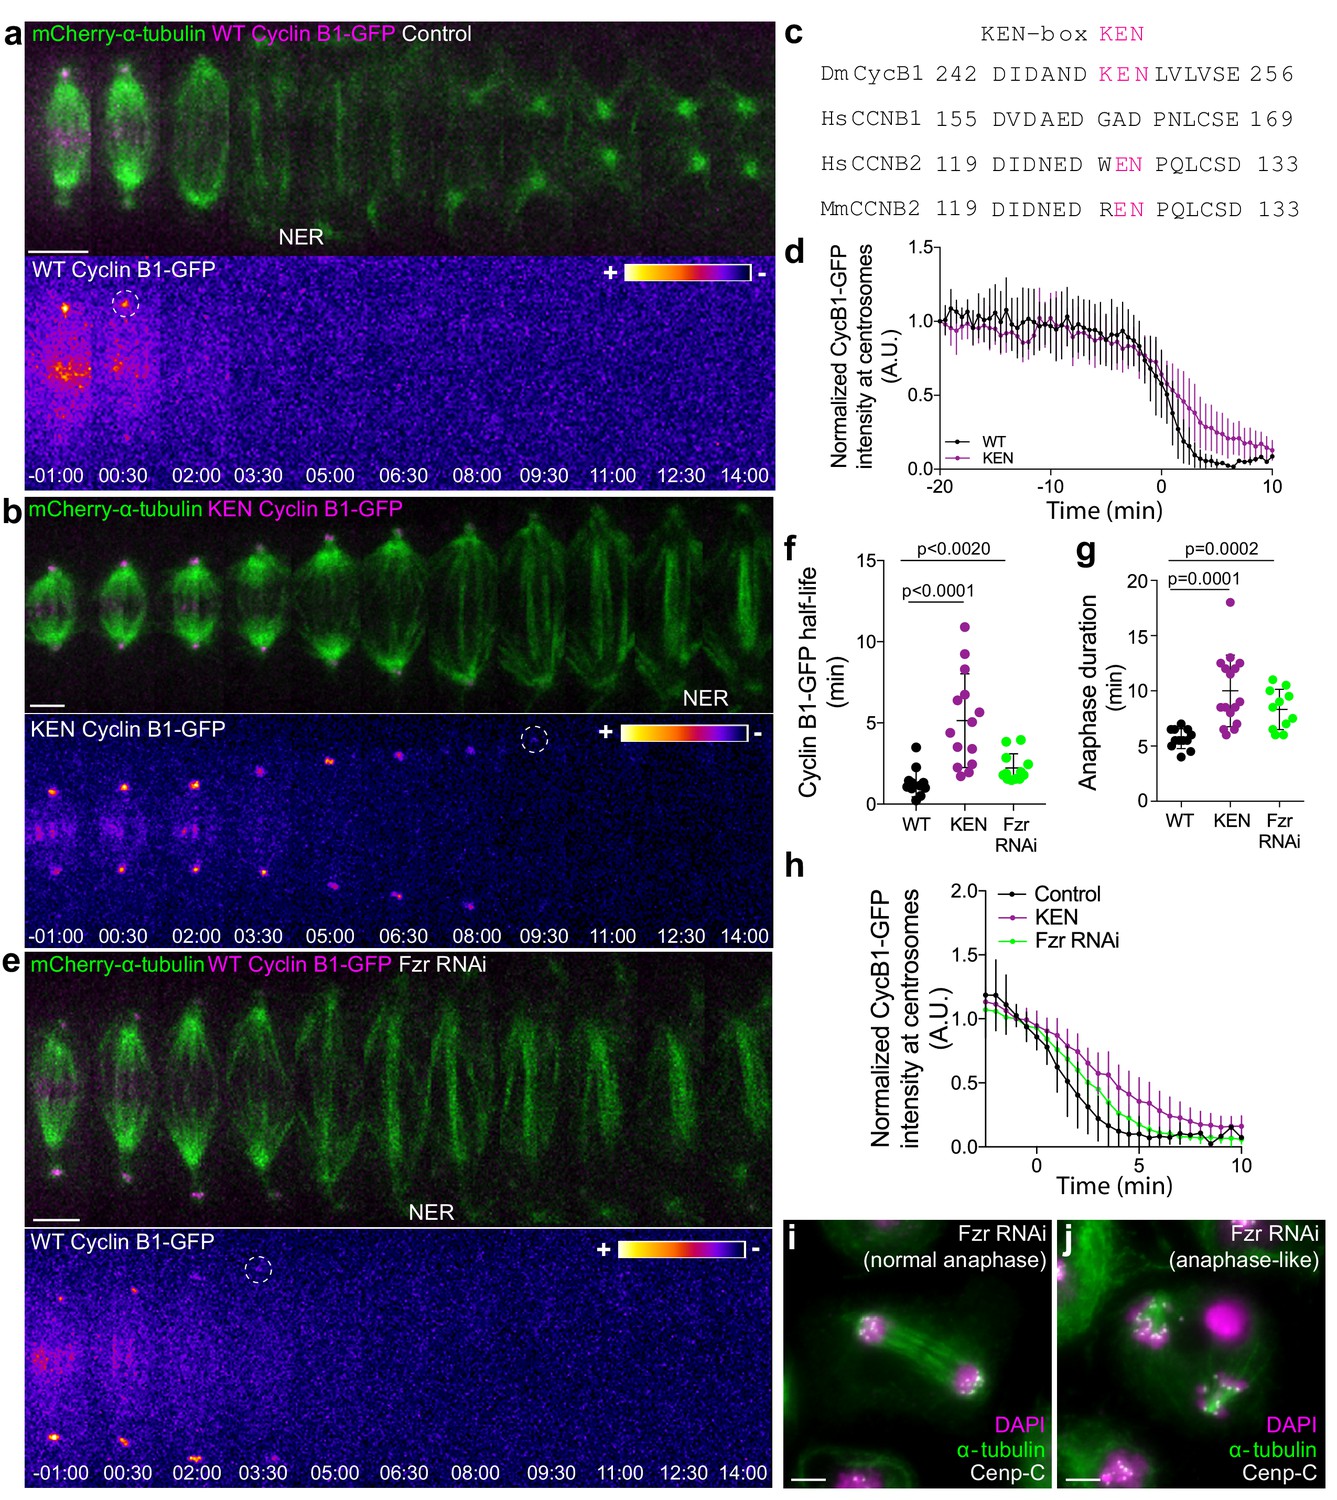
APC/CCdc20 and APC/CCdh1 are required for Cyclin B1 degradation during anaphase and timely mitotic exit.
(a) and (b) Drosophila S2 cells stably expressing WT Cyclin B1 or a KEN-box mutant version co-expressing mCherry-α-tubulin. (c) Sequence alignment showing the conservation of the Drosophila Cyclin B1 KEN-box with mammalian Cyclin B2, but not Cyclin B1. (d) Degradation profile of Cyclin B1-GFP quantified by measuring the GFP fluorescence intensity at centrosomes in control (n = 6 cells) and KEN-box mutant cells (n = 10 cells). Note that KEN-box Cyclin B1 degradation is only affected during anaphase. Anaphase onset = 0 min. (e) Drosophila S2 cell depleted of Fzr and expressing WT CyclinB1-GFP/mCherry-α-tubulin. Cyclin B1-GFP signal is highlighted with the LUT ‘fire’ and dashed white circles highlight the frame before Cyclin B1 signal disappearance from centrosomes. Scale bars are 5 μm. Time in all panels is in min:sec. (f) Quantification of Cyclin B1 half-life (0–4.5 min after anaphase onset) duration in control (n=11 cells), KEN-box mutant (n=12 cells) and Fzr-depleted cells (n=11 cells, pooled from 3 independent experiments) and (g) anaphase duration in control (n = 11 cells), KEN-box mutant (n = 16 cells) and Fzr-depleted cells (n = 12 cells, pooled from three independent experiments). Statistically significant differences for anaphase duration and CyclinB1 half-life were tested with an unpaired t-test and a nonparametric Mann-Whitney test, respectively. (h) Degradation profile of Cyclin B1-GFP quantified by measuring the GFP fluorescence intensity at centrosomes in control (n = 12 cells), KEN-box mutant cells (n = 14 cells) and Fzr-depleted cells (n = 12 cells). Anaphase onset = 0 min. (i) and (j) Images of anaphase Drosophila S2 cells after Fzr RNAi, fixed and co-stained with Cenp-C and α-tubulin. Note that amongst apparently normal anaphase cells (i), anaphase-like cells with clearly separated sister chromatids attached to two half-spindles could also be identified (j). Scale bars are 5 μm.
-
Figure 5—source data 1
Anaphase duration after KEN-box mutation or FZR RNAi.
- https://doi.org/10.7554/eLife.47646.026
Figure 5—figure supplement 1
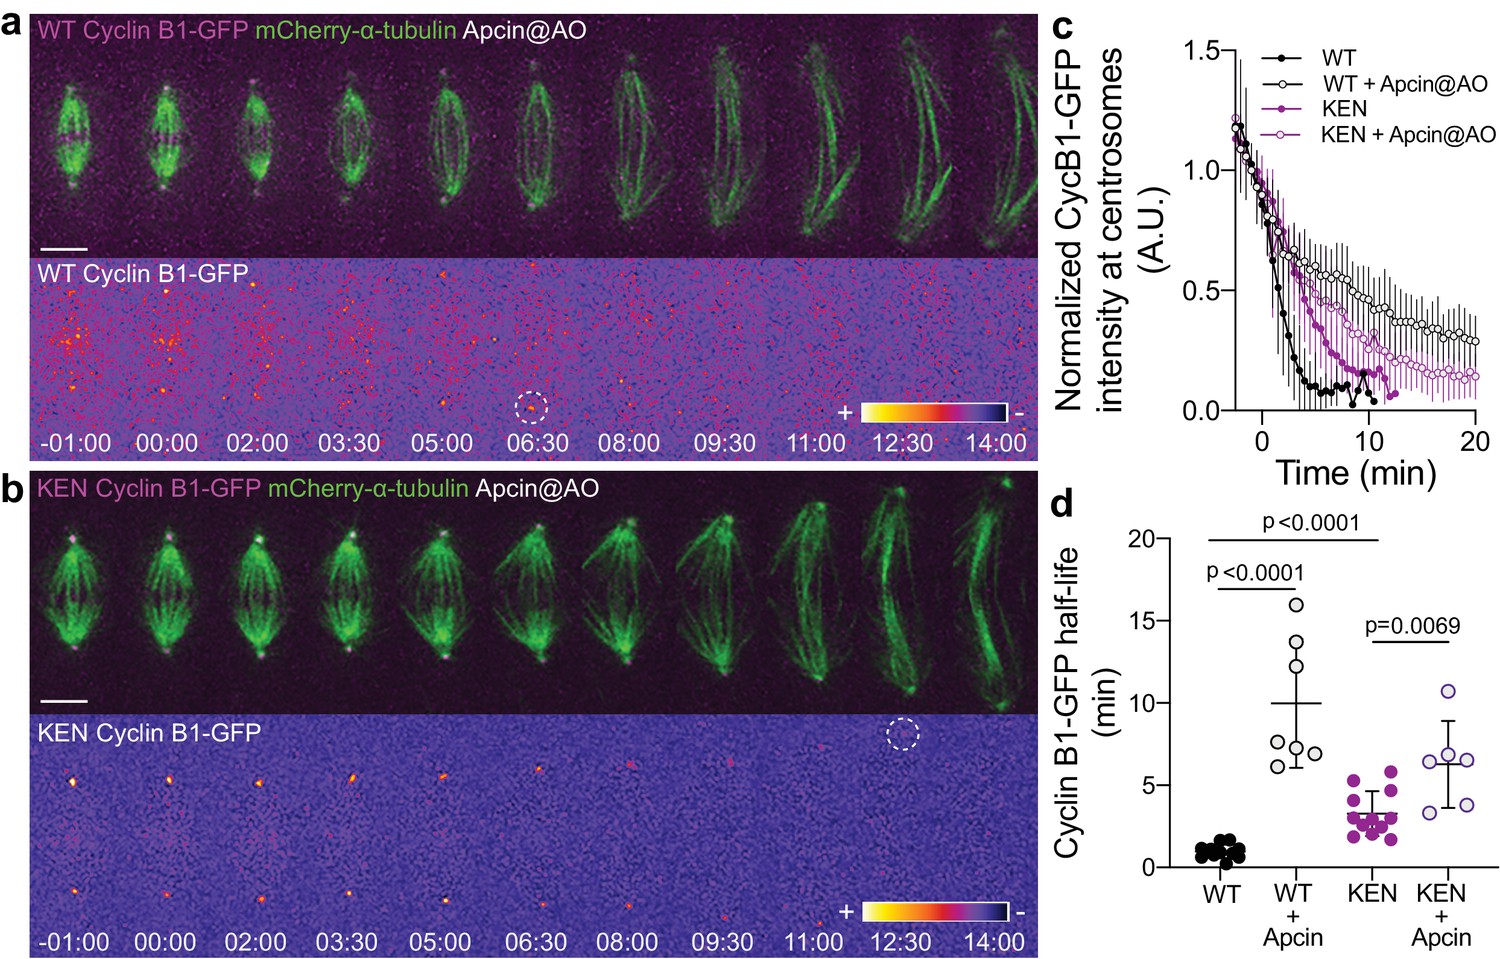
APC/C inhibition at anaphase onset shows a synergistic effect with expression of KEN-box Cyclin B1 mutant.
(a) and (b) Drosophila S2 cells stably expressing WT Cyclin B1 or a KEN-box mutant version and co-expressing mCherry-α-tubulin with Apcin addition at anaphase onset. Cyclin B1-GFP localization is highlighted with the LUT ‘fire’ and dashed white circles highlight the frame before Cyclin B1 signal disappearance from centrosomes. Scale bars are 5 μm. Time is in min:sec. (c) Degradation profile of Cyclin B1-GFP quantified by measuring fluorescence intensity at centrosomes in control (n = 11 cells), control with Apcin (n = 7 cells), KEN-box mutant cells (n = 12 cells) and KEN-box mutant with Apcin (n = 6 cells). (d) Calculated Cyclin B1-GFP half-life (0–6.5 min after anaphase onset) in the same conditions as in (c). Statistical significance was tested with a nonparametric Mann-Whitney test.
-
Figure 5—figure supplement 1—source data 1
Cyclin B1- GFP half-life after KEN-box mutation and/or APCin treatment at anaphase onset.
- https://doi.org/10.7554/eLife.47646.025
Figure 6
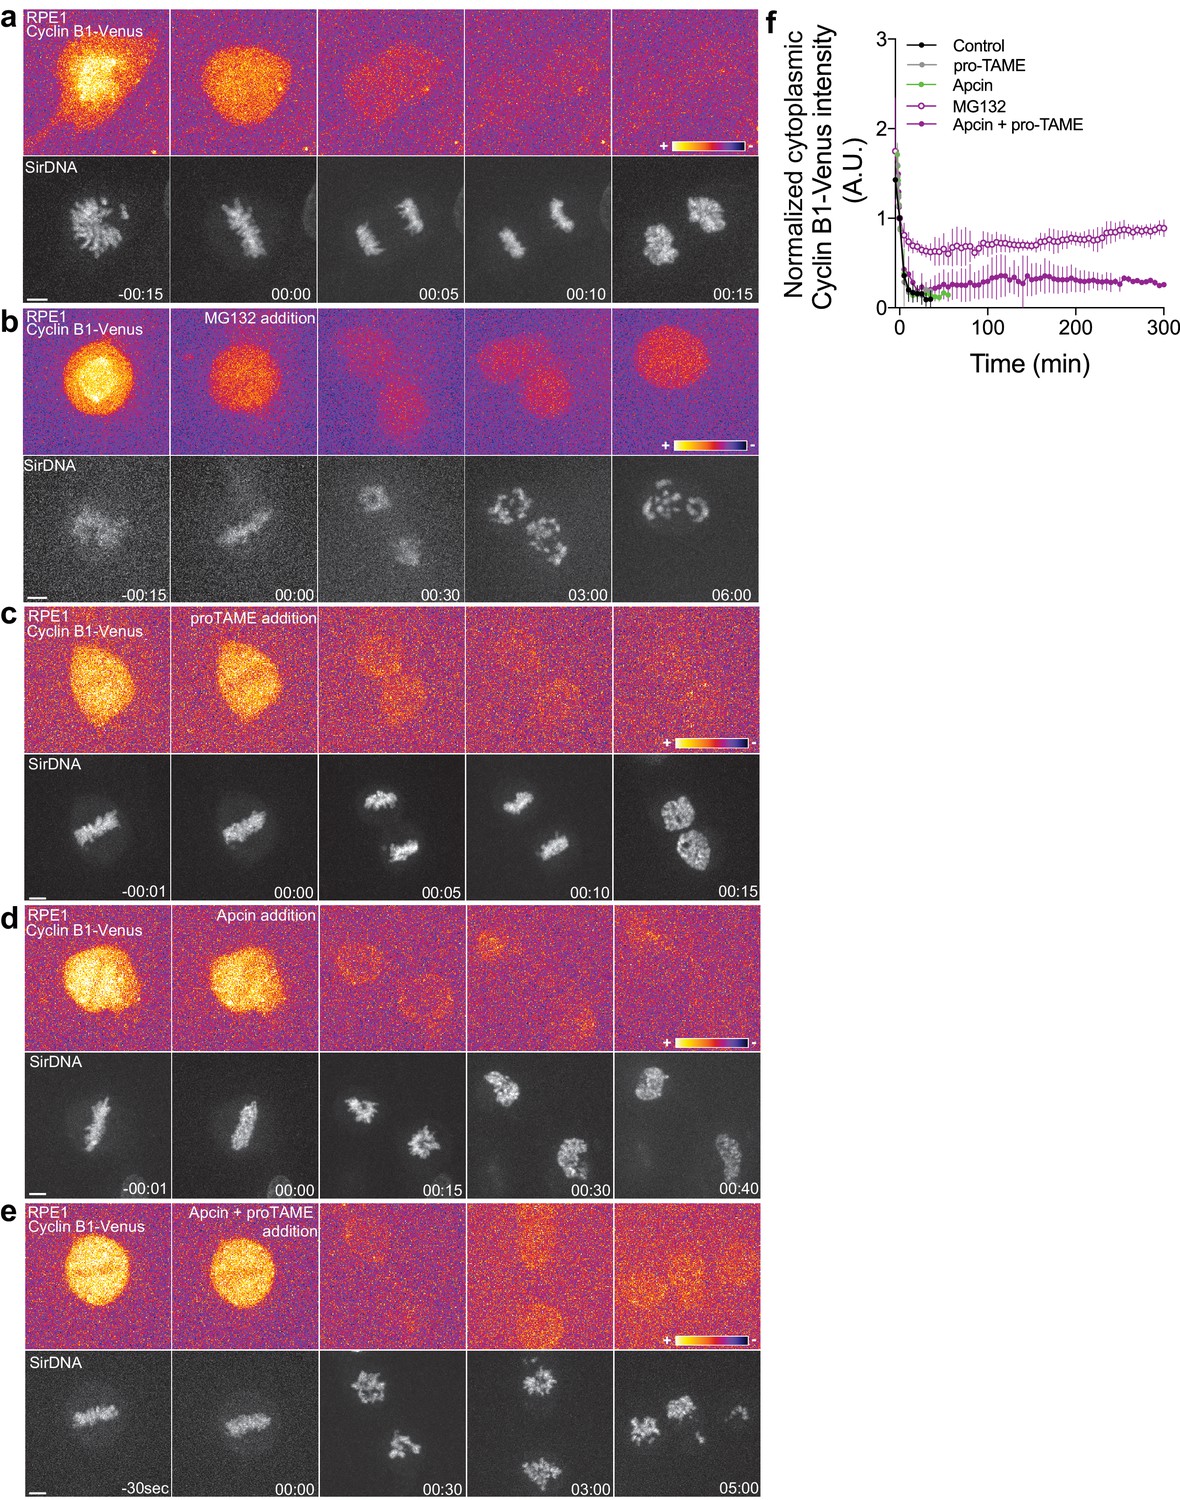
Proteasome and APC/C inhibition at anaphase onset induces an anaphase arrest in human hTERT-RPE1 cells.
(a) Control hTERT-RPE1 cell expressing endogenous Cyclin B1-Venus and co-stained with SiR-DNA to visualize mitotic chromosomes. (b) MG132 addition just before or at anaphase onset (time 00:00), caused an anaphase arrest with detectable Cyclin B1 levels and condensed chromosomes. The arrest was sustained up to 6 hr (time window of acquisition). (c) pro-TAME addition at anaphase onset (time 00:00) showed no visible effect during anaphase. (d) Apcin addition at anaphase onset (time 00:00) induced a slight delay in DNA decondensation. (e) APC/C inhibition with a cocktail of pro-TAME and Apcin at anaphase onset (time 00:00) caused a strong anaphase delay (during the time window of acquisition – 5 hr). Cyclin B1 localization is highlighted with LUT ‘fire’. Scale bars are 5 μm. Time is in h:min. (f) Quantification of Cyclin B1-Venus (normalized to anaphase onset) in control (n = 7 cells), MG132 (n = 4 cells), pro-TAME (n = 7 cells), Apcin (n = 6 cells) and pro-TAME+Apcin (n = 4 cells).
Figure 7 with 4 supplements
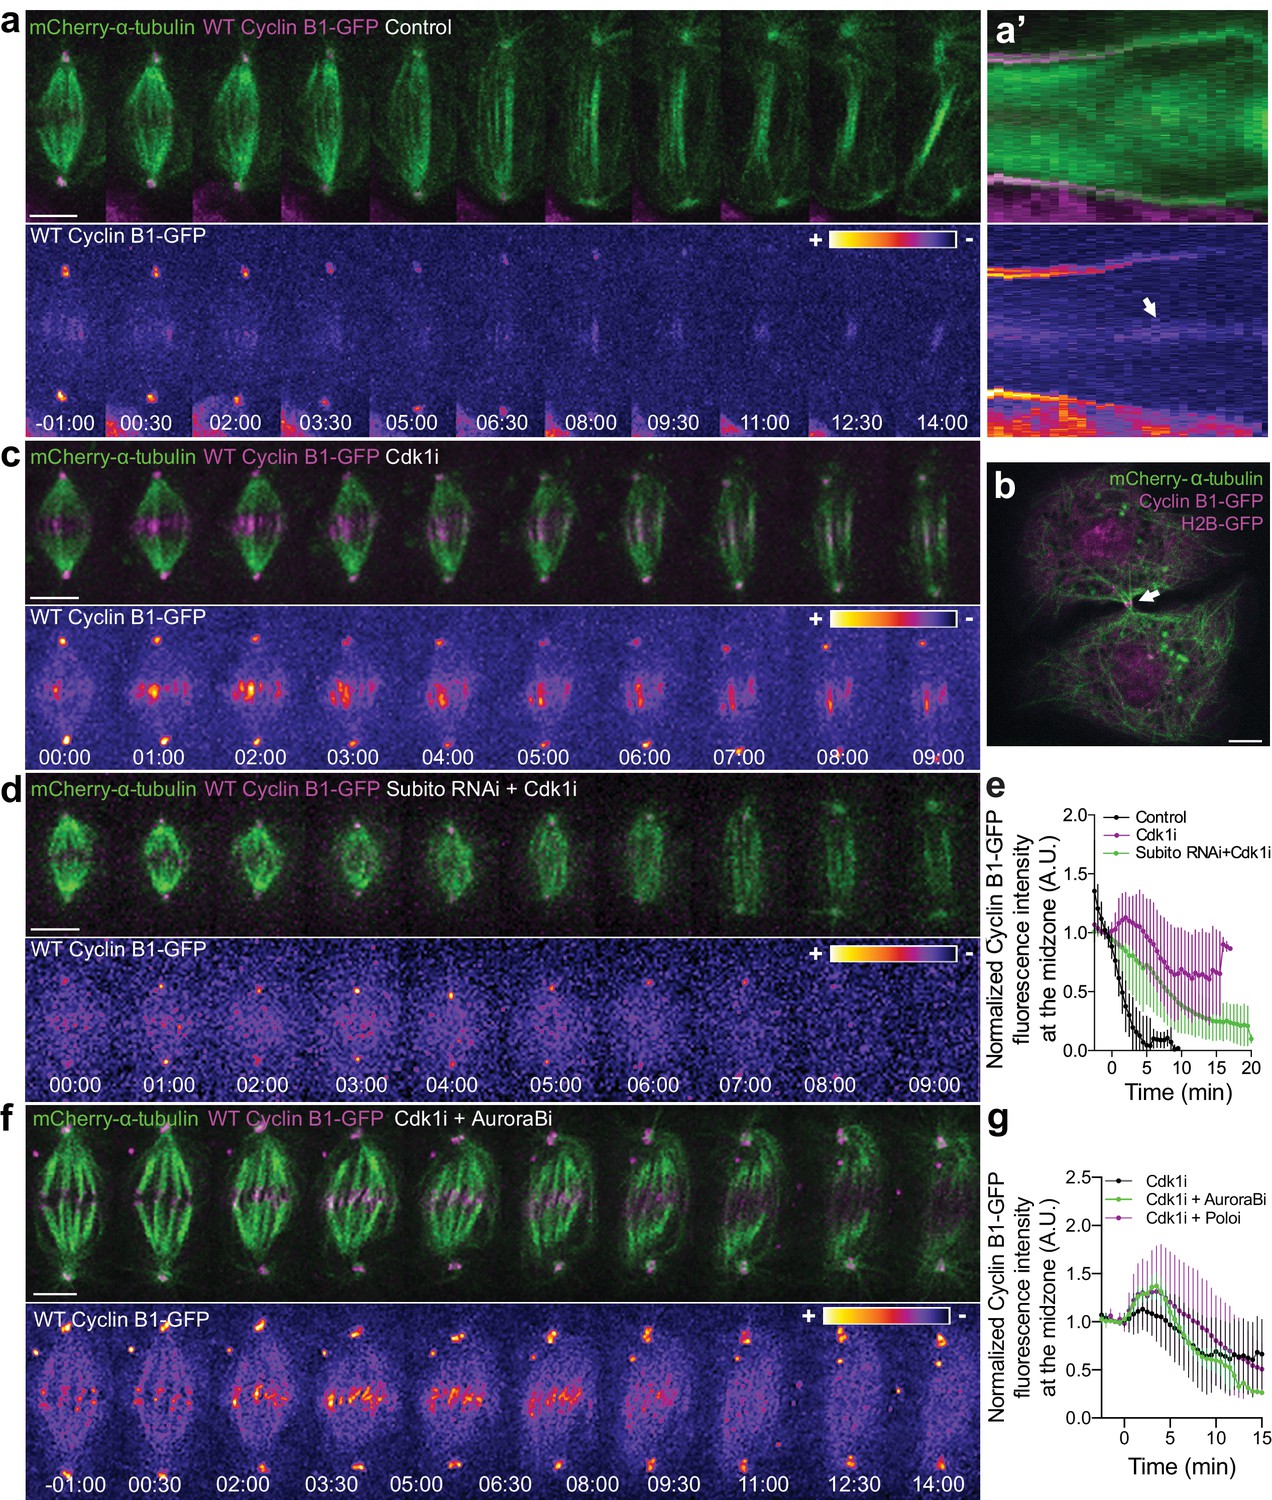
Cyclin B1 localization at the spindle midzone depends on Aurora B localization and activity during anaphase.
(a) Control Drosophila S2 cell stably expressing Cyclin B1-GFP/mCherry-α-tubulin showing a faint pool of Cyclin B1-GFP at the spindle midzone/midbody. (a’) Collapsed kymograph of the cell in a where Cyclin B1-GFP can be visualized at the spindle midzone/midbody. (b) Snapshot of a live Drosophila S2 cell expressing Cyclin B1-GFP/mCherry-α-tubulin where a midbody pool of Cyclin B1-GFP can be detected before completion of cytokinesis. (c) Drosophila S2 cell treated with Cdk1 inhibitor during metaphase. Cyclin B1 is not fully degraded and becomes visibly associated with midzone microtubules as cells are forced to exit mitosis. (d) Cdk1 inhibition at metaphase in a Drosophila S2 cell expressing Cyclin B1-GFP/mCherry-α-tubulin after Subito/Mklp2 depletion by RNAi. The Cyclin B1 midzone localization is no longer detectable. (e) Quantification of Cyclin B1-GFP fluorescence intensity measured at the spindle midzone (identified by the mCherry-α-tubulin signal) in untreated (n = 11 cells), Cdk1 inhibited cells (n = 10 cells) and Cdk1 inhibition after Subito/Mklp2 depletion (n = 12 cells, pooled from two independent experiments). (f) Drosophila S2 cells treated with Cdk1 inhibitor during metaphase and Aurora B inhibitor 4 min after Cdk1 inhibition. For all conditions, Cyclin B1-GFP signal is highlighted with the LUT ‘fire’. Scale bar is 5 μm. (g) Quantification of Cyclin B1-GFP fluorescence intensity measured at the spindle midzone in Cdk1 inhibited cells (n = 10 cells), Cdk1 + Aurora B inhibition (n = 11 cells) and Cdk1 + Polo inhibition (n = 10 cells).
Figure 7—figure supplement 1
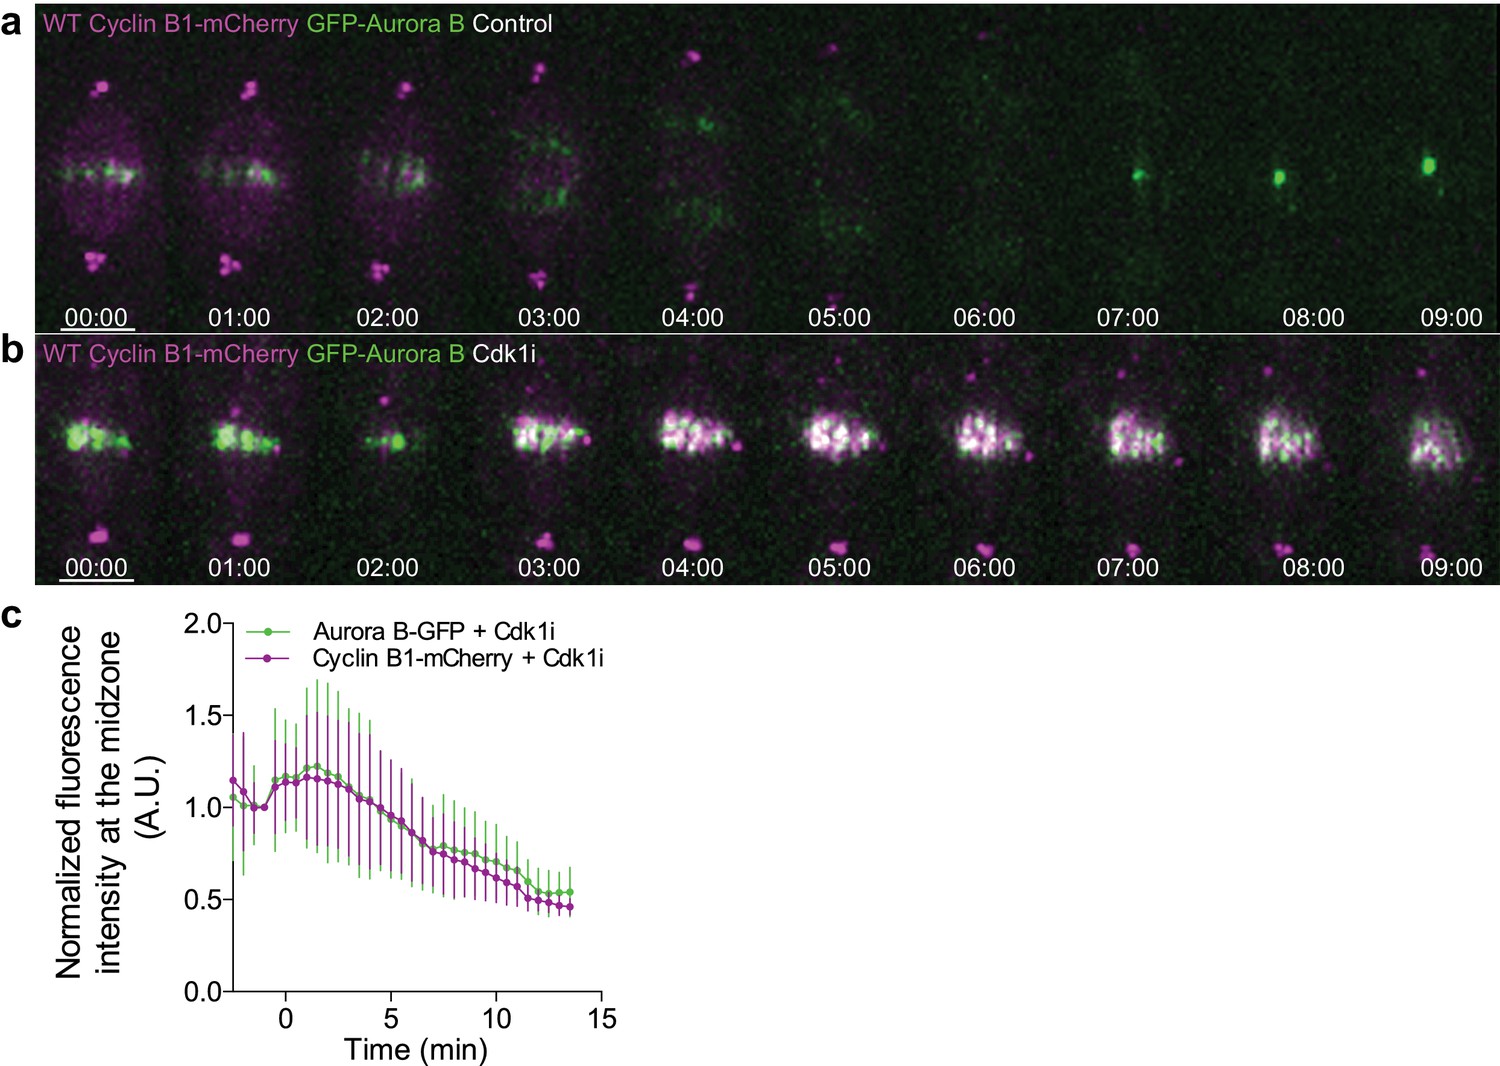
Cyclin B1 co-localization with Aurora B at the spindle midzone after Cdk1 inhibition in metaphase.
(a) Untreated control Drosophila S2 cell or (b) treated with Cdk1 inhibitor in metaphase and expressing GFP-Aurora B/Cyclin B1-mCherry, showing a clear co-localization between both signals upon Cdk1 inhibition. Scale bars are 5 μm. Time is in min:sec. (c) Quantification of GFP-Aurora B and Cyclin B1-mCherry fluorescence signals at the spindle midzone after Cdk1 inhibition in metaphase (n = 7 cells).
Figure 7—figure supplement 2
Cyclin B1 localization with midzone microtubules is not dependent on Polo kinase activity.
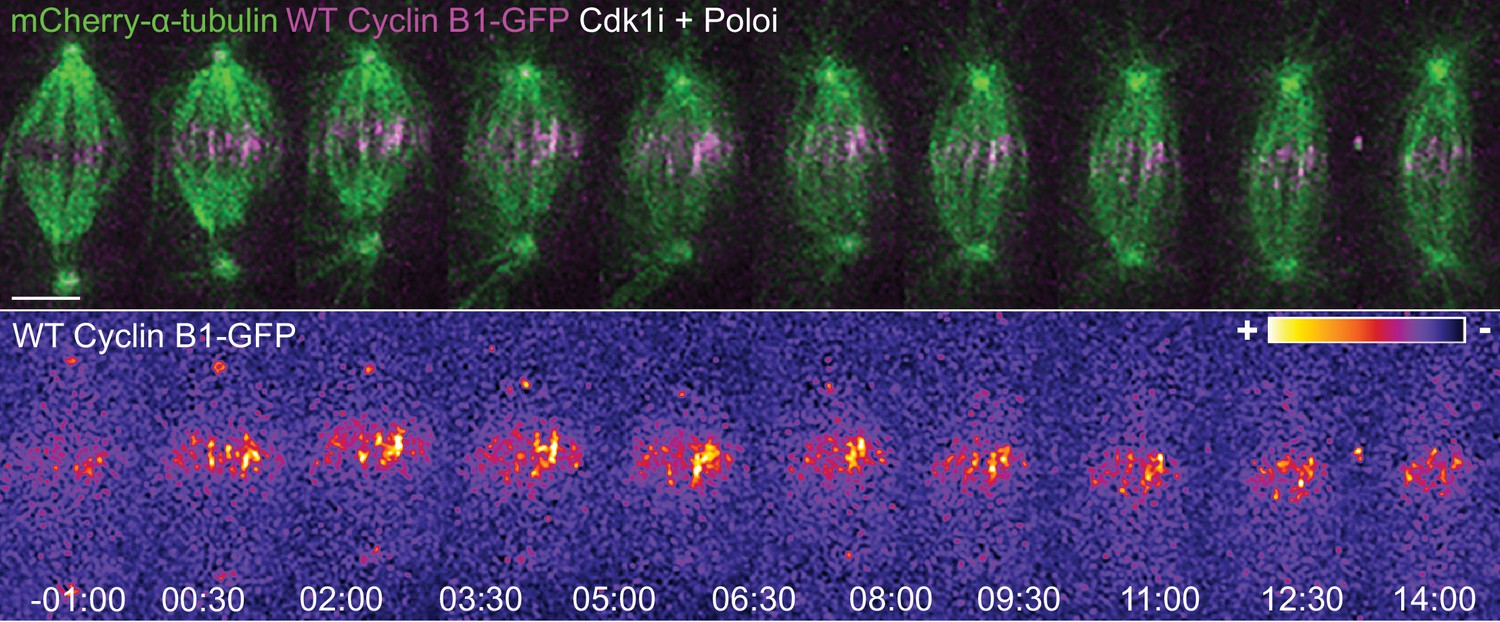
Drosophila S2 cells treated with Cdk1 inhibitor during metaphase and Polo inhibitor 4 min after Cdk1 inhibition. Note that the microtubule localization of Cyclin B1 is not lost after Polo inhibition. Cyclin B1-GFP signal is highlighted with the LUT ‘fire’. Scale bars are 5 μm. Time is in min:sec.
Figure 7—figure supplement 3

Cdk1 is enriched in the central spindle and midbody in human cells.
(a) Sum projection of a 3D data set from a human HeLa cell transiently expressing hCdk1-GFP as cells enter and progress through anaphase and cytokinesis. Spindle and central spindle enrichment is highlighted with the LUT ‘fire’. Microtubules were visualized with SiR-tubulin. Scale bar is 10 μm. Time is in min:sec. (b) Snapshot from a live human HeLa cell transiently expressing hCdk1-GFP (green), with microtubules visualized with SiR-tubulin (magenta), showing enrichment at the midbody (arrowhead). Scale bar is 10 μm. Zoomed region highlights hCdk1-GFP localization at the midbody (arrowhead). Scale bar in the zoomed images is 5 μm.
Figure 7—figure supplement 4
Aurora B overexpression induces a Cdk1-dependent anaphase delay.
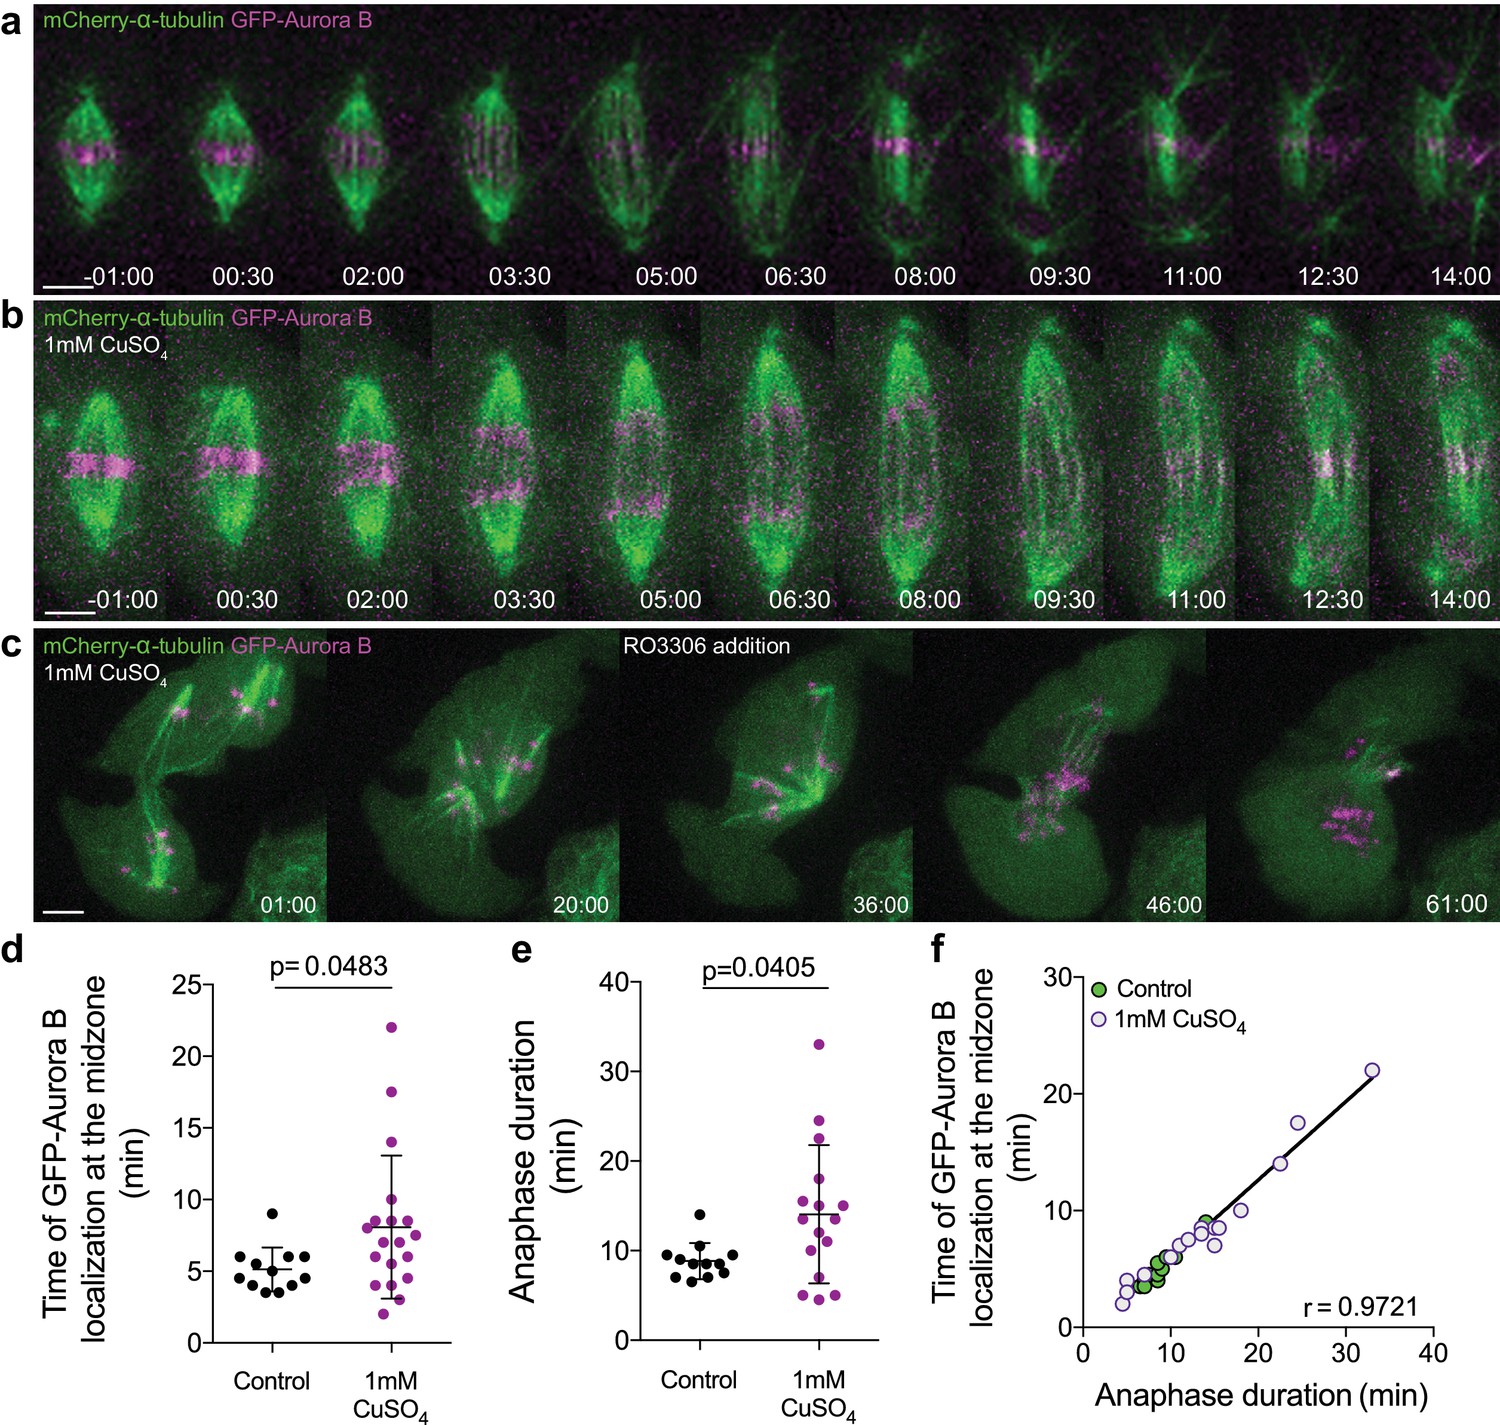
(a) Control Drosophila S2 cell stably expressing GFP-Aurora B/mCherry-α-tubulin. (b) Drosophila S2 cell overexpressing GFP-Aurora B where a delay in anaphase progression could be observed. (c) Cdk1 inhibition in a Drosophila S2 cell arrested in anaphase due to GFP-Aurora B overexpression. The cell exited mitosis immediately after drug addition. Scale bars are 5 μm. Time in all panels is in min:sec. (d) and (e) Quantification of the time of GFP-Aurora B recovery at the spindle midzone and anaphase duration, respectively, in control (n = 12 cells) and GFP-Aurora B overexpressing cells (treated with 1 mM CuSO4) (n = 19 cells). In both (d) and (e) statistical significance was tested with a nonparametric Mann-Whitney test. (f) Positive correlation (p<0.0001) between the time of Aurora B recovery at the spindle midzone and anaphase duration in control (n = 12 cells) and Aurora B overexpression (n = 16 cells). A nonparametric Spearman correlation was computed for this analysis.
-
Figure 7—figure supplement 4—source data 1
Anaphase duration after Aurora B overexpression.
- https://doi.org/10.7554/eLife.47646.033
Figure 8
Preventing Aurora B localization at the spindle midzone delays Cyclin B1 degradation during anaphase.
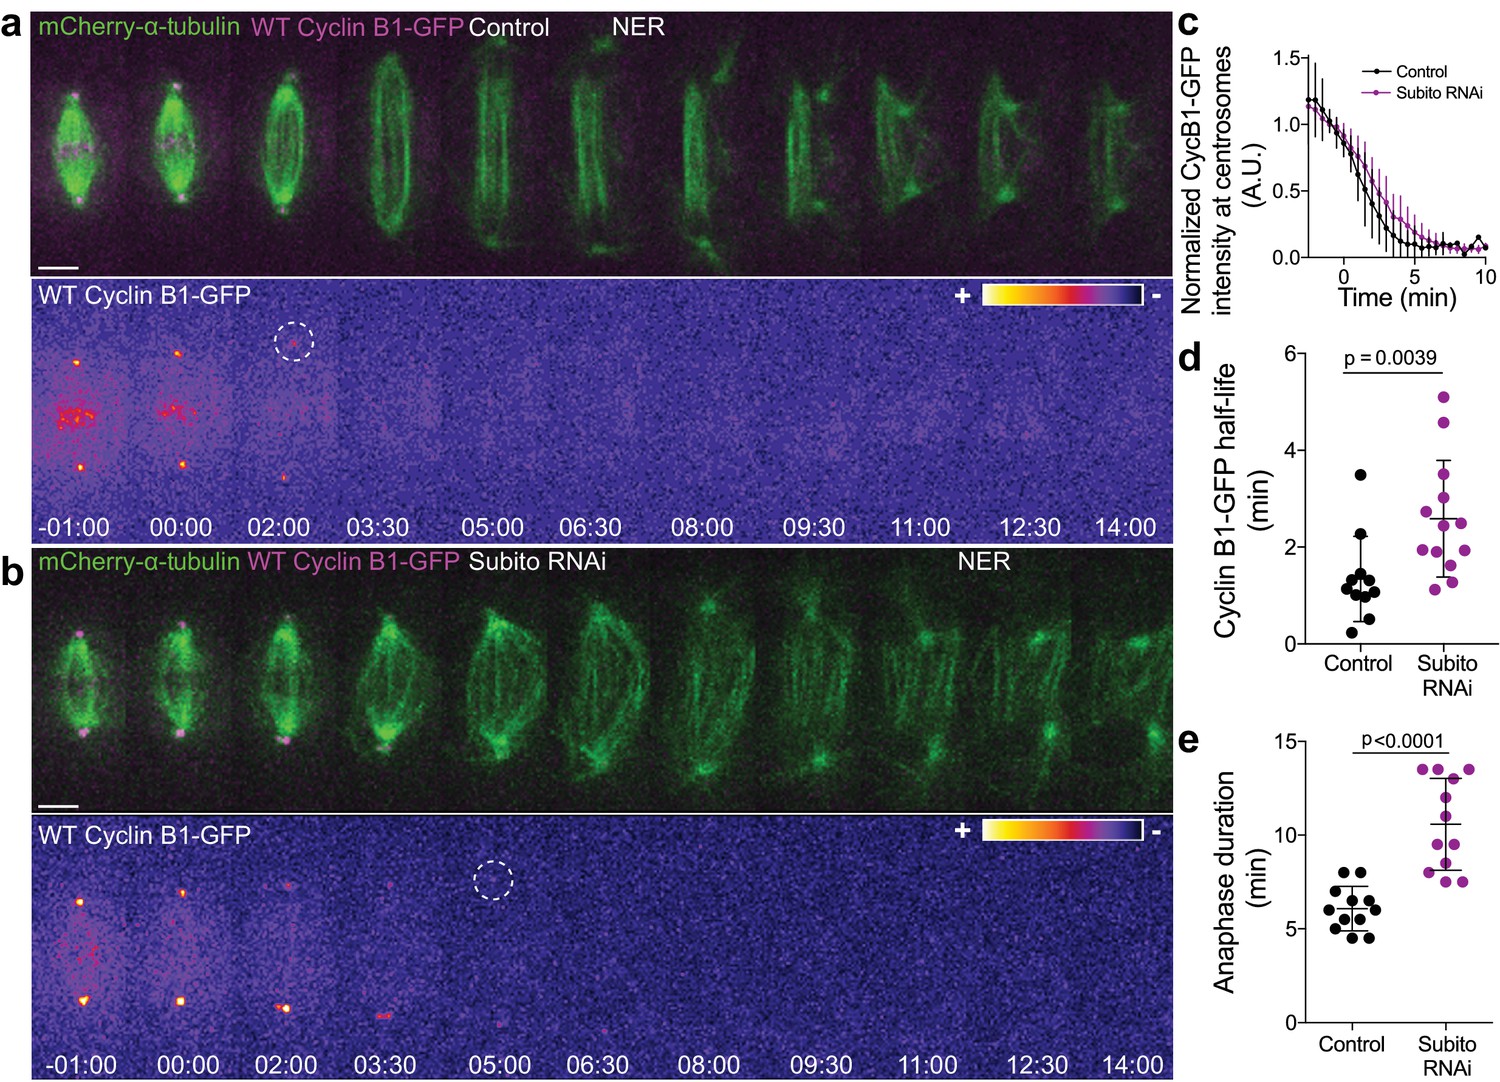
(a) and (b) Control and Subito/Mklp2-depleted Drosophila S2 cells stably expressing Cyclin B1-GFP/mCherry-α-tubulin. Cyclin B1-GFP localization is highlighted with the LUT ‘fire’ and dashed white circles highlight the frame before Cyclin B1 signal disappearance from centrosomes. Scale bars are 5 μm. Time is in min:sec. (c) Degradation profile of Cyclin B1-GFP quantified by measuring fluorescence intensity at centrosomes in control (n = 11 cells) and Subito/Mklp2-depleted S2 cells (n = 13 cells, pooled from three independent experiments). (d) and (e) Calculated Cyclin B1-GFP half-life (0–4.5 min after anaphase onset) and quantified anaphase duration, respectively, in the same control and Subito/Mklp2-depleted S2 cells as in (c). Statistical significance was tested with a nonparametric Mann-Whitney test and an unpaired t-test for data in (d) and (e), respectively.
-
Figure 8—source data 1
Anaphase duration after Subito RNAi.
- https://doi.org/10.7554/eLife.47646.035
Figure 9
Visualization of a CyclinB1-Cdk1 activity gradient in the vicinity of the midzone during anaphase.
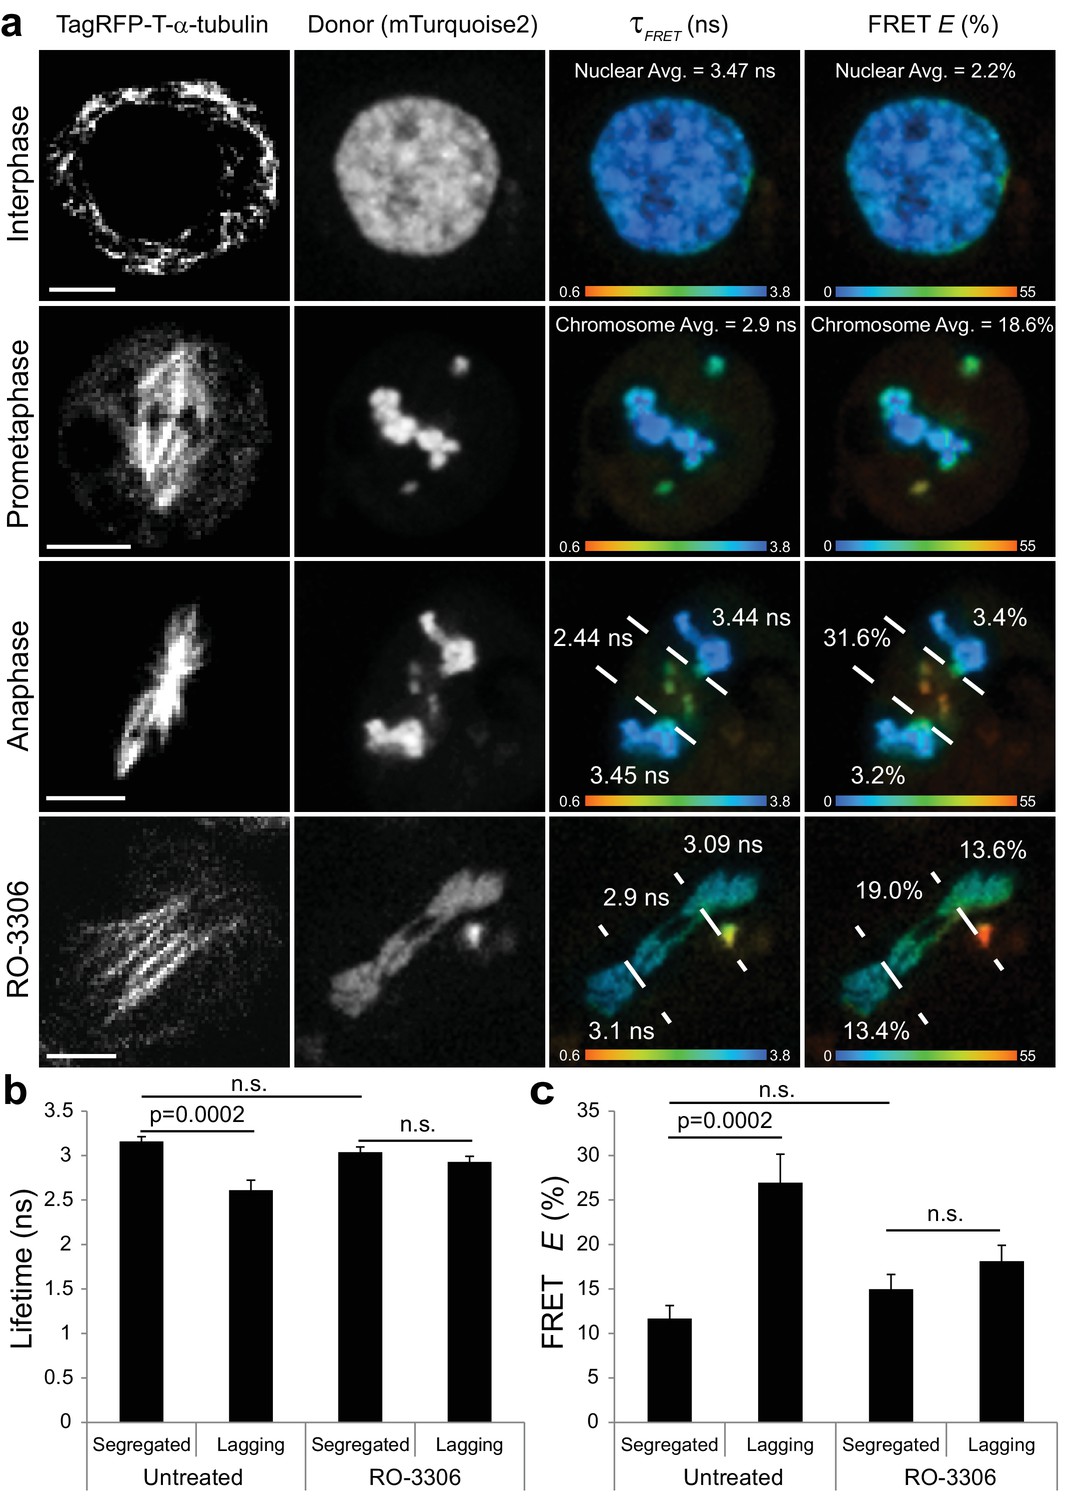
(a) The chromatin targeted reporter exhibits a longer lifetime and lower FRET efficiency in interphase versus prometaphase. The sensor on lagging chromosomes in the vicinity of the midzone MTs, demarcated by the dashed lines, exhibits higher FRET efficiency and shorter donor lifetime than the reporter on the segregated DNA. The activity gradient is no longer evident in the presence of 10 μM RO-3306. (b) Quantification of donor lifetimes for segregated versus lagging chromatin in untreated and RO-3306-treated cells (N = 14 cells for each condition). (c) Quantification of FRET efficiencies for segregated versus lagging chromatin in untreated and RO-3306-treated cells (N = 14 cells for each condition). Error bars are SEM. Scale bars are 5 μm. Color wedges indicate 0.6 ns (blue) – 3.8 ns (red) for donor lifetimes and 0% (blue) to 55% (red) for FRET E. Two-tailed P-values from a Student’s t-test are reported. n.s. is not significant (p>0.05).
-
Figure 9—source data 1
Mean lifetimes, percentage of fluorophores exhibiting short and long lifetimes, and the short lifetimes for the chromatin-targeted Cyclin B1-Cdk1 activity reporter.
Mitotic cells included prophase, prometaphase, and metaphase, but excluded anaphase and telophase/cytokinesis. * indicates p<0.05 relative to the control, non-phosphorylatable FRET reporter in interphase. # indicates p<0.05 relative to the phosphorylatable FRET reporter in interphase. Two-tailed P-values from a Student’s t-test are reported.
- https://doi.org/10.7554/eLife.47646.037
-
Figure 9—source data 2
Mean FRET efficiency statistics of chromatin-targeted Cyclin B1-Cdk1 FRET sensors.
Analysis of mitotic cells includes prophase, prometaphase, and metaphase, but excludes anaphase and telophase/cytokinesis. The active sensor reported increased FRET in mitosis relative to the non-phosphorylatable control in interphase (p<0.001). P-values calculated using the PlotsOfDifferences web app (Goedhart, 2019). N-values reported in the table apply to Figure 9—source data 1.
- https://doi.org/10.7554/eLife.47646.038
Figure 10 with 2 supplements
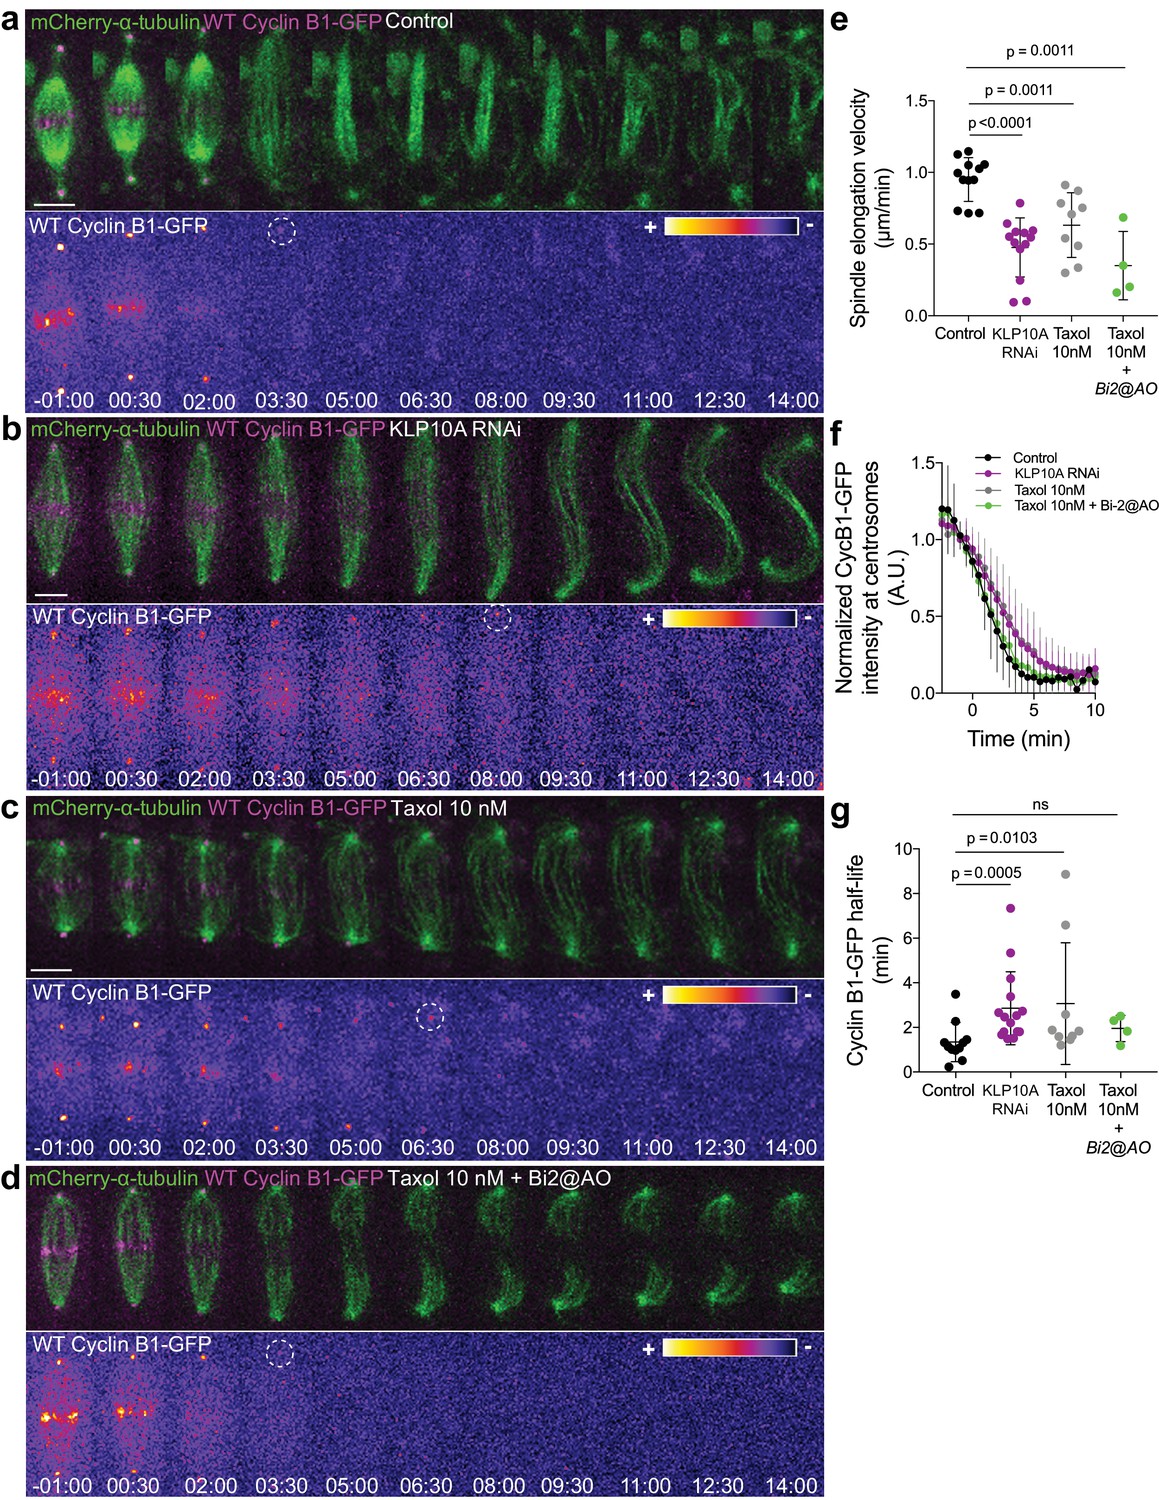
Cyclin B1 degradation during anaphase responds to slow chromosome separation in an Aurora B-dependent manner.
(a) Control S2 cell stably expressing Cyclin B1-GFP/mCherry-α-tubulin. (b) KLP10A depleted S2 cell stably expressing Cyclin B1-GFP/mCherry-α-tubulin. (c) and (d) Examples of S2 cells treated with 10 nM Taxol during metaphase, where Binucleine-2 was added at anaphase onset in the condition shown in (d). For all conditions Cyclin B1 localization is highlighted with LUT ‘fire’ and dashed white circles highlight the frame before Cyclin B1 signal disappearance. Scale bar is 5 μm. Time is in min:sec. (e) Half-spindle elongation velocity in control (n = 11 cells), KLP10A (n = 13 cells, pooled from three independent experiments), 10 nM Taxol (n = 9 cells) and 10 nM Taxol + Binucleine-2 addition at anaphase onset (n = 4 cells). Note the strong impairment of anaphase chromosome separation in all conditions. (f) and (g) Cyclin B1-GFP degradation profile and calculated Cyclin B1-GFP half-life in control (n=11 cells), KLP10A (n=15 cells, pooled from 3 independent experiments), 10 nM Taxol (n=9 cells) and 10 nM Taxol + Binucleine-2 addition at anaphase onset (n=4 cells).
-
Figure 10—source data 1
Cyclin B1-GFP half-life after attenuation of chromosome separation velocity.
- https://doi.org/10.7554/eLife.47646.043
Figure 10—figure supplement 1

Aurora B or phosphatase inhibition at anaphase onset does not affect Cyclin B1 degradation kinetics.
(a) Quantification of Cyclin B1-GFP fluorescence intensity at centrosomes in Drosophila S2 without treatment (n = 12 cells) or after Aurora B inhibition at anaphase onset (n = 6 cells). (b) Quantification of total endogenously tagged Cyclin B1-Venus in hTERT-RPE1 cells without treatment (n = 4 cells) and after Aurora B inhibition at anaphase onset (n = 9 cells). (c) Degradation profile of Cyclin B1-GFP measured by quantification of fluorescence intensity at centrosomes after PP1/PP2A inhibition at A.O. with okadaic acid (n = 4 cells).
Figure 10—figure supplement 2
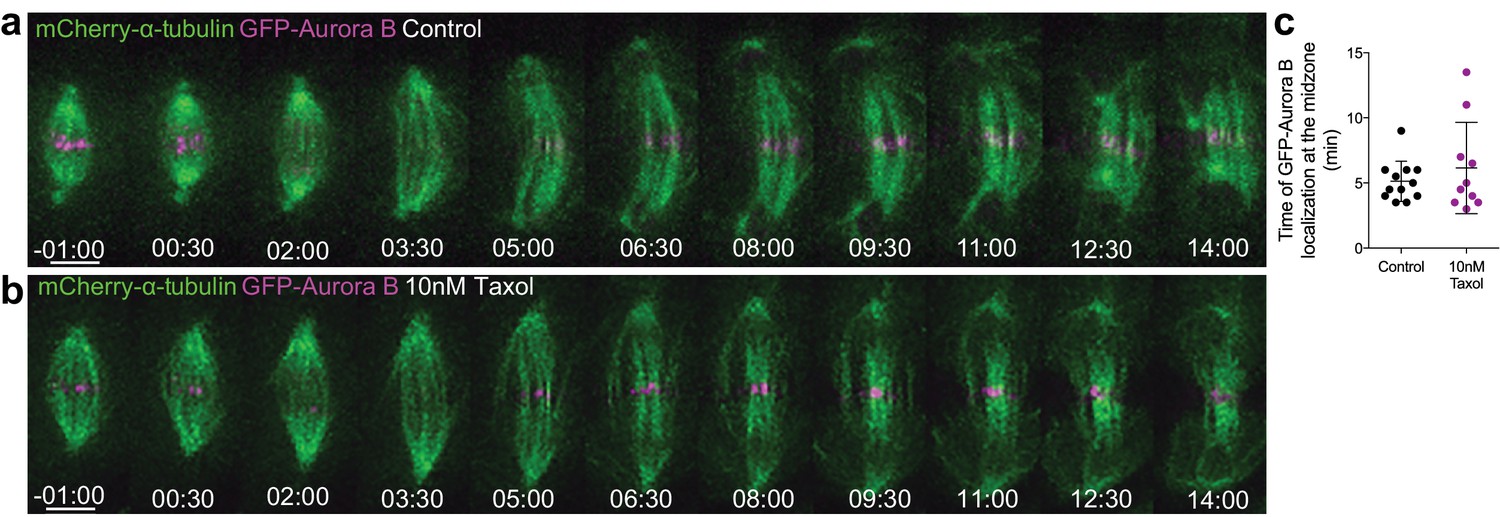
Short exposure to low doses of Taxol do not compromise Aurora B localization at the spindle midzone.
(a) and (b) Representative examples of a control and a 10 nM Taxol treated cell stably expressing GFP-Aurora B/mCherry-α-tubulin. Scale bar is 5 μm. Time is in min:sec. (c) Quantification of the time of Aurora B recovery at the midzone in cells (n=10 cells) with or without 10 nM Taxol (n=12 cells).
-
Figure 10—figure supplement 2—source data 1
Time of GFP-Aurora B localization at the midzone after Taxol treatment.
- https://doi.org/10.7554/eLife.47646.042
Figure 11

A crosstalk between molecular ‘rulers’ (Aurora B) and ‘clocks’ (Cdk1) licenses mitotic exit only after proper chromosome separation.
APC/CCdc20 mediates the initial degradation of Cyclin B1 as chromosome align at the spindle equator and cells enter anaphase under SAC control. The consequent decrease in Cdk1 activity as cells enter anaphase targets Aurora B to the spindle midzone (via Subito/Mklp2/kinesin-6); Aurora B at the spindle midzone (counteracted by PP1/PP2A phosphatases on chromatin) establishes a phosphorylation gradient that locally delays APC/CCdc20- and APC/CCdh1-mediated degradation of residual Cyclin B1, and possibly Cdk1, at the spindle midzone. Consequently, as chromosomes separate and move away from the spindle midzone, Cdk1 activity decreases, allowing the PP1/PP2A-mediated dephosphorylation of Cdk1 and Aurora B substrates (e.g. Lamin B and Condensin I) necessary for mitotic exit.
Author response image 1
Author response image 2
Videos
Video 1
Exogenous expression of Cyclin B1-GFP in Drosophila S2 cells shows continuous degradation during anaphase.
Mitotic progression from nuclear envelope breakdown to nuclear envelope reformation in a Drosophila S2 cell expressing Cyclin B1-GFP (green) and mCherry-α-tubulin (magenta). Cyclin B1 becomes undetectable at the anaphase-telophase transition, just before mCherry-α-tubulin exclusion from the nucleus. Time is min:sec.
Video 2
Endogenous Cyclin B1 is continuously degraded during anaphase in human HeLa cells.
Mitotic progression in two slightly asynchronous HeLa cells expressing endogenous Cyclin B1 tagged with Venus (green) and exogenous H2B-mRFP (magenta). Cyclin B1 becomes undetectable at the anaphase-telophase transition, just before DNA decondensation. Time is min:sec.
Video 3
Endogenous Cyclin B1 is continuously degraded during anaphase in human hTERT-RPE1 cells.
Mitotic progression of two slightly asynchronous hTERT-RPE1 cells expressing endogenous Cyclin B1 tagged with Venus (green) and SiR-DNA (magenta). Cyclin B1 becomes undetectable at the anaphase-telophase transition, just before DNA decondensation. Time is min:sec.
Video 4
Endogenous Cyclin B1 is continuously degraded during anaphase in the Drosophila adult follicular epithelium.
Mitotic progression of dividing follicle cells expressing endogenous Cyclin B1 tagged with GFP (green) and His2Av-mRFP (magenta). Note a pool of cytoplasmic Cyclin B1 that remains detectable until around 4 min after anaphase onset. Time is in min:sec.
Video 5
Proteasome inhibition during anaphase in Drosophila cells.
Drosophila S2 cell stably expressing Cyclin B1-GFP/mCherry-α-tubulin (white/green) and treated with SiR-DNA (magenta) to label mitotic chromosomes. The cell becomes arrested in anaphase for several hours with detectable levels of Cyclin B1 at centrosomes. Time is h:min.
Video 6
Proteasome inhibition at anaphase onset arrests human cells in anaphase.
Human U2OS cell stably expressing H2B-GFP/mCherry-α-tubulin (magenta/green) treated with MG132 at anaphase onset. Proteasome inhibition induced a strong anaphase arrest for several hours. Time is h:min.
Video 7
Aurora B inhibition in anaphase-arrested Drosophila cells treated with MG132.
Representative Drosophila S2 cell stably expressing Cyclin B1-GFP/mCherry-α-tubulin (white/green) and treated with SiR-DNA (magenta) to label mitotic chromosomes. The Aurora B inhibitor was added 35 min after anaphase onset, however the cell remained arrested in anaphase for several hours. Time is h:min.
Video 8
Aurora B inhibition in anaphase-arrested human cells treated with MG132.
Human U2OS cell stably expressing H2B-GFP/mCherry-α-tubulin (magenta/green) treated with MG132 at anaphase onset. The Aurora B inhibitor was added 40 min after anaphase onset. Similarly to the results in Drosophila S2 cells, U2OS cells remained arrested in anaphase for several hours after Aurora B inhibition. Time is h:min.
Video 9
Cdk1 inhibition in anaphase-arrested Drosophila cells treated with MG132.
Representative Drosophila S2 cell stably expressing Cyclin B1-GFP/mCherry-α-tubulin (white/green) and treated with SiR-DNA (magenta) to label mitotic chromosomes. The Cdk1 inhibitor was added 50 min after anaphase onset, inducing an almost immediate mitotic exit. Time is h:min.
Video 10
Cdk1 inhibition in anaphase-arrested human cells treated with MG132.
Human U2OS cell stably expressing H2B-GFP/mCherry-α-tubulin (magenta/green) treated with MG132 at anaphase onset. The Cdk1 inhibitor was added 90 min after anaphase onset and induced immediate mitotic exit. Time is h:min.
Tables
Key resources table
| Reagent type (species) or resource | Designation | Source or reference | Identifiers | Additional information |
|---|---|---|---|---|
| Genetic reagent (Drosophila) | CycB1-GFP | Buszczak et al., 2007 | genotype: w; P{PTT-GC}ycBCC01846; P{His2Av-mRFP}/+ | |
| Biological sample (mice) | Oocytes from CD-1 mice | Charles River Laboratories | RRID:MGI:5652464 | |
| Cell line (Drosophila) | S2-U | Gohta Goshima | ||
| Cell line (Drosophila) | S2 H2B-GFP/mCherry-α-tubulin | Afonso et al., 2014 | ||
| Cell line (Drosophila) | S2 Lamin B-GFP/mCherry-α-tubulin | Afonso et al., 2014 | ||
| Cell line (Drosophila) | S2 KEN-Cyclin B1-GFP/mCherry-α-tubulin | This work | ||
| Cell line (Drosophila) | S2 GFP-Aurora B/WT-Cyclin B1-mCherry | This work | ||
| Cell line (Human) | HeLa Cyclin B1-venus | Jonathon Pines | ||
| Cell line (Human) | U2OS | Afonso et al., 2014 | ||
| Cell line (Human) | hTERT-RPE1 Cyclin B1-venus | Jonathon Pines | ||
| Plasmid for mRNA synthesis (mouse) | Cyclin B1-mCherry | Pasternak et al., 2016 | ||
| Transfected construct (Drosophila) | pMT-GFP-Aurora B | Afonso et al., 2014 | ||
| Transfected construct (Drosophila) | non-degradable Cyclin B1-GFP | Afonso et al., 2014 | ||
| Transfected construct (Drosophila) | WT Cyclin B1-GFP | Mathieu et al., 2013 | ||
| Transfected construct (Drosophila) | KEN Cyclin B1-GFP | This work | ||
| Antibody | rabbit polyclonal anti Drosophila Cyclin B1 | James Wakefield | 1:2500 | |
| Antibody | mouse monoclonal anti Human Aurora B | Aim1, BD Biosciences | RRID:AB_2227708 | 1:500 |
| Antibody | rabbit polyclonal anti Drosophila Cenp C | Claudio Sunkel | 1:10000 | |
| Antibody | mouse monoclonal anti-α-tubulin (B-512 clone) | Sigma | 1:2000 | |
| Antibody | Alexa-Fluor secondary antibodies | Thermo Fisher | 1:2000 | |
| Commercial assay or kit | site-directed mutagenesis kit | Agilent | ||
| Chemical compound, drug | RO3306 | Sigma | 10 μM | |
| Chemical compound, drug | Binucleine-2 | Sigma | 40 μM | |
| Chemical compound, drug | ZM447439 | Tocris Bioscience | 4–5 μM | |
| Chemical compound, drug | MG132 | Merck | 20 μM | |
| Chemical compound, drug | Apcin | Tocris Bioscience | 200 μM | |
| Chemical compound, drug | pro-TAME | Boston Biochem | 6.3 μM | |
| Chemical compound, drug | SiR-DNA | Spirochrome | 50 nM (Human cells) and 80 nM (Drosophila) | |
| Chemical compound, drug | Sir-TUB | Spirochrome | 20 nM | |
| Software, algorithm | Prism V8 | Graphpad | RRID:SCR_002798 | |
| Software, algorithm | Fiji | ImageJ/Fiji | RRID:SCR_002285 | |
| Software, algorithm | Matlab | The MathWorks | RRID:SCR_001622 |
Additional files
-
Source code 1
Kymograph generation.
- https://doi.org/10.7554/eLife.47646.045
-
Supplementary file 1
Conservation of D-box, KEN boxes and Aurora B phosphorylation sites on Drosophila Cyclin B1 and human Cyclins B1 and B2.
- https://doi.org/10.7554/eLife.47646.046
-
Transparent reporting form
- https://doi.org/10.7554/eLife.47646.047
Download links
A two-part list of links to download the article, or parts of the article, in various formats.
Downloads (link to download the article as PDF)
Open citations (links to open the citations from this article in various online reference manager services)
Cite this article (links to download the citations from this article in formats compatible with various reference manager tools)
Spatiotemporal control of mitotic exit during anaphase by an aurora B-Cdk1 crosstalk
eLife 8:e47646.
https://doi.org/10.7554/eLife.47646


