Cryo-EM analyses reveal the common mechanism and diversification in the activation of RET by different ligands
- University of Texas Southwestern Medical Center, United States
Figures
Figure 1 with 6 supplements
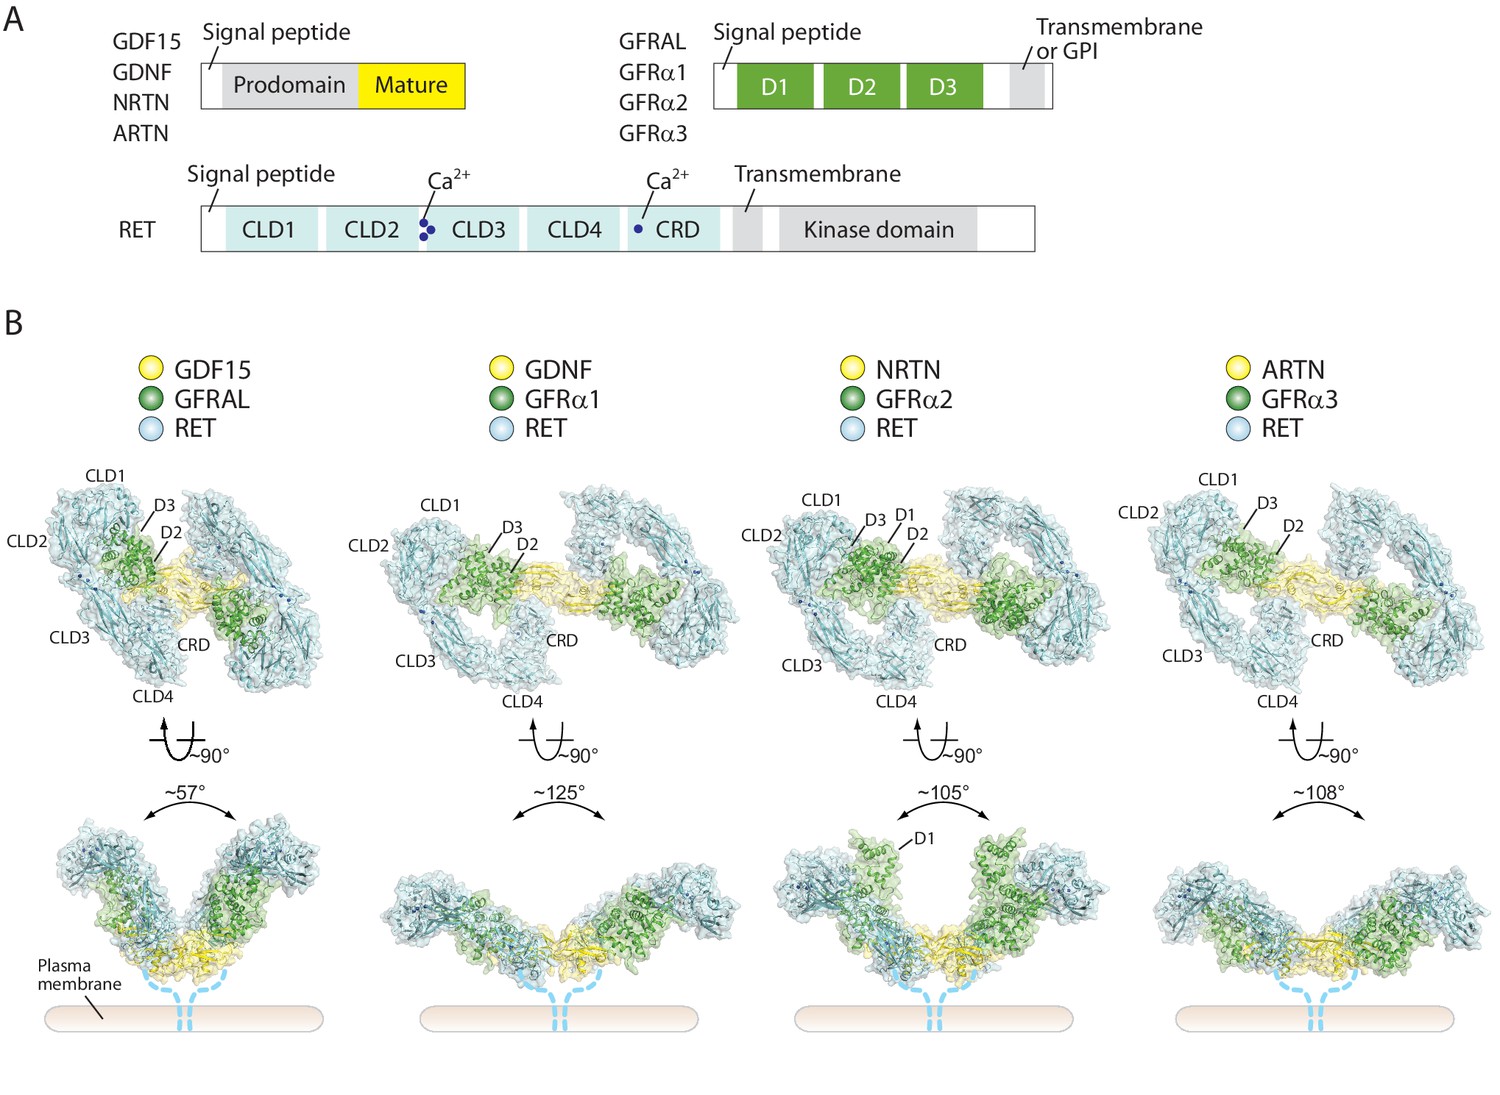
Overall structures of four different RET ternary complexes.
(A) Domain organization of the ligands, co-receptors and RET. The domains in gray are absent in the cryo-EM structures. (B) Cartoon representations of the four RET ternary complexes. The angles between the two wings are indicated -in the side views. Dotted lines indicate the connection from the CRD to the transmembrane region of RET.
Figure 1—figure supplement 1
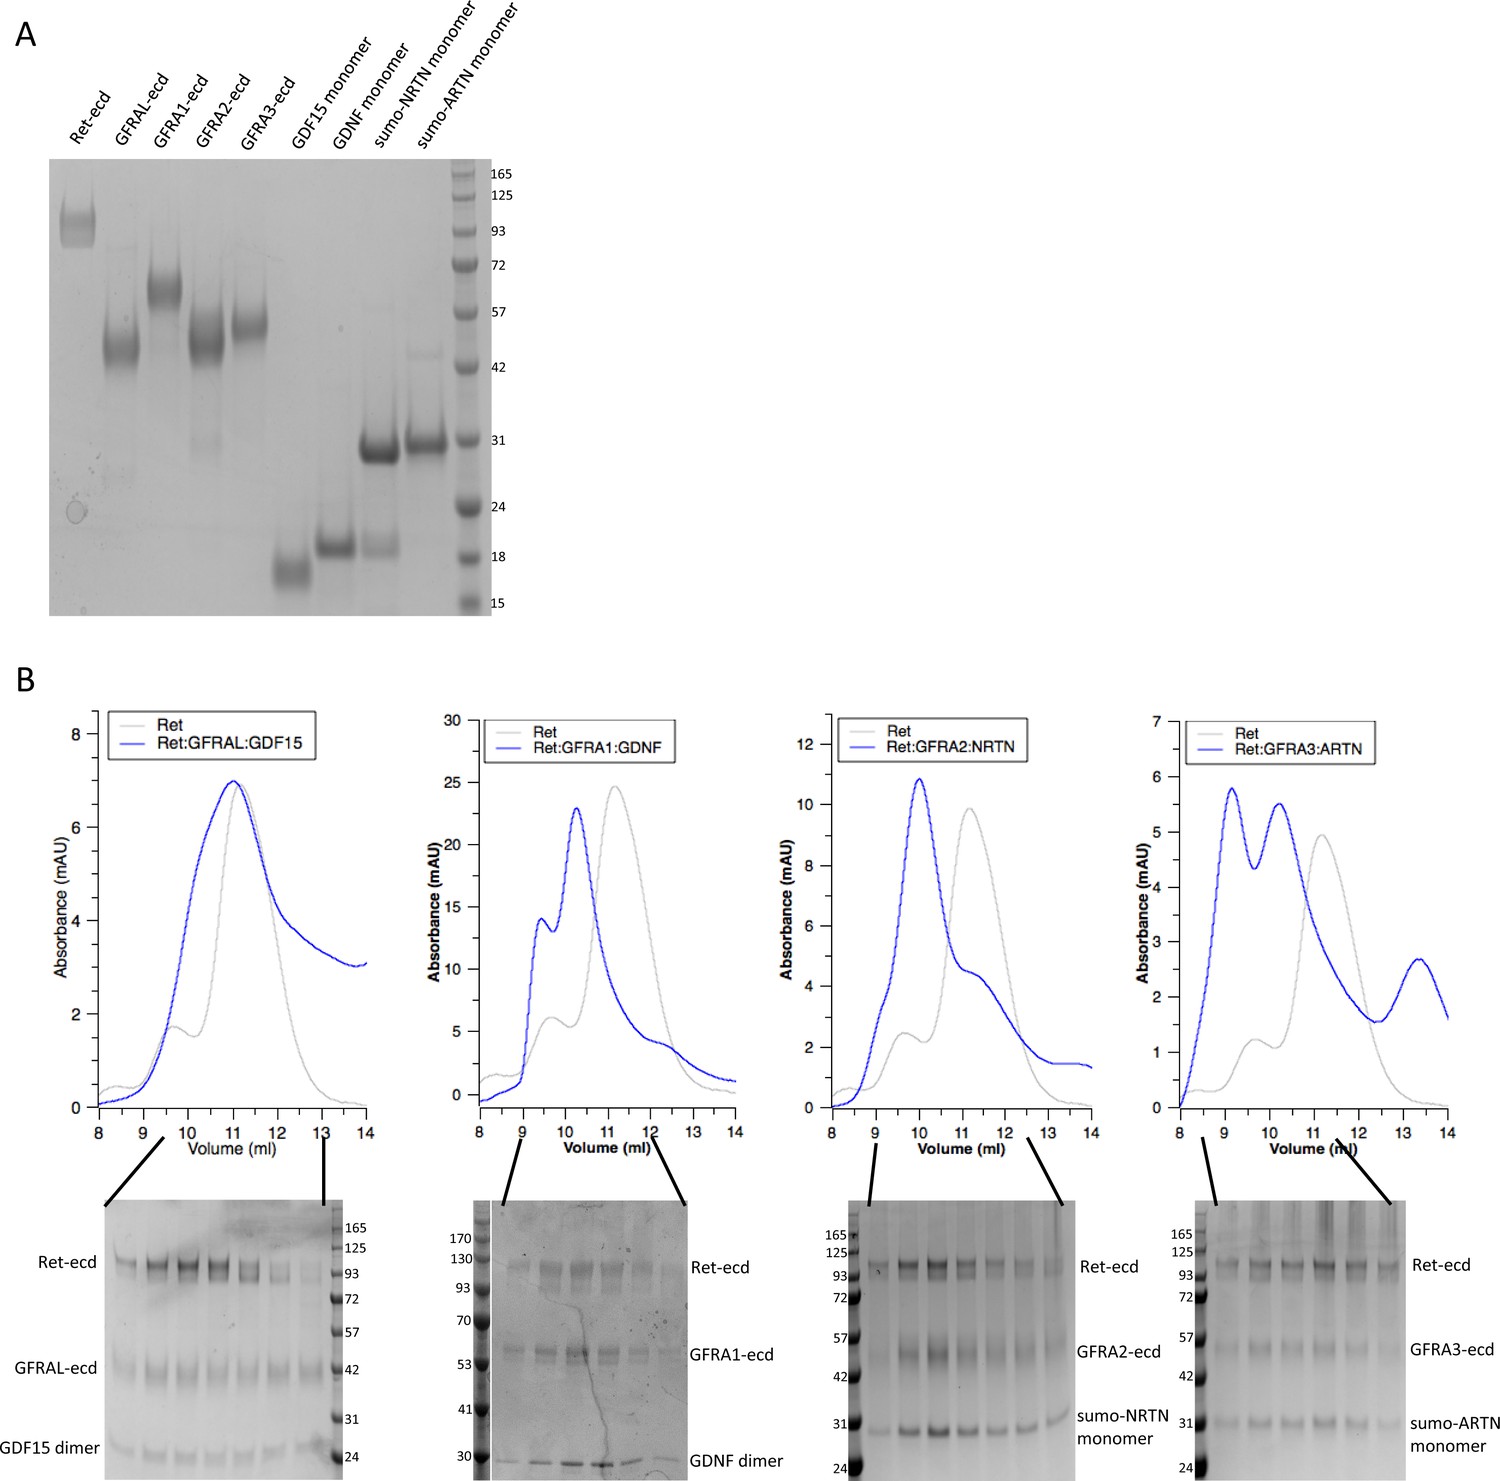
Purification of the four RET ternary complexes.
(A) The SDS-PAGE analyses of each protein component on its own. (B) The upper and lower panels show the gel filtration profiles and SDS-PAGE analyses of the proteins, respectively. The right shifts of the complex peaks relative to that of RET alone suggest that the complexes were stable and remained intact during gel filtration chromatography. The earlier elution times and multiple peaks of the GDNF/GFRα1/RET, NRTN/GFRα2/RET and ARTN/GFRα3/RET complexes suggest that they formed larger oligomers in addition to the 2:2:2 complexes.
Figure 1—figure supplement 2

Flowchart of data processing.
(A) The workflow for the NRTN/GFRα2/RET complex is shown as the representative. For the other three datasets, the image processing was carried out with the same workflow, except that tetramer refinement was only performed for NRTN/GFRα2/RET complex and no focused refinement was performed for the GDNF/GFRα1/RET complex. (B) Unsharpened cryo-EM maps colored by local resolution.
Figure 1—figure supplement 3

Cryo-EM analyses of four RET ternary complexes.
(A) Refined maps of the 2:2:2 complexes. RET, the co-receptors and ligands were colored cyan, green and yellow, respectively. (B) Symmetry expansion and focused refinement of one dimeric ligand bound to one RET and one co-receptor molecule (C) Gold standard Fourier Shell Correlation (FSC) curves of the focused refined maps. Yellow, GDNF/GFRα1/RET; green, NRTN/GFRα2/RET; Red, ARTN/GFRα3/RET. cyan, GDF15/GFRAL/RET; (D) FSC curves between the maps and atomic models. The color scheme is the same as in (C).
Figure 1—figure supplement 4

Representative- cryo-EM density of various parts of the four ternary RET complexes.
https://doi.org/10.7554/eLife.47650.006
Figure 1—figure supplement 5
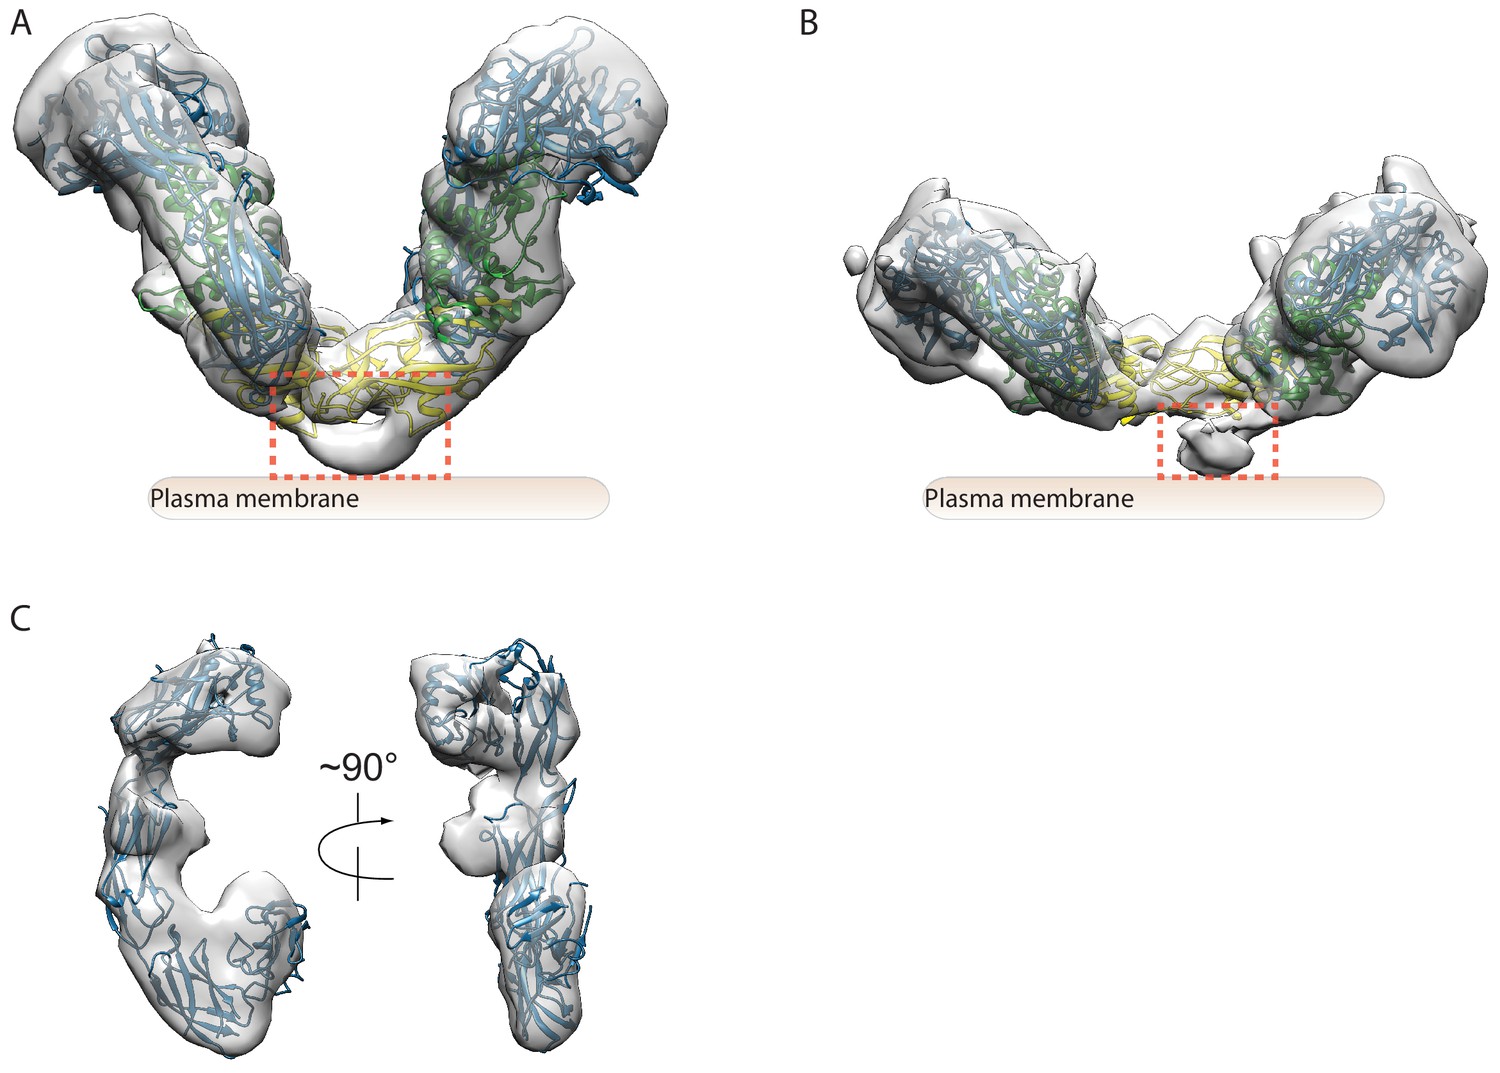
Additional cryo-EM maps.
(A) and (B) 3D reconstructions of the GDF15/GFRAL/RET and ARTN/GFRα3/RET complexes, respectively, at a low contour level showing extra density underneath the ligands. This weak density likely represents the linker region between the CRD and transmembrane region in RET. (C) 3D reconstruction of RET in the apo-state. The RET atomic model from the ARTN/GDFRα3/RET complex is fit into the map to show the similarity between apo-RET and RET in the ternary complexes.
Figure 1—figure supplement 6
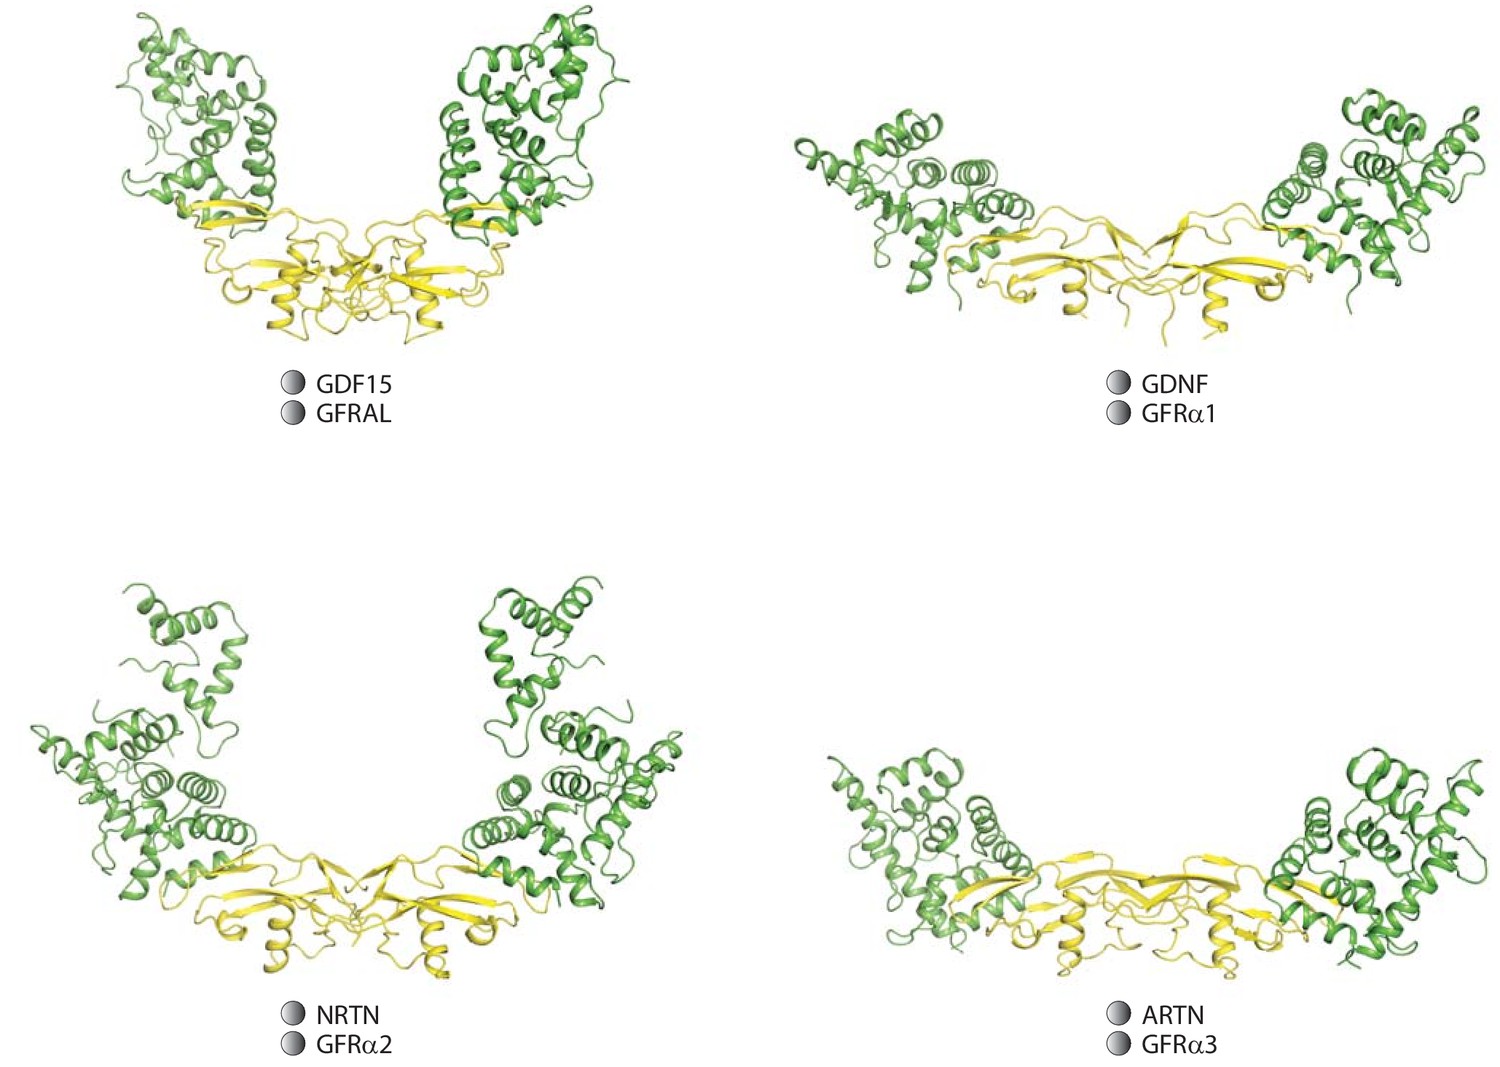
Expanded view of the different ligands/co-receptors.
This comparison shows that the different angles of the two wings in the complexes are caused by both the different conformations of the ligand dimers and their different interactions with their respective co-receptors.
Figure 2 with 1 supplement

Structure of the RET extracellular domain.
(A–D) Overall structure and the inter-domain interactions in the RET extracellular region. (E) Structure of the CRD domain of RET. The expanded view shows the details of the putative calcium binding site. The density for the calcium ion is very strong, displayed as blue mesh at the 20σ threshold. (F) Topology diagram of the CRD domain. (G) Calcium binding site in calmodulin (PDB ID: 1cll). (H) Sequence alignment of the calcium binding segment in the CRD domain of RET from human (h), mouse (m), chicken (c) and Drosophila (d). Circles and triangles highlight residues coordinating the calcium ion with sidechains and backbone carbonyl, respectively.
Figure 2—figure supplement 1
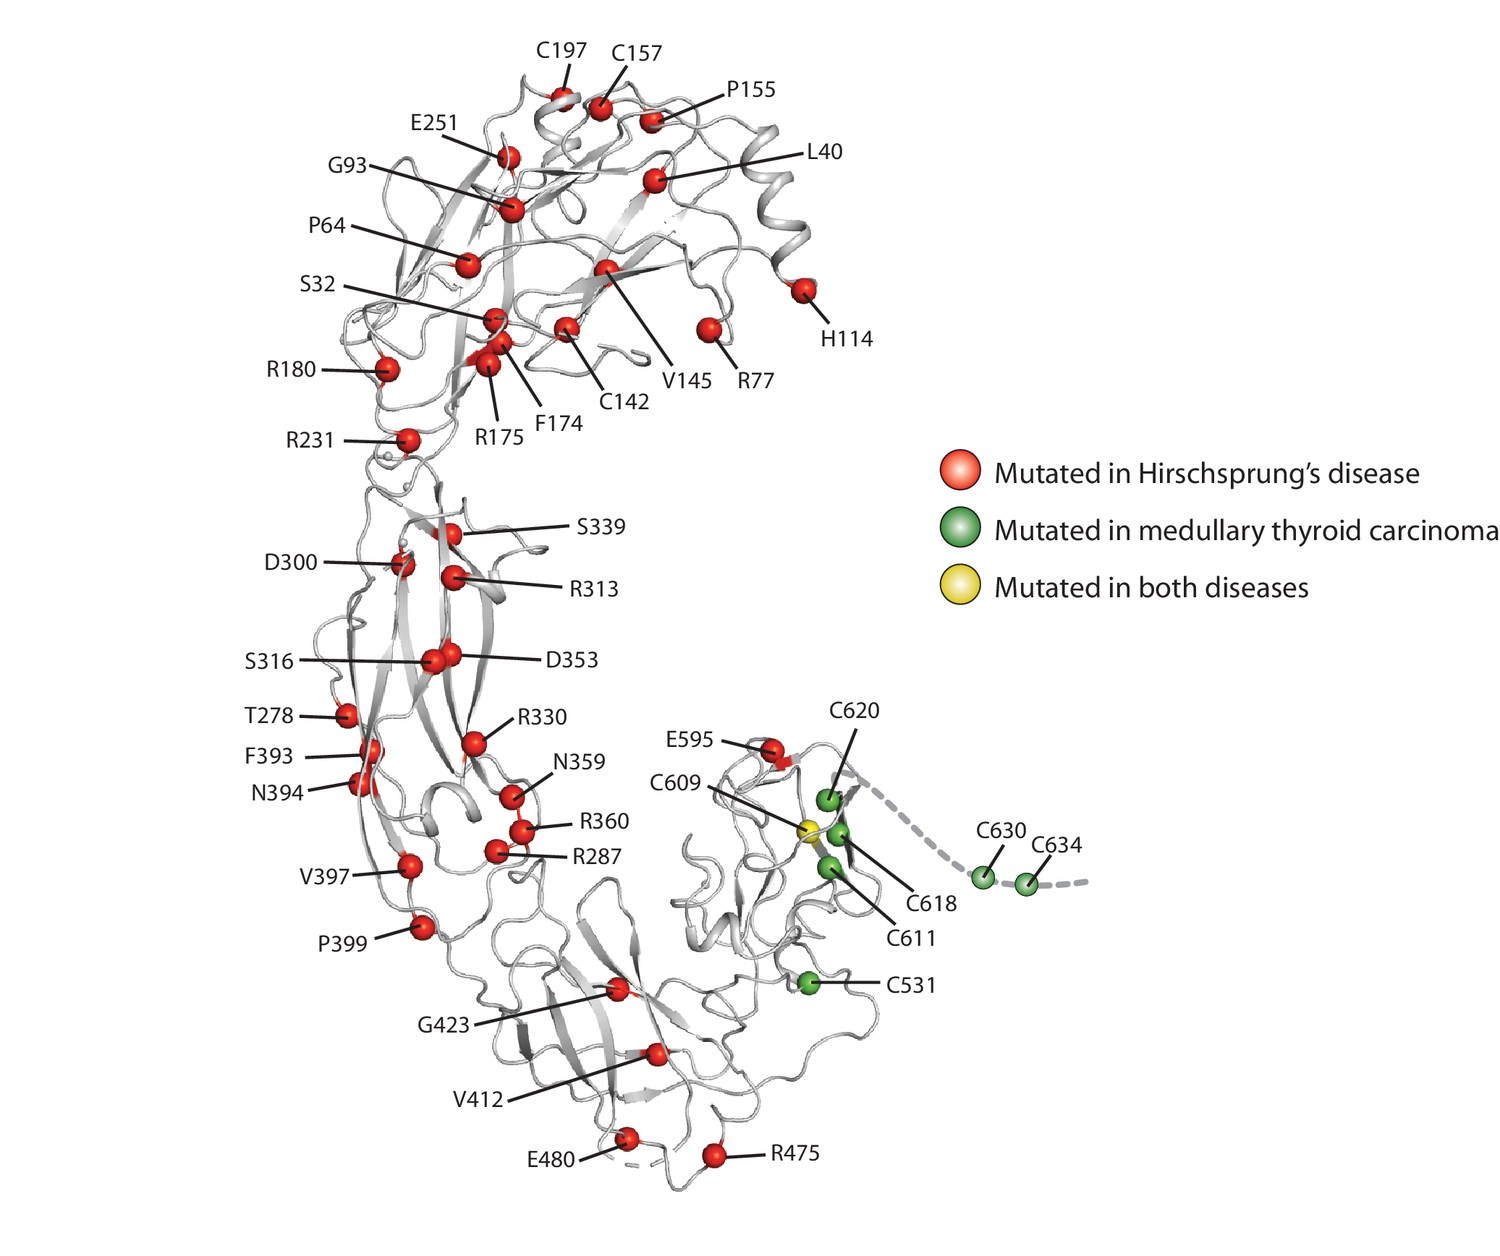
Mapping of the disease-associated point mutations onto the RET extracellular domain.
Mutations summarized in the entry for RET in the Uniprot database are highlighted as spheres in the structure. Several of mutations found in Hirschsprung disease (R77, H114 and R175) are at the co-receptor binding surface. D300 is a part of the calcium binding site in CLD3.
Figure 3 with 1 supplement

Binding interfaces in the GDF15/GFRAL/RET complex.
(A) Interface between RET and GFRAL. An overall view of the complex structure is shown in the middle as a reference. (B) Interface between RET-CRD and GDF15. (C) Pull-down assays for the GDF15/GFRAL/RET ternary complex. Strep-tagged GFRAL bound to Streptavidin-conjugated beads was used to pull down GDF15 and RET. Streptavidin beads without Strep-GFRAL bound served as negative control. Mutations in either GFRAL or GDF15 abolish binding of RET. The results shown are representative of three biological repeats. (D) GDF15-induced ERK phosphorylation in HEK293 cells expressing full-length myc-tagged RET and GFRAL. Cells were treated with GDF15 at 10 nM for 15 min. ERK phosphorylation levels (pERK) were assessed by western blot. Expression levels of RET and GFRAL were monitored by anti-myc western blot. The results shown are representative of three biological repeats.
Figure 3—figure supplement 1
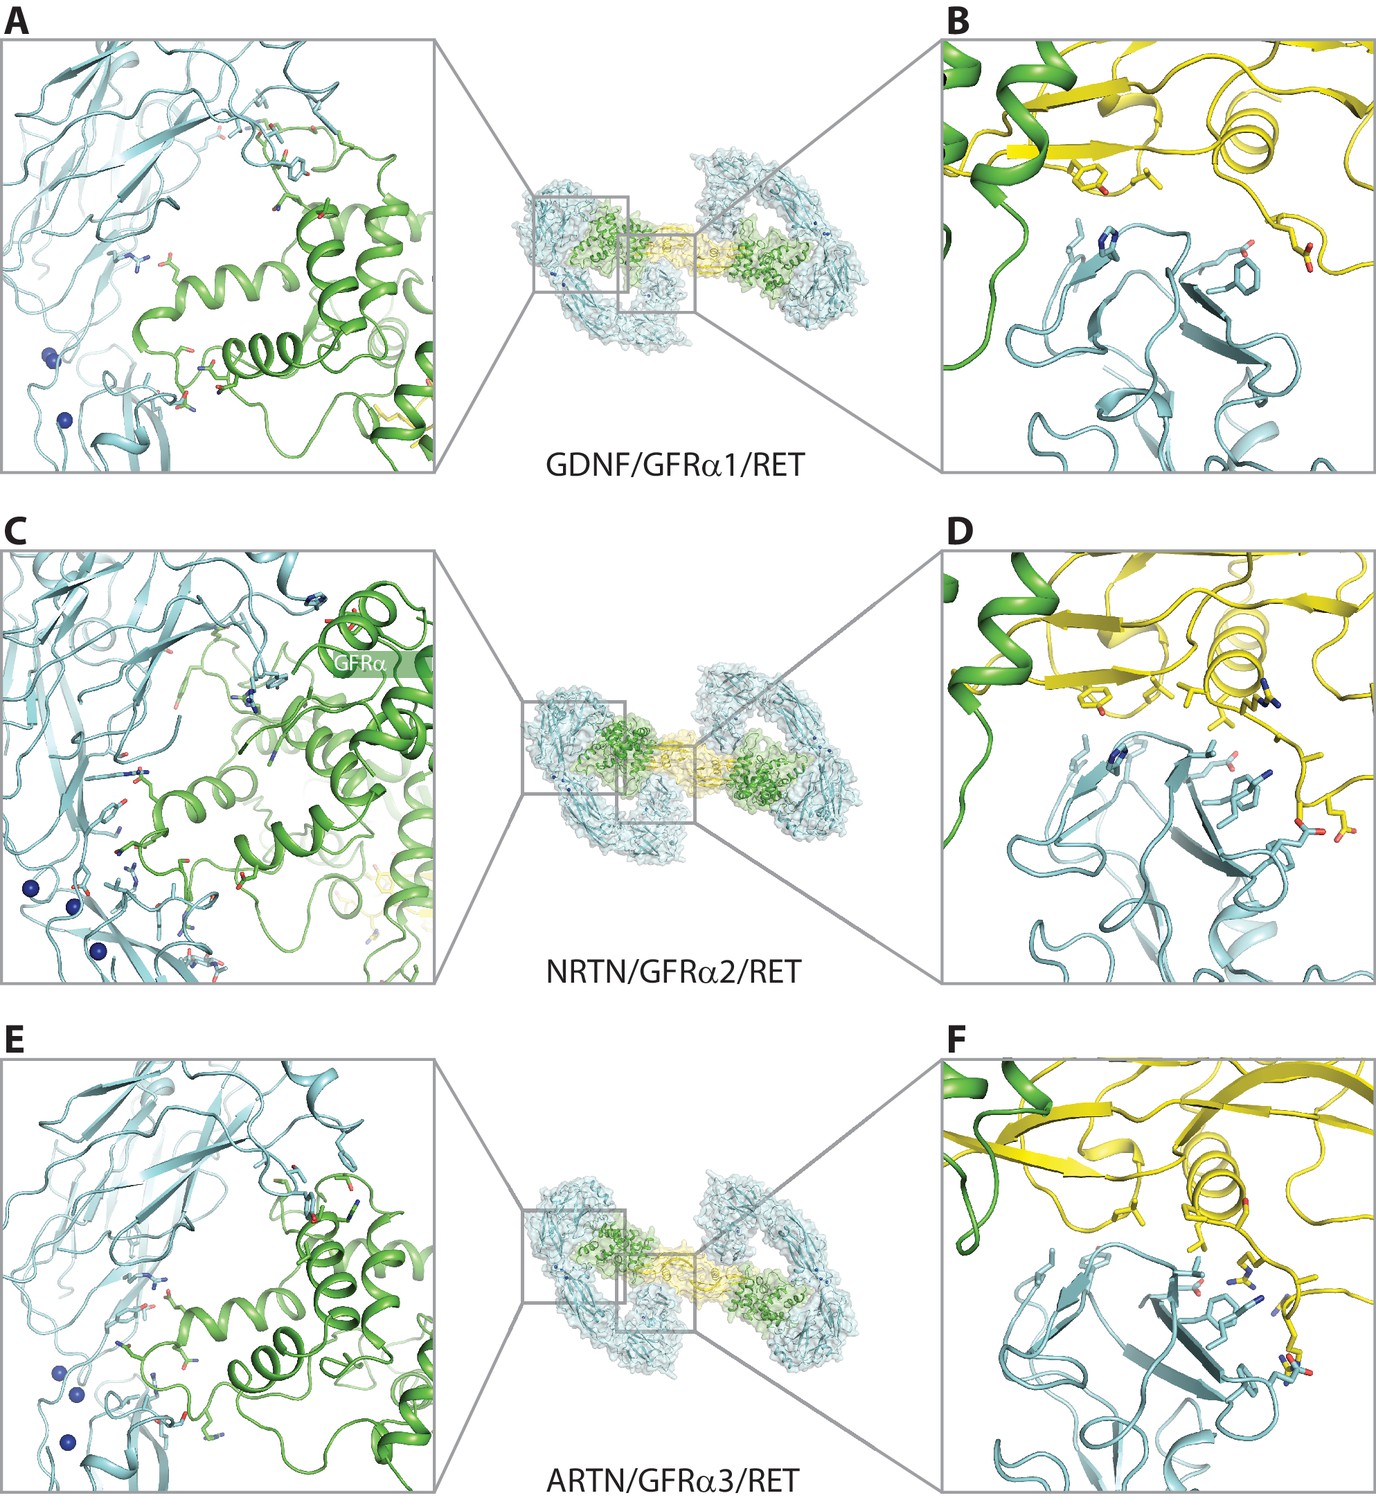
Binding interfaces in the GDNF/GFRα1/RET, NRTN/GFRα2/RET and ARTN/GFRα3/RET complexes.
(A), (C) and (E) Interface between RET and the co-receptors. (B), (D) and (F) Interface between RET-CRD and the ligands.
Figure 4 with 1 supplement
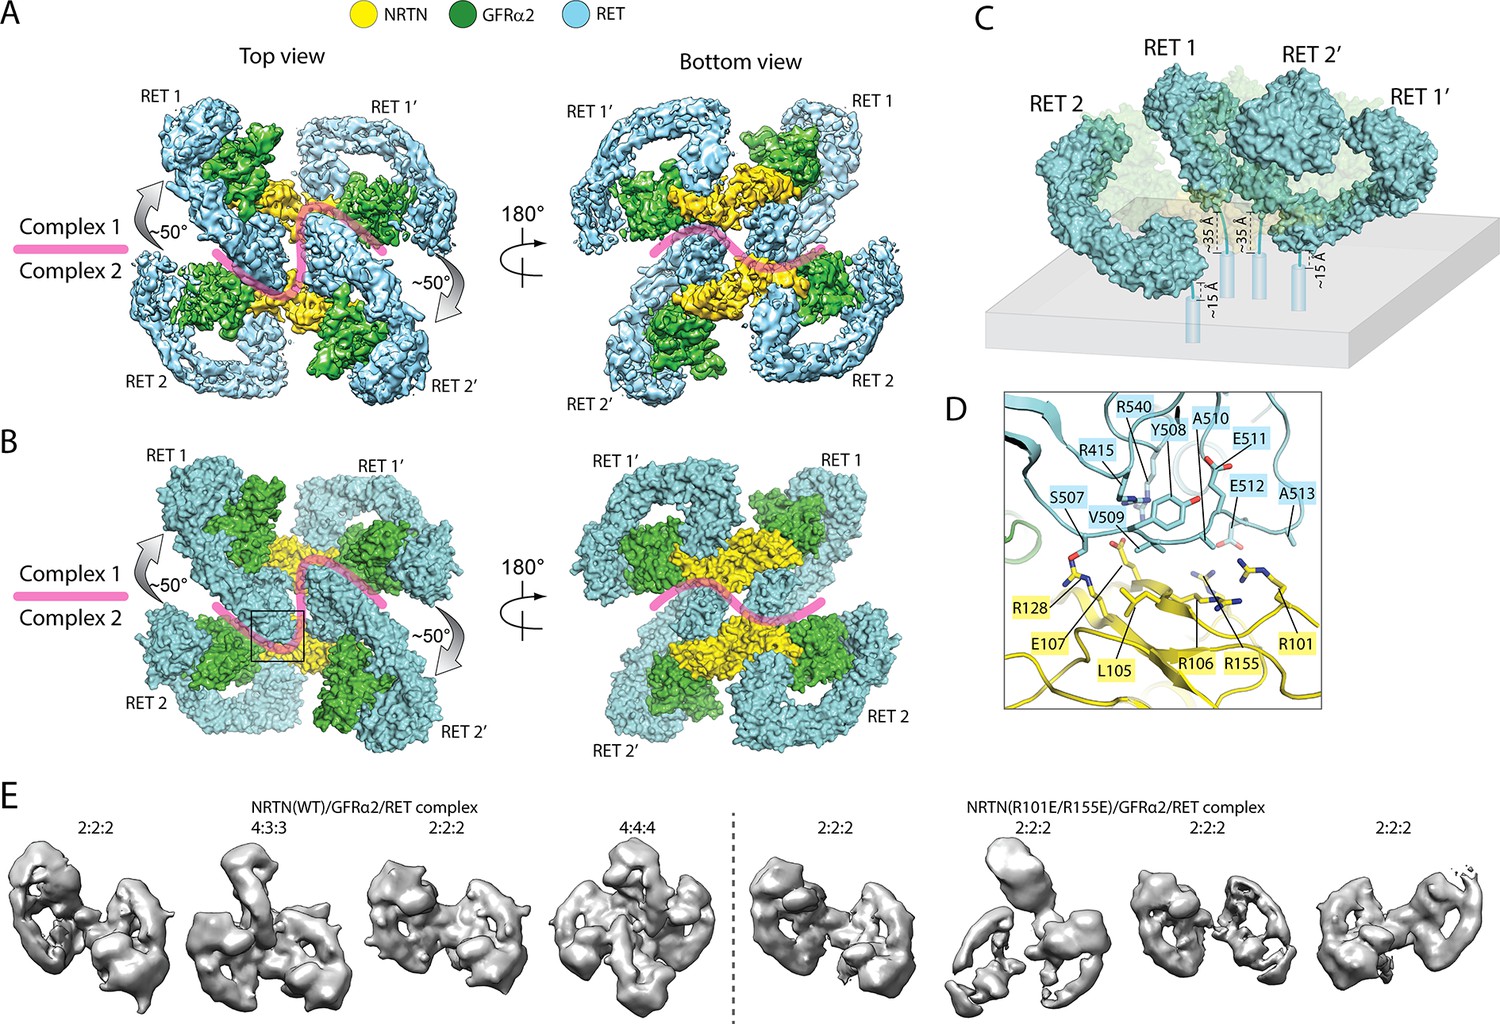
Higher-order oligomerization of the NRTN/GFRα2/RET complex.
(A) Refined map of the 4:4:4 NRTN/GFRα2/RET complex. (B) Atomic model of the 4:4:4 NRTN/GFRα2/RET complex shown in the surface representation. (C) Distance of the four RET molecules in the 4:4:4 complex to the plasma membrane. The gray box represents the plasma membrane. NRTN and GFRα2 are rendered semi-transparent to clearly show the position of the four RET molecules relative to the membrane. (D) Detailed view of the new interface between NRTN and RET that mediate the formation of the 4:4:4 complex. The view is expanded from the boxed region in the left panel of (B). (E) 3D class averages of the NRTN(WT)/GFRα2/RET and NRTN(R101E/R155E)/GFRα2/RET complexes. Wild-type NRTN formed complexes with RET and GFRα2 larger than the 2:2:2 stoichiometry, which were eliminated by the R101E/R155E mutation.
Figure 4—figure supplement 1
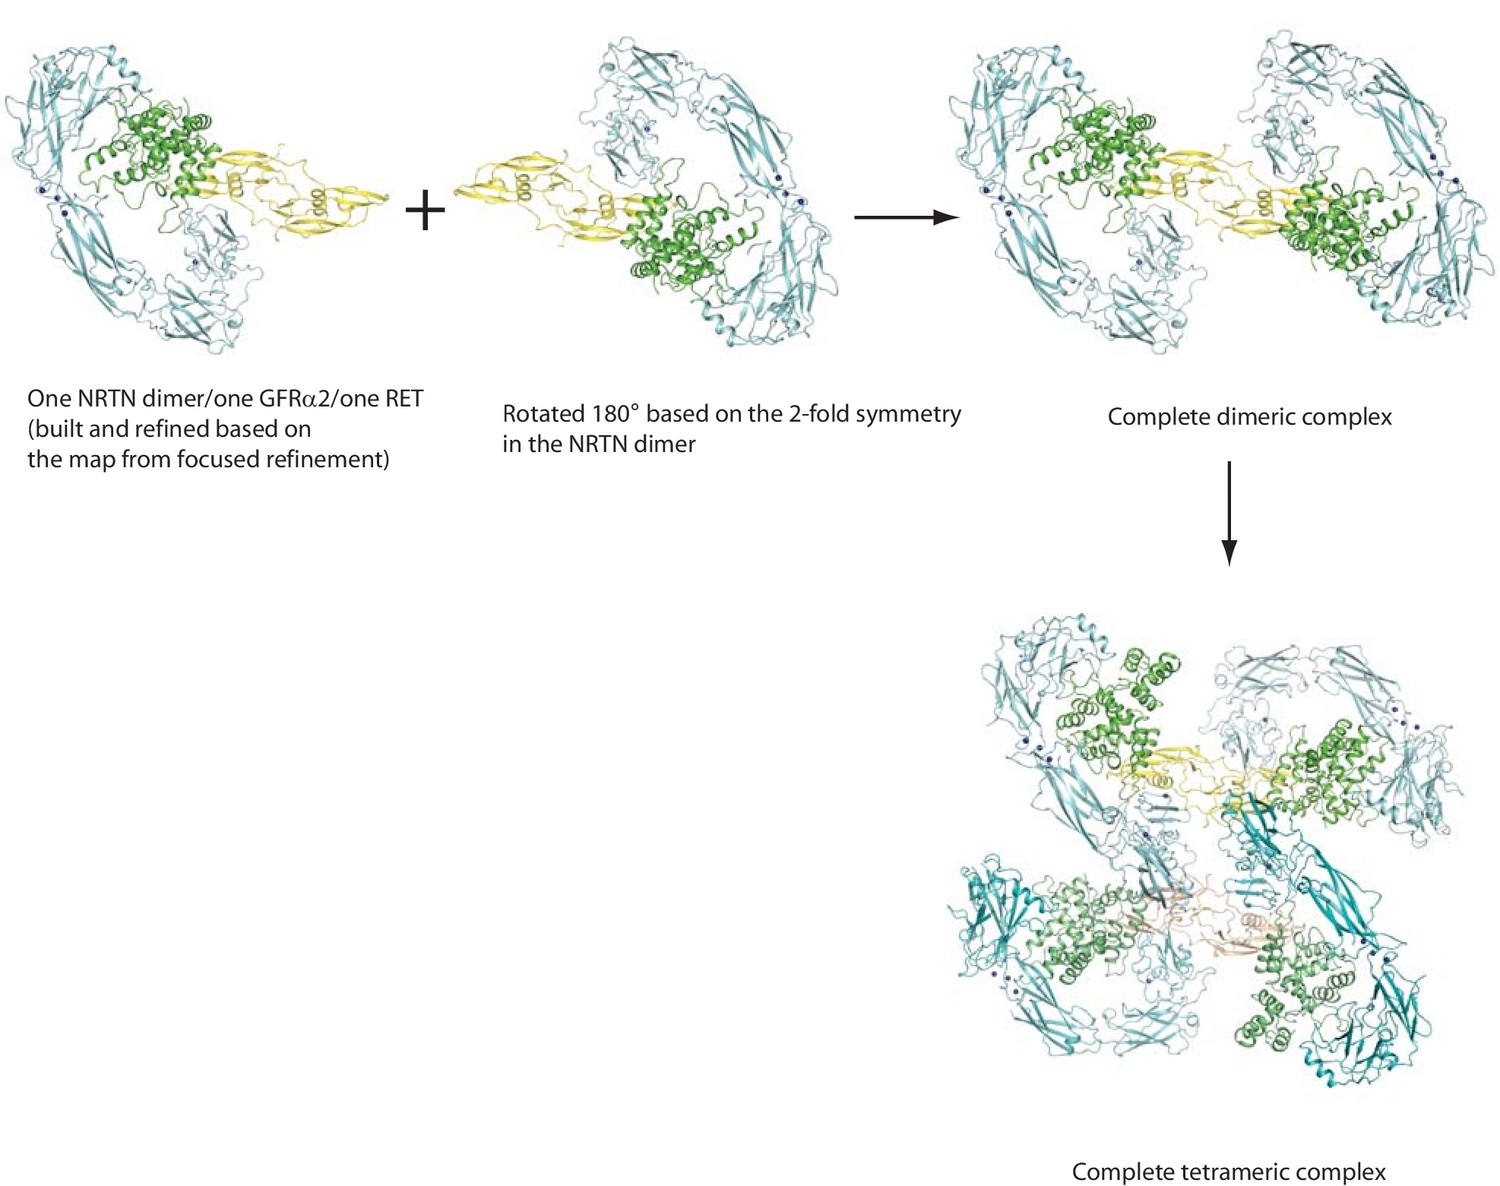
Model building procedure for the 4:4:4 NRTN/GFRα2/RET complex.
https://doi.org/10.7554/eLife.47650.014
Figure 5

The 4:4:4 NRTN/GFRα2/RET complex delays RET endocytosis.
(A) Endocytosis of the NRTN/GFRα2/RET and GDF15/GFRAL/RET complexes. Fluorescently labeled NRTN (wild-type or the R101E/R155E mutant) and GDF15 were incubated with COS7 cells expressing GFRα2/RET and GFRAL/RET, respectively, and imaged at indicated time points. EEA1 were immuno-stained to serve as an early endosome marker. (B) Quantification of the colocalization of NRTN wild-type, the R101E/R155E mutant and GDF15 with EEA1. Pearson’s correction coefficients between the ligands and EEA1 were calculated for 35 cells in each group from two biological repeats. Each dot in the scatter plot represent one cell. The bars represent mean and standard deviation. P-values were calculated using the two-tailed Welch’s t-test. ****p<0.0001.
-
Figure 5—source data 1
Source data for Figure 5B.
- https://doi.org/10.7554/eLife.47650.017
Figure 6

Ligand-independent dimerization of RET.
(A) The dimer of RET-CLD1/CLD2 in a previously reported crystal structure (PDB ID: 2X2U) (B) The dimeric model of the full-length extracellular region of RET in the apo-state based on the dimer in (A). (C) The co-receptor binding interface overlaps with the apo-RET dimer interface. The two protomers in the RET dimer are shown in surface (cyan) and cartoon (blue) representations, respectively. GFRAL (green) bound to RET in cyan clashes with RET in blue, suggesting that binding of GFRAL can disrupt the dimer of apo-RET. (D) 2D class averages of RET in the apo-state. (E), Analysis of the oligomerization state of the apo-RET extracellular region by AUC. The peak with the sedimentation coefficient of 4.8 S corresponds to the RET monomer. Wild-type RET also contains another species with the sedimentation coefficient of ~ 7–9 S, suggesting higher-order oligomerization. The R77E/R144E mutant ran predominately as a monomer.
Figure 7

A multi-state model of RET regulation on the cell surface.
RET, the co-receptor and ligand are colored cyan, green and yellow, respectively. ‘Y’ and ‘P’ represent unphosphorylated and phosphorylated tyrosine residues, respectively.
Videos
Video 1
The assembly of the NRTN/GFRα2/RET 2:2:2 and 4:4:4 complexes.
https://doi.org/10.7554/eLife.47650.015Tables
Key resources table
| Reagent type (species) or resource | Designation | Source or reference | Identifiers | Additional information |
|---|---|---|---|---|
| Antibody | Mouse monoclonal anti-Myc tag | Cell Signaling Technology | Cat# 2276S; RRID: AB_331783 | Dilution 1:1000 |
| Antibody | Rabbit monoclonal anti-p44/42 MAPK (Erk1/2) | Cell Signaling Technology | Cat# 4695; RRID: AB_390779 | Dilution 1:1000 |
| Antibody | Rabbit monoclonal anti-Phospho-p44/42 MAPK (Erk1/2) (Thr202/Tyr204) | Cell Signaling Technology | Cat# 4370; RRID: AB_2315112 | Dilution 1:1000 |
| Antibody | Rabbit monoclonal anti-EEA1(C45B10) | Cell Signaling Technology | Cat# 3288; RRID: AB_2096811 | Dilution 1:1000 |
| Antibody | Goat anti-Mouse IgG H and L (HRP) | Invitrogen | Cat# 31430 | Dilution 1:1000 |
| Antibody | Goat anti-Rabbit IgG H and L (HRP) | Abcam | Cat# ab6721; RRID: AB_955447 | Dilution 1:1000 |
| Antibody | Goat anti-Rabbit IgG H and L (Alexa Fluor 488) | Invitrogen | Cat# A-11034 | Dilution 1:1000 |
| Cell line (Homo sapiens) | FreeStyle 293 F | Invitrogen | Cat#R79007 | |
| Cell line (Homo sapiens) | HEK293S GnTI- | ATCC | Cat#CRL-3022; RRID: CVCL_A785 | |
| Cell line (Homo sapiens) | HEK293 | ATCC | Cat# PTA-4488, RRID: CVCL_0045 | |
| Cell line (Homo sapiens) | HEK293T | ATCC | Cat#CRL-3216; RRID: CVCL_0063 | |
| Cell line (Cercopithecus aethiops) | COS-7 | ATCC | Cat# CRL-1651, RRID: CVCL_0224 | |
| Strain, strain background (Escherichia coli) | E. coli BL21(DE3) | New England Biolabs | Cat# C2527 | |
| Strain, strain background (Escherichia coli) | XL10-Gold Ultracompetent Cells | Agilent | Cat# 200315 | |
| Strain, strain background (Escherichia coli) | MAX Efficiency DH10Bac Competent Cells | Invitrogen | Cat# 10361012 | |
| Chemical compound, drug | isopropyl b-D-thiogalatopyranoside (IPTG) | Fisher Scientific | Cat# BP1620-10 | |
| Chemical compound, drug | Imidazole | Sigma-Aldrich | Cat# I5513 | |
| Chemical compound, drug | L-Arginine | Sigma-Aldrich | Cat# A5006 | |
| Chemical compound, drug | L(-)-Glutathione, oxidized | ACROS Organics | Cat# AC320220050 | |
| Chemical compound, drug | Guanidine-HCl | Thermo Scientific | Cat# 24110 | |
| Chemical compound, drug | L-Glutathione reduced | Sigma-Aldrich | Cat# G4251 | |
| Chemical compound, drug | Urea | RPI | Cat# U20200 | |
| Chemical compound, drug | Puromycin | InvivoGen | Cat# ant-pr-1 | |
| Chemical Compound, drug | Blasticidin | InvivoGen | Cat# ant-bl-1 | |
| Chemical compound, drug | Antibiotic Antimycotic Solution (100×) | Sigma-Aldrich | Cat# A5955 | |
| Chemical compound, drug | Cellfectin II Reagent | Gibco | Cat# 10362100 | |
| Chemical compound, drug | Sodium Butyrate | Sigma-Aldrich | Cat# 303410 | |
| Chemical compound, drug | Halt Protease and Phosphatase Inhibitor Cocktail (100X) | Thermo Scientific | Cat# 78442 | |
| Chemical compound, drug | SuperSignal West Dura Extended Duration Substrate | Thermo Scientific | Cat# 34075 | |
| Chemical compound, drug | DAPI (4',6-Diamidino-2-Phenylindole, Dihydrochloride) | Invitrogen | Cat# D1306 | |
| Chemical compound, drug | Alexa Fluor 555 NHS Ester | Invitrogen | Cat# A20009 | |
| Transfected construct (Homo sapiens) | pEZT-BM vector | Ryan Hibbs Lab | Addgene plasmid # 74099 | |
| Transfected construct (Homo sapiens) | pEZT-RET-ECD-His | This paper | Materials and methods subsection: Protein expression and purification | |
| Transfected construct (Homo sapiens) | pEZT-GFRAL-ECD-His | This paper | Materials and methods subsection: Protein expression and purification | |
| Transfected construct (Homo sapiens) | pEZT-GFRA1-ECD-His | This paper | Materials and methods subsection: Protein expression and purification | |
| Transfected construct (Homo sapiens) | pEZT-GFRA2-ECD-His | This paper | Materials and methods subsection: Protein expression and purification | |
| Transfected construct (Homo sapiens) | pEZT-GFRA3-ECD-His | This paper | Materials and methods subsection: Protein expression and purification | |
| Transfected construct (Escherichia coli) | pET-28a vector | Novagen | Millipore Cat# 69864 | |
| Transfected construct (Escherichia coli) | pET-15b vector | Novagen | Millipore Cat# 69661 | |
| Transfected construct (Escherichia coli) | pET-28a-GDF15-WT | This paper | Materials and methods subsection: Protein expression and purification | |
| Transfected construct (Escherichia coli) | pET-28a-GDF15-W228E | This paper | Materials and methods subsection: Protein expression and purification | |
| Transfected construct (Escherichia coli) | pET-28a-GDF15-Y297E | This paper | Materials and methods subsection: Protein expression and purification | |
| Transfected construct (Escherichia coli) | pET-28a-sumo-NRTN-WT | This paper | Materials and methods subsection: Protein expression and purification | |
| Transfected construct (Escherichia coli) | pET-28a-sumo-NRTN-R101E/R155E | This paper | Materials and methods subsection: Protein expression and purification | |
| Transfected construct (Escherichia coli) | pET-15b-GDNF-WT | This paper | Materials and methods subsection: Protein expression and purification | |
| Transfected construct (Escherichia coli) | pET-28a-sumo- ARTN-WT | This paper | Materials and methods subsection: Protein expression and purification | |
| Transfected construct (Homo sapiens) | pLVX-IRES-Puro | Clontech | Cat#632183 | |
| Transfected construct (Homo sapiens) | pLVX-RET-myc-IRES-Puro | This paper | Materials and methods subsection: Cell-based phosphorylation assay for RET | |
| Transfected construct (Homo sapiens) | pLVX-myc-GFRAL-WT-IRES-Blast | This paper | Materials and methods subsection: Cell-based phosphorylation assay for RET | |
| Transfected construct (Homo sapiens) | pLVX-myc-GFRAL-T261R-IRES-Blast | This paper | Materials and methods subsection: Cell-based phosphorylation assay for RET | |
| Transfected construct (Homo sapiens) | pLVX-GFRA2-IRES-Blast | This paper | Materials and methods subsection: Cell-based phosphorylation assay for RET | |
| Software, algorithm | MotionCorr2 | Zheng et al., 2017 | http://msg.ucsf.edu/em/software/motioncor2.html | |
| Software, algorithm | GCTF | Zhang, 2016 | https://www.mrc-lmb. cam.ac.uk/kzhang/Gctf/ | |
| Software, algorithm | EMAN2 | Tang et al., 2007 | https://blake.bcm.edu/ emanwiki/EMAN2 | |
| Software, algorithm | RELION | Scheres, 2012b | https://www3.mrc-lmb. cam.ac.uk/relion/index.php/Download_%26_install | |
| Software, algorithm | Coot | Emsley et al., 2010 | https://www2.mrc-lmb.cam. ac.uk/personal/pemsley/coot/ | |
| Software, algorithm | Phenix.refine | Afonine et al., 2018 | https://www.phenix-online. org/documentation/reference/refinement.html | |
| Software, algorithm | Graphpad prism 7.04 | Graphpad | https://www.graphpad.com/ scientific-software/prism/ | |
| Software, algorithm | Fiji | Schindelin et al., 2012 | https://imagej.net/Fiji | |
| Software, algorithm | μManager | Open Imaging | https://micro-manager.org/ | |
| Software, algorithm | SEDFIT | Schuck, 2000 | http://www.analyticalult racentrifugation.com/download.htm | |
| Software, algorithm | REDATE | Zhao et al., 2013 | http://biophysics.swmed.edu/ MBR/software.html | |
| Software, algorithm | GUSSI | Brautigam, 2015 | http://biophysics.swmed.edu/MBR/software.html | |
| Other | Ni Sepharose 6 Fast Flow | GE Healthcare | Cat# 17531802 | |
| Other | Strep-TactinXT Superflow | IBA Lifesciences | Cat# 2-4010-025 | |
| Other | Superdex 200 Increase 10/300 GL | GE Healthcare | Cat# 28990944 | |
| Other | Bolt 4–12% Bis-Tris Plus Gels, 10-well | Invitrogen | Cat# NW04120BOX |
Table 1
Cryo-EM data collection and model statistics.
https://doi.org/10.7554/eLife.47650.020| GDF15/GFRAL /RET | GDNF/GFRα1/RET | NRTN/GFRα2/RET | ARTN/GFRα3/RET | |
|---|---|---|---|---|
| Data collection and processing | ||||
| Magnification | 46,730 | 46,730 | 46,730 | 46,730 |
| Voltage (kV) | 300 | 300 | 300 | 300 |
| Electron exposure (e-/Å2) | 50 | 50 | 50 | 50 |
| Defocus range (µm) | 1.6–3 | 1.6–3 | 1.6–3 | 1.6–3 |
| Pixel size (Å) | 1.07 | 1.07 | 1.07 | 1.07 |
| Final particle number | 520,480 | 37,098 | 247,157 | 114,344 |
| Map resolution (Å) | 3.7 | 4.4 | 3.4 | 3.5 |
| Map Sharpening B factor | −190 | −200 | −140 | −140 |
| Model Refinement Rms deviations Bonds (Å) Angles (°) Validation Molprobity score Clashscore Rotamer outliers (%) Ramachandran plot Favored (%) Allowed (%) Outliers (%) | 0.006 0.978 1.59 4.43 0.12 94.6 5.3 0.1 | 0.005 0.994 2.02 8.53 0.41 89.5 10.4 0.1 | 0.005 0.797 1.45 2.74 0 94.2 5.8 0 | 0.007 1.040 1.73 4.35 0.12 91.1 8.9 0 |
Additional files
-
Supplementary file 1
The sequences of the proteins used in this work.
- https://doi.org/10.7554/eLife.47650.021
-
Transparent reporting form
- https://doi.org/10.7554/eLife.47650.022
Download links
A two-part list of links to download the article, or parts of the article, in various formats.
Downloads (link to download the article as PDF)
Open citations (links to open the citations from this article in various online reference manager services)
Cite this article (links to download the citations from this article in formats compatible with various reference manager tools)
Cryo-EM analyses reveal the common mechanism and diversification in the activation of RET by different ligands
eLife 8:e47650.
https://doi.org/10.7554/eLife.47650


