ASPEN, a methodology for reconstructing protein evolution with improved accuracy using ensemble models
- Washington University, United States
- University of Massachusetts, United States
- University of Virginia, United States
Figures
Figure 1 with 1 supplement
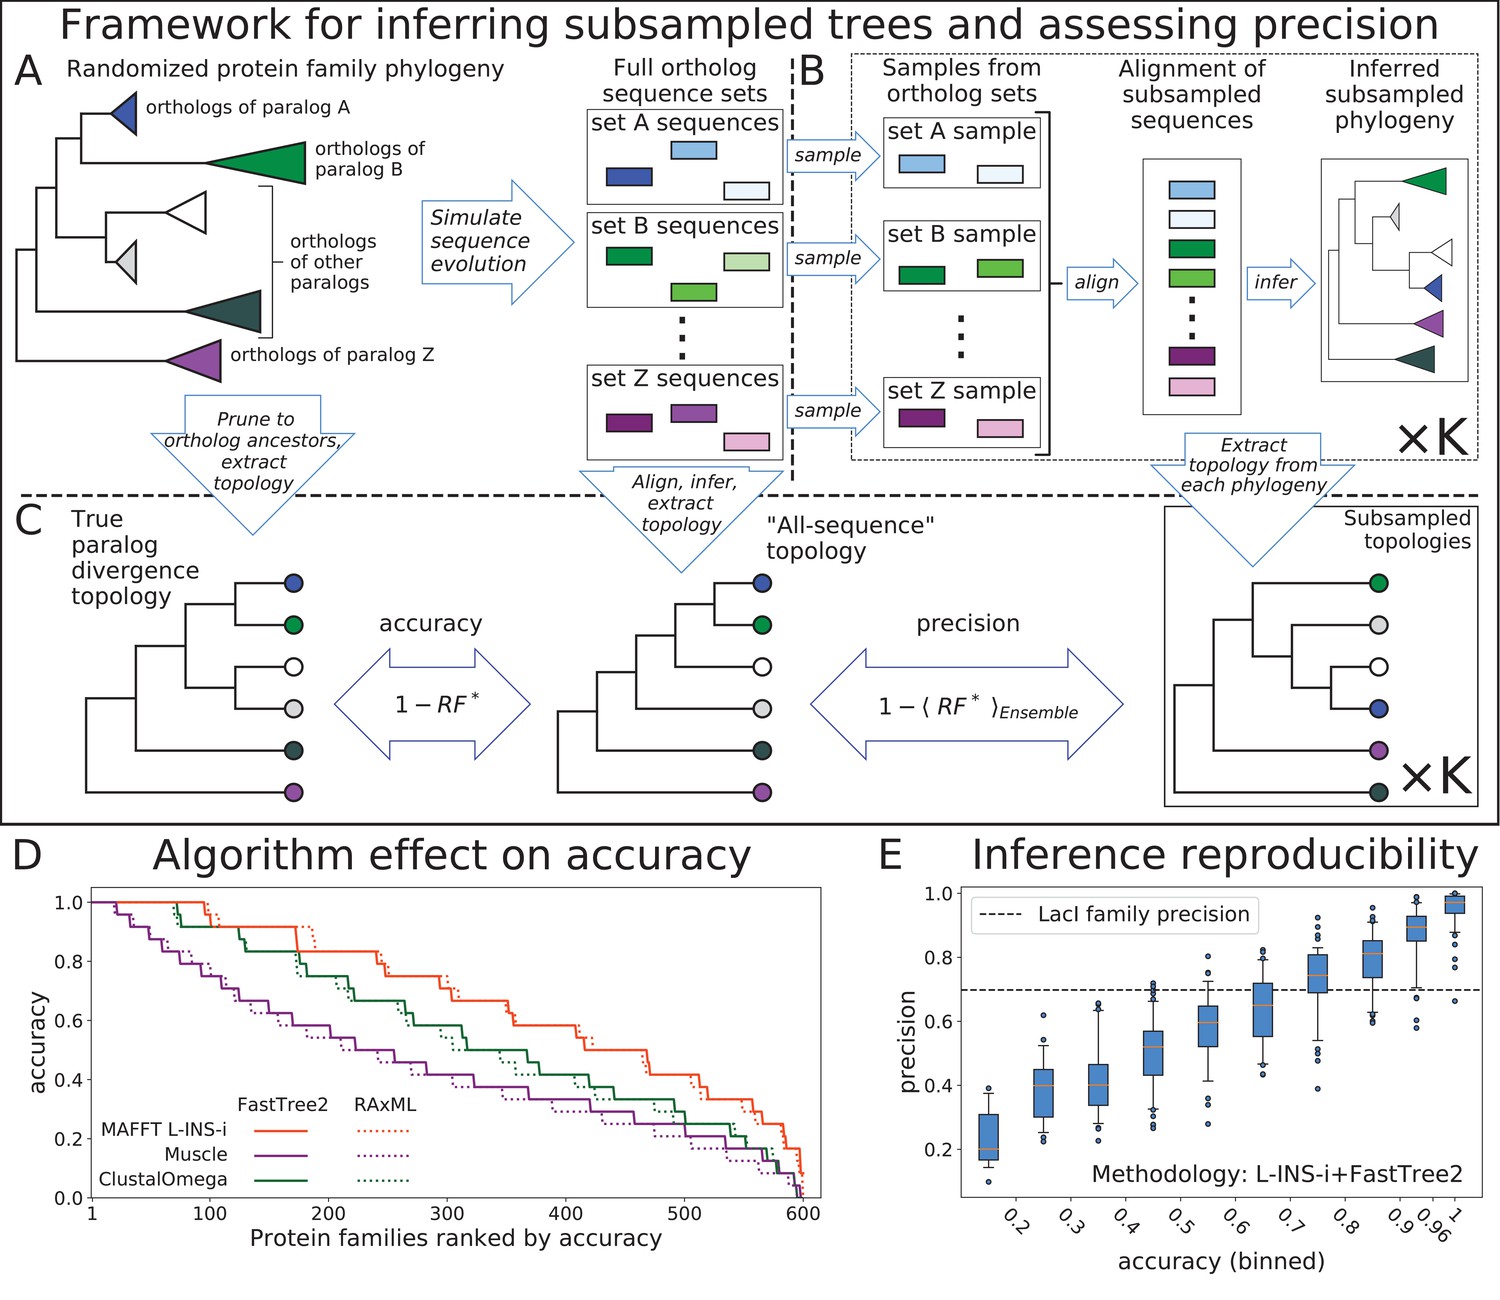
Top: Framework for assessing accuracy and precision of reconstruction for simulated protein families using an ensemble of subsampled topologies.
(A) Sequence evolution was simulated over synthetic phylogenies to produce ortholog sequences (colored boxes), presenting sets of ortholog sequences ("orthosets''). (B) Sequences were sampled from orthosets without replacement, aligned, and used to infer "subsampled'' phylogenies. (C) An all-sequence phylogeny was inferred from an alignment of all sequences in a simulated family. The true, all-sequence, and subsampled phylogenies were pruned to orthoset common ancestors. Their branch lengths were discarded to obtain paralog divergence topologies. Modified Robinson-Foulds () symmetric distance metric was calculated between the true and all-sequence topologies and between the all-sequence and each subsampled topology. Accuracy and precision of reconstruction for a family are defined in terms of these distances. Bottom: (D) The 600 simulated families are ranked by their all-sequence topology accuracy and plotted according to the alignment and phylogeny inference algorithms used to infer the all-sequence phylogeny. (E) Reconstruction precision vs. accuracy of the all sequence topology for simulated families Pearson correlation coefficient between precision and accuracy is 0.91 (p-value < 1e-100). Families are binned by accuracy. Tick marks on x-axis indicate bin boundaries. Dashed line indicates precision of LacI family reconstruction.
-
Figure 1—source data 1
Precision and Accuracy for synthetic protein families.
- https://doi.org/10.7554/eLife.47676.005
-
Figure 1—source data 2
Accuracy of synthetic families for all alignment and inference procedures.
- https://doi.org/10.7554/eLife.47676.006
Figure 1—figure supplement 1
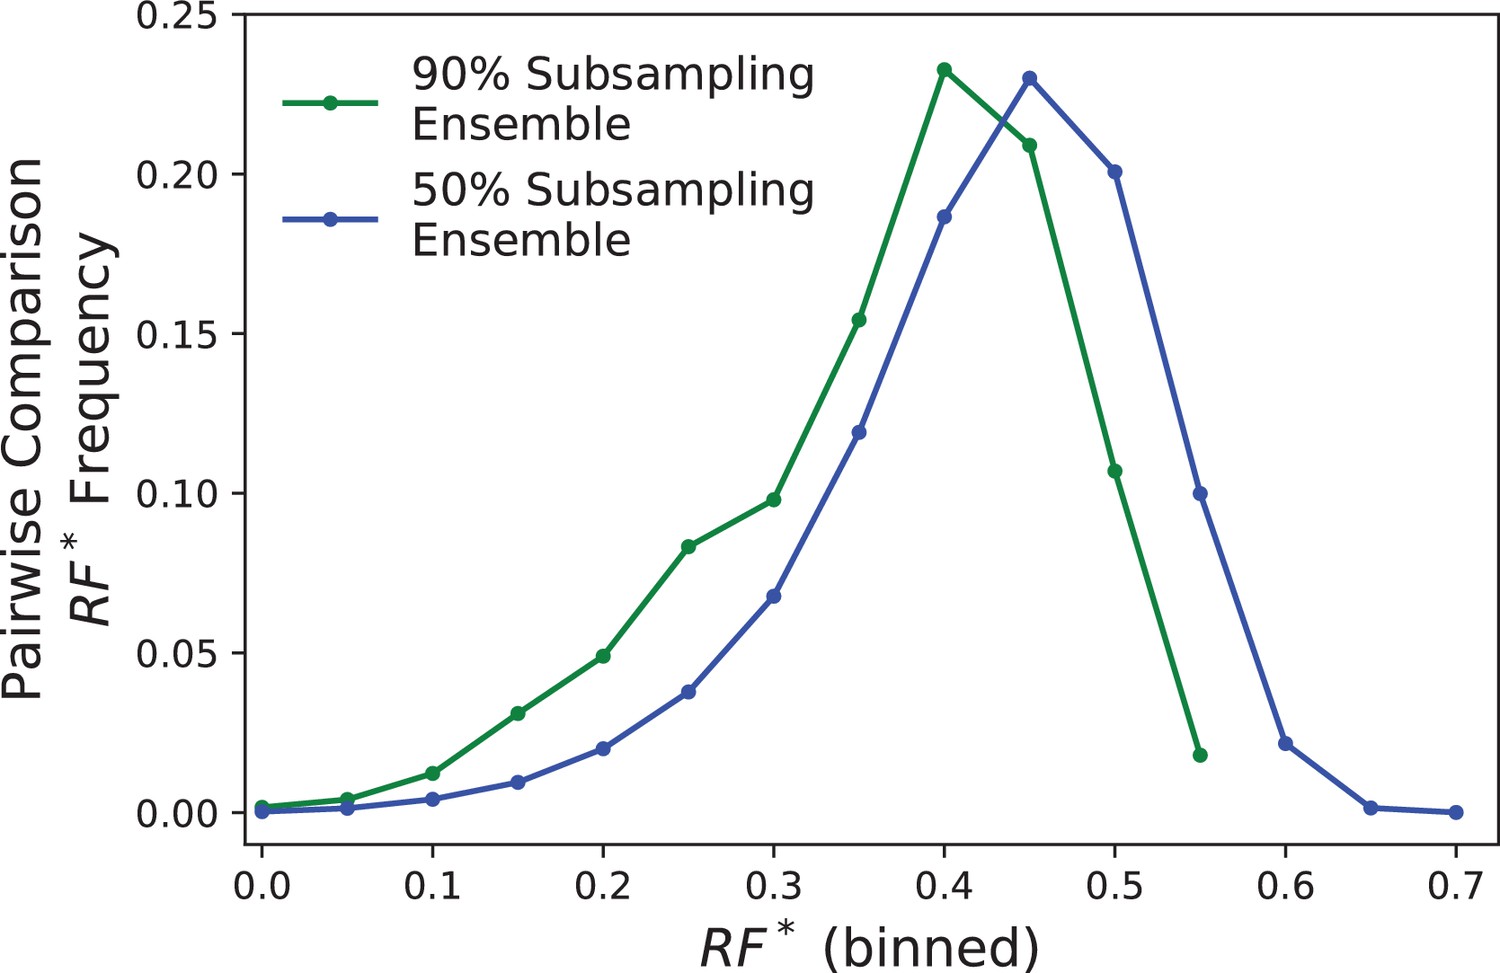
Distributions of pairwise differences between LacI topologies in the 90% (green) and 50% (blue) subsampling ensembles.
https://doi.org/10.7554/eLife.47676.004-
Figure 1—figure supplement 1—source data 1
Pairwise RF* distributions of LacI topologies.
- https://doi.org/10.7554/eLife.47676.003
Figure 2 with 1 supplement
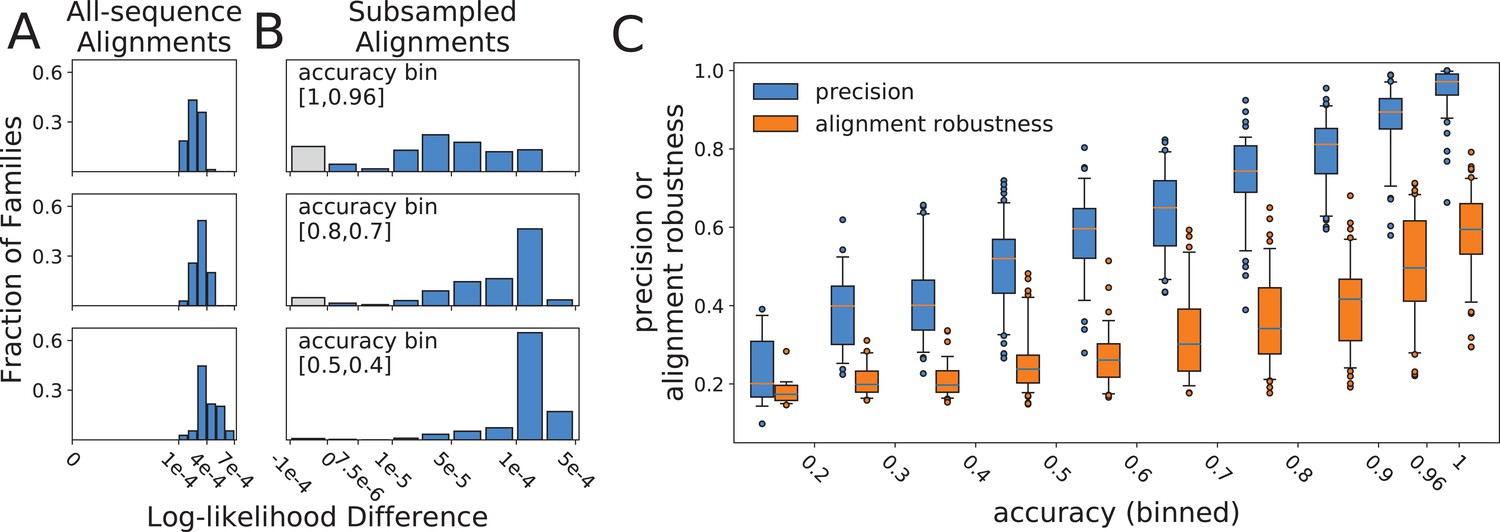
Histograms of log-likelihood differences (calculated using RAxML) between true and all-sequence (reference) topologies, calculated over all-sequence alignments
(A), and between all-sequence and subsampled (reference) topologies, calculated over subsampled alignments (B). Rows present subsampled and all-sequence results for different accuracy bins. Gray bars represent negative difference values in cases where the alternative topology has a higher RAxML log-likelihood than the topology inferred with FastTree2. These small differences are more likely due to differences between the RAxML and FastTree2 likelihood functions, rather than to topology search failures by FastTree2. (C) Relationship between alignment robustness, quantified by the Guidance2 sum-of-pairs score, and topology accuracy. Alignment accuracy and alignment robustness are 97% correlated, so the relationships of both quantities with topology accuracy are nearly identical. Topology precision is also plotted vs topology accuracy for comparison. Alignment robustness and topology accuracy have a Pearson correlation coefficient of 0.78, while topology precision and topology accuracy have a Pearson correlation coefficient of 0.91.
-
Figure 2—source data 1
Precision and Alignment Robustness data for all protein families.
- https://doi.org/10.7554/eLife.47676.010
Figure 2—figure supplement 1
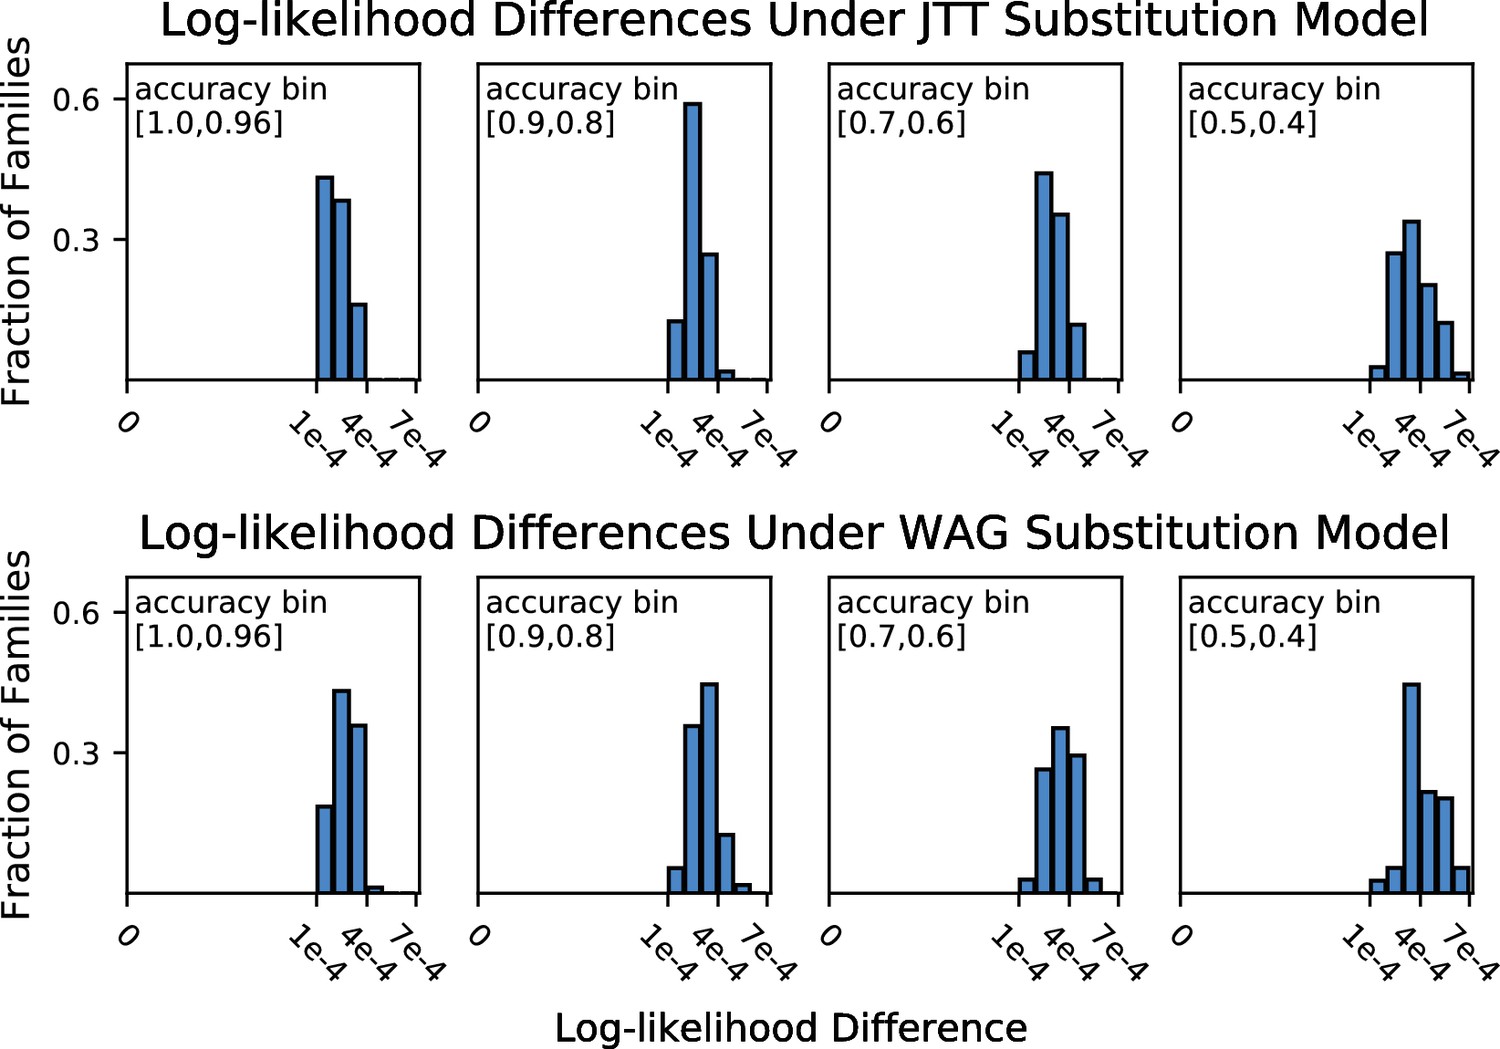
Histograms of log-likelihood differences between true and all-sequence (reference) topologies, calculated over all-sequence alignments under the JTT (top panel) and WAG (bottom panel) substitution models.
https://doi.org/10.7554/eLife.47676.009-
Figure 2—figure supplement 1—source data 1
Log-likelihood differences between true and all-sequence topologies.
- https://doi.org/10.7554/eLife.47676.008
Figure 3 with 1 supplement
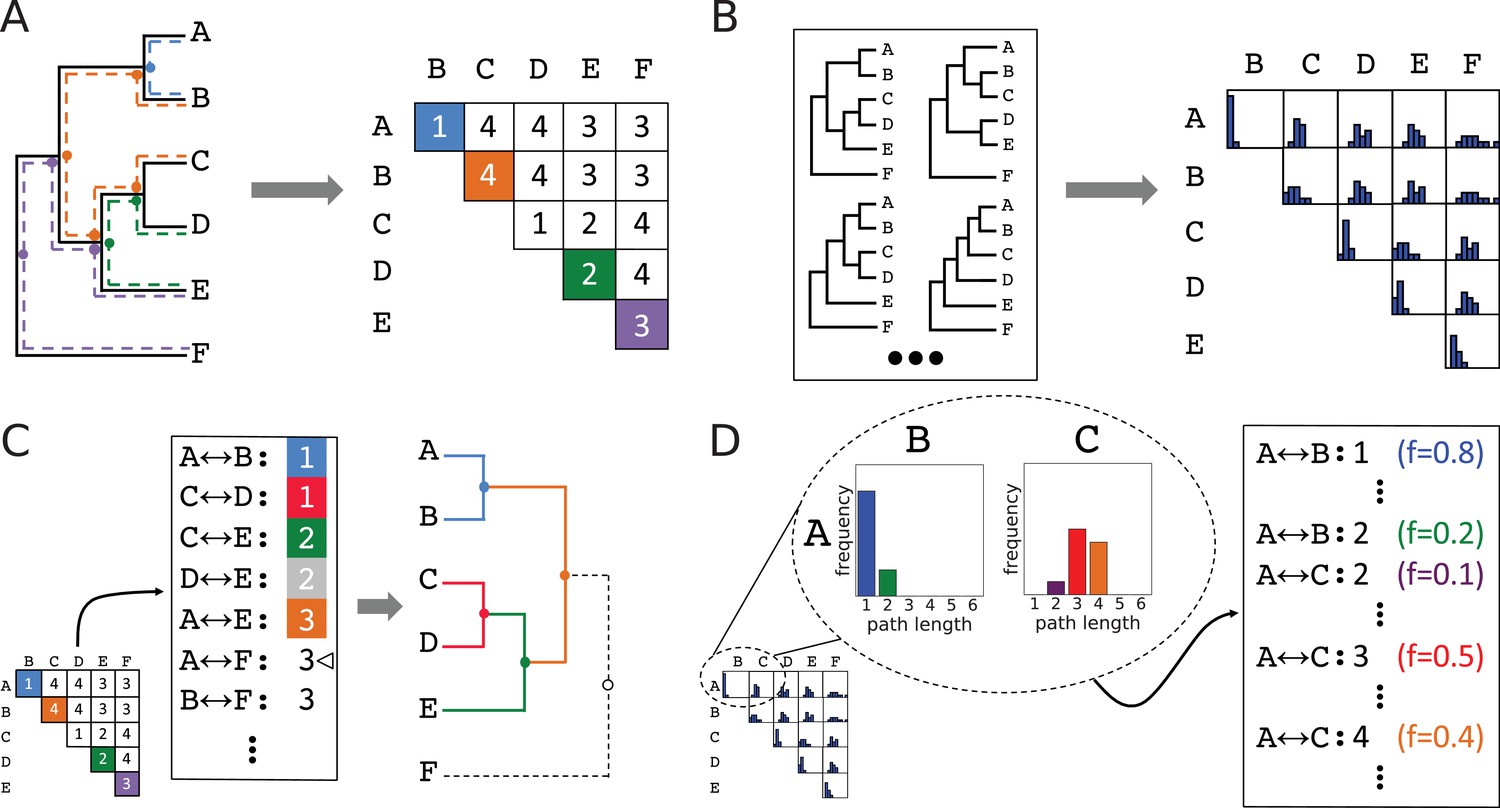
Method for accumulating distributions of observations by interconverting between topologies and leaf-leaf distance matrices.
(A) Conversion of a topology into a matrix of leaf-to-leaf path lengths. Sample paths , blue, , green, , violet, and , orange, are highlighted. Dots indicate internal nodes along path. (B) Each topology in an ensemble is decomposed into a matrix of leaf-to-leaf path lengths. Observed path lengths for each leaf pair are aggregated into distributions, which are used as weights by ASPEN’s log-frequency scoring function. (C) Construction of a topology from its matrix of path lengths representation. First, the matrix is transformed into a sorted list of path lengths. Construction of internal nodes is triggered by path lengths encountered traversing the list. Cursor indicates path being recapitulated by construction of node . (D) The path lengths distribution for each leaf pair produces as many list entries as there were path lengths observed between those leaves. Each path length for each leaf pair has a corresponding observation frequency. These frequencies are used in the scoring function to rank reconstructed topologies.
Figure 3—figure supplement 1
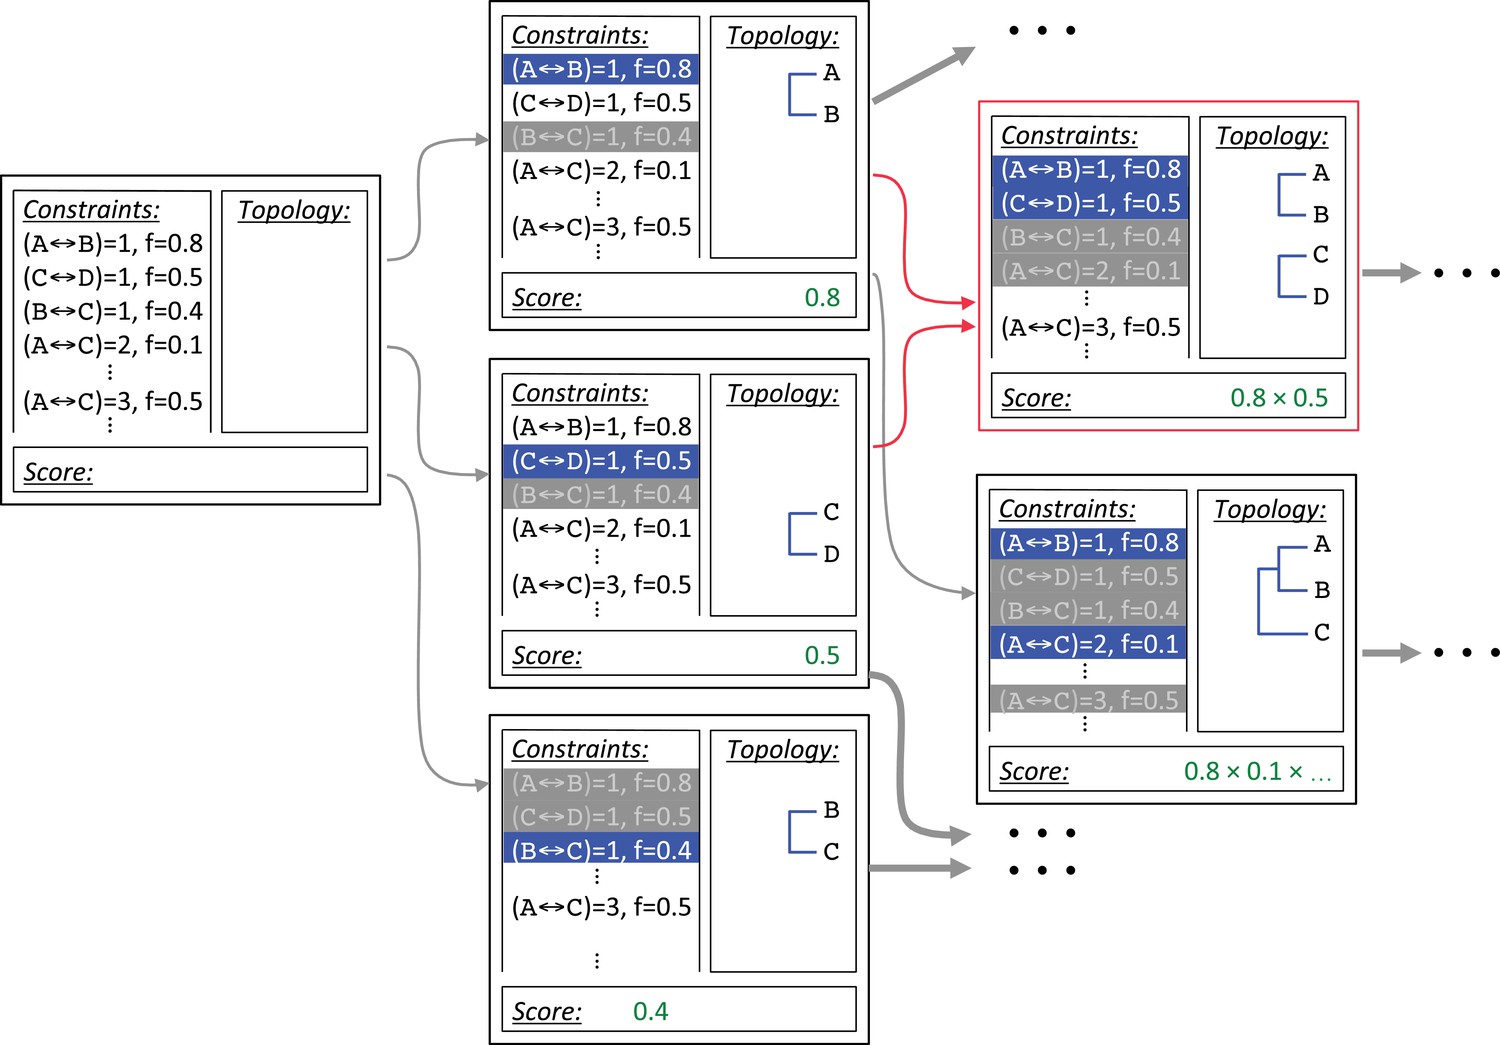
Diagram of branching during ASPEN topology reconstruction.
Construction begins with the empty topology assembly on the left. Every possible extension is constructed in a copy of the initial assembly: Node completes path , node completes path , and node completes path , branching the initial assembly into three new assemblies. Path lengths completed by the introduced node and path lengths incompatible with it are marked and not revisited. Nodes and preclude path , while node precludes paths and . Completed paths are shown in blue, precluded paths are greyed out in the corresponding assemblies. Intermediate topology scores are calculated according to the scoring function. On the next iteration construction paths for assemblies and collide, indicated in red. A single copy of the resulting assembly, , is retained. Assembly is separately extended with node . Additional construction sequences, indicated by ellipses, are not shown.
Figure 4
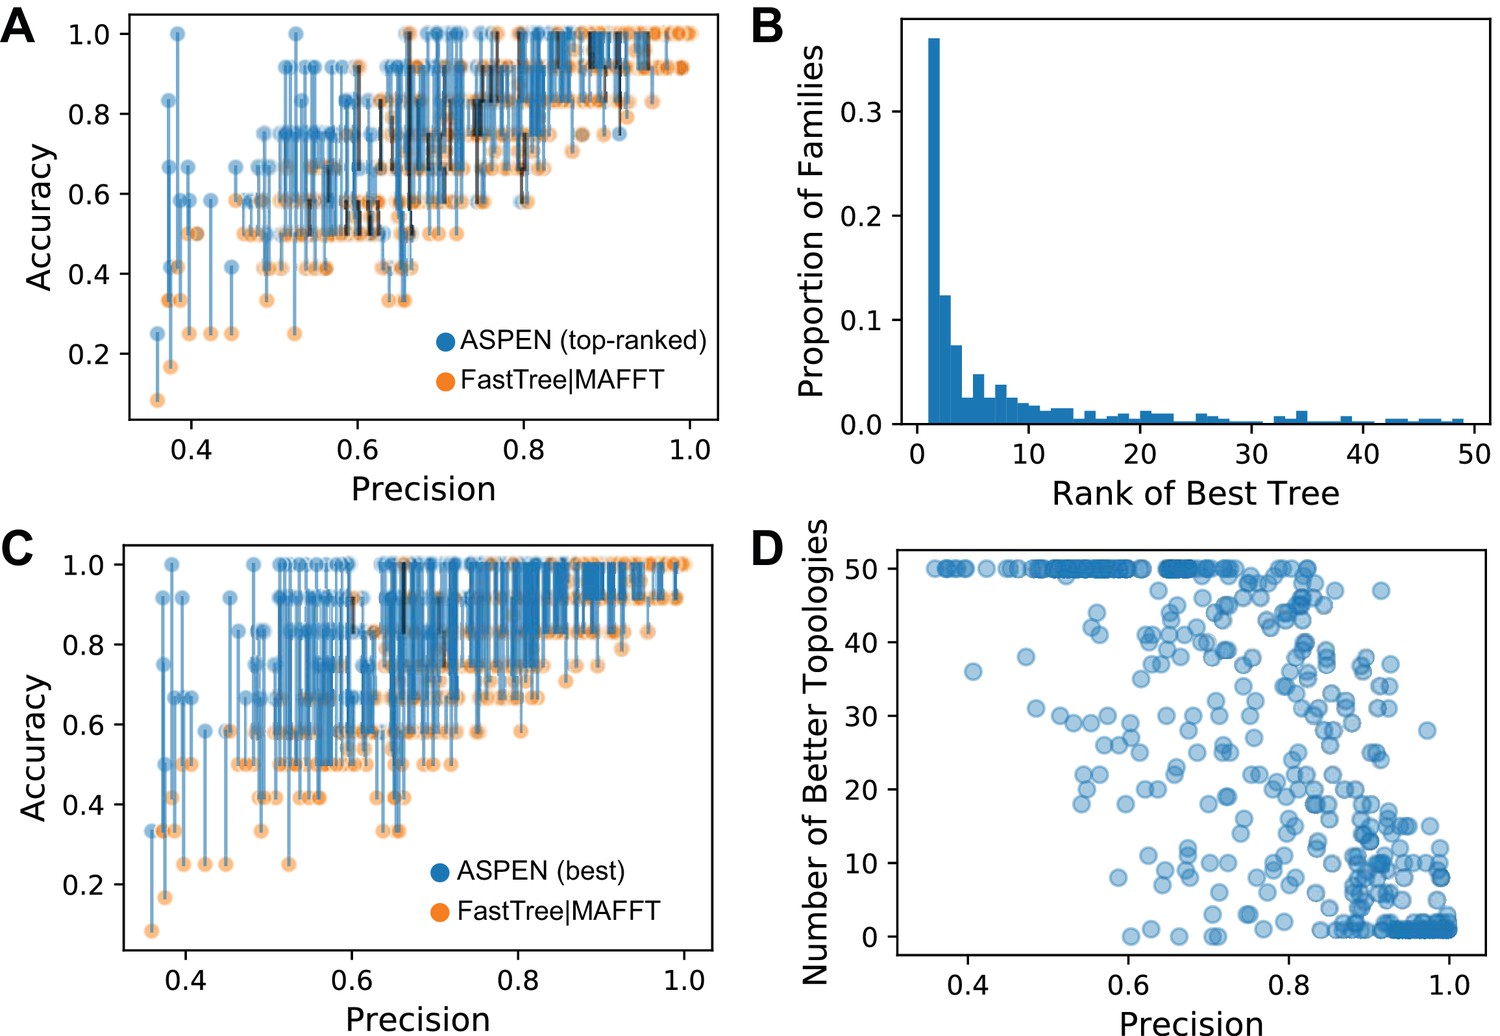
The accuracy of ASPEN models.
(A) Comparison of the accuracies of the all-sequence and top-ranked ASPEN topologies, arranged according to families’ precision values. The two accuracy values for each family are connected by a blue line if the ASPEN topology is more accurate than the all-sequence topology, by a black line if the all-sequence topology is more accurate, and no line if their accuracies are equal. (B) A histogram reflecting where the most accurate ASPEN topology falls among the top 50 ASPEN topologies for that family. (C) Comparison of the accuracies of the all-sequence and the most accurate topology among the top 50 of ASPEN topologies. Connections between the points have the same meaning as panel A. (D) The number of top-50 ASPEN topologies that are more accurate than the all-sequence topology for that family. Each circle represents a synthetic family.
-
Figure 4—source data 1
Accuracy, Precision, and Rankings of ASPEN topologies.
- https://doi.org/10.7554/eLife.47676.014
Figure 5
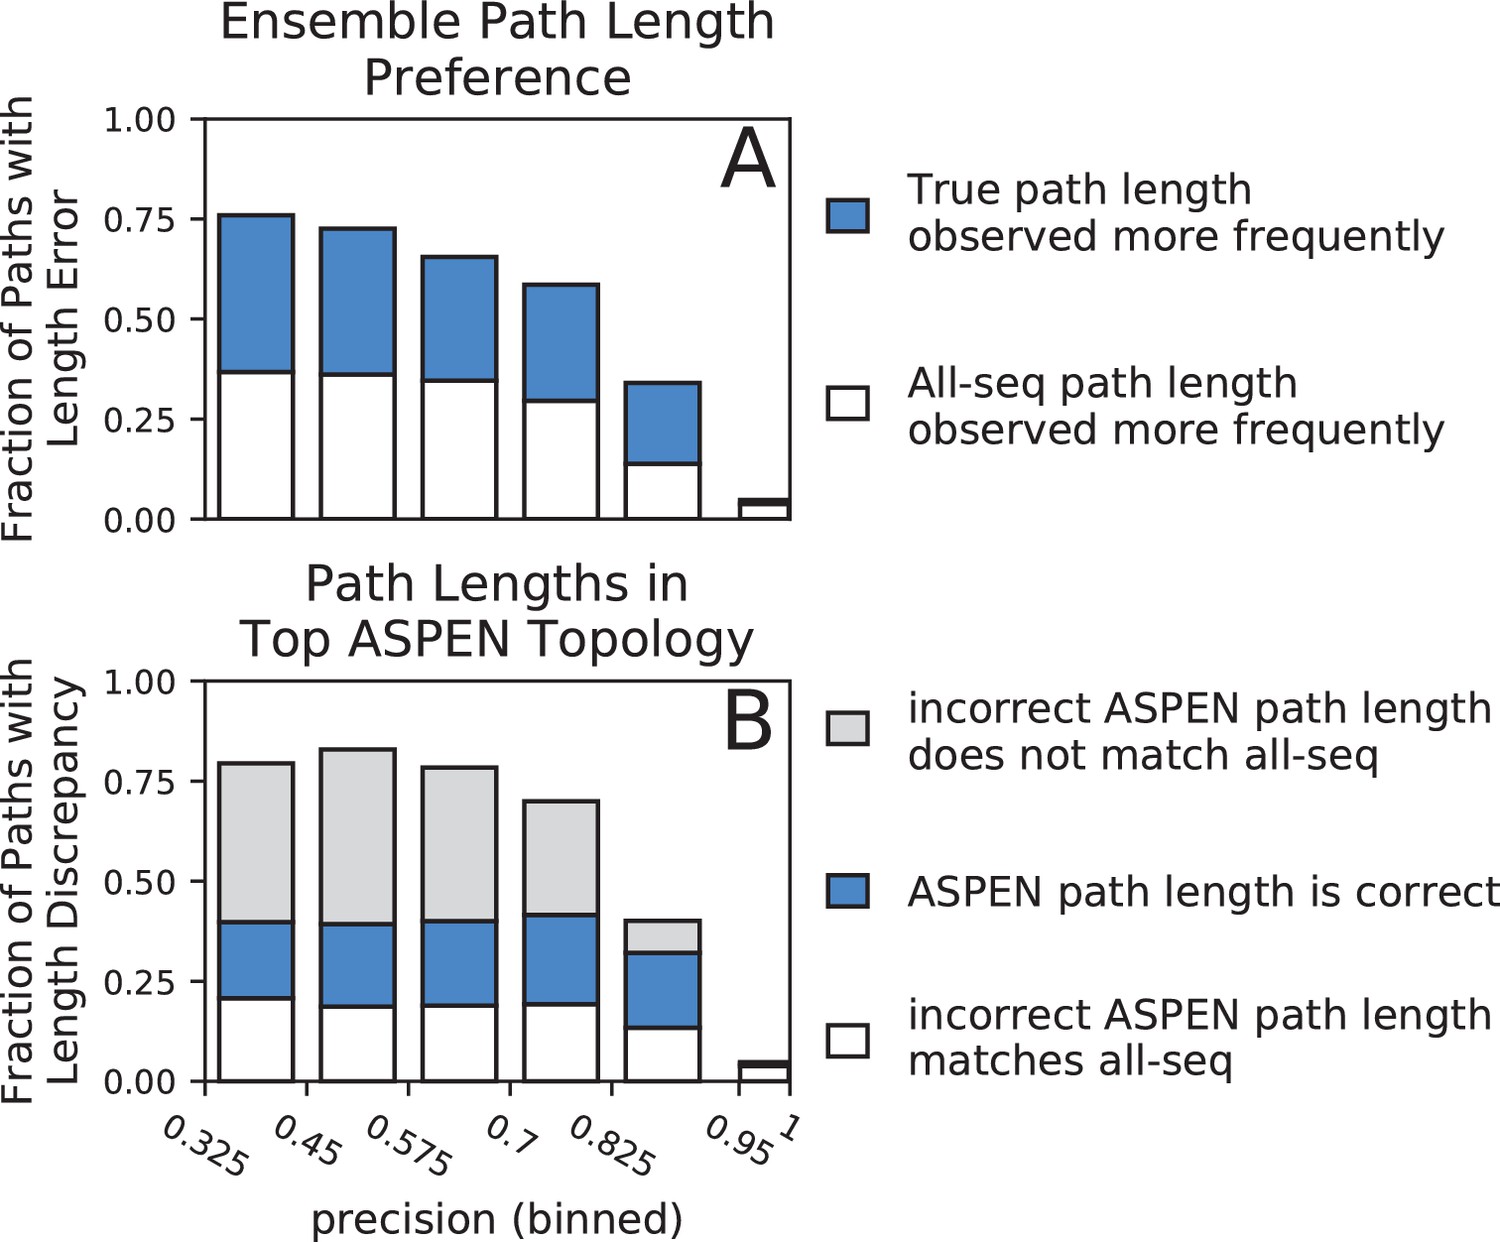
Accuracy of path lengths in the subsampled ensemble and the top ASPEN topology.
Synthetic families were binned by precision and path length data was aggregated from all families in a precision bin. (A) Total height of bar represents fraction of all paths across all families in precision bin with a length error (path length is incorrect in all-sequence topology). Blue fraction of bar represents paths for which the true length was observed more frequently across the ensemble. White fraction of bar represents paths for which the incorrect all-sequence length was observed more frequently across the ensemble. (B) Total height of bar represents fraction of all paths in bin with a length discrepancy (on which the true, all-sequence, and top ASPEN topology fail to agree). Blue fraction of bar represents paths with the correct length in the top ASPEN topology. White fraction of bar represents paths on the incorrect length of which the top ASPEN topology agrees with the all-sequence topology. Fraction of bar shaded gray represents paths of unique length in the top ASPEN topologies: incorrect length different from the length in the all-sequence topology.
-
Figure 5—source data 1
Path length differences.
- https://doi.org/10.7554/eLife.47676.016
Figure 6 with 1 supplement
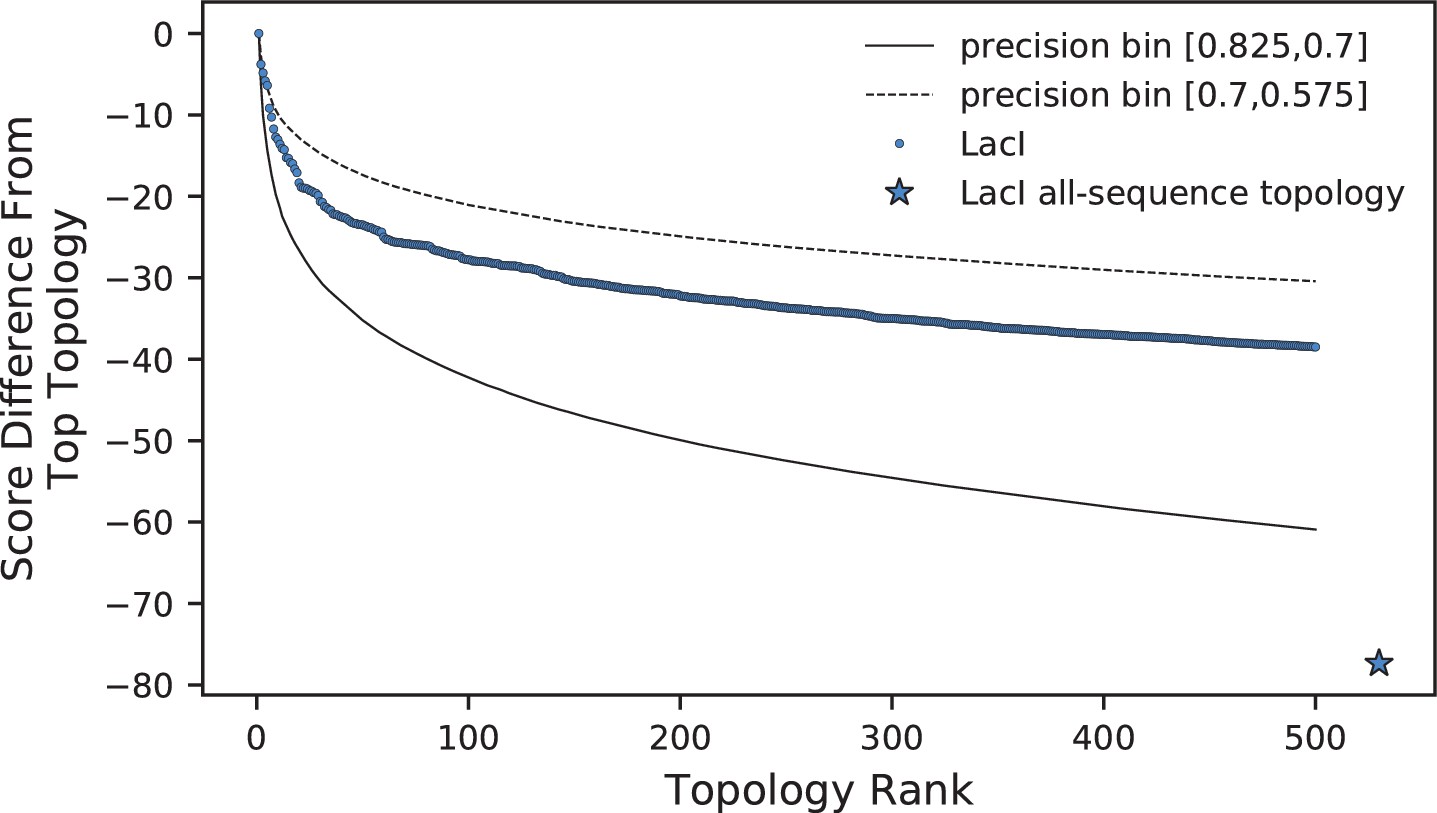
Comparison of log-frequency scores of the top 500 ASPEN topologies for LacI.
The difference between a topology’s score and the score of the best ASPEN topology is plotted as a function of topology rank. Bin-average score differences for simulated families from the two precision bins between which LacI falls are plotted for reference. Also plotted is the difference in score between the all-sequence topology of LacI and the top ASPEN topology.
-
Figure 6—source data 1
Differences in log-frequency score by rank.
- https://doi.org/10.7554/eLife.47676.019
Figure 6—figure supplement 1
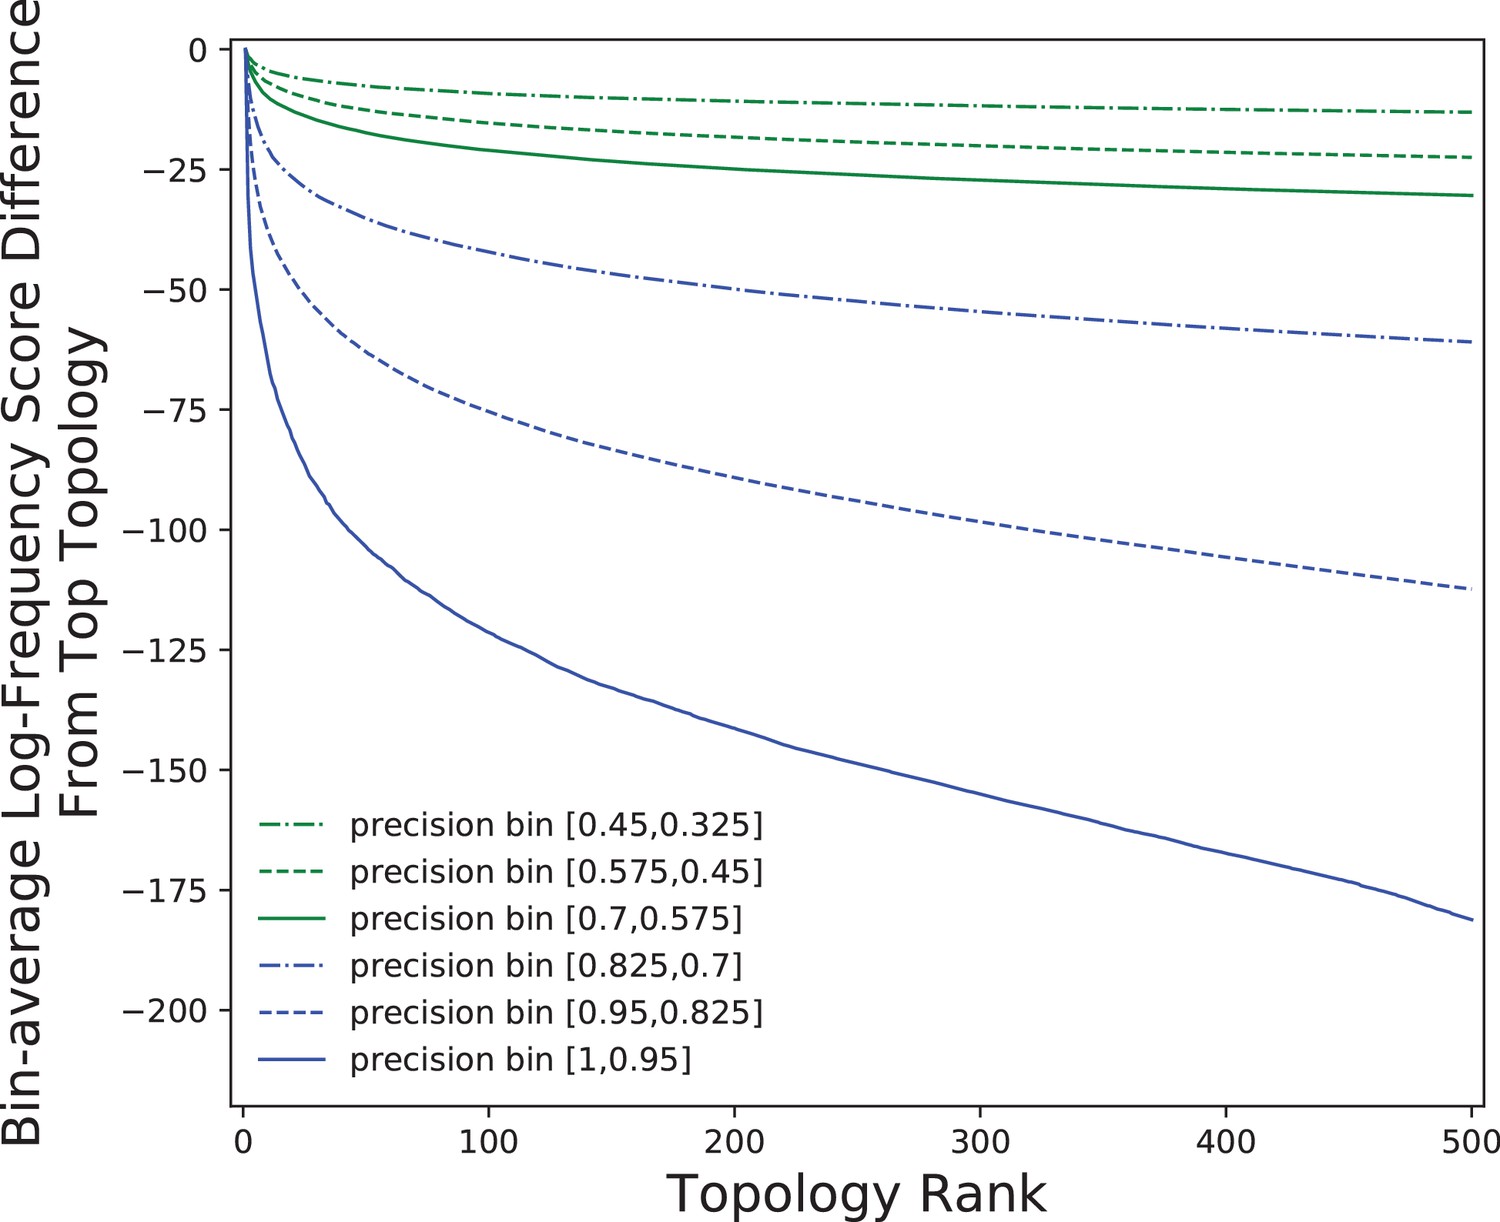
Dropoff in ASPEN log-frequency scores across precision bins.
Comparison of log-frequency scores of the top 500 ASPEN topologies for simulated families across six precision bins. The difference between a topology’s score and the score of the best ASPEN topology, averaged over all families in the bin, is plotted as a function of topology rank.
Figure 7
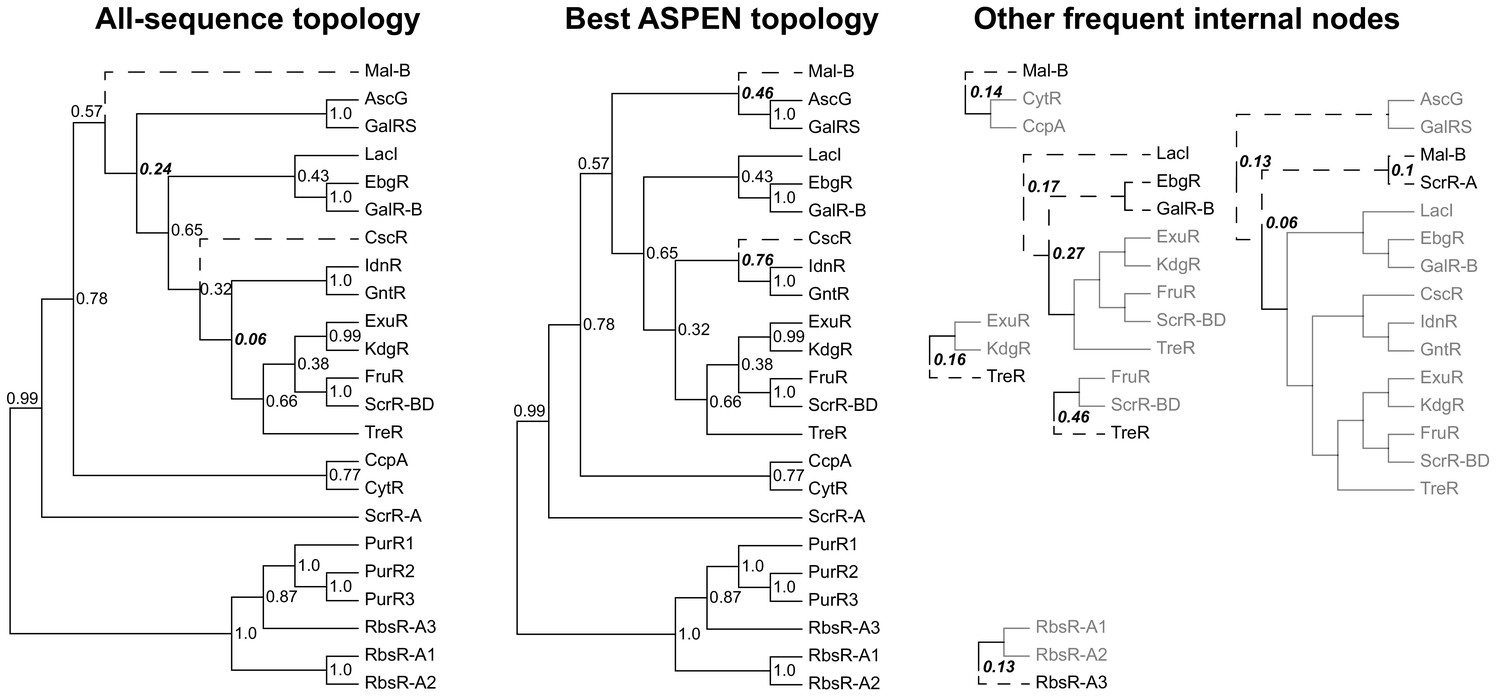
Reconstructed topologies for the LacI family.
Reconstructed nodes are annotated with the frequencies at which they were recapitulated among the 500 top-scoring topologies reconstructed by ASPEN as a way of summarizing ancestral nodes observed across the most likely trees. Subtrees on right represent reconstructed nodes observed with frequency ≥0.1 among the 500 ASPEN topologies, but not appearing in either the all-sequence or the best ASPEN topology. Branches placed differently in the all-sequence and best ASPEN topologies are shown as dashed lines, as are branches placed differently from either topology in the subtrees on the right. Observation frequencies for disagreeing splits are bolded and italicized.
Additional files
-
Supplementary file 1
1777 sequences from the LacI family, split among 23 orthosets, and the top 500 topologies reconstructed by ASPEN for the LacI family.
- https://doi.org/10.7554/eLife.47676.021
-
Transparent reporting form
- https://doi.org/10.7554/eLife.47676.022
Download links
A two-part list of links to download the article, or parts of the article, in various formats.
Downloads (link to download the article as PDF)
Open citations (links to open the citations from this article in various online reference manager services)
Cite this article (links to download the citations from this article in formats compatible with various reference manager tools)
ASPEN, a methodology for reconstructing protein evolution with improved accuracy using ensemble models
eLife 8:e47676.
https://doi.org/10.7554/eLife.47676


