Androgen-regulated transcription of ESRP2 drives alternative splicing patterns in prostate cancer
- University of Newcastle, United Kingdom
- University of Exeter, United Kingdom
- University of British Columbia, Canada
- Vancouver Prostate Centre, Canada
- Universidade de Lisboa, Portugal
- VIB, Belgium
- Ghent University, Belgium
- Newcastle University, United Kingdom
- Royal Devon and Exeter NHS Foundation Trust, United Kingdom
Figures
Figure 1 with 1 supplement
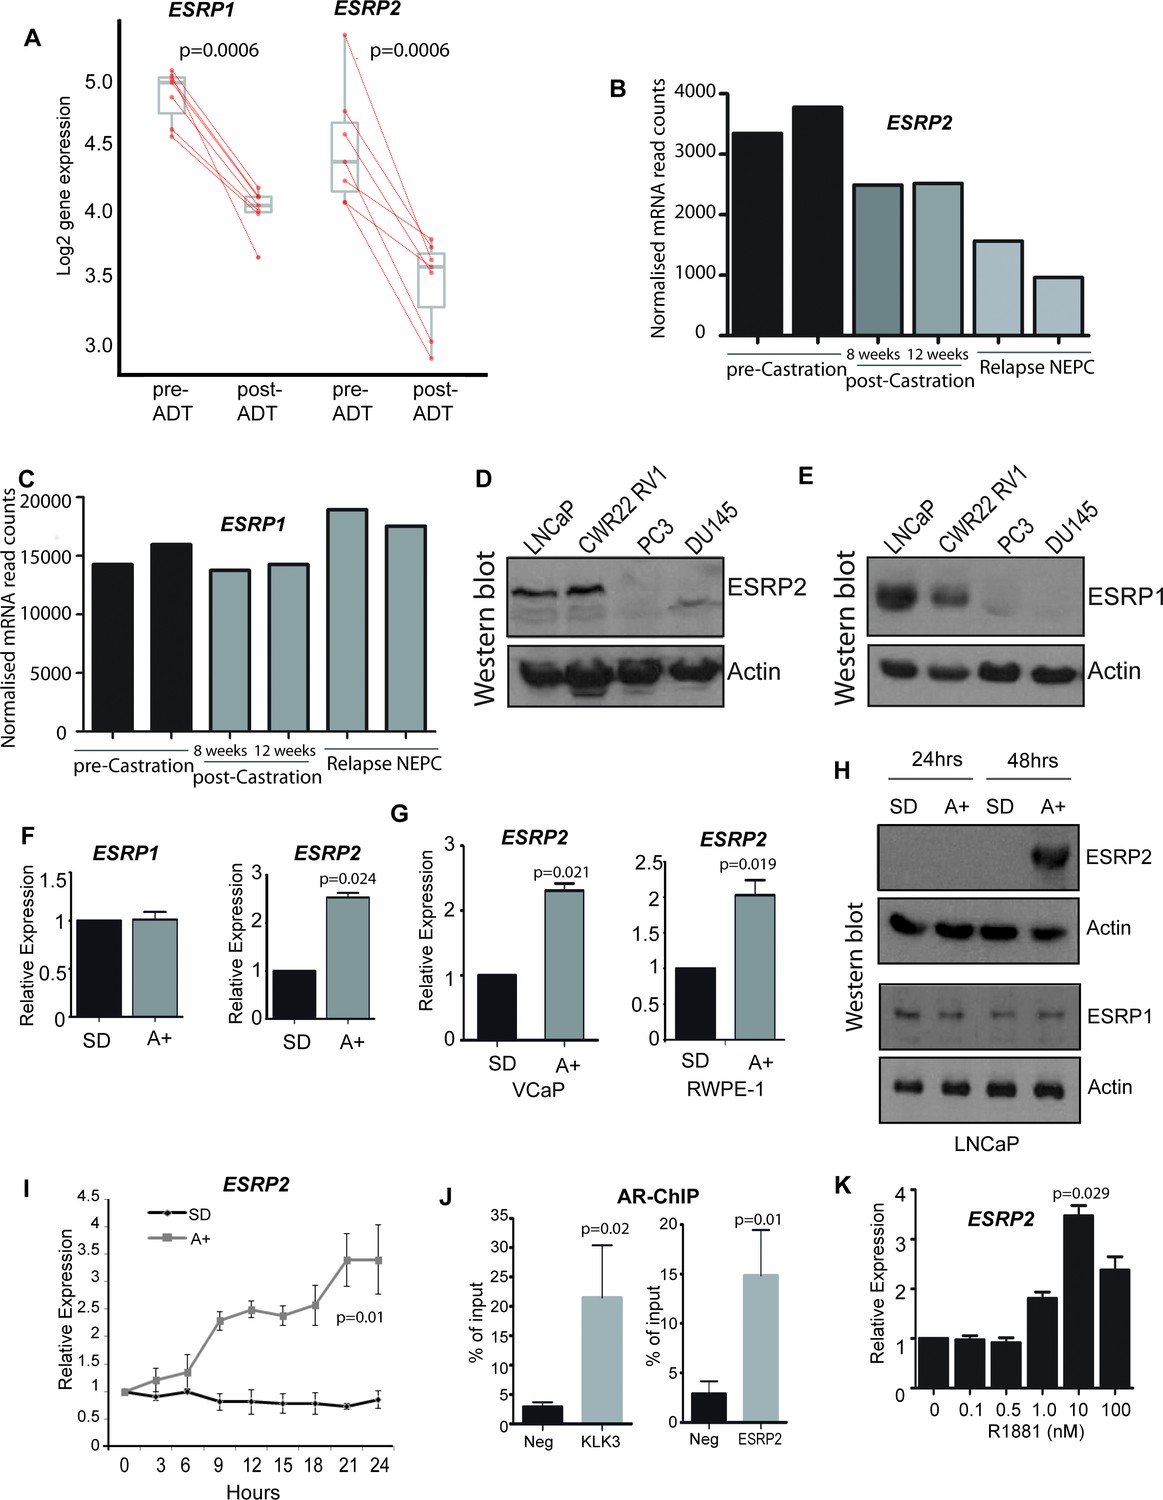
ESRP2 is a direct target for AR regulation in prostate cancer cells.
(A) Analysis of RNAseq data from human prostate cancer pre- and post- androgen deprivation therapy (ADT) (Chen et al., 2018; Rajan et al., 2014) shows that there is a significant downregulation of ESRP1 and ESRP2 mRNA following ADT in all seven patients tested (p=6e-04, Mann Whitney U test). (B–C) RNAseq data from LTL331 patient-derived xenografts grown in mice (Akamatsu et al., 2015) show a greater reduction in (B) ESRP2 mRNA levels following castration compared to (C) ESRP1 mRNA levels. (D) Western blot analysis of ESRP2 levels in a range of prostate cancer cell lines (actin was used as a loading control). (E) Western blot analysis of ESRP1 levels in prostate cancer cell lines. (F) Real-time PCR analysis of ESRP2 and ESRP1 mRNAs in LNCaP cells grown in steroid deplete (SD) or androgen (A+) treated conditions for 24 hr (statistical significance calculated by t test). (G) Real-time PCR analysis of ESRP2 mRNA in RWPE-1 cells grown in steroid deplete (SD) or androgen (A+) treated conditions for 24 hr. (H) Western blots analysis of ESRP1 and 2 protein in LNCaP cells treated with 10nm R1881 (androgens) for 24 and 48 hr. (I) Quantitative analysis (real-time PCR) of ESRP2 mRNA expression over a 24 hr time course following androgen exposure. (J) Real-time PCR analysis of AR-ChIP performed in LNCaP cells treated with 10nM R1881 for 24 hr revealed AR binding proximal to the ESRP2 gene. (K) Induction of ESRP2 is evident in LNCaP cells treated with R1881 concentrations between 1 to 100 nM (p value of 0.029 is for the comparison between 0 nm and 10nm R1881). Statistical significances were calculated by t tests, apart from (A) which used a Mann Whitney U test, and H which used Two-way ANOVA. Real time PCR analyses used at least three independent biological replicates (RNA prepared from separate samples), apart from the AR ChIP (panel I) for which each value shown is a mean of 3 technical replicates.
Figure 1—figure supplement 1

Confirmation of the specificity of antibodies against ESRP1 and ESRP2.
(A) Detection of ESRP1 and ESRP2 proteins in PC3 cells by Western blot. Note that both specific antibodies are able to detect the endogenous protein and the specific over-expressed protein, but they do not cross-react. (B) Detection of ESRP1 and ESRP2 proteins in LNCaP cells by Western blot, using protein isolated from cells treated with a control siRNA, or after siRNA-mediated depletion of ESRP1 and ESRP2. (C) Detection of ESRP1 and ESRP2 proteins in PC3 cells by immunohistochemistry.
Figure 2 with 2 supplements
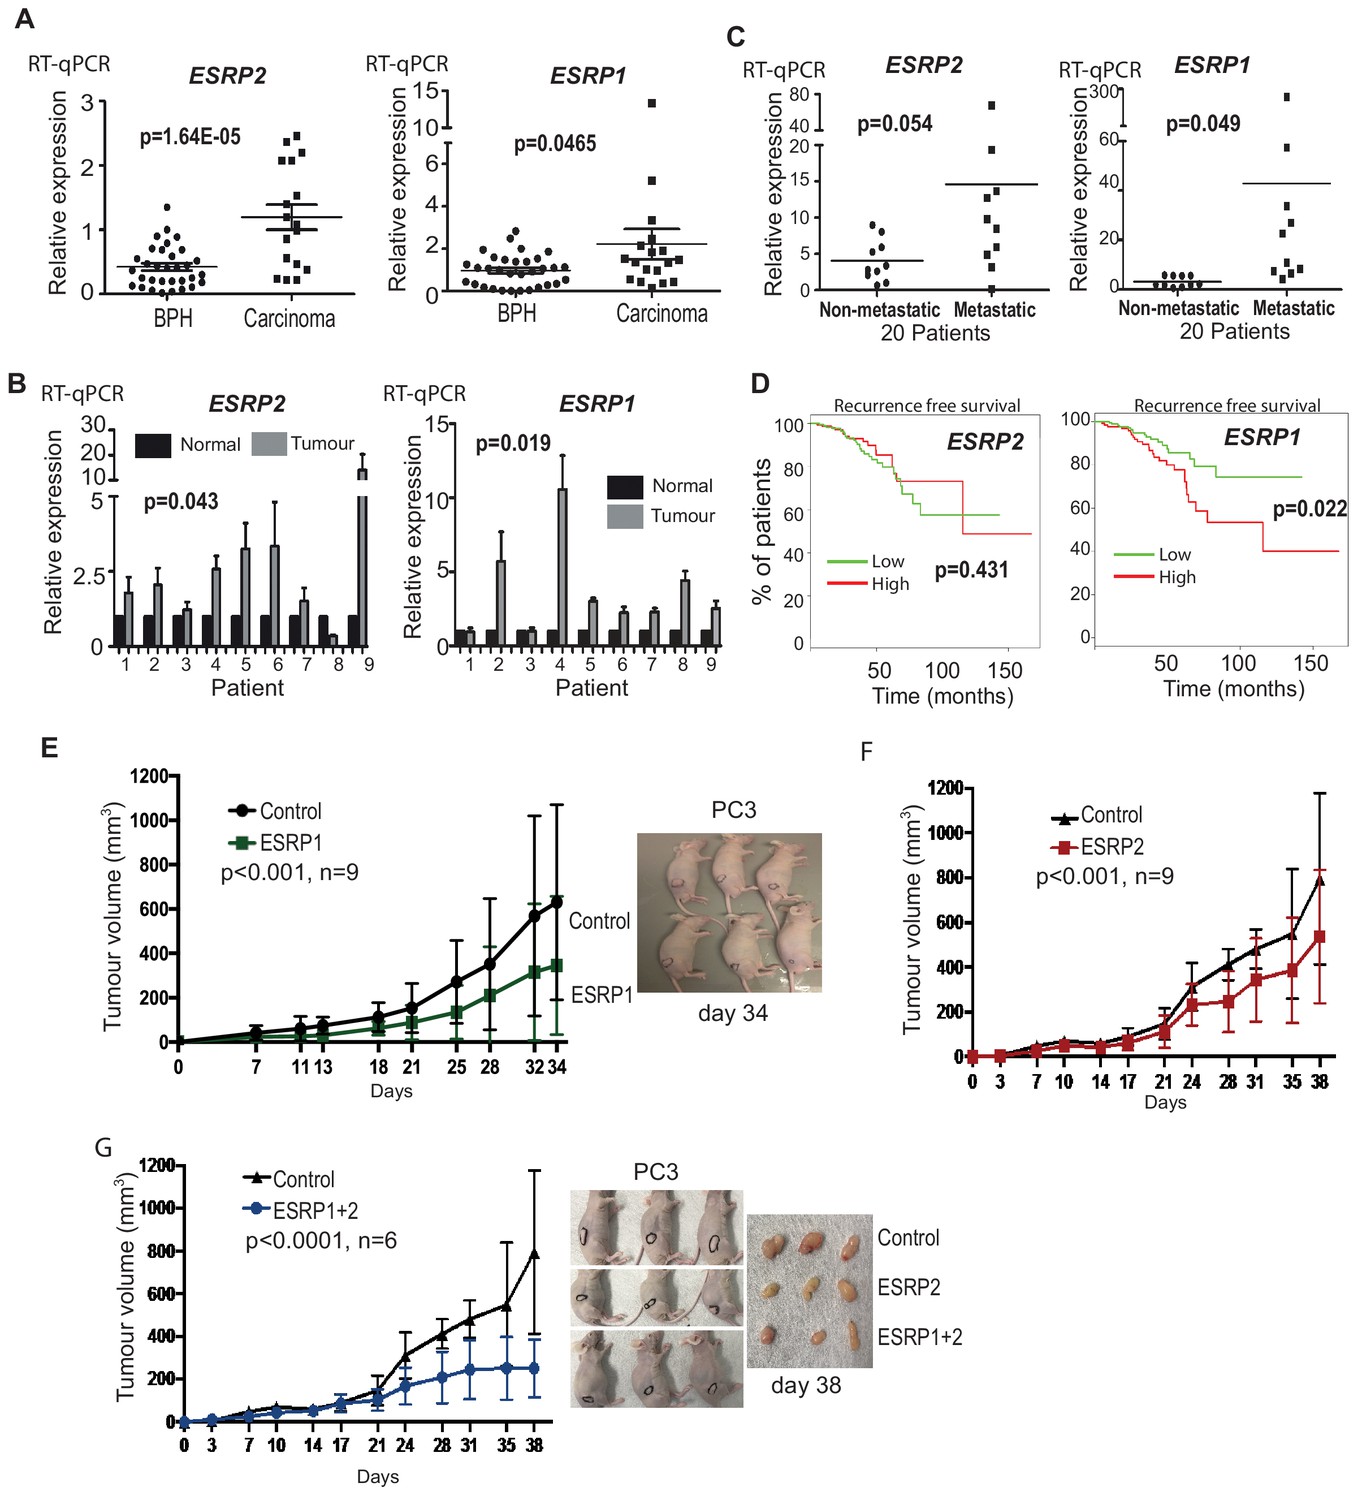
ESRP2 and its paralog ESRP1 are highly expressed in primary prostate tumours.
(A) Real-time PCR analysis of ESRP1 and ESRP2 mRNA from patients with benign prostate hyperplasia (BPH) and 17 malignant samples from transurothelial resection of the prostate (TURP) samples. (B) Real-time PCR analysis of ESRP1 and ESRP2 mRNA from normal and matched prostate cancer tissue from nine patients obtained from radical prostatectomy. (C) Analysis of ESRP1 and ESRP2 mRNA levels in samples from the Walker et al. (2017) cohort. Statistical analysis in parts (A)-(C) were performed using t tests. (D) Interrogation of the TCGA PRAD (PRostate ADenocarcinoma) cohort using KM-express (Chen et al., 2018). ESRP1 expression levels linked to a reduced time to PSA biochemical recurrence (bifurcate gene expression at average, log-rank test p=0.022). Over-expression of (E) ESRP1, (F) ESRP2, or (G) both ESRP1 and ESRP2 in PC3 cells significantly slowed the growth of prostate cancer xenografts in vivo. Data were analysed by Two-way ANOVA, and the p value is for the overall difference between two groups.
-
Figure 2—source data 1
Meta-analysis of 719 clinical prostate cancer tumours from 11 previously published studies detected significant up-regulation of both ESRP1 and ESRP2 in 9/11 datasets.
- https://doi.org/10.7554/eLife.47678.008
Figure 2—figure supplement 1
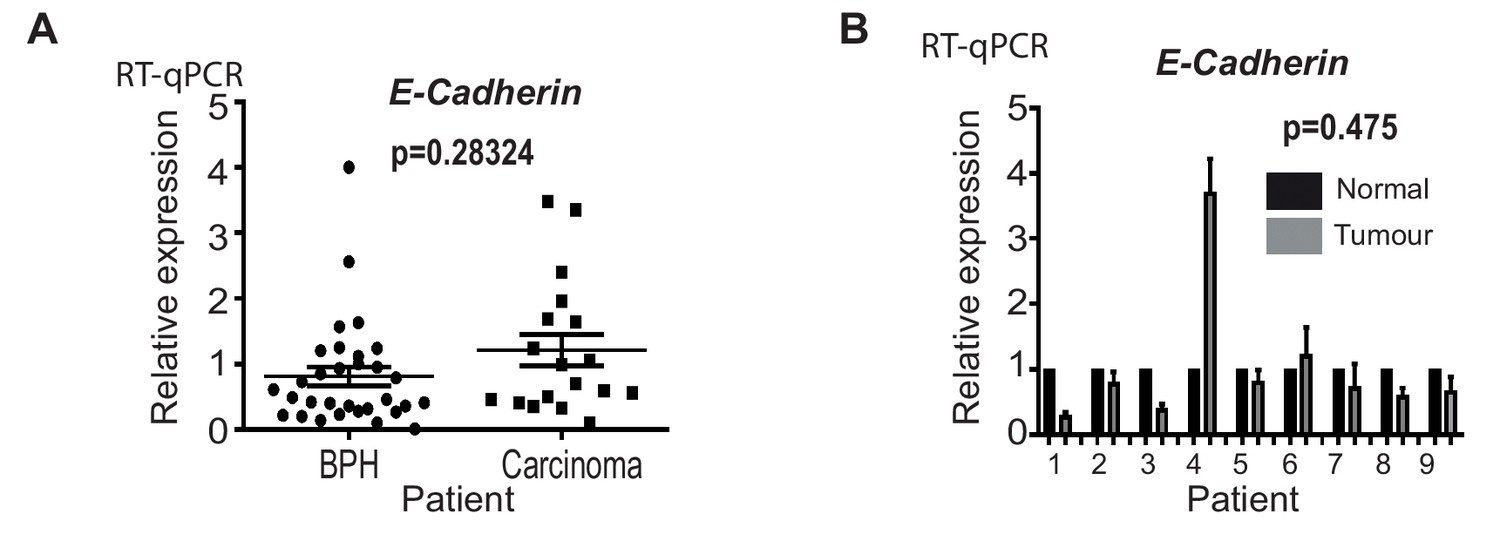
E-Cadherin levels are not significantly increased within primary prostate tumours.
(A) Real-time PCR analysis of E-Cadherin mRNA from patients with benign prostate hyperplasia (BPH) and 17 malignant samples from transurothelial resection of the prostate (TURP) samples. (B) Real-time PCR analysis of E-Cadherin mRNA from normal and matched prostate cancer tissue from nine patients obtained from radical prostatectomy.
Figure 2—figure supplement 2
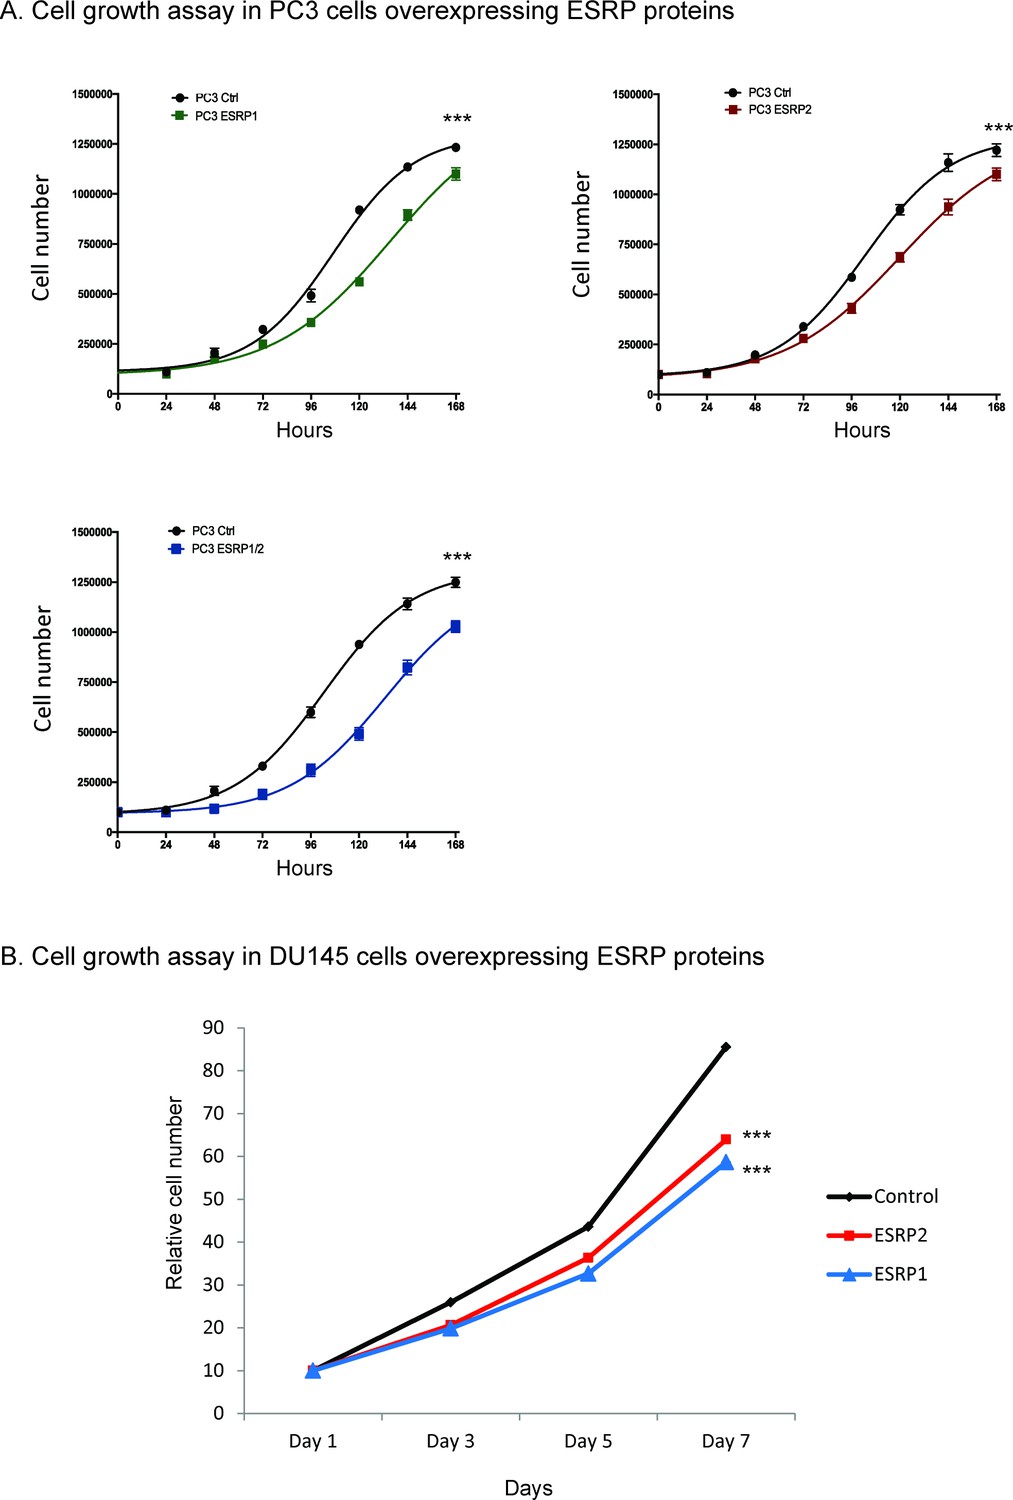
Ectopic expression of ESRP1 and ESRP2 protein expression in AR negative cells.
(A) PC3 and (B) DU145 cell line models reduced prostate cancer cell growth in vitro. Data were analysed by Two-way ANOVA, and the p value is for the overall difference between two groups.
Figure 3
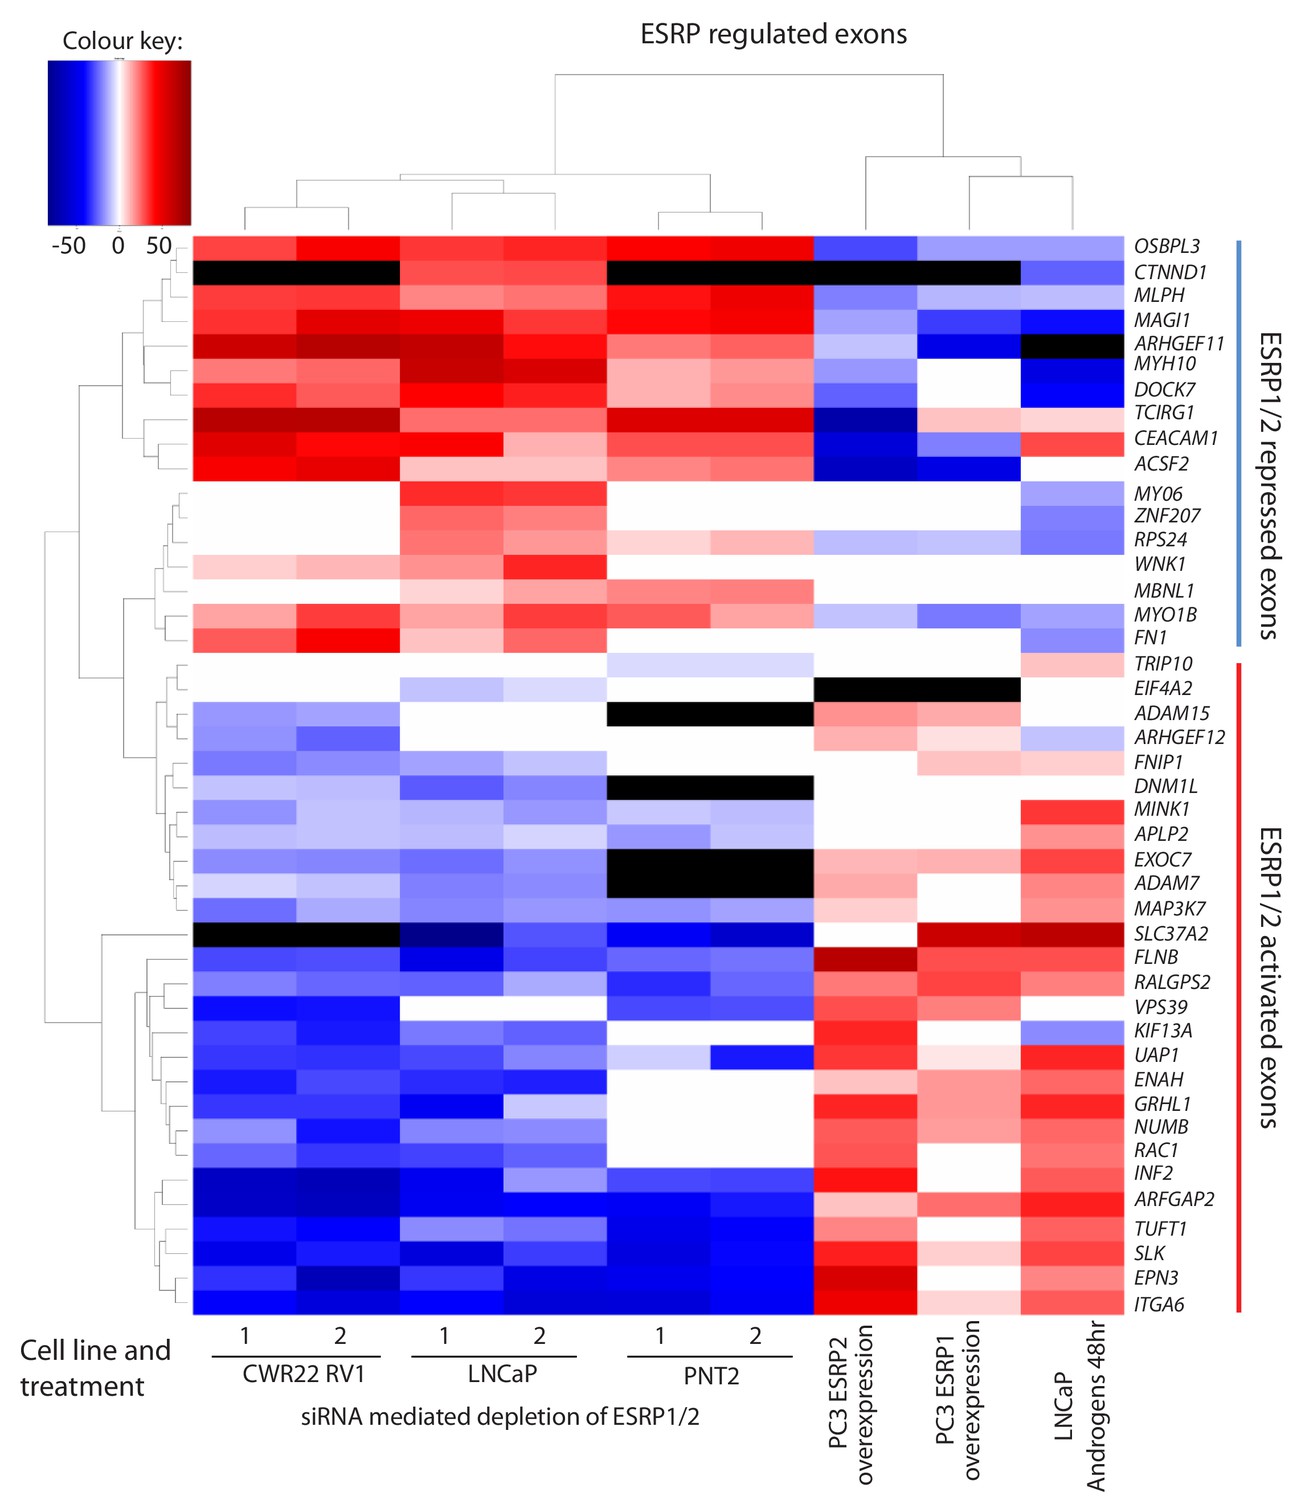
Identification of endogenous ESRP1/ESRP2 regulated target exons in prostate cancer.
Heat map showing mean PSI levels for a panel of ESRP-regulated exons in prostate cancer cell lines (CWR22RV1, PNT2, LNCaP and PC3). Mean PSIs were calculated for ESRP-regulated isoforms between cells treated with siRNAs specific to ESRP1 and ESRP2, or control siRNAs (CWR22RV1, PNT2, LNCaP), between PC3 cells with and without ectopic expression of ESRP1 or ESRP2, and between LNCaP cells grown in steroid deplete versus androgen stimulated conditions (10nM R1881 for 48 hr). Biological triplicate samples were used for CWR22RV1, PNT2 and LNCaP cells, and technical replicate samples were used for RNAs prepared from PC3 cells. PSI levels were measured using RT-PCR analysis averaged from three replicates (mean data given in Figure 3—source data 2), and clustered in the heat map according to splicing patterns across the different conditions. The heatmap was generated using heatmap.2 function using R’s ‘gplots’ package. The black shading in the heatmap denotes non-detection of the mRNA isoform after RT-PCR, and white denotes no change detected.
-
Figure 3—source data 1
Alternative splicing events identified by Suppa2 (Trincado et al., 2018).
446 ESRP regulated alternative splicing events were identified across 319 genes (ΔPSI > 10%, p<0.05).
- https://doi.org/10.7554/eLife.47678.010
-
Figure 3—source data 2
Details of 44 experimentally validated ESRP1/ESRP2 target exons identified within prostate cancer cell lines.
Gene names (column A) are shown next to PSI levels detected under different experimental conditions (columns B-P). In columns B-P red cell shading indicates increased exon inclusion; blue shading indicates decreased exon splicing; the white cells labelled NA indicate these conditions were not analysed; and the white cells labelled 0 indicate no change in splicing was detected. Patterns of splicing in the PRAD dataset (Saraiva-Agostinho and Barbosa-Morais, 2019) between tumour as compared to normal tissue (Tumour versus normal, column Q); whether there was any correlation in the PRAD dataset (Saraiva-Agostinho and Barbosa-Morais, 2019) between splicing inclusion or exclusion of the exon with time to biochemical recurrence of the tumour (column R); the p value associated with the pattern of splicing shown in column Q (T-test p-value (BH adjusted), column S); and the difference from the median pattern of inclusion (Δ median PSI, column T) or expression in normal versus prostate tumour tissue in the PRAD cohort (Saraiva-Agostinho and Barbosa-Morais, 2019); the coordinates of the alternative event on hg38 (Alternative event 1 (HG38), column U) and hg19 (Alternative event 1 (HG19), column V); and the forward (column W) and reverse (column X) primers used to detect the alternative event using RT-PCR.
- https://doi.org/10.7554/eLife.47678.011
Figure 4
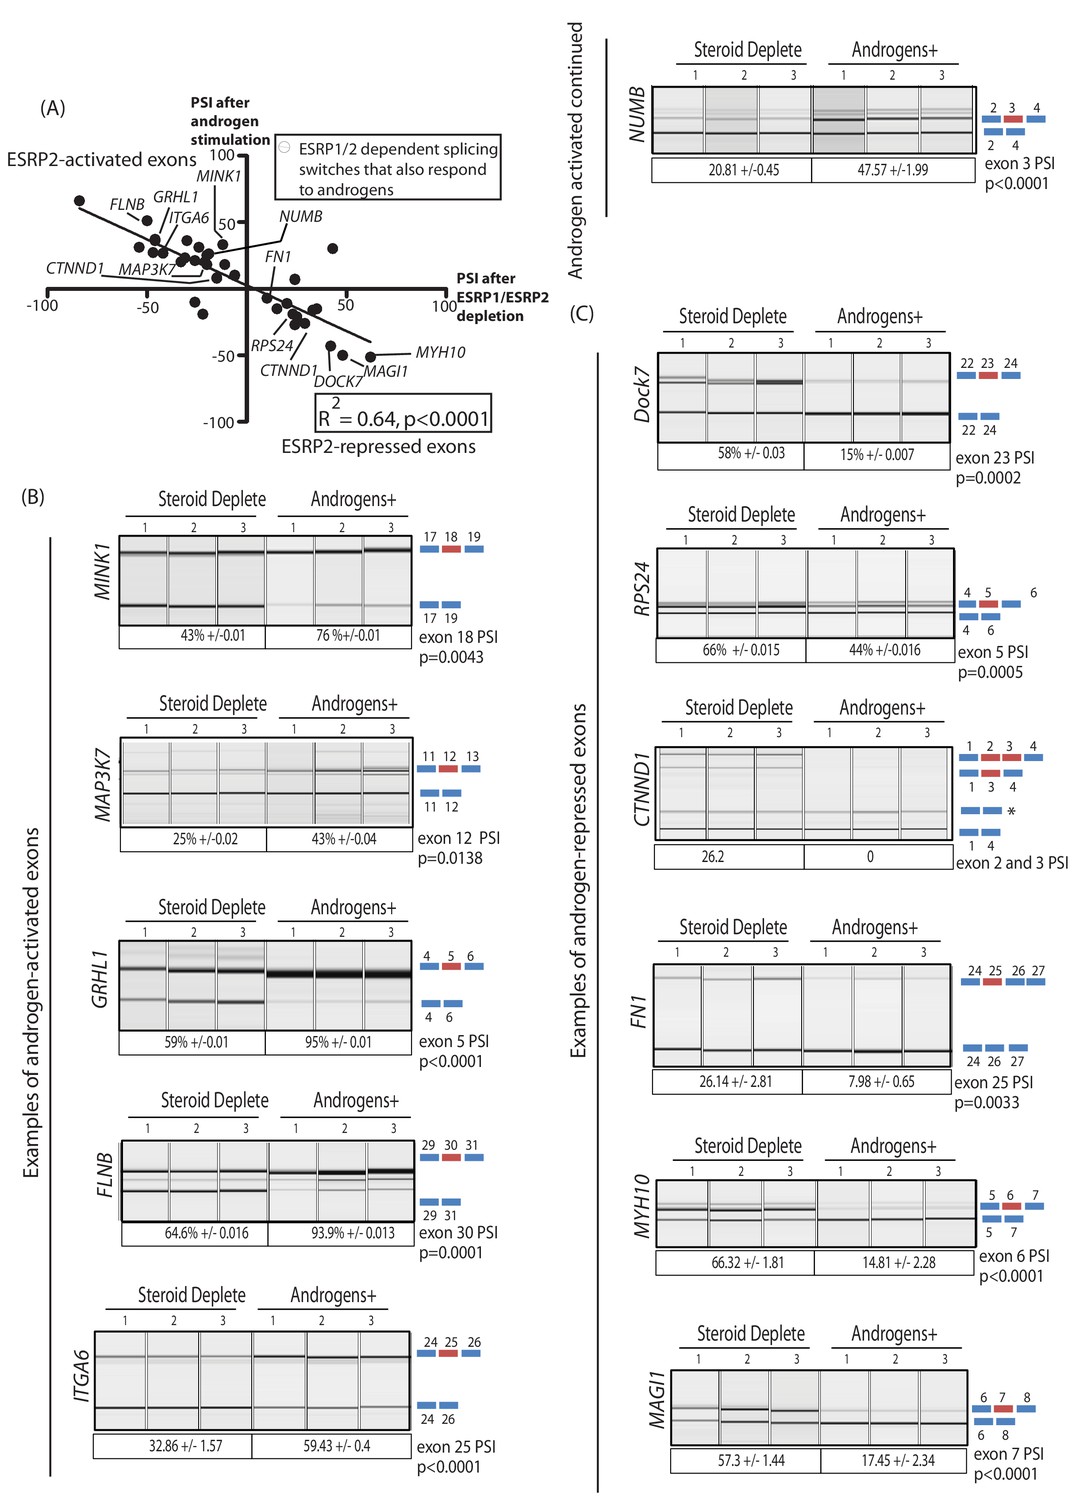
An androgen steroid hormone-ESRP2 axis controls alternative splicing in prostate cancer cells.
(A) ESRP2-regulated exons are frequently also controlled by androgens in prostate cancer cells. 31/48 of the ESRP target exons (identified by RNAseq analysis of LNCaP cells depleted of ESRP1 and ESRP2) were regulated in the opposite direction in LNCaP cells treated by androgens (10nM R1881) for 48 hr (which would induce ESRP2 protein expression). Plotting the splicing responses to androgen stimulation with those after ESRP1/ESRP2 depletion revealed a negative correlation (slope = −0.66+/−0.09, Rsquare = 0.64, p<0.0001, calculated using Graphpad). Individual values for this graph are given in Figure 3—source data 2, and are averages from three biological replicates. (B) Capillary gel electrophoretograms showing splicing patterns of 3 biological replicates grown in steroid deplete media, or steroid deplete media supplemented with R1881, for alternative exons that are activated by androgen exposure in the MINK1, MAP3K1, GRHL1, FLNB, ITGA6 and NUMB genes. (C) Capillary gel electrophoretograms showing splicing patterns of 3 biological replicates grown in steroid deplete media, or steroid deplete media supplemented with R1881, for alternative exons that are repressed by 48 hr androgen exposure in the DOCK7, RPS24, CTNND1, FN1, MYH10 and MAGI1 genes that were repressed by four androgen treatment. For parts (B–C) the p values were calculated using unpaired t tests, apart for CTNND1 where zero inclusion of exons 2 and 3 were detected in the presence of androgens. For CTNND1, an RT-PCR product derived from a splice variant joining exons 1–4 via an alternative splice site is asterisked.
Figure 5 with 2 supplements

Alternative splicing patterns controlled by the androgen steroid hormone-ESRP2 splicing axis are clinically relevant for disease progression.
(A) Graphical representation of levels of average PSI levels in response to ectopic ESRP2 expression in PC3 cells (Y axis) versus after ESRP1/ESRP2 depletion in LNCaP cells. Individual PSI values to make this graph are averaged from three biological replicates, and are given in Figure 3—source data 2. Note that the PSI values for ESRP over-expression refer to ESRP2 over-expression, with the exception of FNIP1 and SLC37A2 that are for ESRP1 over-expression (see Figure 3—source data 2). Linear regression analysis of this data was analysed using Graphpad. Individual splice forms were correlated with clinical data for time to PSA biochemical recurrence within the PRAD cohort (Saraiva-Agostinho and Barbosa-Morais, 2019). Points on this graph corresponding to individual ESRP-regulated splice isoforms are coloured differently according to whether they correlate with an increased time to PSA biochemical recurrence (blue dots), a decreased time to biochemical recurrence (red dots) or had no significant correlation (black dots) is shown. (B–C) Kaplan-Meier plots showing data from TCGA PRAD cohort of percentage of tumours that are free of biochemical recurrence versus time in years, associated with expressing the alternative splice isoforms of (B) RPS24 exon 5 (PSI cut off 0.44), and (C) FLNB exon 30 (PSI cut off 0.78) (Saraiva-Agostinho and Barbosa-Morais, 2019). (D) Violin plots of distributions of significance of biochemical recurrence (BCR) free survival difference between better and worse prognosis groups of patients defined by PSI cut-off values in primary tumour samples, for ESRP-regulated and all other exons whose PSI variance across TCGA primary tumours was ≥0.005 (approximately the minimum for regulated events, to avoid biasing the potential functional relevance towards these). The survival difference significance for each exon is given by -log10 of the p-value of the log-rank test used to compare survival distributions and the PSI cut-off value is the one minimising that p-value, given by psichomics (Saraiva-Agostinho and Barbosa-Morais, 2019).The depicted statistical significance (p) of the difference between the distributions summarised by the violins was calculated with a two-sided Wilcoxon signed-rank test. (E) Volcano plot showing alternative splicing analysis (Saraiva-Agostinho and Barbosa-Morais, 2019) of RNAseq data performed between normal prostate tissue and prostate tumour tissue from the TCGA PRAD cohort (consisting of 497 prostate tumour samples and 52 normal tissue). The t-test p-value (Benjamini-Hochberg adjusted for multiple testing) was used as metric of statistical significance. Significantly differentially spliced events (|Δ median PSI| ≥ 0.1 and FDR ≤ 0.01) are highlighted in orange, others in grey. ESRP2-activated exons are labelled in red text, and ESRP2-repressed exons are labelled in blue text. (F) Percentage splicing inclusion (PSI), quantified by RT-PCR, of DOCK7 exon 23 within samples of prostate tumour and adjacent normal tissue (statistical significance calculated using t test). (G) Percentage splicing inclusion (PSI), quantified by RT-PCR, of RPS24 exon 2 within nine matched samples of prostate tumour and adjacent normal tissue (statistical significance calculated using t test).
-
Figure 5—source data 1
Properties of ESRP-regulated exons that correlate with a decreased time to biochemical recurrence.
- https://doi.org/10.7554/eLife.47678.016
-
Figure 5—source data 2
Properties of ESRP-regulated exons that correlate with an increased time to biochemical recurrence.
- https://doi.org/10.7554/eLife.47678.017
-
Figure 5—source data 3
Properties of ESRP-regulated exons that show no significant correlation with time to biochemical recurrence.
- https://doi.org/10.7554/eLife.47678.018
Figure 5—figure supplement 1
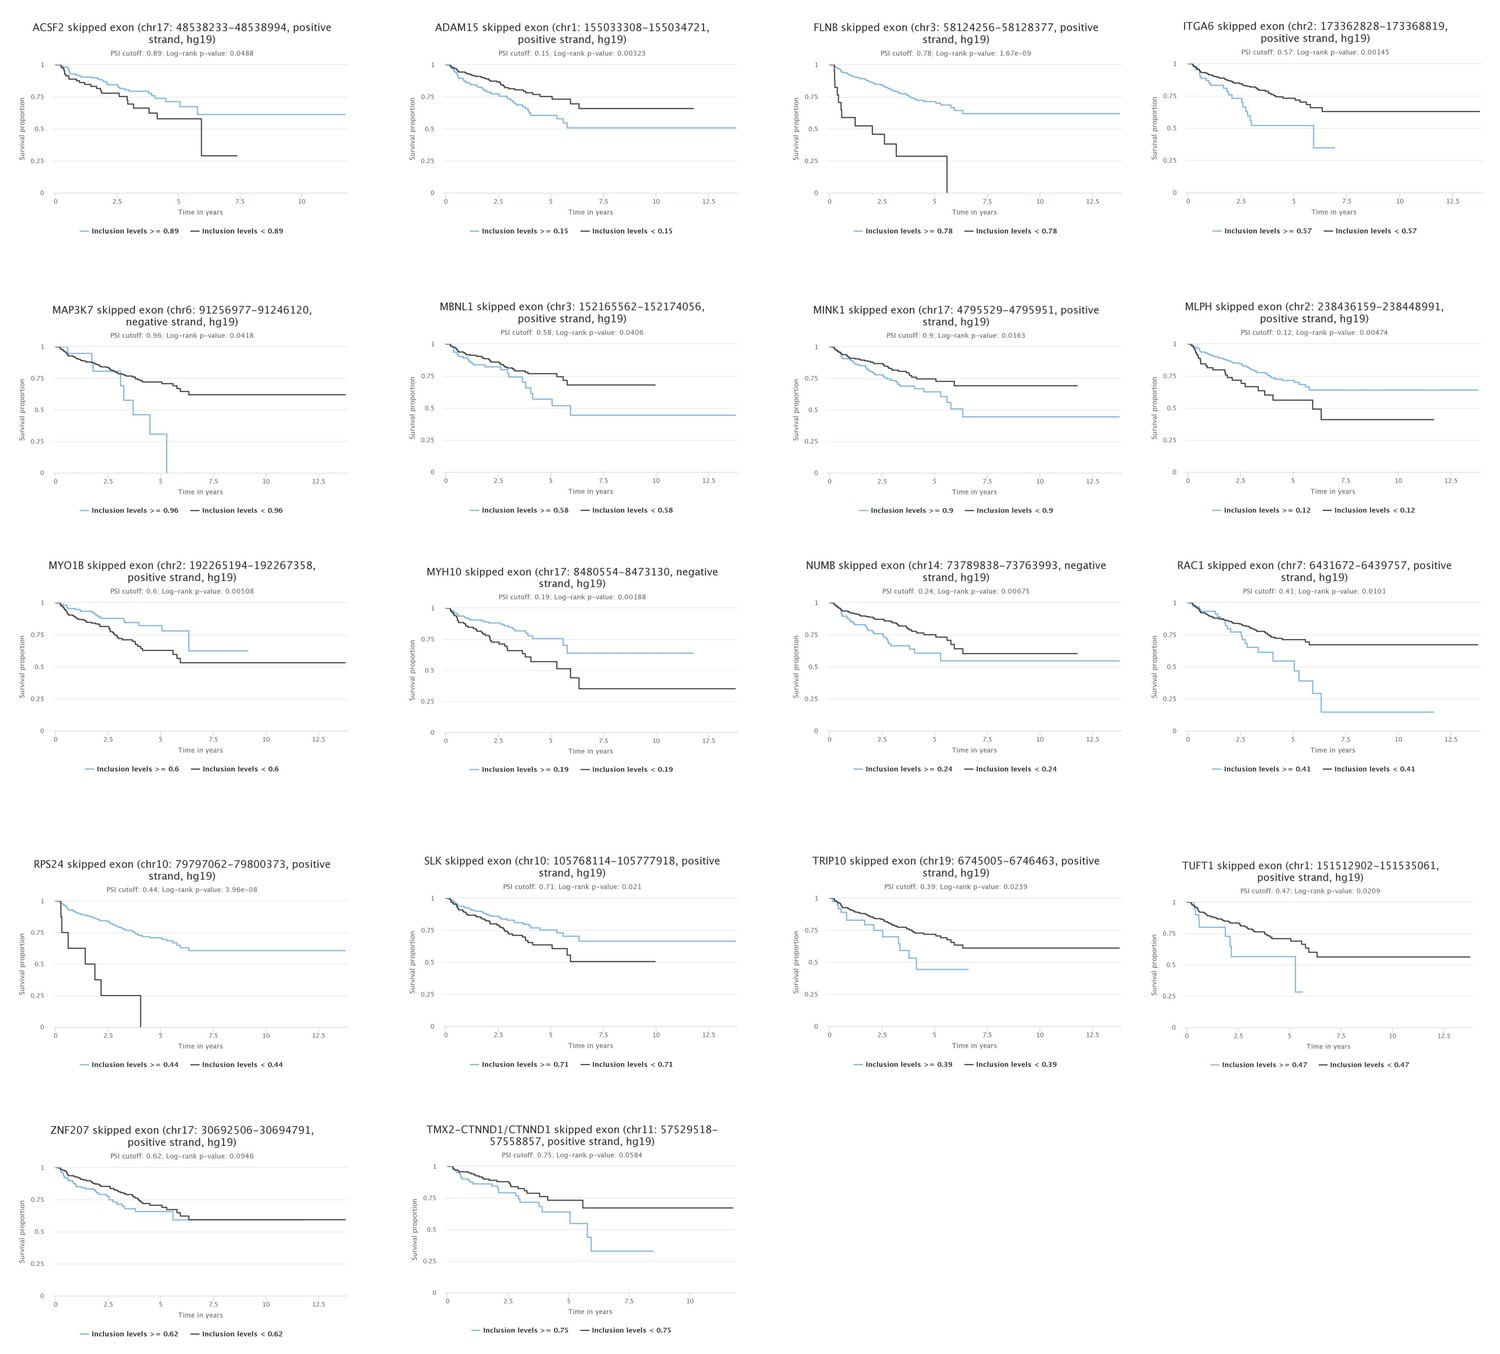
Kaplan-Meier plot showing data from TCGA PRAD cohort of percentage of tumours that are free of biochemical recurrence versus time in years associated with expressing ESRP2-regulated alternative splice isoforms.
https://doi.org/10.7554/eLife.47678.014
Figure 5—figure supplement 2
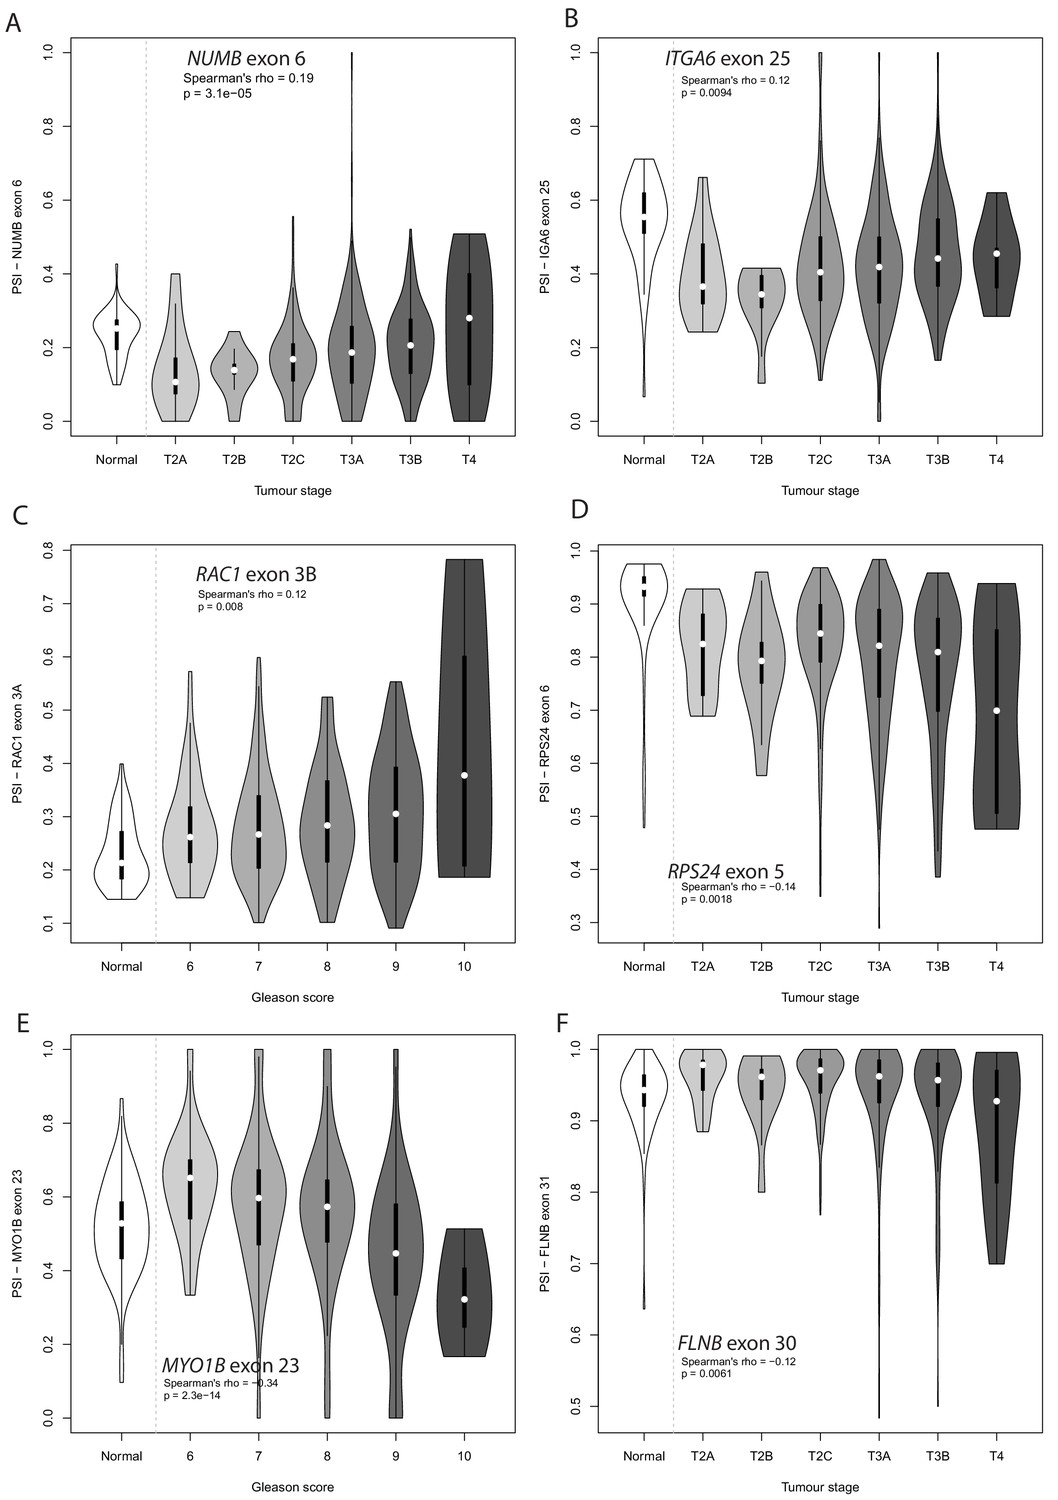
Violin plot showing PSI levels for (A) NUMB exon 6, (B) ITGA6 exon 25 (C) RAC1 exon 3A, (D) RPS24 exon 6, and (E) MYO1B exon 23, and (F) FLNB exon 31 in different grade prostate tumours.
https://doi.org/10.7554/eLife.47678.015
Figure 6 with 2 supplements
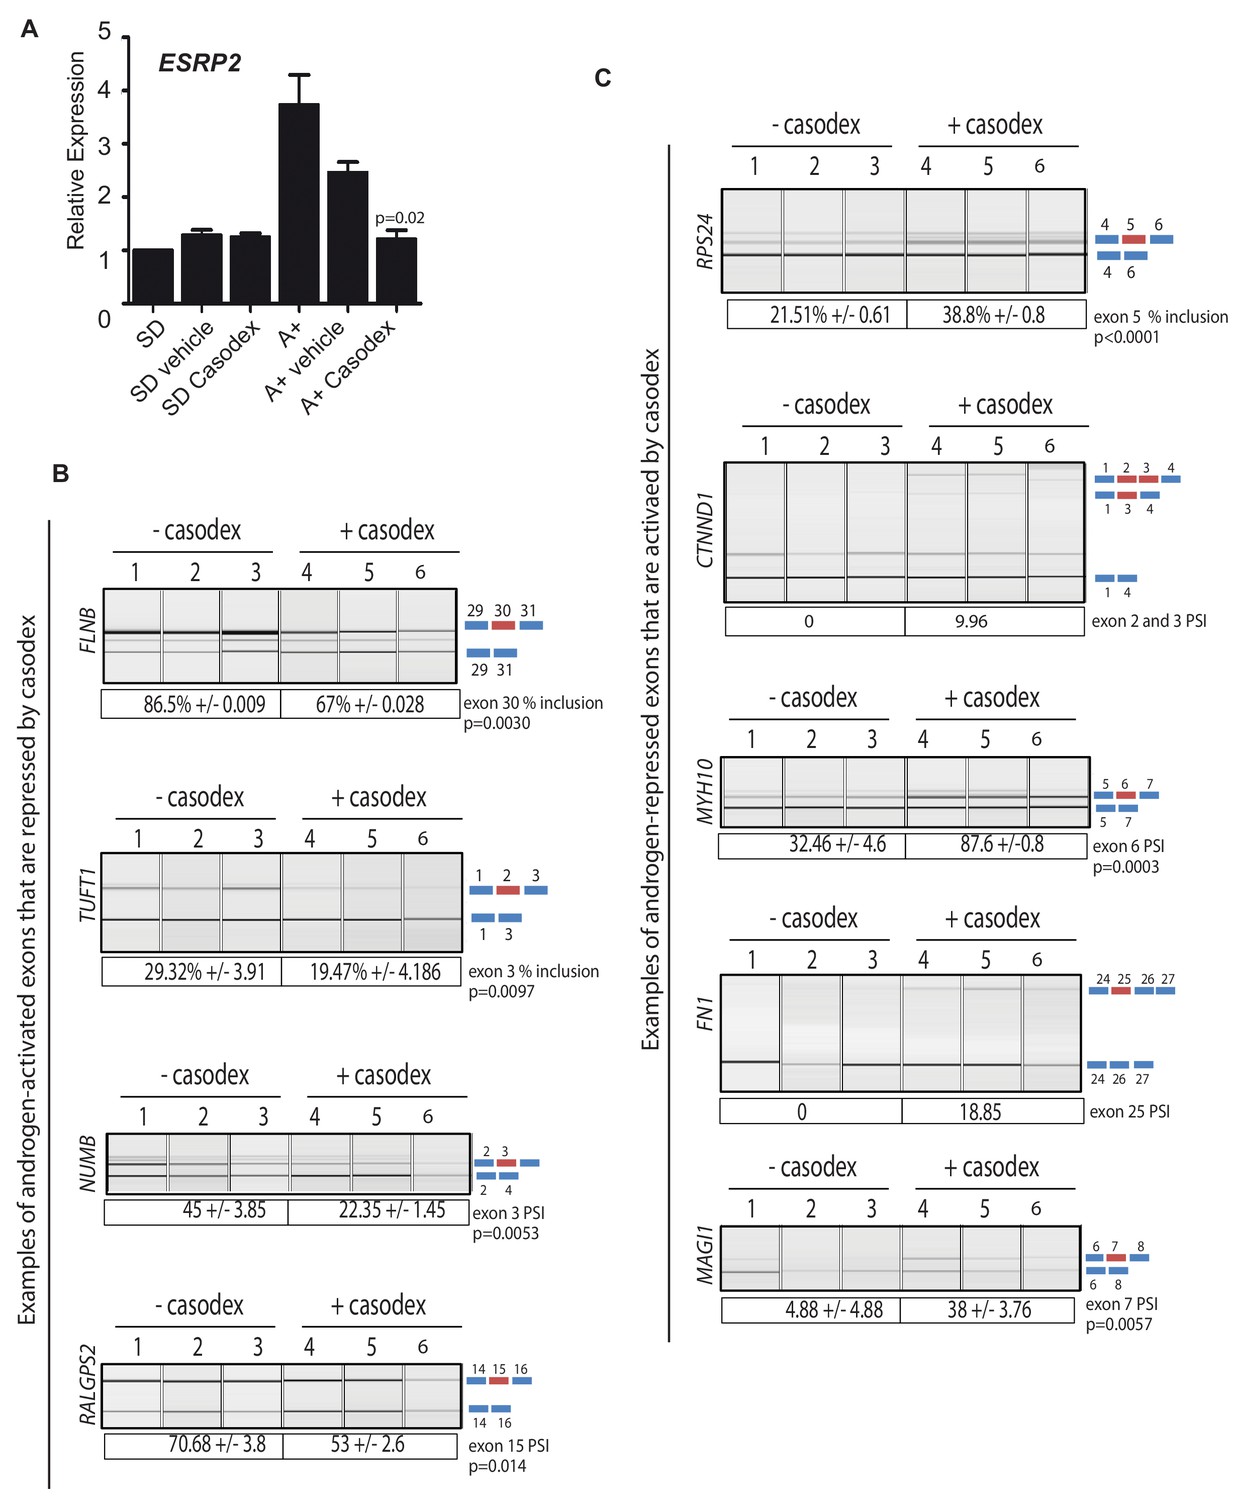
Pharmacological inhibition of AR function switches ESRP2-dependent splicing patterns.
(A) ESRP2 mRNA expression in cells grown in steroid deplete (SD) conditions, and after addition of androgens (A+) (quantified by real-time PCR from three biological replicates). Androgen-mediated activation of ESRP2 expression was inhibited in the presence of 10 μM of the anti-androgen bicalutamide (Casodex). Cells were cultured for 24 hr. The p value shows the statistical significance that was calculated using a t test between the A + vehicle and the A + casodex samples. (B–C) Capillary gel electrophoretogram showing RT-PCR analysis the splicing response + /- 24 hr Casodex treatment for exons that are normally (B) activated or (C) repressed by androgens (three biological samples shown, statistical significances were calculated using a t test, with the exception of CTNND1 where there was zero inclusion detected for exons 2 and 3 before depletion of ESRP2, and FN1 where there was zero inclusion of exon 25 before Casodex treatment).
Figure 6—figure supplement 1

siRNA depletion of the AR switches splicing of ESRP2- regulated exons.
(A) Western blot showing levels of the AR, ESRP2 and actin in samples of LNCaP cells following growth in steroid deplete media (SD), or plus androgens for 48 hr (A+). Cells were transfected with esiRNAs designed to deplete the AR, or a control siRNA (NTesiRNA). Statistical significance was calculated using a t test. (B) Capillary gel electrophoretograms showing RT-PCR analysis of 3 biological replicate RNA samples, measuring splicing inclusion levels for FLNB exon 30 and TUFT1 exon two after siRNA depletion of the AR or treatment with a control siRNA.
Figure 6—figure supplement 2

siRNA depletion of ESRP2 alone is sufficient to switch splicing patterns of ESRP-regulated exons.
(A–C) Capillary gel electrophoretograms showing RT-PCR analysis of 3 biological replicate RNA samples, measuring splicing inclusion levels for MAP3K7 exon 12; an ESRP2 regulated exons between exons 7 and 8 in the ARFGAP2 gene (this exon is currently unannotated so designated with an asterisk); and CTNND1 exons 2 and 3 after siRNA depletion of the AR or treatment with a control siRNA. p values were calculated using graphpad, with the exception of CTNND1 where there was zero inclusion detected for exons 2 and 3 before depletion of ESRP2.
Figure 7
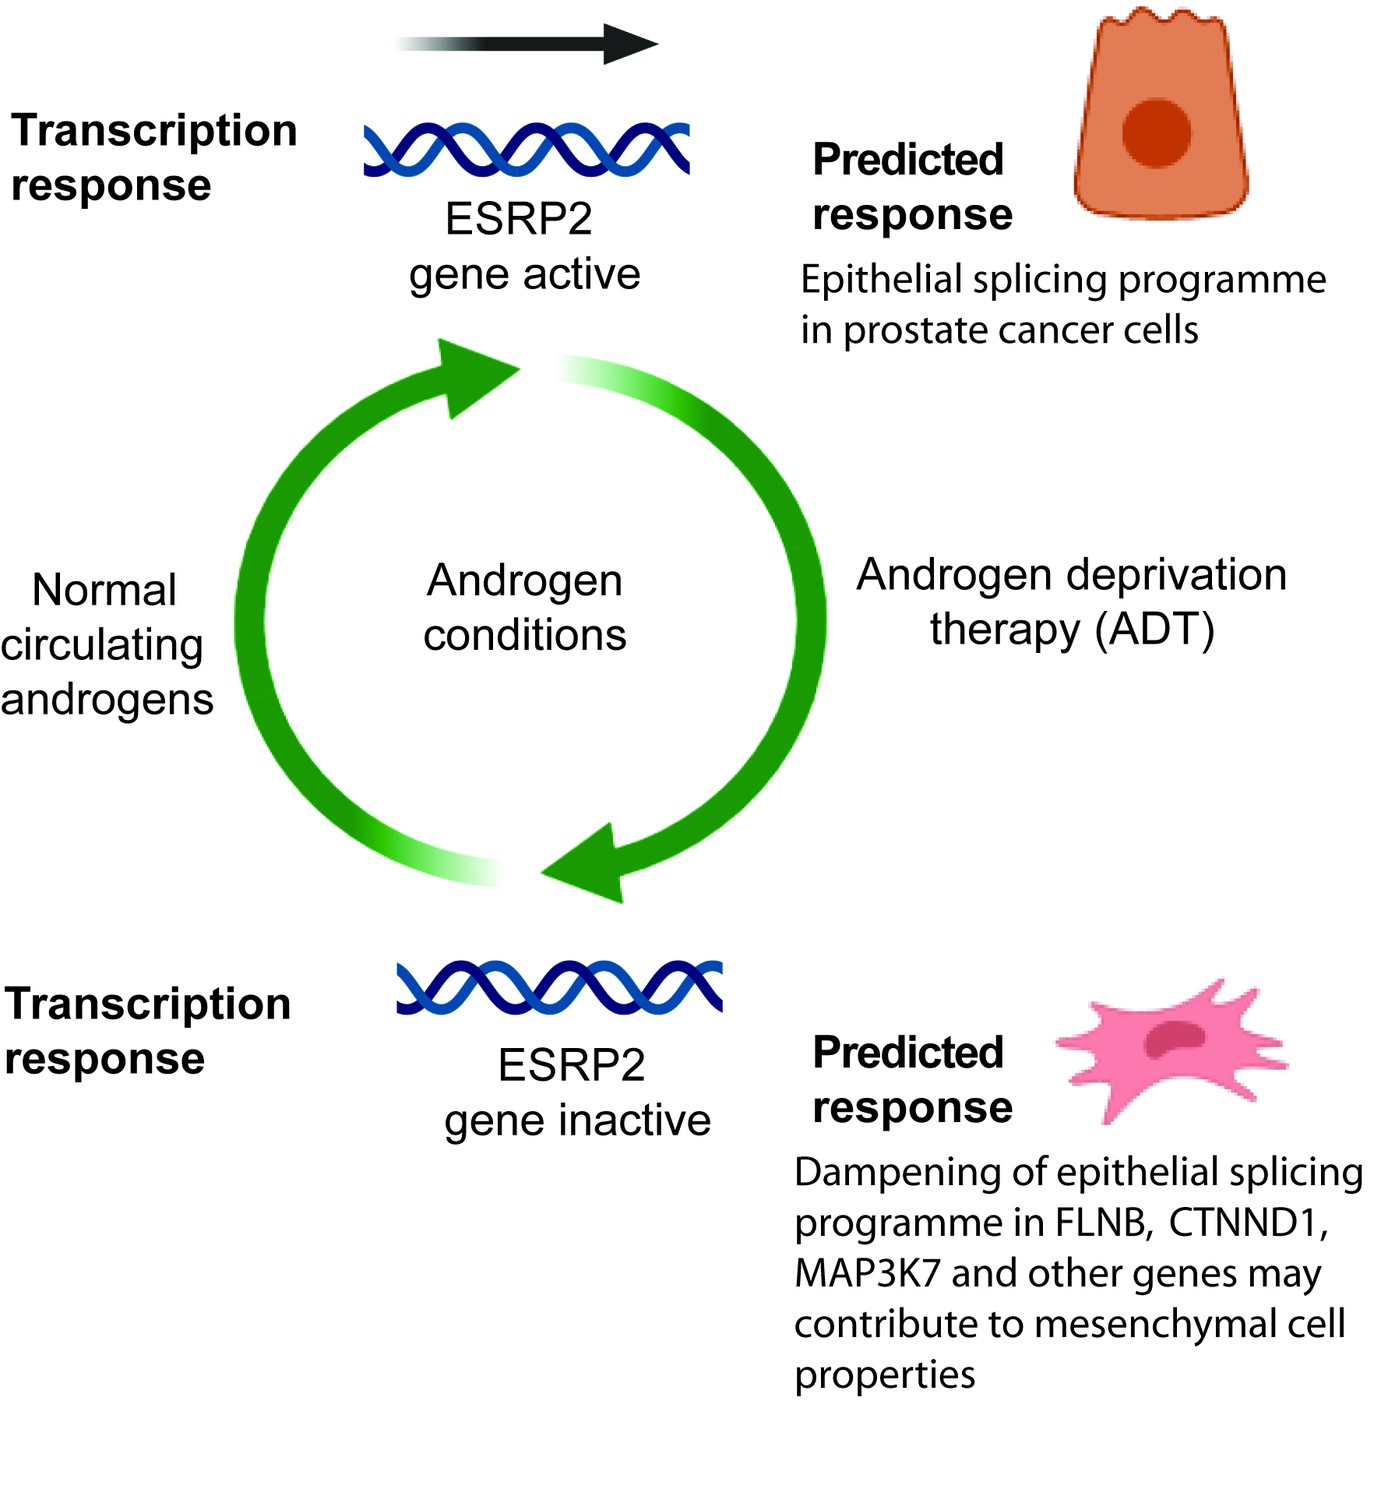
Model describing how exposure to androgens regulates splicing patterns in prostate cancer cells.
Androgen exposure leads to transcription of the gene encoding the master splicing regulator protein ESRP2. This promotes epithelial splicing patterns within prostate cancer cells. Lower levels of circulating androgens after ADT lead to transcriptional repression of ESRP2. This results in a dampening of epithelial splicing patterns, and production of normally mesenchymal splice patterns including for the FLNB, CTNND1 and MAP3K7 genes. This image was created using BioRender.
Tables
Key resources table
| Reagent type (species) or resource | Designation | Source or reference | Identifiers | Additional information |
|---|---|---|---|---|
| Gene (H. sapiens) | ESRP1 | |||
| Gene (H. sapiens) | ESRP2 | |||
| Cell line (H. sapiens) | LNCaP | ATCC | CRL-1740 | |
| Cell line (H. sapiens) | PC3 | ATCC | CRL-1435 | |
| Cell line (H. sapiens) | CWR-RV1 | ATCC | CRL-2505 | |
| Cell line (H. sapiens) | PNT2 | Sigma Aldrich | 95012613 | |
| Cell line (H. sapiens) | RWPE-1 | ATCC | CRL-11609 | |
| Antibody | Rabbit polyclonal anti-ESRP2 | Genetex | GTX123665 | 1:1000 dilution |
| Antibody | Rabbit polyclonal anti-ESRP1 | Sigma, | HPA023719 | 1:1000 dilution |
| Antibody | Mouse monoclonal anti-AR | BD Bioscience, | 554226 | 1:10000 dilution |
| Antibody | anti-actin rabbit polyclonal antibody | Sigma | A2668 | 1:2000 dilution |
| Antibody | anti-FLAG mouse monoclonal antibody | Sigma | F3165 | 1:2000 dilution |
| Antibody | normal rabbit IgG | Jackson labs | 711-035-152 | 1:2000 dilution |
| Antibody | normal mouse IgG | Jackson labs | 715-036-150 | 1:2000 dilution |
| Recombinant DNA reagent | ESRP1 plasmid | Gift from Prof Russ Carstens (University of Philadelphia. USA) | PIBX-C-FF-B-ESRP1 | |
| Recombinant DNA reagent | ESRP2 plasmid | Gift from Dr Keith Brown (University of Bristol. UK) | pBIGi hESRP2-FLAG | |
| Sequence based reagent | Primers to detect splice isoforms | This paper | designed using Primer3 http://primer3.ut.ee/ | |
| Sequence based reagent | qPCR primers | This paper | designed using Primer3 http://primer3.ut.ee/ | |
| Sequence based reagent | siRNAs | hs.Ri.ESRP1.13.1, hs.Ri.ESRP1.13.2, hs.Ri.ESRP2.13.1, hs.Ri.ESRP2.13.2, IDT (51-01-14-04), AR esiRNA EHU025951 Control esiRNA EHUEGFP Sigma | ||
| Commercialassay or kit | Rnaeasy plus kit | Qiagen | catalog number 74134 | |
| Commercialassay or kit | DNA free | Ambion | catalog number AM1906 | |
| Software, algorithm | Graphpad prism | https://graphpad.com | ||
| Chemical compound, drug | synthetic androgen analogue methyltrienolone (R1881) | Perkin–Elmer | NLP005005MG | 10 nM |
| Chemical compound, drug | Bicalutamide (Casodex) | Sigma | B9061 | 10 μM |
Additional files
-
Transparent reporting form
- https://doi.org/10.7554/eLife.47678.023
Download links
A two-part list of links to download the article, or parts of the article, in various formats.
Downloads (link to download the article as PDF)
Open citations (links to open the citations from this article in various online reference manager services)
Cite this article (links to download the citations from this article in formats compatible with various reference manager tools)
Androgen-regulated transcription of ESRP2 drives alternative splicing patterns in prostate cancer
eLife 8:e47678.
https://doi.org/10.7554/eLife.47678


