A single K+-binding site in the crystal structure of the gastric proton pump
- Nagoya University, Japan
- PHYLIFE, University of Southern Denmark, Denmark
- CeSPIA Inc, Japan
Figures
Figure 1

Transport stoichiometry and free energy from ATP hydrolysis.
The free energy that is derived from ATP hydrolysis, ΔGATP—calculated from ΔG’0 and the measured intracellular concentrations of ATP, ADP and Pi in the parietal cell—is about −13 kcal/mol (Durbin et al., 1974). Under physiological conditions in intact parietal cells with an internal pH of approximately 7, a pH gradient of at least 6 pH units must be created. The maximum electrochemical gradient, Δμi, that can be formed by an ion-transporting ATPase is a function of the free energy of ATP hydrolysis. Taking reasonable values of pH 7 and 120 mM K+ for intracellular conditions and the measured pH (1.0) and K+ concentration (10 mM) of the gastric juice, we can calculate concentration gradients across the parietal cell membrane of 106 and 12 times for H+ and K+, respectively. For an electro-neutral H+/K+ exchange pump for which NH+=NKK+=1, the sum of chemical potentials is about −10 kcal/mol, and is within the range of ATP free energy (Reenstra and Forte, 1981). However, if the exchange of two cations is assumed, in which case NH+=NKK+=2, the reaction is thermodynamically disallowed at pH 1. Therefore, the ratio of H+ transported to ATP hydrolyzed must be approximately 1, and cannot be as large as 2, when gastric pH is around 1. However, this cannot be the case when luminal pH is neutral to weakly acidic (e.g., at pH 4). A different postulate is that two H+ are transported for each ATP molecule hydrolyzed under these conditions (Rabon et al., 1982), and that the number of transported H+, and therefore K+ as well, changes from 2 to 1 as luminal pH decreases. On the basis of two different results for H+/ATP ratio, two hypotheses have been proposed. Hypothesis 1: transport stoichiometry remains constant (1H+:1K+) regardless of luminal pH. Hypothesis 2: 2H+:2K+ ions are exchanged when luminal pH is neutral to weakly acidic, and it returns to 1H+:1K+ transport mode when the luminal solution becomes highly acidic.
Figure 2

Characterization of the Tyr799Trp mutant of H+,K+-ATPase.
(A) Post-Albers type reaction scheme for H+,K+-ATPase. The K+-occluded E2-P transition state is highlighted in red. (B) ATPase activities of the wild-type enzyme with the indicated cations, showing a Hill coefficient (n) close to 1. K+-dependent ATPase activity of (C) wild-type or (D) Tyr799Trp mutant H+,K+-ATPase in the absence or presence of indicated concentrations of the K+-competitive inhibitor vonoprazan. Thermal stability of (E) wild-type or (F) Try799Trp mutant H+,K+-ATPase in the presence of the indicated ligands, evaluated by fluorescence size-exclusion chromatography.
Figure 3 with 2 supplements
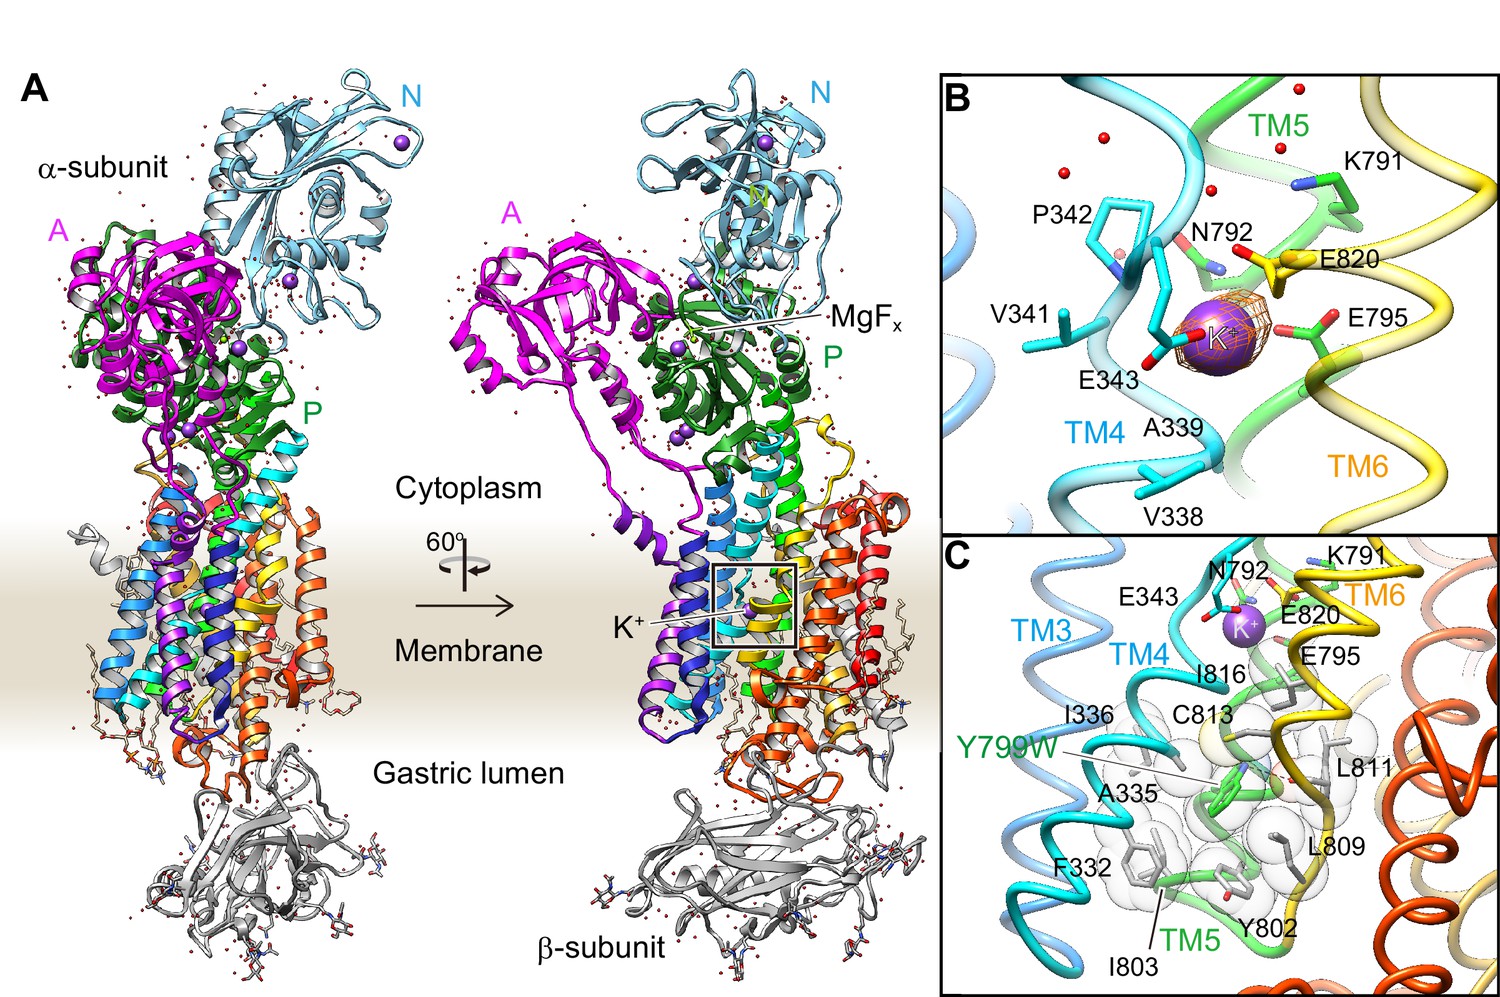
Crystal structure of the K+-occluded E2-P transition state of H+,K+-ATPase.
(A) Overall structure of the K+-occluded E2-MgFx state [Y799W(K+)E2-MgFx] in ribbon representations. For the α-subunit, the three cytoplasmic domains (A, P and N) are shown in different colors. The color of the TM helices gradually changes from purple to red (TM1–TM10). The β-subunit with a single TM helix and six N-glycosylation sites in the ecto-domain is shown in gray. Phospholipids, a cholesterol and detergent molecules are also modeled (as sticks). Red dots and purple spheres represent water molecules and K+ ions, respectively. (B) The TM K+-binding site viewed from a position parallel to membrane plane. Orange mesh represents an anomalous density map of the Rb+-bound form [(Rb+)E2-MgFx] with 8 σ contour level. Amino acids that contribute to the K+-coordination are shown in sticks. (C) The hydrophobic gate centered around Tyr799Trp (green), with surrounding hydrophobic residues (gray), is shown. The dotted line indicates a hydrogen bond between a nitrogen atom of the Trp residue and a main chain oxygen of L811.
Figure 3—figure supplement 1
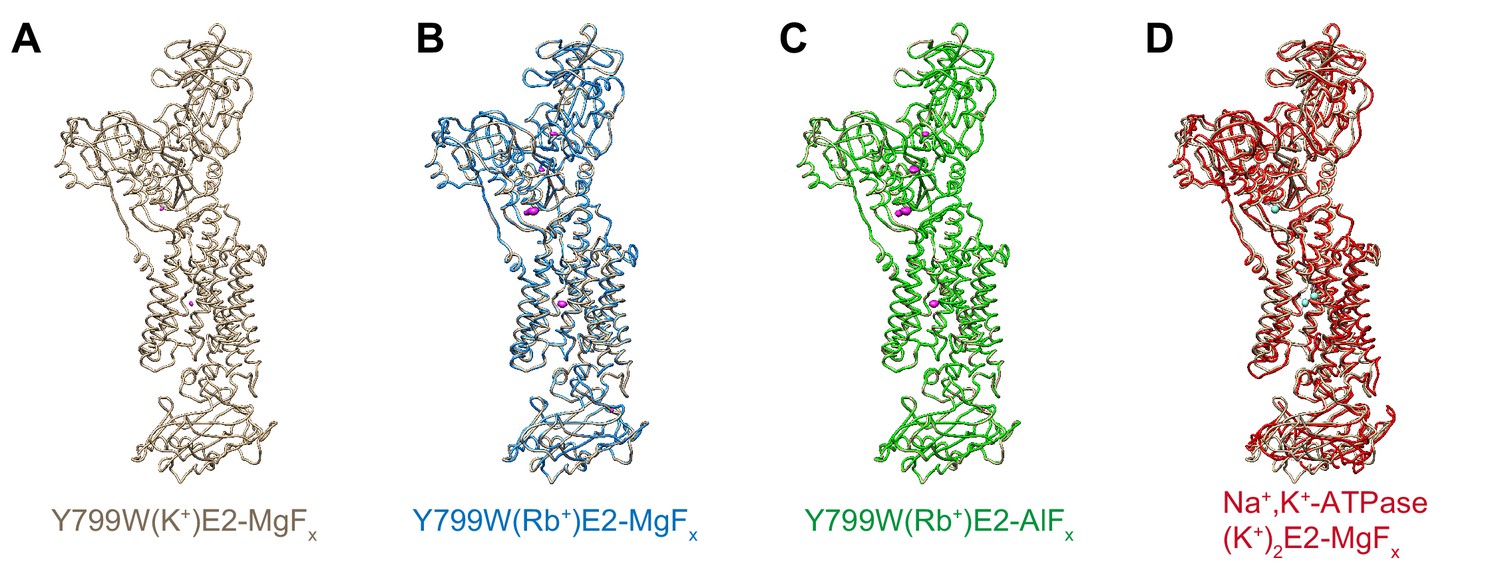
Comparison of the molecular conformations of the K+- or Rb+-occluded E2-P transition state of different H+,K+-ATPases.
Comparison of the molecular conformation of H+,K+-ATPase Y799W(K+)E2-MgFx (A, wheat) and those of Y799W(Rb+)E2-MgFx (B, blue), Y799W(Rb+)E2-AlFx (C, green), or Na+,K+-ATPase (K+)2E2-MgFx (D, red). Anomalous difference Fourier maps of the indicated crystal structures are shown as magenta in (A–C), with a contour level of 4σ for K+ (A) and 8σ for Rb+ (B–C). Bound K+ ions in the crystal structure of Na+,K+-ATPase are shown as cyan spheres (D).
Figure 3—figure supplement 2
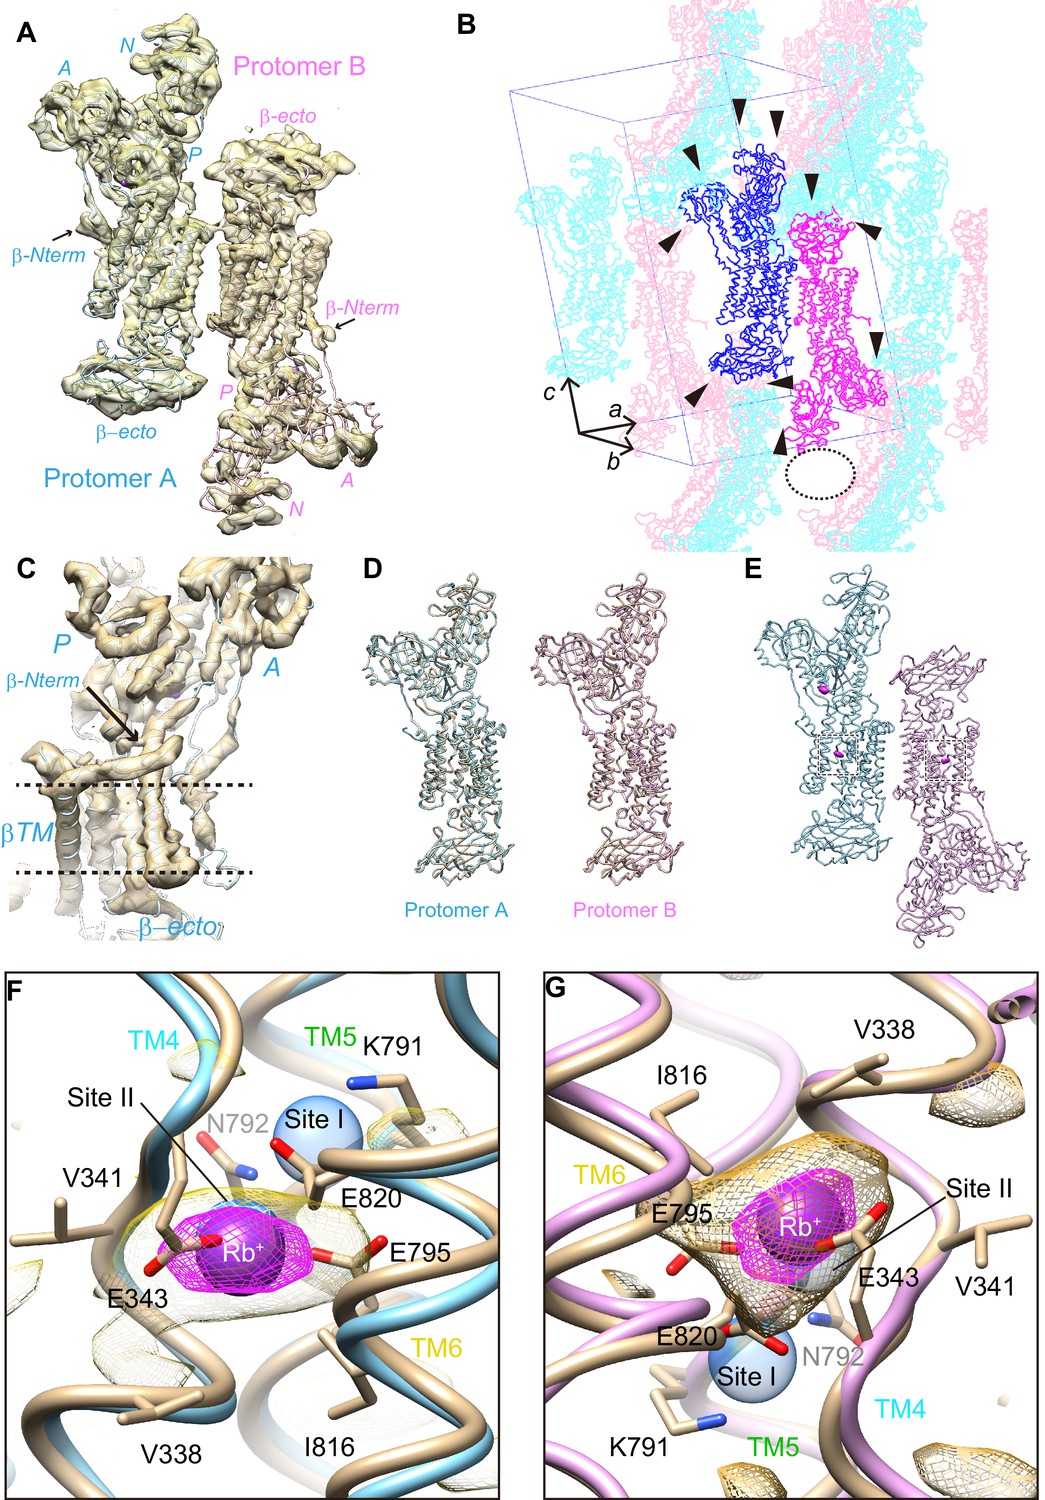
Crystal structure of the wild-type enzyme.
(A) An asymmetric unit of wild-type H+,K+-ATPase in the (Rb+)E2-MgFx state contains two αβ-protomers (protomer A, light blue; protomer B, pink). Surface represents the electron density map with 1.5 σ contour level. (B) Crystal packing of wild-type H+,K+-ATPase showing different crystal contacts (arrowheads) in protomer A (blue) and protomer B (magenta). Symmetry-related molecules are shown in light colors. Sparse crystal packing (indicated as the dotted oval) at the A- and N-domain of protomer B may cause their disorder. A unit cell is provided to indicate viewpoint. (C) Electron density map (surface, with 1.5 σ contour) around the β-subunit N-terminus (indicated by the arrow) in protomer A. Dotted lines indicate the approximate location of the membrane surface. (D) Comparison of the molecular conformation of WT(Rb+)E2-MgFx and Y799W(K+)E2-MgFx. (E) Anomalous difference Fourier maps of wild-type crystal structures are shown in magenta with a contour level of 4 σ. (F,G) Close-up view of the cation binding site indicated as the dottedboxes in (E). Magenta spheres show Rb+ bound to the cation-binding site of protomer A (F) and B (G). Magenta and yellow mesh represent anomalous density maps of Rb+ at contour levels of 4 σ and 2 σ, respectively. The wheat model is the Y799W structure superimposed onto each protomer to indicate the identical structure of the Y799W and WT protomers. Blue transparent spheres indicate the cation-binding sites I and II in the Na+,K+-ATPase (K+)2E2-MgFx structure. As a note, anomalous density in the cation-binding site of both protomers is centered at site II, and little signal is detected at site I.
Figure 4 with 1 supplement
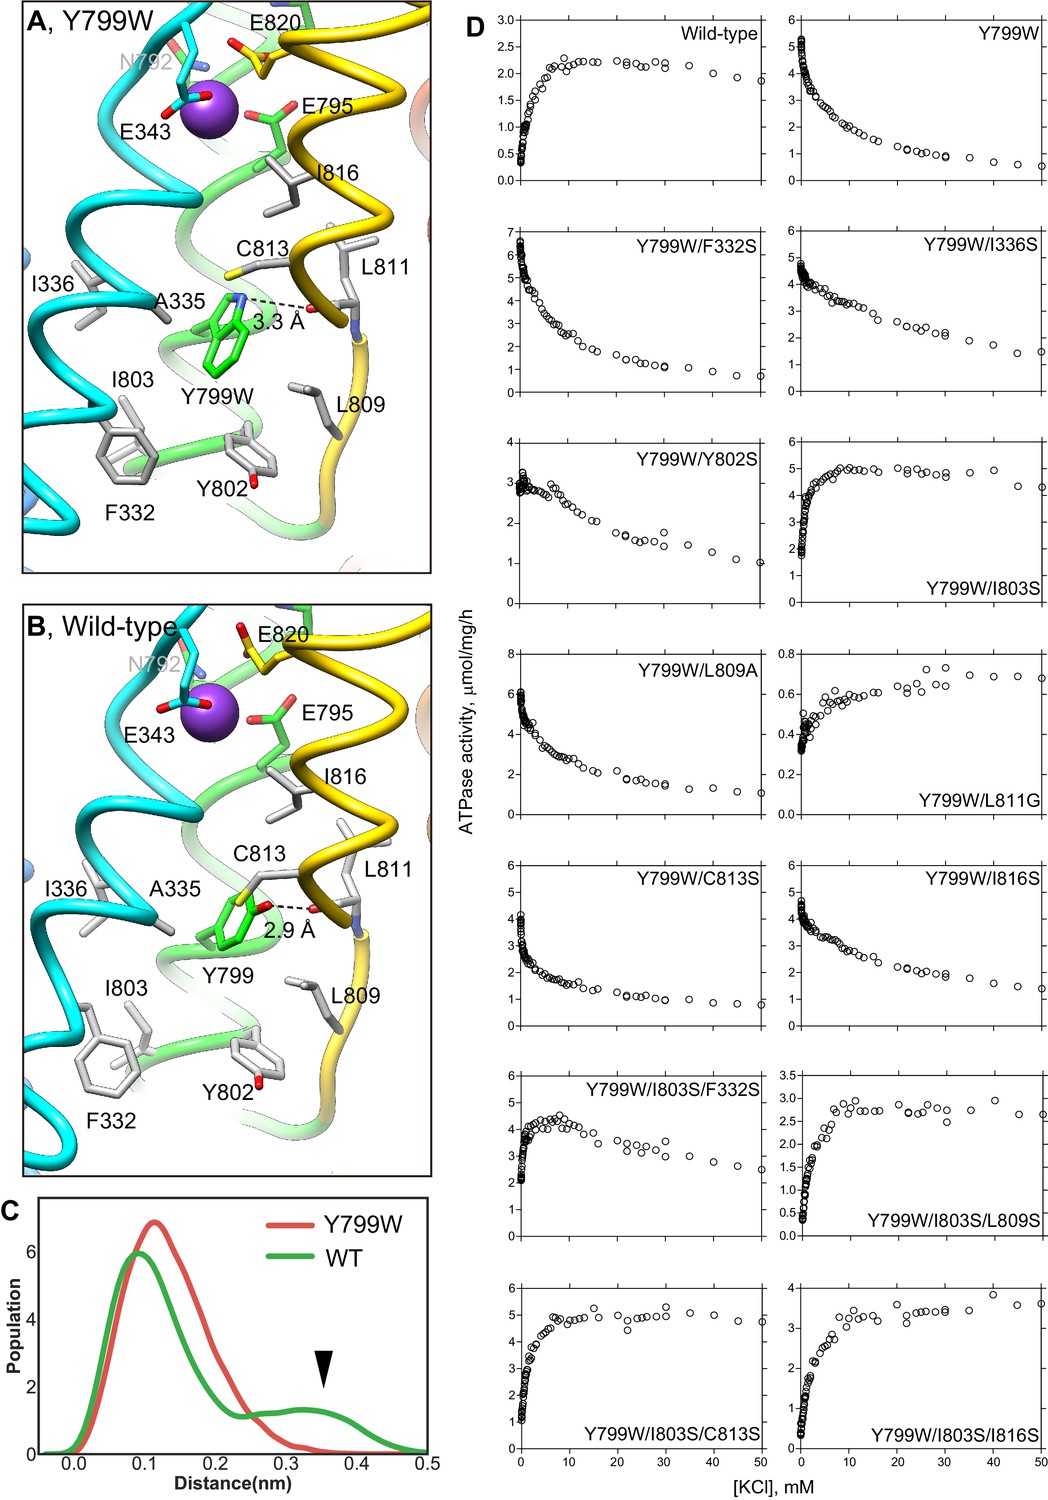
K+-dependence on ATPase activities of Y799W and mutation of the surrounding hydrophobic amino acids.
Hydrophobic interactions observed in the luminal gate of Y799W (A) and WT (B) H+,K+-ATPases. Hydrophobic residues that are likely to contribute to the luminal gate stability are shown as gray sticks. (C) Distribution of the root-mean square deviations (RMSD) for NH group of the Trp residue in Y799W (red line, mean RMSD is 1.23 ± 0.04) and the OH group of the Tyr799 residue in the WT H+,K+-ATPase (green line, 1.59 ± 0.27). The arrowhead points to a population of large RMSD, indicating higher fluctuations of the OH group in the WT enzyme compared to those of the NH group in the Tyr799Trp mutant (see also Video 1). (D) K+-dependence of the vonoprazan-sensitive ATPase activities of the indicated mutants. Data plotted had background values in the presence of 10 μM vonoprazan subtracted. Individual data from a 96-well plate at different concentrations of K+ were plotted, and representative results from more than three independent measurements for each mutant are shown in the figure.
Figure 4—figure supplement 1
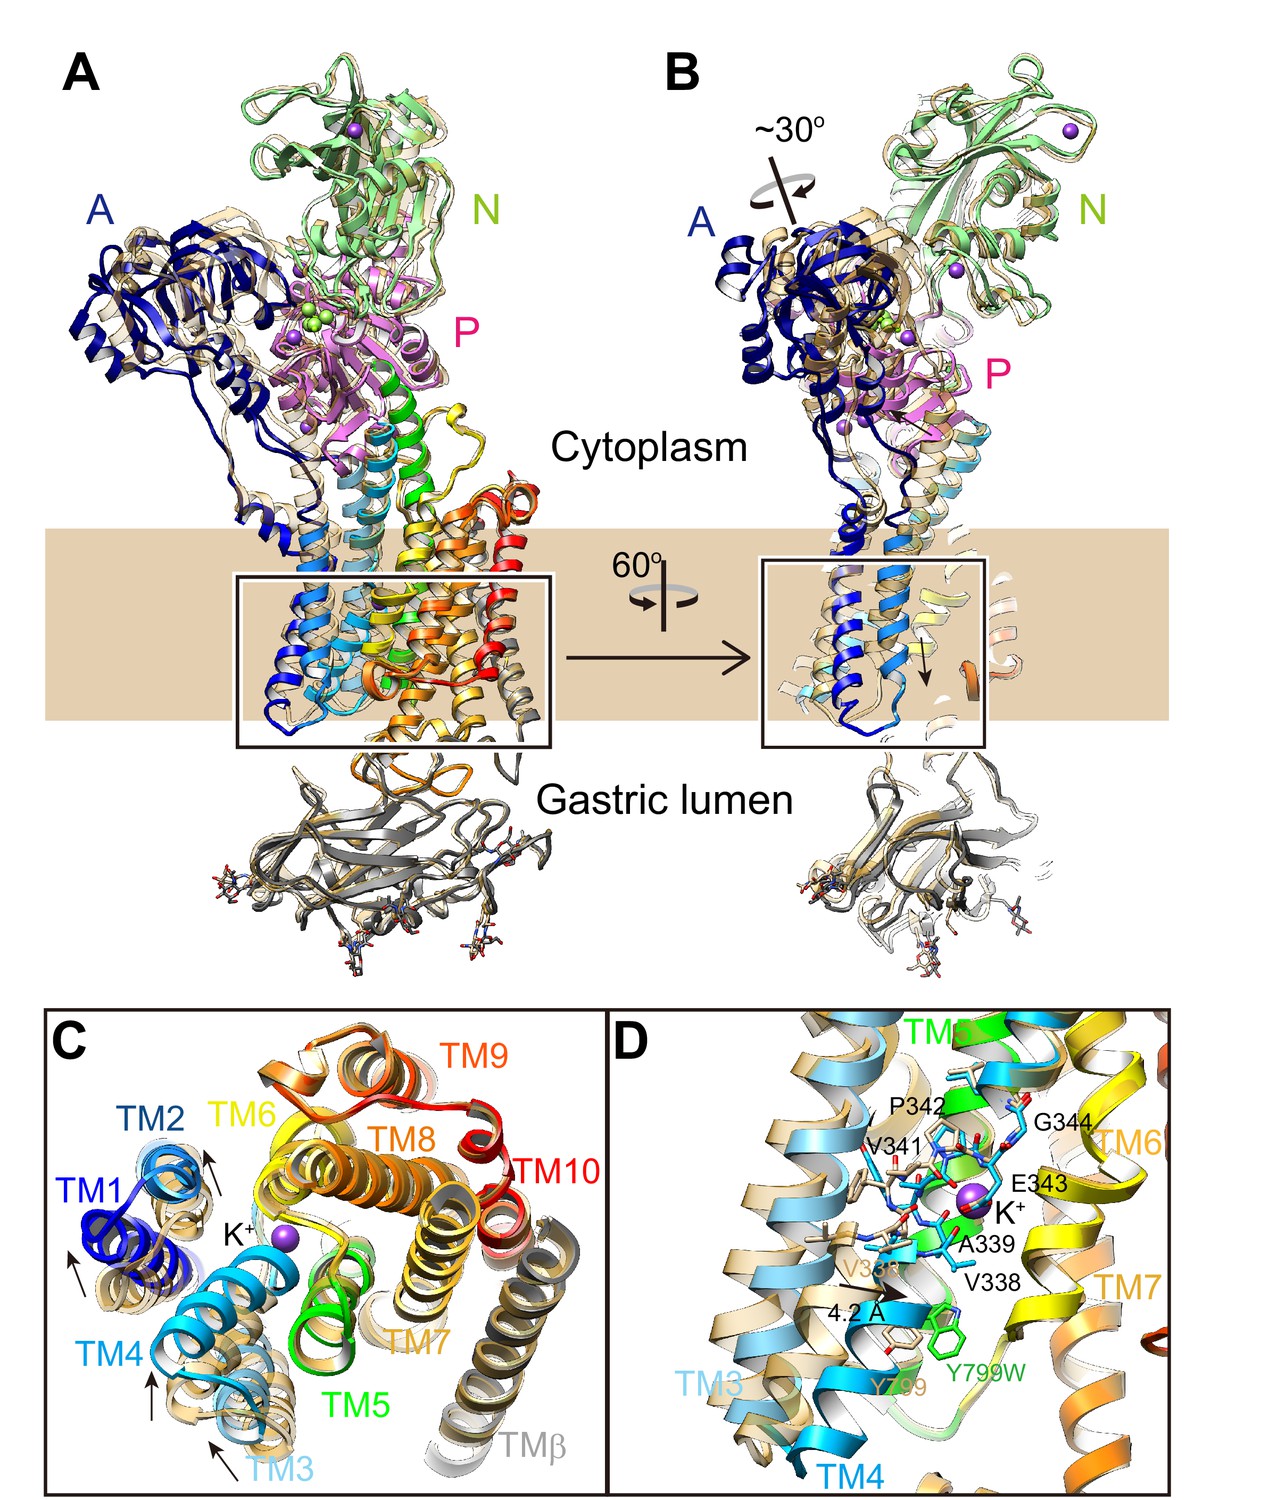
Conformational change upon K+-occlusion.
Luminal-open E2P state [pdb code: 5YLU, (von)E2BeF3–, wheat ribbons] is superimposed on the Y799W(K+)E2-MgFx structure (color codes as in Figure 1), showing the conformational change in the whole complex (A, B). (C) Rearrangement of TM helices upon K+-binding. TM helices indicated in the box in (A) were viewed from the luminal side of the membrane. (D) Displacement of TM4 upon luminal gate closure. The figure shows an enlargement of the indicated a box in (B) viewed from a position parallel to the normal membrane. The unwound region of TM4 is shown in stick representation. TM1 and TM2 are omitted for clarity. Arrows indicate the displacement from the luminal-open E2P to the luminal-closed (K+)E2-P states.
Figure 5
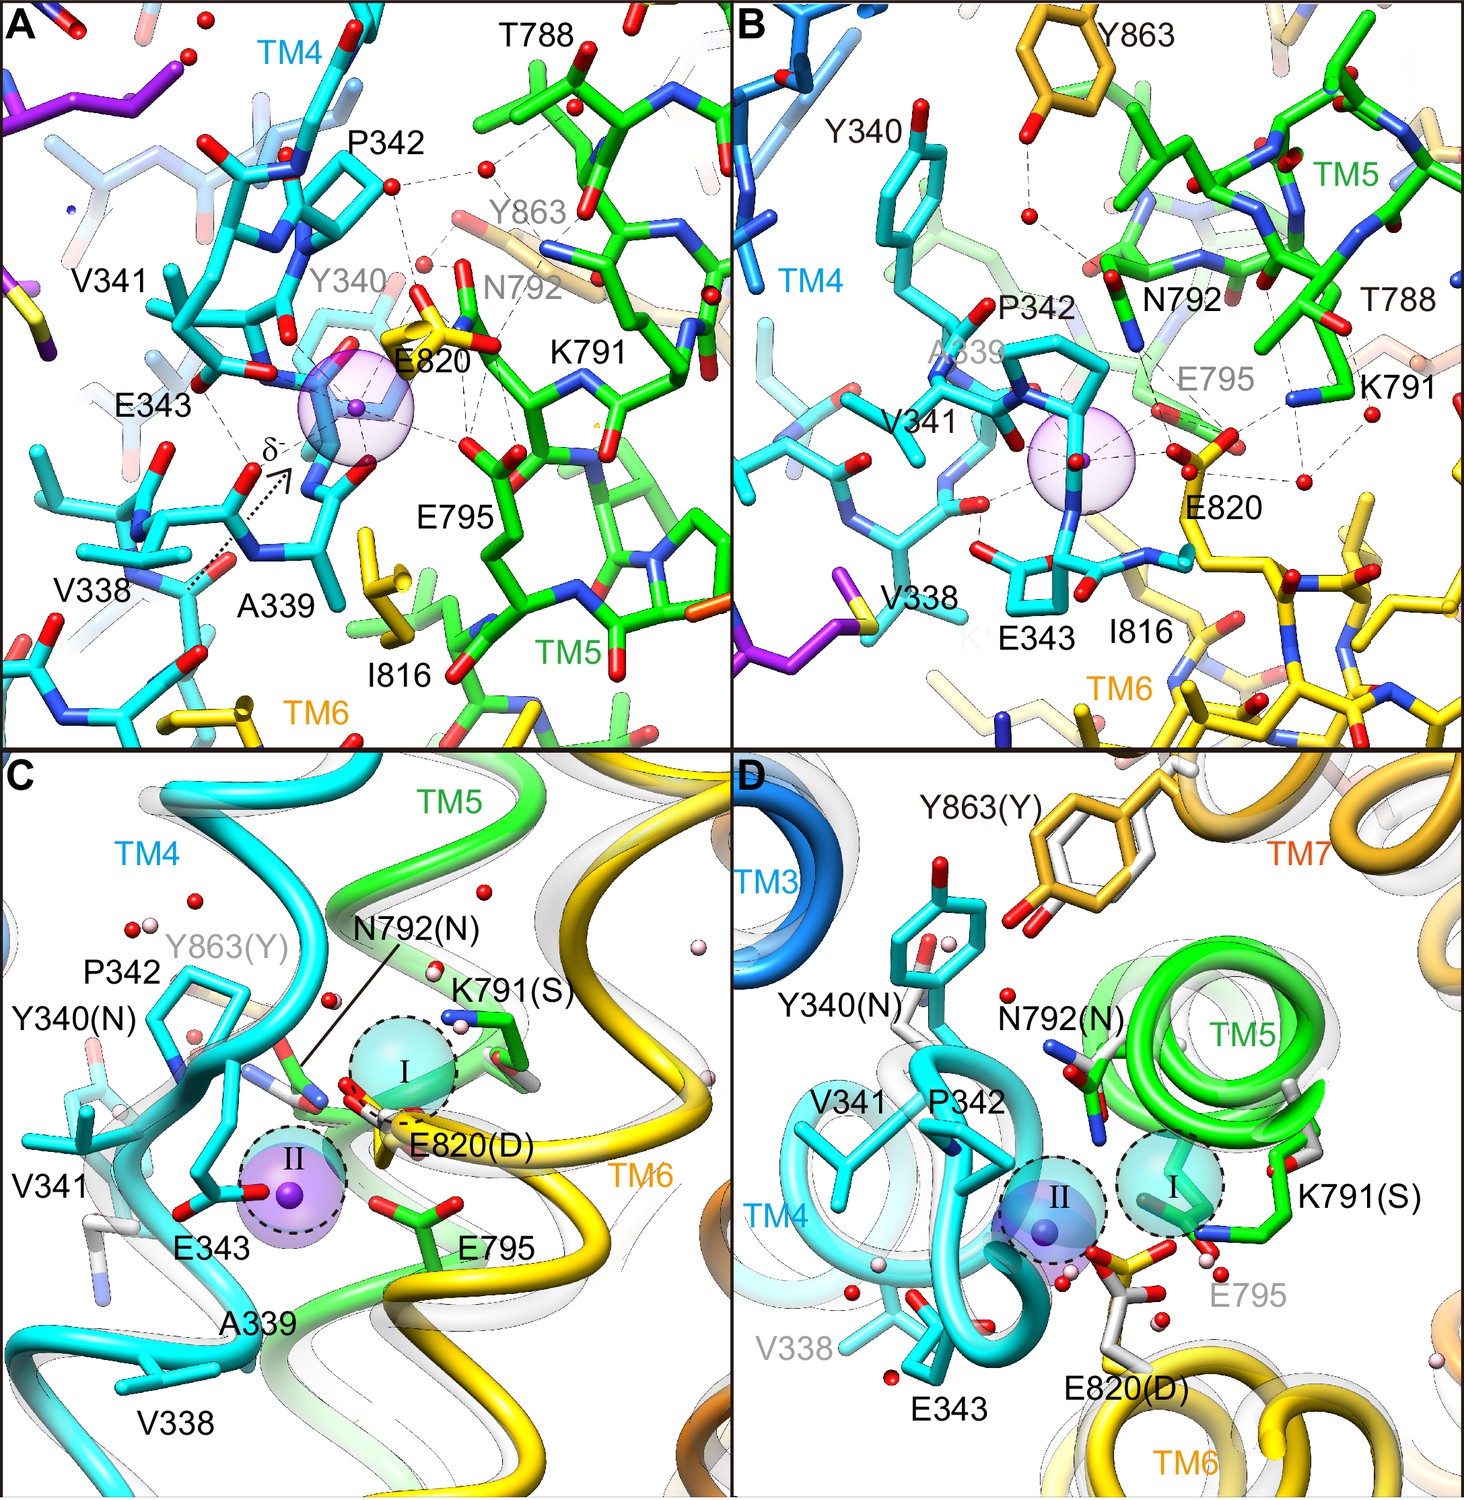
K+-binding site.
(A, B) Close-ups of the transmembrane cation-binding site in the H+,K+-ATPase Y799W(K+)E2-MgFx state in stick representation, viewed approximately parallel to the membrane from the TM6 side (A) or approximately perpendicular to the membrane from the cytoplasmic side (B). Dotted lines indicate atoms that are within 3.5 Å of neighboring atoms, presumably forming hydrogen bonds or electrostatic interactions. The purple dot indicates bound K+ with its Stokes radius shown as a transparent sphere. Water molecules (red dots) are also indicated. (C, D) The (2K+)E2-MgFx state of Na+,K+-ATPase (Shinoda et al., 2009) (gray ribbons) is superimposed on the corresponding reaction state of H+,K+-ATPase Y799W(K+)E2-MgFx (colored ribbons), viewed from the membrane (C) or cytoplasmic (D) sides. For clarity, amino acid residues that contribute to the K+ coordination in H+,K+-ATPase are indicated, with their corresponding amino acids in Na+,K+-ATPase in parentheses. Residues Asn331, Ser782, Asn783, Asp811 and Tyr854 in Na+,K+-ATPase (with corresponding amino acid numbers of Tyr340, Lys791, Asn792, Glu820 and Tyr863, respectively, in H+,K+-ATPase) are shown because three of these amino acids are not conserved. The rest of these amino acids are conserved but Asn 792 in H+,K+-ATPase shows different conformation in the structure. Blue spheres with dotted circles indicate positions of K+ binding sites I and II, and pink dots are water molecules in the Na+,K+-ATPase structure.
Figure 6
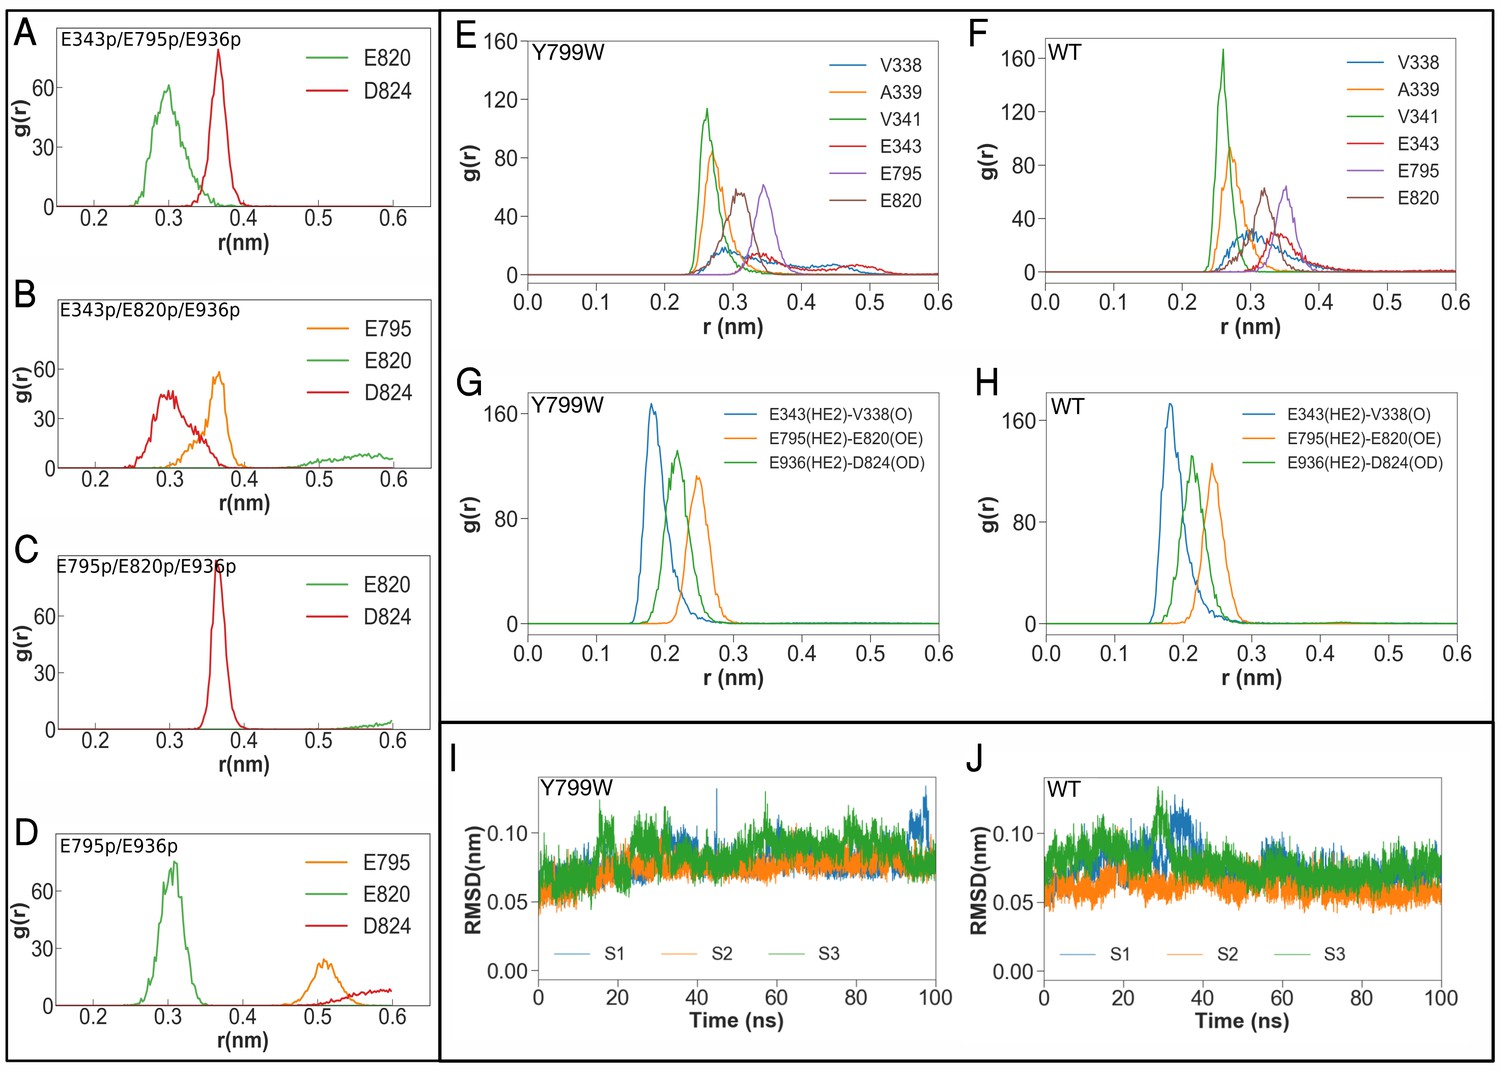
Molecular dynamics simulations of the K+-binding site of wild-type H+,K+-ATPase (WT) and the Tyr799Trp (Y799W) mutant.
(A, B, C and D) Salt-bridge formation with K791: the radial distribution function (RDF) is a normalized histogram of distances between the ε-amino group of Lys791 and the center of mass of the indicated side chain carboxylate oxygen atoms of acidic residues (r(nm), as determined during the MD simulations with the indicated protonation combinations for the Y799W mutant. The protonated residues are marked ‘p’. For example E795 and E936 are protonated in the simulation E795p/E936p, while the other three residues are deprotonated. Protonation status for D824, E936 and D942 remains the same (D824-/E936p/D942–) for these four simulations, and is not indicated in the figure. (E, F) RDFs between the K+ ion and the oxygen atoms coordinating the ion for Y799W and WT. For acidic residues, the RDF is calculated between the K+ ion and the center of mass of the two side chain carboxyl oxygen atoms. For the non-acidic residues, the carbonyl oxygen atom is used. (G, H) RDFs calculated between protonated side chains protons of Glu343 (E343p), Glu795 (E795p), Glu936 (E936p) with their hydrogen bonding acceptors on Val338 (V338), Asp820 (E820) and Asp824 (D824), respectively. All RDFs were calculated from a concatenated trajectory containing the last 50 ns of the three simulation copies of each system. (I, J) The RMSD of the amino acids in the binding site in three independent simulations with different initial velocity distributions.
Figure 7
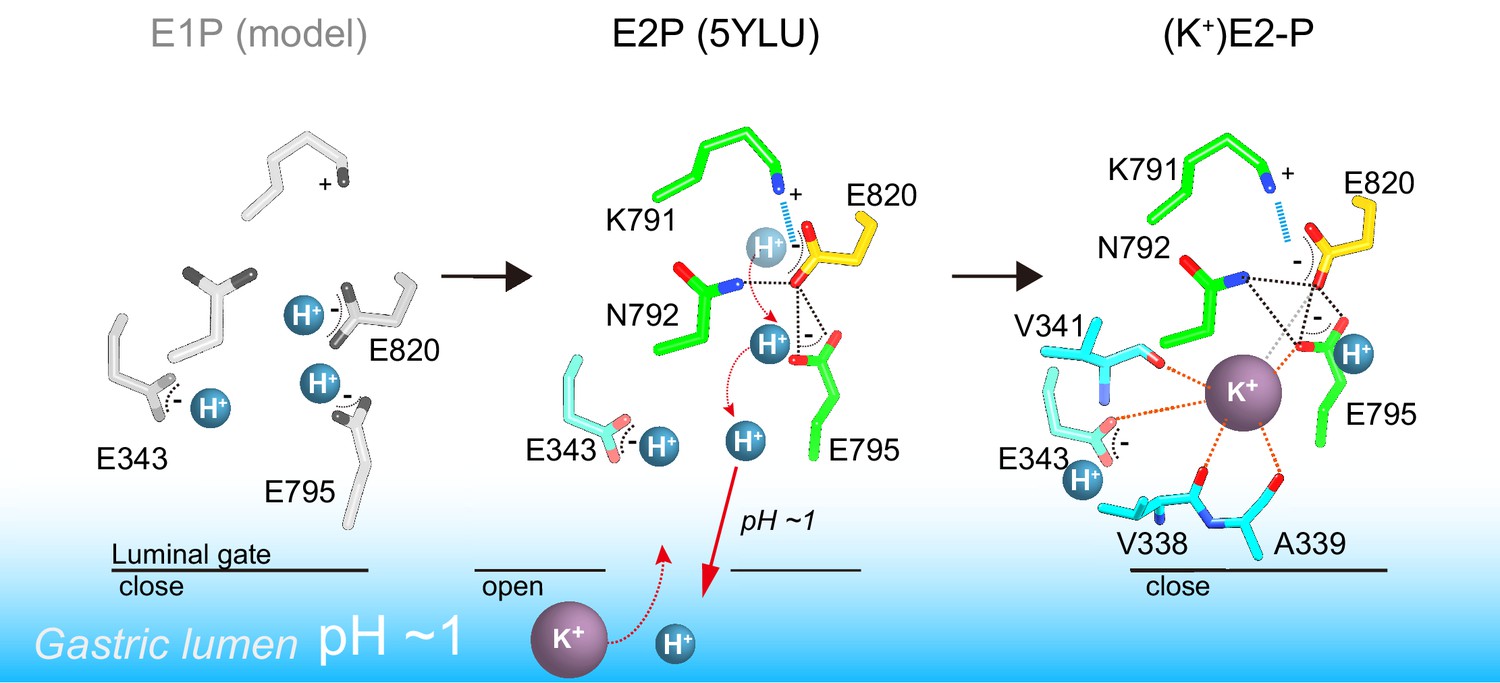
A model of one H+ and one K+ transport by H+,K+-ATPase.
In the H+-occluded E1P state (left), all of the acidic residues are expected to be protonated. After a single H+ is extruded to the gastric luminal solution in the luminal-open E2P state (center), a single K+ is occluded in the following luminal-closed (K+)E2-P transition state (right). Dotted lines indicate hydrogen bonds (black), a salt bridge (blue), and K+-coordination by oxygen atoms (orange, ≤3 Å; gray >3 Å).
Figure 8 with 1 supplement

Comparison of the cation-binding site between H+,K+-ATPase and Na+,K+-ATPase.
Cation-binding sites of H+,K+-ATPase Y799W(K+)E2-MgFx (A) and Na+,K+-ATPase (2K+)E2-MgFx (B) are shown. Two K+ ions that are occluded in Na+,K+-ATPase (I, II) were superimposed on the H+,K+-ATPase structure (C), showing significant steric clash between K+ at site I, and Lys791 and Glu820. Only side chains that are important for K+ coordination are displayed as space-fill models. Water molecules in H+,K+-ATPase and Na+,K+-ATPase are shown as red and pink dots, respectively. Figures are viewed from approximately perpendicular to the membrane from the cytoplasmic side. Color codes as in Figure 3.
Figure 8—figure supplement 1
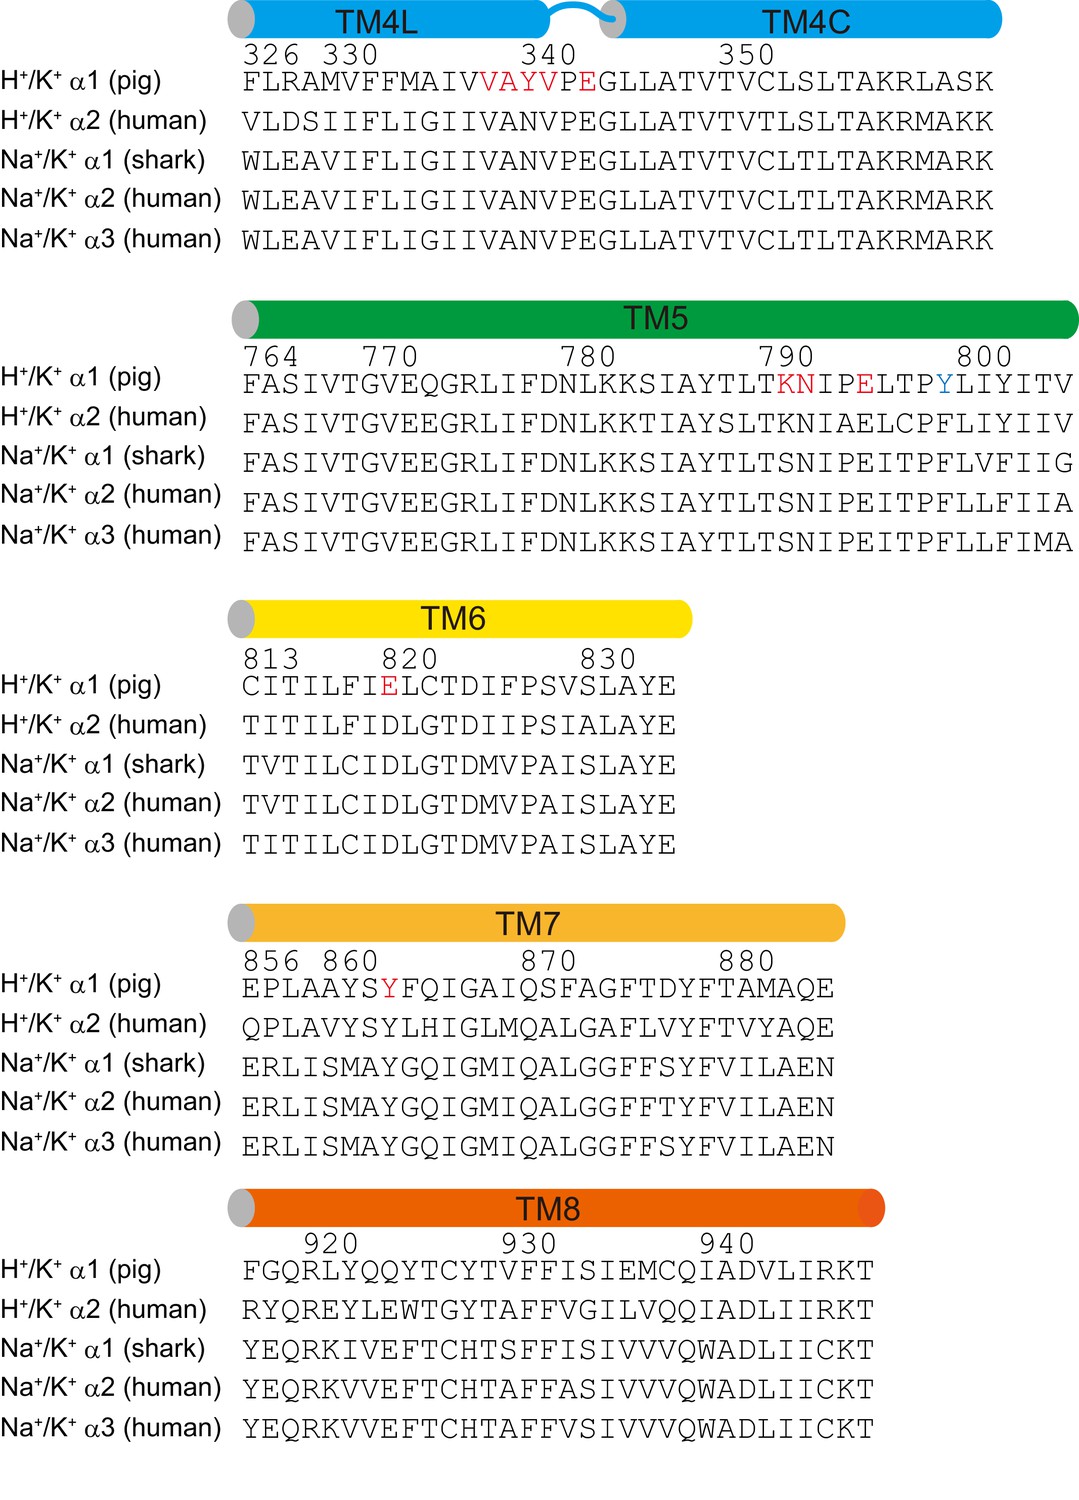
Sequence alignment of TM helices of H+,K+--ATPases and Na+,K+-ATPases.
Sequence alignment of the indicated transmembrane helices among related P2C-type ATPases. The amino acids explicitly discussed in the manuscript are highlighted in red. Tyr799, which is changed to Trp in the high-resolution crystal structure of H+,K+-ATPase is indicated in blue.
Videos
Video 1
MD simulation of the Tyr799Trp mutant and wild-type enzymes.
A movie shows the luminal gate and K+-binding site structure of 100 ns MD simulations for Tyr799Trp mutant (left) and the wild-type enzyme.
Video 2
K+-binding site.
Detailed structure of the K+-binding site in the Y799W(K+)E2-MgFx state, viewed as in Figure 5A.
Tables
Table 1
Data collection and refinement statistics.
https://doi.org/10.7554/eLife.47701.007| Y799W(K+)E2-MgFx | Y799W(Rb+)E2-MgFx | Y799W(Rb+)E2-AlFx | WT(Rb+)E2-MgFx | |
|---|---|---|---|---|
| Data collection | ||||
| Resolution (Å)† | 2.7 × 2.8 × 2.5 (2.6–2.5)‡ | 2.8 × 2.8 × 2.6 (2.7–2.6) | 2.8 × 3.0 × 2.5 (2.6–2.5) | 5.1 × 5.1 × 4.3 (4.5–4.3) |
| Space group | P 31 2 1 | P 31 2 1 | P 31 2 1 | C 1 2 1 |
| Cell dimensions | ||||
| a, b, c (Å) | 103.37, 103.37, 370.01 | 103.38, 103.38, 369.86 | 103.23, 103.23, 369.44 | 191.51, 106.43, 250.96 |
| α, β, γ (°) | 90, 90, 120 | 90, 90, 120 | 90, 90, 120 | 90, 107.79, 90 |
| Rmerge | 0.067 (3.685) | 0.080 (2.248) | 0.106 (3.499) | 0.152 (1.359) |
| Rpim | 0.022 (1.179) | 0.030 (0.855) | 0.040 (1.295) | 0.065 (0.544) |
| I/σI | 20.18 (0.93) | 16.19 (1.16) | 11.64 (0.77) | 7.19 (0.92) |
| C/C1/2 | 0.99 (0.59) | 0.99 (0.70) | 0.99 (0.60) | 0.99 (0.75) |
| Completeness (%) | 85.65 (26.79) | 88.93 (36.11) | 76.00 (18.98) | 94.94 (53.46) |
| Redundancy | 10.2 (10.6) | 8.0 (7.8) | 8.0 (8.2) | 6.6 (7.2) |
| Refinement | ||||
| Resolution (Å) | 48–2.5 (2.6–2.5) | 48–2.6 (2.7–2.6) | 50–2.5 (2.6–2.5) | 48–4.3 (4.5–4.3) |
| No. of reflections | 69,037 (2135) | 63,831 (2533) | 61,013 (1502) | 31,390 (1747) |
| Rwork/Rfree (%) | 20.1/25.7 (37.3/48.0) | 20.6/26.2 (35.1/43.5) | 21.5/27.4 (32.7/42.6) | 26.3/33.9 (33.4/41.2) |
| Wilson B-factor | 60.74 | 52.60 | 48.43 | 158.52 |
| No. of atoms | 10,513 | 10,485 | 10,498 | 19,823 |
| Protein | 9736 | 9762 | 9763 | 19,623 |
| Ligands | 362 | 362 | 364 | 200 |
| Average B-factor | 74.40 | 62.68 | 60.03 | 244.07 |
| Protein (Å2) | 72.62 | 60.98 | 57.83 | 243.40 |
| Ligands (Å2) | 122.80 | 114.14 | 103.16 | 310.29 |
| R.m.s deviations | ||||
| Bond lengths (Å) | 0.010 | 0.009 | 0.010 | 0.005 |
| Bond angles (°) | 1.36 | 1.51 | 1.39 | 1.18 |
-
†The diffraction data are anisotropic. The resolution limits given are for the a*, b* and c* axes, respectively.
‡Statistics for the highest-resolution shell are shown in parentheses.
Table 2
Coordination geometry and partial valence in the K+-binding site of H+,K+-ATPase in (K+)E2-P analogue states.
Only oxygen atoms within 4Å of K+ are included for the valence calculation. Partial valence is calculated for K+ and Rb+ in each corresponding crystal structure.
| Structure | Rb+·(SCH)E2BeFx | Y799W(K+)E2-MgFx | Y799W(Rb+)E2-MgFx | Y799W(Rb+)E2-AlFx | ||||
|---|---|---|---|---|---|---|---|---|
| Amino acids | Distance (Å) | Valence | Distance (Å) | Valence | Distance (Å) | Valence | Distance (Å) | Valence |
| V338 O | 4.57 | – | 2.90 | 0.11 | 3.00 | 0.12 | 3.09 | 0.1 |
| A339 O | 3.23 | 0.07 | 2.62 | 0.28 | 2.68 | 0.27 | 2.63 | 0.31 |
| V341 O | 2.89 | 0.16 | 2.56 | 0.34 | 2.56 | 0.37 | 2.63 | 0.31 |
| E343 Oε1 | 3.41 | 0.05 | 2.93 | 0.10 | 2.96 | 0.13 | 3.07 | 0.10 |
| E343 Oε2 | 3.42 | 0.05 | 3.74 | 0.01 | 3.63 | 0.03 | 3.72 | 0.03 |
| E795 Oε1 | 4.05 | – | 2.77 | 0.17 | 2.99 | 0.12 | 2.88 | 0.16 |
| E820 Oε1 | 3.56 | 0.04 | 3.32 | 0.03 | 3.21 | 0.08 | 3.38 | 0.05 |
| E820 Oε2 | 3.68 | 0.03 | 3.90 | 0.01 | 3.98 | 0.02 | 3.95 | 0.02 |
| Total valence | 0.39 | 1.05 | 1.14 | 1.07 | ||||
Table 3
Mean valences calculated in the K+-binding site of H+,K+-ATPase, assuming protonation for the acidic residues as evaluated by MD simulations.
https://doi.org/10.7554/eLife.47701.015| Tyr799Trp | WT | ||||||||
|---|---|---|---|---|---|---|---|---|---|
| 2-proton states | 3-proton states | 4-proton states | |||||||
| E343 | H+ | – | – | H+ | H+ | – | H+ | H+ | H+ |
| E795 | – | H+ | – | H+ | – | H+ | H+ | – | H+ |
| E820 | – | – | H+ | – | H+ | H+ | – | H+ | – |
| D824 | – | – | – | – | – | – | H+ | H+ | – |
| E936 | H+ | H+ | H+ | H+ | H+ | H+ | H+ | – | H+ |
| D942 | – | – | – | – | – | – | – | H+ | – |
| Valence† (Mean ± SEM) | |||||||||
| V338 O | 0.077 ± 0.001 | 0.239 ± 0.004 | 0.282 ± 0.002 | 0.042 ± 0.002 | 0.116 ± 0.004 | 0.268 ± 0.001 | 0.111 ± 0.003 | 0.217 ± 0.001 | 0.074 ± 0.003 |
| A339 O | 0.132 ± 0.001 | 0.098 ± 0.002 | 0.005 ± 0.000 | 0.171 ± 0.004 | 0.235 ± 0.002 | 0.128 ± 0.001 | 0.203 ± 0.003 | 0.248 ± 0.001 | 0.190 ± 0.003 |
| V341 O | 0.242 ± 0.001 | 0.278 ± 0.005 | 0.224 ± 0.001 | 0.239 ± 0.003 | 0.269 ± 0.001 | 0.283 ± 0.002 | 0.295 ± 0.003 | 0.29 ± 0.001 | 0.283 ± 0.003 |
| E343 Oε1 | 0.21 ± 0.001 | 0.169 ± 0.004 | 0.257 ± 0.002 | 0.046 ± 0.002 | – | 0.26 ± 0.002 | 0.068 ± 0.003 | – | 0.091 ± 0.001 |
| E343 Oε2 | 0.005 ± 0.000 | 0.152 ± 0.003 | 0.284 ± 0.002 | 0.002 ± 0.000 | – | 0.206 ± 0.002 | 0.002 ± 0.000 | – | 0.003 ± 0.001 |
| E795 Oε1 | 0.278 ± 0.003 | 0.121 ± 0.002 | 0.291 ± 0.002 | 0.267 ± 0.003 | 0.315 ± 0.002 | 0.107 ± 0.001 | 0.277 ± 0.003 | 0.239 ± 0.003 | 0.236 ± 0.003 |
| E795 Oε2 | 0.134 ± 0.003 | –‡ | 0.272 ± 0.002 | – | 0.053 ± 0.002 | 0.001 ± 0.000 | – | 0.239 ± 0.003 | 0.002 ± 0.000 |
| E820 Oε1 | 0.200 ± 0.002 | 0.017 ± 0.001 | 0.001 ± 0.000 | 0.015 ± 0.000 | 0.061 ± 0.001 | 0.001 ± 0.000 | 0.138 ± 0.005 | 0.155 ± 0.001 | 0.018 ± 0.000 |
| E820 Oε2 | 0.109 ± 0.002 | 0.195 ± 0.004 | 0.010 ± 0.000 | 0.291 ± 0.006 | 0.089 ± 0.001 | 0.028 ± 0.000 | 0.118 ± 0.005 | 0.066 ± 0.001 | 0.273 ± 0.003 |
| total | 1.387 | 1.269 | 1.626 | 1.073¶ | 1.138 | 1.282 | 1.212 | 1.454 | 1.171 |
-
†Ideal value for K+ is 1.00. ‡Only oxygen atoms within 4Å of bound K+ were included for the valence calculation. ¶The most likely protonation state of E343p/E795p/E936p shows a total valence closest to the ideal value amongst all simulations evaluated.
Additional files
-
Transparent reporting form
- https://doi.org/10.7554/eLife.47701.019
Download links
A two-part list of links to download the article, or parts of the article, in various formats.
Downloads (link to download the article as PDF)
Open citations (links to open the citations from this article in various online reference manager services)
Cite this article (links to download the citations from this article in formats compatible with various reference manager tools)
A single K+-binding site in the crystal structure of the gastric proton pump
eLife 8:e47701.
https://doi.org/10.7554/eLife.47701


